


1. Introduction
Mark Zuckerberg had plenty to worry about before his blockbuster appearance at the US Senate in April 2018. His company was again the target of intense public backlash after explosive details about Cambridge Analytica's access to user data came to light. More than other controversies before it, this particular scandal brought together all of the public's concerns about internet platforms that had been developing over the previous several years: privacy, manipulation by algorithms, internet companies’ scale, subliminal persuasion, and now an added layer of dirty political tricks. Congress had targeted Facebook's CEO with the threat of potential regulation at its disposal and the public's outrage at its back. In the many hours Zuckerberg reportedly spent preparing for his two days of testimony, he likely received coaching on how to explain the logic of advertising auctions and the company's efforts to maintain the “integrity” of its products in the face of disinformation, among other delicate and complex issues not well understood by the public.
Yet for all his diligent preparation, Zuckerberg found himself focusing on the basics. Some of his questioners appeared to confuse rudimentary concepts, such as email and the WhatsApp messaging service. Others invoked conspiracy theories about Facebook secretly listening to its users. In one of his most-discussed answers, Zuckerberg was compelled to explain Facebook's business model to Sen. Orrin Hatch: “Senator, we run ads.”Footnote 1 Two notable features of these exchanges quickly gained traction on Twitter (a platform with very different features than Facebook, Zuckerberg reassured Sen. Lindsey Graham): They reflected low fluency with basic technological concepts central to politics, and much of the confusion was emanating from the chairs and ranking members of the Senate committees, whose median age was reportedly nearly 80.Footnote 2 It would be difficult to conjure a more vivid demonstration of generational gaps in technological savvy and their impact on public policy.
Ironically, research by Facebook itself had already begun turning up findings suggesting that age-based differences in online engagement were relevant for political outcomes. A prominent digital voting experiment, conducted in concert with the platform in 2010, uncovered striking evidence of heterogeneity in the effect of sharing “I Voted” stickers to one's friends (Bond et al., Reference Bond, Fariss, Jones, Kramer, Marlow, Settle and Fowler2012, Reference Bond, Settle, Fariss, Jones and Fowler2017): “The [Facebook GOTV experiment] effect size for those 50 years of age and older versus that of those ages 18 to 24 is nearly 4 times as large for self-reported voting and nearly 8 times as large for information seeking.” Turning to a very different form of networked online political activity, the 2016 US presidential election triggered intense scholarly interest in online misinformation. Using distinct data sets and statistical models, several research teams separately reached two main conclusions. First, the overall consumption of low-quality, untrustworthy, or “fake” news was small. Second, the consumption and sharing of this fake news was very unequally distributed—and much higher among older internet users (Barberá, Reference Barberá2018; Guess et al., Reference Guess, Nagler and Tucker2019; Grinberg et al., Reference Grinberg, Joseph, Friedland, Swire-Thompson and Lazer2019; Osmundsen et al., Reference Osmundsen, Bor, Vahlstrup, Bechmann and Petersen2020).
The magnitude and consistency of age-based heterogeneities in online political behavior implies some qualitative differences in how people experience digital media. This is suggested by descriptive evidence on both older and younger adults’ internet habits. For instance, a review of older adults’ internet use patterns finds differences in overall internet skill as well as the kinds of activities they partake in online when compared to other age groups (Hunsaker and Hargittai, Reference Hunsaker and Hargittai2018). Much more research has focused on younger adults, however. For example, panel surveys have shown significant age-based differences in social media use for political news, with significantly stronger associations with political participation among younger citizens (Holt et al., Reference Holt, Shehata, Strömbäck and Ljungberg2013). Of course, age itself is not likely the driver of these differences. Rather, we posit that age serves as a proxy for some other characteristic that covaries with generational cohort and that plausibly relates to people's experiences with digital media. Literature in sociology and communication has documented the advantages of being a “digital native” as well as the pathologies of the “second digital divide” (Hargittai, Reference Hargittai2001, Reference Hargittai2010).
Motivated by these concerns, we explore the construct of digital literacy and argue for its importance to political science. First, we sift through a diffuse multi-disciplinary literature and propose a conceptualization of digital literacy as online information discernment combined with the basic digital skills necessary to attain it. Given the concept's multifaceted nature, we focus primarily on this “skills” dimension, which captures the kind of basic technological fluency commonly associated with effective use of online tools for political purposes. We then make two key methodological contributions for scholars interested in incorporating the concept into their research. First, adapting and expanding on scholarship in other disciplines, we assess prominent survey batteries proposed to measure skills. Second, we draw attention to a subtle but consequential form of selection bias that has implications for researchers’ sampling decisions. We illustrate the importance of these factors in explaining a behavior likely to be related to digital skills: online information retrieval.
We argue that the choice of subject pool for surveys is critically important for questions related to digital literacy; specifically, fielding studies on Mechanical Turk (MTurk) is likely to drastically undersample low-skill respondents, which could skew inferences in unexpected ways. Returning to one of the motivations for our investigation, we document with a large national sample that skills do indeed covary with age, with older Americans having lower levels on average. This hints at the possibility that unmeasured variation in digital literacy has driven prior findings on the apparent relationship between age and online behaviors such as sharing low-quality (or “fake”) content on social media. Finally, we illustrate these issues with an analysis of online information retrieval accuracy. We conclude with a discussion of how the concept of digital literacy can usefully contribute to several other literatures likely impacted by recent shifts in the online information environment.
2. Digital literacy and media modality: a brief history
The rapid adoption of the internet and social media in the United States has changed the media landscape. But by most ways of counting, the spread of first radio and then television through society happened more rapidly, and each had a larger impact on the daily media diets of the average consumer (Prior, Reference Prior2007). This was only possible because radio and television are easy to consume: everyone is trained to listen to human speech from birth, or to listen to speech paired with a visual stimulus. Other than language barriers or the rare niche program, anyone could turn on their radio set or television and share an experience with anyone else listening.Footnote 3
The internet is different in every respect. It took many years to develop and has been constantly mutating. During its formative years, the only consumers tended to also be producers. Only people with specialized skills could even access online media, which was at first only written text. This early online media was thus produced and consumed by a small number of professionals in academia and tech companies, gradually expanding to geeky hobbyists with enough free time and disposable income to purchase and use the necessary, complicated hardware (Abbate, Reference Abbate2000; Burke et al., Reference Burke, Briggs, Burke and Burke2005).
For the past 50 years, television has been the dominant modality for political media. The total supply of television content is constrained by the cost of production and distribution, and televisual content requires minimal skill to appreciate. So, with a small number of notable exceptions,Footnote 4 the dominant theories of media effects were focused on homogeneity.
The internet inverts this. Central tendencies are simply not that informative. Individuals’ experiences are so distinct that heterogeneity should arguably be the baseline expectation.
The technological affordances of online media allow for a much greater variety of content, expanding the scope of “politics” beyond the evening news or cable talk show. Furthermore, this variety has increased over time, as increasingly different types of people and organizations produce that content. But this is only one source of increased heterogeneity of media effects due to the expanded diversity of the audience for online media. Unlike a radio or television broadcast, where the range of the experiences among adults exposed to a given piece of content is limited, the range of the experiences among adults exposed to online media is extremely wide, at least for the internet audience of the late 2010s.
These experiences are created at the intersection of a media consumer and a piece of online media. The classic model of political sophistication in Luskin (Reference Luskin1990) conceives of the acquisition of political information as a process with three inputs: access to that information, the motivation to acquire it, and the ability to process it. Access has clearly increased with the web, and Sood and Lelkes (Reference Sood and Lelkes2018) claim that rising education levels suggest increased ability, at least in the aggregate. The key complication, we argue, is that the difficulty of acquiring (true) political information on social media is much higher than in other modalities—and that ability is currently highly heterogeneous.
Our aim is in part to translate a large literature on this internet ability from other disciplines into the realm of political science. This literature begins with Hargittai (Reference Hargittai2001), who describes the “Second-Level Digital Divide.” To that point, concern about the “Digital Divide” was over differential access to the internet. Hargittai's method was participant observation: she sat behind people and watched them use the internet to search for information.
This simple act was revelatory—and is a tool that could still be fruitfully used by researchers to study novel internet technologies. People used the internet very differently. They varied considerably in their capacity to find factual information, and in their speed in doing so. Hargittai conceptualized this as “online skills”—a concept that refers explicitly to the actual, validated ability “to efficiently and effectively find information on the Web,” or, put another way, to be digitally literate.
3. Digital literacy: theoretical building blocks
The term digital literacy (or digital media literacy) is frequently invoked but rarely defined consistently.Footnote 5 Possibly for that reason, its boundary is porous: discussions of digital literacy tend to overlap with related concepts such as the aforementioned internet skill (Hargittai, Reference Hargittai2005), media literacy (Vraga and Tully, Reference Vraga and Tully2015; Vraga et al., Reference Vraga, Tully, Kotcher, Smithson and Broeckelman-Post2015), and digital inequality. Unsurprisingly, then, research on the topic is dispersed across multiple disciplines ranging from sociology and communication (e.g., Koltay, Reference Koltay2011) to library and information sciences (e.g., Eshet, Reference Eshet2004). Building on existing work, a contribution of this paper is to theoretically situate the concept of digital literacy and to embrace its multidimensional character in a way that translates to straightforward measures suitable for use in political science.
We begin by postulating that being digitally literate means being able to reliably assess the credibility of information encountered online (e.g., Flanagin and Metzger, Reference Flanagin and Metzger2007). This in turn depends on the ability to verify claims and look up answers to questions using a variety of strategies.Footnote 6 While this may seem similar to traditional notions of information fluency (Sharkey, Reference Sharkey2013), it is situated within people's digital environments and the social context they experience online. In other words, we do not conceive of digital literacy as something specifically related to formal information sources (news organizations) or topics of continued interest to scholars (politics, health). A key feature of multifaceted environments is the constant need to assess the credibility of claims and requests, both formal and informal—not only while perusing social feeds and news headlines, but also in everyday encounters like phishing attempts and spam in one's email inbox. Whether routine or connected to specific informational needs, all of these tasks require judging what's on the screen in front of them: separating the trustworthy (genuine email communication, professional-quality news, credible claims by friends and acquaintances) from everything else.
Becoming proficient at these judgments requires experience as well as the fundamental skills needed to enable it. In the realm of routine tasks, recognizing a phishing attempt requires familiarity with the mechanics of email. Checking the credibility of a source might require opening a new browser tab (on a desktop or laptop computer) or switching apps (on a mobile or tablet device)—building blocks so essential that they are often bundled alongside higher-level competencies when taught in libraries and schools.
At its core, then, digital literacy consists of a skills component and an information literacy component. This is implied in some existing scholarship. In a foundational book on the topic, Gilster (Reference Gilster1997) asserts that “digital literacy is about mastering ideas, not keystrokes” (15), suggesting the primacy of a more general kind of information literacy. But in the same book, Gilster defines core competencies of digital literacy which include the ability to search the internet and navigate hypertext. Taking the link between skills and information literacy to its logical conclusion, one could argue that literacy is itself a kind of skill. Hargittai and Micheli (Reference Hargittai and Micheli2019) identify ten dimensions of “internet skills,” such as interpersonal communication and managing privacy, which collectively amount to a digital citizenship test for the 21st century. One of Hargittai and Micheli's skills dimensions is the “ability to find and evaluate information,” which corresponds most directly to notions of information literacy or discernment.
This twin conception of digital literacy—information discernment combined with the basic digital skills necessary to attain it—has two advantages. It unifies disparate strands of scholarship while establishing boundaries that separate it from related ideas such as digital savvy and news literacy. At the same time, it allows for tractable measurement: Instead of attempting to detect information literacy, we focus on the skills component as a useful proxy for the whole.
The question of how to define and measure digital literacy returns us again to political sophistication (Luskin, Reference Luskin1990), which similarly bundles several components (i.e., knowledge, interest, and abstract reasoning ability). Reviewing the many existing approaches to measuring the concept, Luskin (Reference Luskin1987) proposed a type of “recognition and understanding” measure (Converse, Reference Converse1964) that grades respondents on a series of factual questions about the ideological leanings of the parties. This measure intentionally taps the knowledge element of sophistication (“what”) rather than assessing directly people's belief systems (“how”) or the extent to which they think about politics at all (“how much”). As Luskin argues, “Empirically ... there should be a strong relationship between the ‘how much’ and ‘how’ and some factual aspects of the ‘what’” (881)—in other words, while it may be theoretically possible to have a sophisticated political belief system built on basic factual misconceptions, it is difficult to envision in practice. Likewise, someone who lacks the digital acumen to download and send a file may be well versed at searching for reliable information online, but the combination would be unusual.Footnote 7
As political sophistication came to be an important moderator in studies of retrospective voting and preference formation, we argue that digital literacy is a crucial factor in online political behavior whose role has to date been obscured by disciplinary practices designed for an earlier media-technological environment.
But how should digital literacy—in particular, the skills component we take as a tractable proxy for the whole—be measured? We argue that there is not a “one-size-fits-all” measurement strategy for digital literacy. There are, instead, digital literacies, defined with respect to the specific technological context of the user and the task they wish to complete. Reading English text has been a generally stable task for at least a century, and literacy has been similarly stable and simple to conceptualize and measure. Digital literacy, by contrast, can be understood by reference to specific subdomains, with a relevant knowledge base that is not necessarily fixed over time. We contend that the conception of digital literacy outlined here is flexible enough to encompass multiple skills and competencies (Hargittai and Micheli, Reference Hargittai and Micheli2019), and as such, the optimal survey battery may depend on the nature of the research question. For example, does the question concern people at the extremes of digital literacy? Is temporal validity a concern (Munger, Reference Munger2019)? Are researchers interested in populations that primarily use mobile devices?
4. Data and measures
Our investigation focuses on three measures capturing distinct dimensions of the construct, in addition to an information retrieval exercise that we consider both a validation exercise and a demonstration of a behavioral approach to measuring digital literacy. The analyses we present span five different samples. We introduce our measures and data sources in turn below.Footnote 8
4.1 Survey instruments
Internet skills scale
The first measure that we examine is Hargittai's 21-question “internet skills” battery asking respondents to self-report their familiarity with a series of computer- and internet-related terms, on a five-point scale (Hargittai, Reference Hargittai2009). This is an updated version of a survey instrument validated against Hargittai's original qualitative skills assessments as a more scalable proxy measure. The items are designed to reflect terms central to everyday internet use, such as “app,” “hashtag,” “wiki,” and “selfie,” alongside common but somewhat more technical jargon such as “spyware” and “phishing” that are useful for recognizing online threats. This approach makes sense as a broad conception of the skills component of digital literacy and has the additional benefit of flexibility, since the items can be adapted to include recent coinages as well as more domain-specific terms.
Power user scale
The second is the “power user” scale developed by Sundar and Marathe (Reference Sundar and Marathe2010). This scale consists of 12 questions asking respondents how they interact with technology, on a nine-point agree-disagree scale. Examples include “I make good use of most of the features available in any technological device” and “Using information technology makes it easier to do my work.” We speculate that the lack of proper nouns in this scale could improve “temporal validity” (Munger, Reference Munger2019) over alternatives. This scale is most useful for research questions with specific predictions about individuals with especially high technological competencies. Given the self-reported nature of these questions, they also offer a subjective dimension that could be useful for theories related to occupational identity or (over)confidence.
Low end scale
We designed an additional scale: the “low end” scale. This scale adapts the intuition behind the “power user” scale, which was designed to separate high-skill users from everyone else, while ours is designed to separate low-skill users from everyone else. Some research questions may be less concerned with overall variation in digital literacy than with individuals with the lowest levels of digital literacy; the scale was developed with these in mind. Examples include the literature on online misinformation consumption and sharing, and related concepts such as susceptibility to online scams (Mathur et al., Reference Mathur, Wang, Schwemmer, Hamin, Stewart and Narayanan2020).
Information retrieval tasks
We include in our survey instrument a series of three information retrieval tasks of varying degrees of difficulty. These are online information-related tasks of interest to political scientists; to our knowledge, this is the first internet-based survey implementation of these types of tasks. Internet-based surveys can be a drawback for scholars studying political knowledge because they enable the possibility that respondents will “cheat” and look up the answers online (Clifford and Jerit, Reference Clifford and Jerit2016; Smith et al., Reference Smith, Clifford and Jerit2020). We use this feature to our advantage, explicitly instructing respondents to look up the answers and intentionally asking questions which are sufficiently obscure to US-based respondents that few could be expected to know the answer.
The three information retrieval questions were:
• Who is the Prime Minister of Croatia? (Andrej Plenković; the presence of the concluding diacritical means they copy+pasted the answer)
• What is the capital city of Malawi? (Lilongwe)
• What is the only US National Park that begins with the letter “T”? (Theodore Roosevelt National Park)
4.2 Data
To ensure that our analysis was not skewed by the particularities of any given sample and to ensure face validity, we conducted the survey on five distinct samples. Our selection of samples is consistent with the principle of “fit for purpose,” which has been used in pharmaceutical sciences as a criterion guiding validation efforts (Lee et al., Reference Lee, Devanarayan, Barrett, Weiner, Allinson, Fountain, Keller, Weinryb, Green and Duan2006).Footnote 9 Put simply, this approach advocates that “the scientific rationale ... should guide the validation requirements” (Ray, Reference Ray2016). A fit-for-purpose approach in our case suggests choices for both sampling and measurement. For the former, we are interested in sampling from populations whose online behavior is of substantive interest: sharing and otherwise engaging with politics on social media is an increasingly important form of political participation (e.g., Bode, Reference Bode, Vraga, Borah and Shah2014; Bond et al., Reference Bond, Settle, Fariss, Jones and Fowler2017; Forestal, Reference Forestal2017; Settle, Reference Settle2018). Moreover, the ways in which these behaviors covary with digital literacies necessitate samples with sufficient variation in this characteristic in order to gauge how accurately measures capture it. Thus, more traditional (probability) samples may either miss or vastly undersample populations of interest to the researcher. In terms of measurement, fit for purpose implies validation for specific applications—such as information retrieval—as a competency to be predicted or explained. In the terminology of Kruizinga (Reference Kruizinga, Stuurman, Exadaktylos, Doll, Stephenson, Groeneveld, Driessen and Cohen2020), our investigation covers several stages of the fit-for-purpose validation cycle: For example, we conduct technical validation by benchmarking our several measures against a “gold standard”: purposive, non-probability samples with a priori assumed skill levels. We also perform clinical validation by testing correlations with other known measures: concrete tasks with known correct answers. This indicates that our candidate measures “show promise” in specific populations of interest.
Mechanical Turk (MTurk)
We recruited a sample from Mechanical Turk (N = 503), a now-ubiquitous source of subjects for many types of social science experiments (Berinsky et al., Reference Berinsky, Huber and Lenz2012). The MTurk interface is somewhat difficult to navigate, and qualitative evidence from Brewer et al. (Reference Brewer, Morris and Piper2016) suggests that this barrier prevents low-skill people from using the platform. As a result, we expect this sample to skew to the high end of digital literacy and to contain a hard floor, below which there will be virtually no respondents.
Facebook ads
We follow Zhang et al. (Reference Zhang, Mildenberger, Howe, Marlon, Rosenthal and Leiserowitz2018) and Munger et al. (Reference Munger, Luca, Nagler and Tucker2020) and use a Facebook ad campaign to recruit survey participants (N = 451). Facebook is generally very accessible, and many users have accounts created for them by younger, more tech-savvy relatives to make it easier to keep in touch. Redmiles et al. (Reference Redmiles, Chachra and Waismeyer2018) report that certain groups of Facebook users are much more likely to click on spam, in particular women and lower-skill users. Munger et al. (Reference Munger, Luca, Nagler and Tucker2020) report that similar groups are more likely to click on these Facebook recruitment ads. As a result, we expect this sample to skew toward the lower end of digital literacy relative to other samples.
High-skill targeted sample
Our “high-skill” sample (N = 83) was constructed by asking friends and colleagues who work at technology companies to distribute the survey among their workforce. Navigating computer technology is central to these people's careers, and our assumption is thus that they are highly skilled.
Low-skill targeted sample
Our “low-skill” sample (N = 18) is comprised of people who were taking introductory computer skills classes at the Princeton Public Library and the Brooklyn Public Library. Our assumption here—corroborated by conversations with librarians at these institutions—is that people who were taking the time to learn the basics of computing are lacking in those skills.Footnote 10 At a minimum, this sample illustrates that populations of low-digital-literacy respondents do exist, that they have intentions to go online, and that their characteristics differ in important ways from typical samples used by political-science researchers. Given our extremely limited sample of these respondents, we emphasize that our analysis of their responses serves merely as an existence proof; we encourage more research on these difficult-to-sample populations.
Lucid
Finally, we recruited a national sample from Lucid (N = 2, 146), an online survey platform recently attracting social scientists’ attention (Coppock and McClellan, Reference Coppock and McClellan2019). We expected to find individuals in this sample that span a wide range of digital literacies, although it may still somewhat under-represent people at the lowest end.Footnote 11
5. Distributions of digital literacy
We begin by investigating the distribution of the three distinct measures, each theoretically related to an ideal-type task in the domain of digital media: retrieving factual information. The distributions of the correct answers to the three questions in the retrieval exercise across our first four samples comports with our expectations. On average, the tech-worker “high” sample does the best, and the computer-class “low” sample does the worst, as can be seen in Figure 1.
Information retrieval accuracy across four samples, percentage of respondents from each sample (Facebook sample, N = 451; high DL sample, N = 83; low DL sample, N = 18; MTurk sample, N = 503) who correctly answer each of three information retrieval questions.
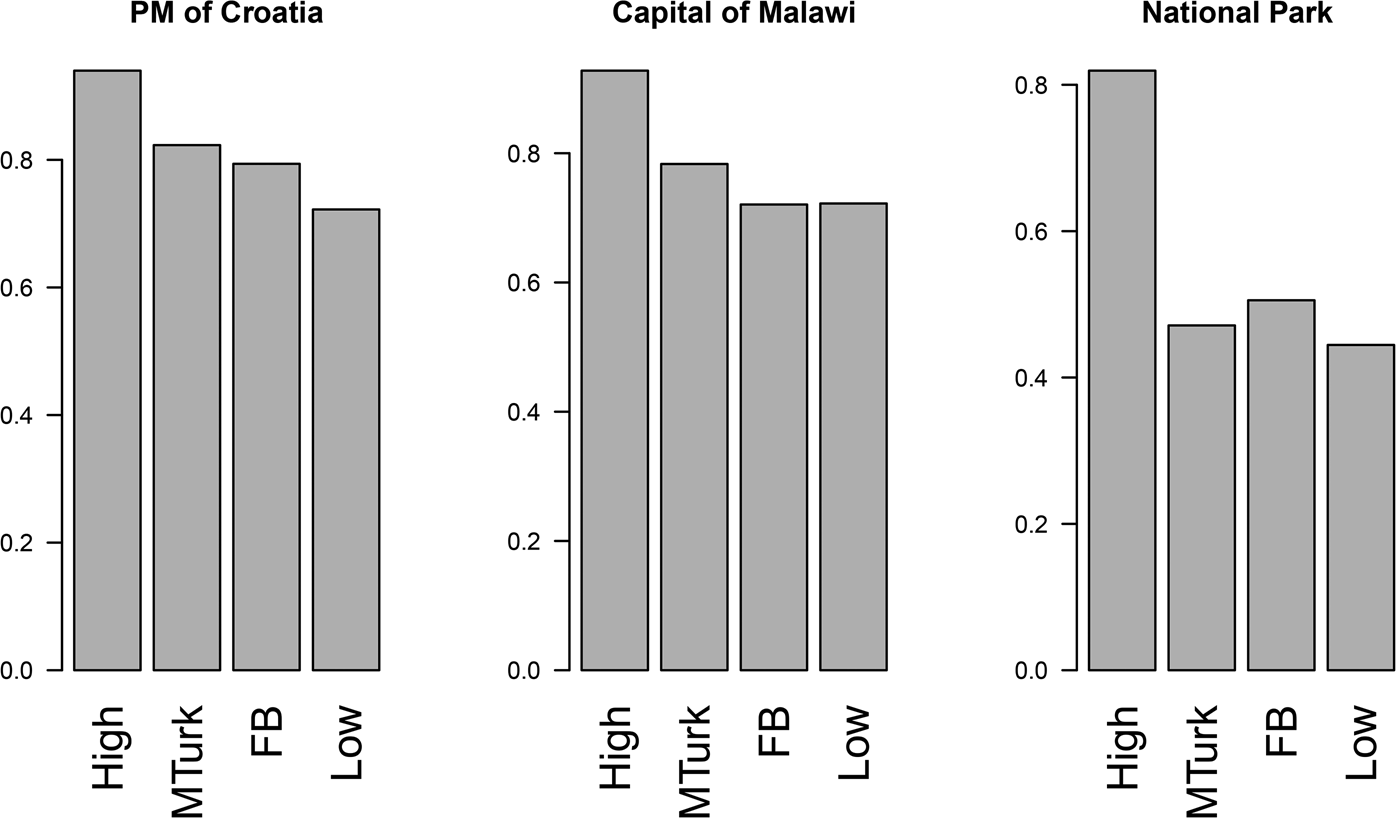
Focusing on each task separately, it is evident that the first two questions are both similarly straightforward. A single Google search of the exact question will produce one of Google's auto-populated “answer boxes” with the correct answer. On these questions, our expectations of the relative performance were correct: the MTurk sample did better than the Facebook sample, and they were between the high and low samples.
The third question was selected specifically to require slightly more skill at crafting a search term and navigating the options provided. Here, the only gap is between the “high” sample and everyone else. This suggests that lower-skill individuals, of which there should have been some across the other samples, had difficulty with this question.
This exercise demonstrates the existence of large gaps in the apparent ability of individuals across different populations to find the answers to straightforward questions using standard online tools. We have outlined reasons why digital literacy would not be evenly distributed across these samples, and how this moderator evidently captures a set of skills that are highly relevant for the particular task. Next, we delve further into this result by exploring how the survey batteries that we have introduced can help us measure variation in digital literacy within samples.
Armed with our suite of measures, we describe the distribution of digital literac(ies) within our main samples. Figure 2 plots these distributions, along with either the low- or high-DL samples discussed above, depending on the measure.
Distributions of relevant measures across the samples, each plot represents the distribution of a given variable across four of five different samples (Facebook sample, N = 451; high DL sample, N = 83; low DL sample, N = 18; MTurk sample, N = 503; Lucid sample, N = 2146). The first plot is the distribution of skills of respondents, as measured by the 21 Hargittai identification questions (shortened seven-question scale used for Lucid); the high DL sample is excluded because it is so far skewed to the right that the graph is unreadable. The second plot is the distribution of the “low end” measure according to our novel five-question scale, which we did not ask the Lucid respondents. The third plot is the distribution of the “power user” measure according to the 12-question power user scale; the low DL sample is excluded because this measure is not designed to distinguish between people on the lower end. The final plot is the distribution of ages of respondents; the low DL sample is excluded because very few of those respondents answered the open-ended prompt with a number; “USA” refers to the population distribution from the 2010 Census.
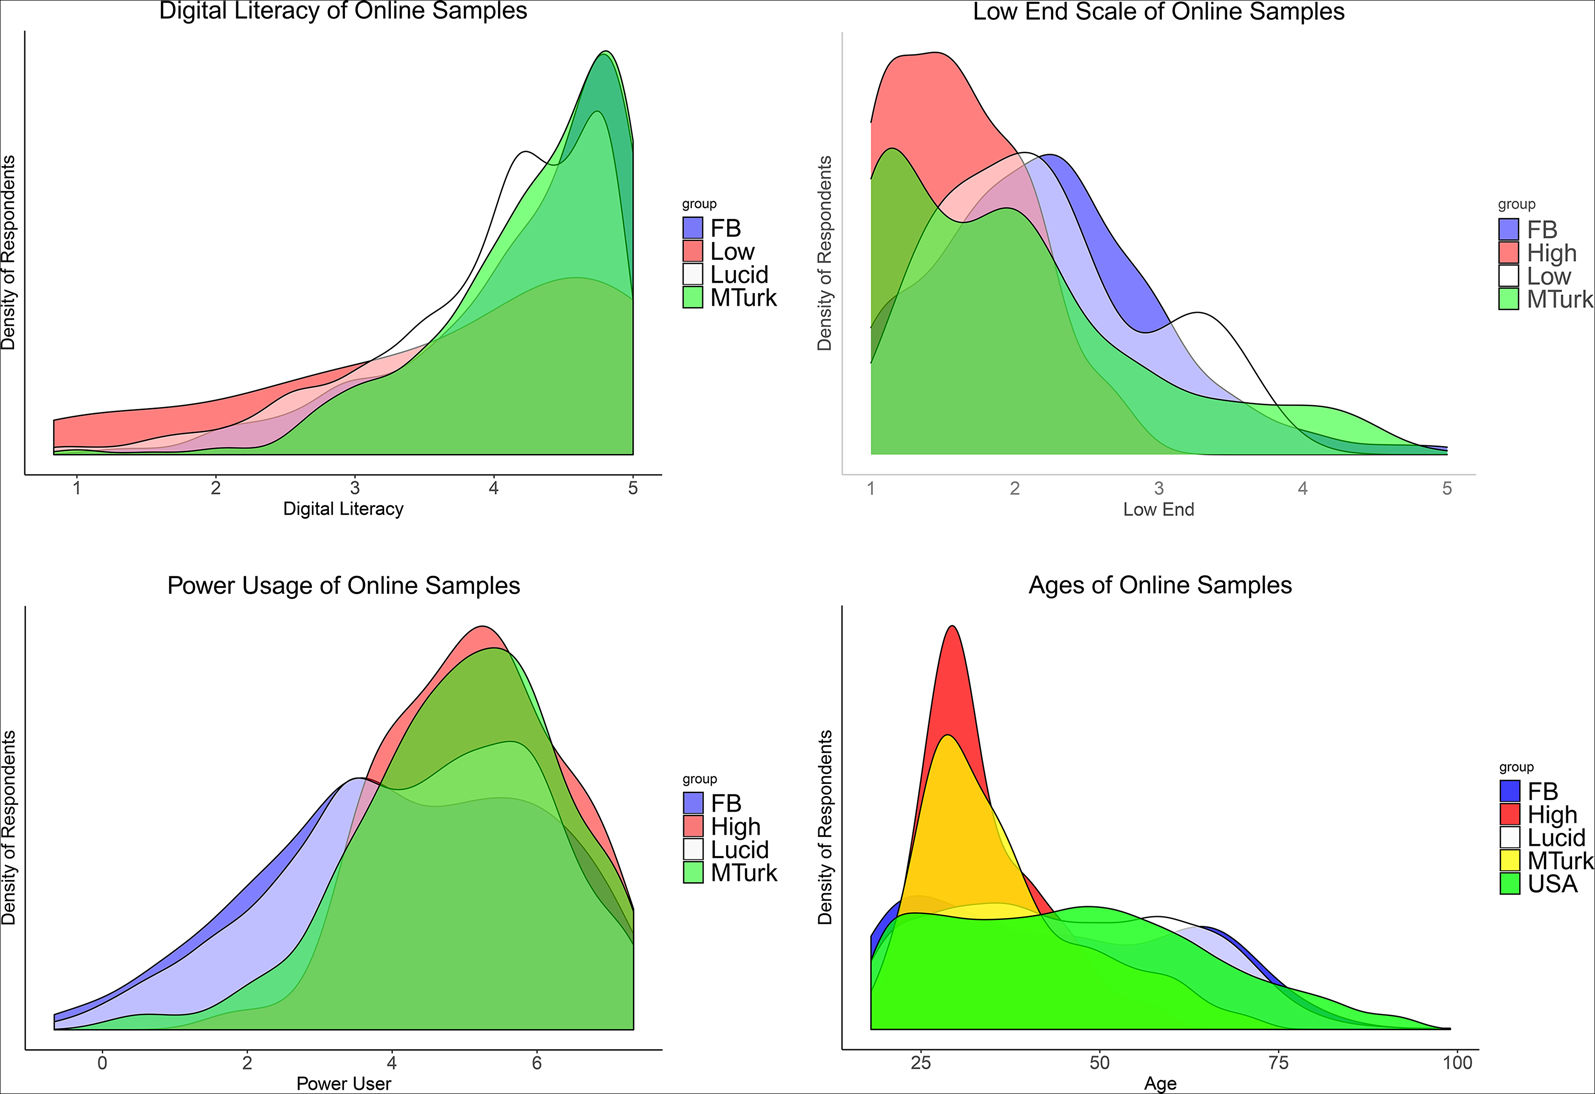
The bottom right panel of Figure 2 presents the distribution of the demographic that first motivated this investigation into digital literacy: age. The results are stark. The age distributions for the MTurk and high-DL samples are similar to each other and skewed far in the direction of the young, relative to the data from the 2010 US Census (in green, labeled “USA”). In contrast, the age distribution of the Facebook sample is actually skewed slightly older, with people in their 60s over-represented. The quota sample from Lucid matches the Census numbers closely, suggesting that this sampling was well-conducted.
The top left panel of Figure 2 displays the results for the internet skills measure. The full 21-question scale was used for most of the samples, while a shortened seven-question scale was used for Lucid. As expected, the low-DL sample has a much flatter distribution, with some respondents who report not being familiar with nearly any of the internet terms. The MTurk sample is the least diverse in terms of digital literacy, with close to a hard floor at 2.5 on the five-point scale. Only 1.4 percent of MTurk respondents were below this level, compared to 16.7 percent of the low-DL sample, 5.1 percent of Facebook respondents, 5.8 percent of Lucid respondents, and 0 out of 83 respondents from the high-DL sample.Footnote 12
The top right panel shows our novel low end scale, designed to detect more variation among people with lower levels of digital literacy. The modal high-DL and MTurk respondents are at the bottom edge of this scale, although the support for the MTurk distribution does span the entire range. Facebook respondents are more normally distributed, while (as expected) the low-DL sample provides the highest proportion of respondents who score high on the low end scale.
Finally, the bottom left displays the corresponding distributions for the 12-question power user scale. This is in many ways the most troubling result for Mechanical Turk: the distribution of this measure for our high-DL sample of tech company employees is nearly identical to the distribution for MTurkers. In contrast, the measure is much more broadly distributed across the Facebook and Lucid samples, with a bump on the higher end in the latter.
5.1 Within-sample correlations
Figure 2 suggests a potentially serious methodological problem. The nationally representative studies of misinformation on social media during the 2016 election (Guess et al., Reference Guess, Nagler and Tucker2019; Grinberg et al., Reference Grinberg, Joseph, Friedland, Swire-Thompson and Lazer2019) demonstrated a correlation between age and sharing “fake news.” We have suggested that this finding is due to the fact that the age effect is largely—but not entirely—capturing the effect of digital literacy. We demonstrate this relationship in Figure 3, which provides some logic for why the power user scale performed so well, as well as evidence for the crucial weakness of using MTurk samples for studying online behaviors potentially moderated by digital literacy.
Each scatterplot and LOESS curve represents the relationship between age and either internet skills (top left); power user (top right); low end (bottom left); or information retrieval (from 0 to 3, the number of successful internet searches for information, bottom right) in a given sample (Facebook sample, N = 443; high-DL sample, N = 83; MTurk sample, N = 503; Lucid sample, N = 2, 146). The low-DL sample is not present because too few respondents offered a numerical age. Age and internet skills, age and power user, age and low end scale, age and information retrieval.
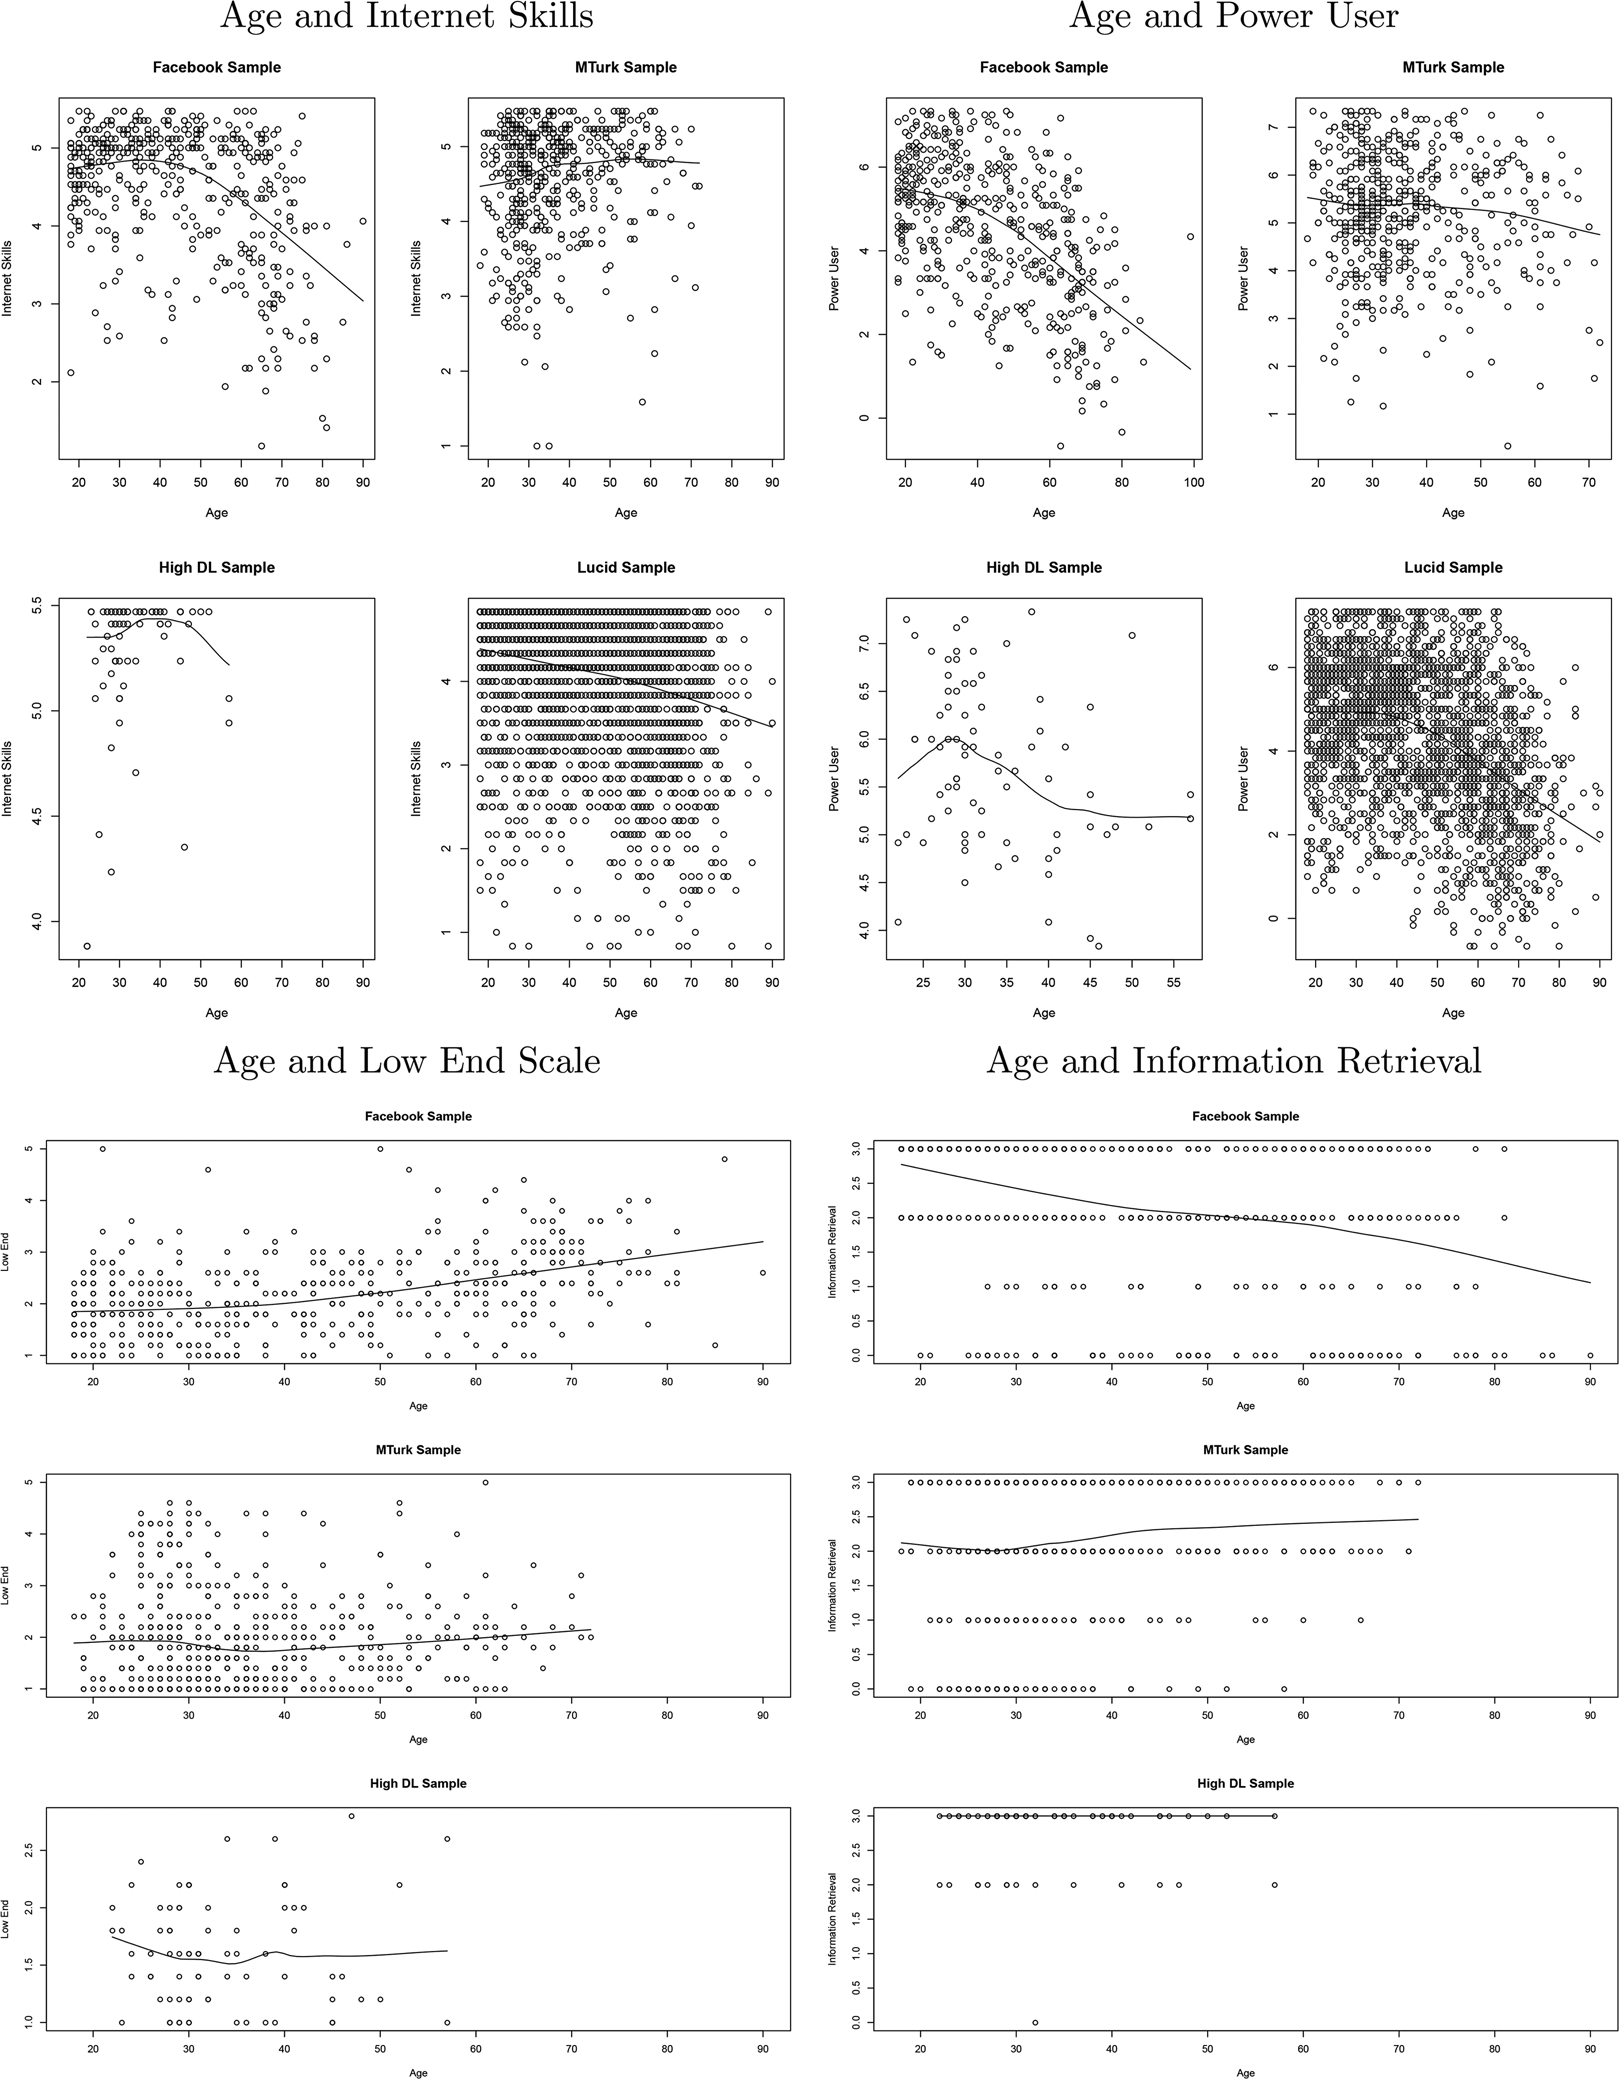
The top left panel of the first subfigure is evidence of the inverse relationship between age and internet skills in the Facebook sample. The loess line of best fit demonstrates the non-linearity of this relationship; the line is flat (even sloping slightly upward at the low end) throughout the 18–50 age range, when it becomes significantly negative.
A similar relationship is found in the Lucid sample, portrayed in the bottom right corner of the first subfigure. In this sample, there is a negative, linear relationship between age and internet skills throughout the sample. This represents the best evidence to date of a negative relationship between age and internet skills in the United States today. The sample (N = 2146) matches national distributions in age, gender, ethnicity, and region demographics.
However, the top right plot of the first subfigure, using the MTurk sample, demonstrates no correlation between age and internet skills. The average skill level of the 20-year-olds and 70-year-olds recruited via this platform is the same. A similar non-relationship is observed in the high-DL sample in the bottom left plot, where (in accordance with our purposive sampling) a majority of respondents scored at the maximum of the scale.Footnote 13
The trends are similar in the second subfigure, age and power user. Again, there is a negative relationship between age and power user in the Facebook and Lucid samples, and while the relationship is negative rather than flat in the MTurk sample, the relationship is weak. The big difference is in the high-DL sample, in the bottom left panel. Unlike for internet skills, there is no ceiling effect for power user, and we see a non-linearity in this sample, peaking at around age 30. This has some face validity, but we note that the sample size is not large enough to allow for high confidence in this trend.
The third subfigure plots the relationship between age and low end. The trends are the same as for internet skills, but inverted: there is a positive relationship between age and low end on Facebook, but no such relationship in the high-DL or MTurk samples.
The fourth subfigure of Figure 3 presents the bivariate relationship between age and information retrieval in the various samples. There is a strongly negative relationship between age and information retrieval in the Facebook sample, although this time the slope is close to constant and negative across the age range. By contrast, there is no evidence of a negative relationship between age and information retrieval in the MTurk sample—in fact, there is a weak but positive relationship among people 30 and older.
Presenting this another way, Table I displays a series of regressions with our index of three information retrieval questions as the dependent variable. The first four columns use the Facebook sample; the next four, the MTurk sample. In column 4 (Facebook), we see the predicted negative relationship between age and information retrieval; we also see the expected negative relationship with the low end scale and the positive relationship with the internet skills scale.Footnote 14 However, the eighth column replicates the analysis on the MTurk sample and indicates strong evidence of the opposite relationship: age here is positively correlated with information retrieval, with nearly identical magnitude and standard errors. The adjusted R2 also differs across the two samples. Because there is more variation in the digital literacy measures and age in the Facebook sample than in the MTurk sample, these variables explain more of the variance in the former than in the latter.
Information retrieval and age/digital literacy across samples
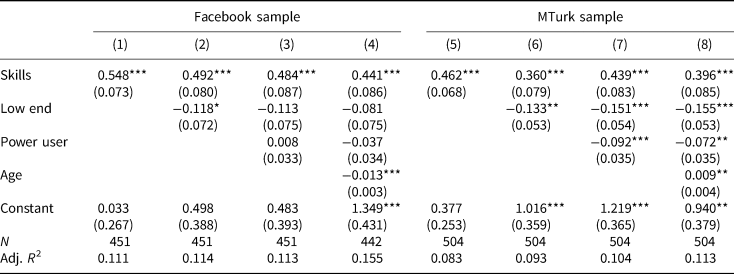
Note: *p < 0.1; **p < 0.05; ***p < 0.01.
This result can be described as an example of conditioning on a collider, a form of sample selection bias (Pearl, Reference Pearl2009). Equivalently, this is a problem of “selecting on the dependent variable” of successfully navigating relevant internet spaces. The issue parallels the canonical examples of a non-relationship between SAT scores and GPA in selective colleges, or the non-relationship between height and performance among NBA players. In each case, individuals who score high on the former measure are more likely to be included in the sample; individuals who are included in the sample despite scoring low on the former measure are likely to possess other traits that contribute to their performance within the sample.
We would like to be able to estimate the effect of age and digital literacy on information retrieval. However, to do so we need to sample from the general population. In the present case, age and digital literacy are causally related to being an MTurk worker. Lower-digital-literacy internet users are less likely to be aware of the platform, and less likely to be able to navigate its non-intuitive interface.Footnote 15 Figure 4 visualizes the problem using Pearl's graphical framework. This selection process means that within the MTurk sample (where the “collision” between age and digital literacy can be observed), the causal relationship between age and information retrieval is broken.
Directed acyclic graph of selection process.

As a result, experimental studies of digital media effects or online misinformation conducted on samples recruited from MTurk are unlikely to accurately estimate the role of age as a treatment effect moderator. Furthermore, as the first panel of Figure 2 demonstrates, there are close to zero MTurkers who are below a threshold level of the internet skills or power user scales. Given the highly unequal distribution of engagement and sharing of “fake news” during the 2016 election, concentrated among those age 65 or older, it is likely that the most important respondents (who would be influential observations in any statistical analysis) are precisely those who are structurally excluded from MTurk.
6. Literacies and heterogeneity in political science
In this paper we argue that taking digital media seriously requires moving away from the assumption of media effect homogeneity developed in the broadcast era. Specifically, important heterogeneity in an exemplary digital media task can be explained with multiple measures related to the construct of digital literacy. However, we find significant heterogeneity left to explain—and that age remains a powerful factor.
We demonstrate that digital literacy varies considerably among populations frequently used by political scientists. In particular, we show that samples from MTurk contain vanishingly few low-digital-literacy respondents—precisely the population among whom we might expect to find the largest persuasive effects of digital media messages (including misinformation). We recommend that MTurk not be used for studies of digital media effects in the absence of strong theoretical reasons to expect effect homogeneity.
However, our results should not be construed to speak only to the topic of MTurk and digital literacy. We emphasize our previous discussion about digital literacies; there is a parallel logic regarding the role that theoretical expectations play in evaluating the choice of both an appropriate sample and an appropriate measure of digital literacy. None of our measures of digital literacy vary sufficiently in our “high digital literacy” sample, for example, and none of them can explain any of the heterogeneity in the capacity of that sample to perform a simple information retrieval task. However, consider a much more advanced task related to digital media effects: the large-scale detection of “bot” accounts on Twitter. Say that one-third of the high-DL sample could perform this task, but less than 1 percent of any other sample could; MTurk would obviously be a poor choice of subjects for this experiment. None of our existing measures of digital literacy could explain the variation in performance among the high-DL sample, but perhaps a single survey question about Python fluency could.
We thus see our contribution as relevant for broader conversations about how political science should handle novel online platforms for subject recruitment and how novel theoretical constructs should be evaluated. The case of MTurk is illustrative. Berinsky et al. (Reference Berinsky, Huber and Lenz2012) “introduced” the platform to the discipline, and while their validation work is careful and nuanced, it has frequently been cited to imply that MTurk is generally “okay to use.”Footnote 16 The article made a large impact and is overwhelmingly the most-cited article published in Political Analysis in the past decade. Numerous papers have argued about the merits of MTurk as a respondent pool for experimental studies. Coppock (Reference Coppock2019), the most recent and comprehensive, establishes that a wide variety of experimental findings generated from nationally representative surveys can be replicated using MTurk samples. The reasoning is that since treatment effects are similar for many different types of subjects, the composition of online convenience samples along commonly measured demographic and political characteristics is relatively unimportant for recovering experimental treatment effects. Crucially, however, results about the generalizability of MTurk samples are not themselves generalizable to all possible experiments.
They are also not necessarily generalizable to alternative online convenience sample marketplaces. For example, Coppock and McClellan (Reference Coppock and McClellan2019) explore and offer justification for the use of Lucid, a source of research subjects used in this study. Aside from the validation exercise, the paper offers a useful discussion of the scientific value of convenience samples for testing theories. Coppock and McClellan accurately observe that concerns about external validity are often poorly motivated. Whether experiments conducted on a convenience sample and a nationally representative sample produce identical treatment effects is immaterial; what matters is whether a given sample is theoretically relevant, an argument with which we strongly agree. They propose, for example, that a sample of French speakers would serve as an inappropriate sample to test a theory about the effect of reading an English-language newspaper. Literacy is self-evidently a crucial moderator of textual media effects.
This example works because social scientists intuitively understand how literacy operates in the world. A paper purporting to find evidence of treatment effect heterogeneity in the French literacy of respondents would be bizarre; literacy is a bedrock of our shared model of media effects. We feel nearly as confident about digital literacy, though we are well aware that no consensus yet exists on this point. By conducting research demonstrating the importance of digital literacy in mediating digital media effects, we hope to change the intuitions of social scientists and make the choice of online convenience samples contingent on the theoretical argument being tested, in the same way that the choice of constructs as potential treatment effect moderators are selected by theoretical logic.
In both cases, of course, theories can be bolstered or weakened through empirical tests. The intersection of highly heterogeneous and rapidly shifting digital media experiences with the proliferation of companies and organizations offering online convenience samples makes it impractical to empirically verify the validity of every possible research question involving digital media effects on each of these novel samples. Munger (Reference Munger, Gopal, Nagler and Tucker2021) asks whether “a given class of research designs should be ‘generalizable from MTurk samples until proven otherwise,”’ and we think that the best way to answer this question is to seriously engage with the theory in question.
We would therefore qualify the claim in Coppock and McClellan (Reference Coppock and McClellan2019) that “Whether or not future experiments will also exhibit low treatment effect heterogeneity is, of course, only a matter of speculation.” We argue that digital literacy is likely to be a key moderator of digital media treatment effects, that it varies widely in the current US population (and that it does so even among the current population of internet users), and that this is a significant problem for opt-in crowdworker platforms like MTurk for which digital literacy affects selection into the sample.
Although social science has not yet accumulated the dozens of separate studies necessary to firmly establish this claim, the trend of political life increasingly taking place online is not, we argue, “only a matter of speculation.” Media technology has radically increased media heterogeneity, a development that shows no signs of abating. This is perhaps a problem for the ecological validity of a given media survey experiment, as a greater variety of stimuli are thus necessary to ensure a representative sample of even a specific type of media (Hovland et al., Reference Hovland, Lumsdaine and Sheffield1949). More immediately relevant is the continuing existence of the “second digital divide” in computer skills identified by Hargittai 20 years ago. In the absence of an unprecedented increase in the level of digital literacy among those at the bottom of the distribution, we have strong reason to expect that future experiments will exhibit greater effect heterogeneity along this dimension. But only, of course, if those experiments are conducted using samples with sufficient variation in the moderator, and valid measures of it.
7. Conclusion
As awareness increases of the potential for endogenous selection of digital literacy in commonly used samples, scholars will need to grapple with its substantive importance as a moderator in literatures not directly related to the study of online misinformation. Below we discuss three additional areas for exploration of effect heterogeneity by digital literacy. In addition to sampling considerations, these areas also raise questions about the specific measures to be used, which will reflect overlapping but distinct dimensions of the multifaceted construct of digital literacy.
Political knowledge
While political knowledge has long been established as a strong predictor of issue-position stability and ideological constraint, Kleinberg and Lau (Reference Kleinberg and Lau2019) find that this relationship is now reversed for people belonging to the “internet generation.” People for whom searching for information online is second nature do not need as much political information stored in their biological memories because they are able to access that information in their digital memories. These findings are consistent with psychological research that conceptualizes people's use of the internet as a kind of external or “transactive” memory (Sparrow et al., Reference Sparrow, Liu and Wegner2011). Accordingly, people are better at remembering where to find information than the information itself if they expect to be able to find it later—even if this makes them think that they are more knowledgeable than they actually are (Fisher et al., Reference Fisher, Goddu and Keil2015; Ward, Reference Ward2021).
Future research on the determinants and consequences of political knowledge will need to explicitly take into account variation in individuals’ ability to seek out and process online information. Not only might the effect of knowledge vary across levels of digital literacy, but knowledge itself might function differently for people aware that answers will always be at their fingertips. Smith et al. (Reference Smith, Clifford and Jerit2020) suggest that “Scholars who are interested in measuring political knowledge should take efforts to minimize and diagnose search behavior,” but this assumes a static, crystallized view of knowledge that may no longer hold for people who effectively externalize their store of factual information. This novel, transactive view of political knowledge is distinct from the traditional, static view—but overall, given the evidence in Kleinberg and Lau (Reference Kleinberg and Lau2019), the former may now be more relevant for understanding how citizens engage in the process of transforming political knowledge into political preferences and actions. We speculate that none of our survey measures may be particularly well-suited to operationalize digital literacy for this domain of inquiry, but that a direct measure of age cohort should be used until a more theoretically relevant measure is developed.
Nudges and defaults
Behavioral scientists have demonstrated that classes of relatively low-cost interventions can have outsized effects. These “nudges” have been promoted as a way to guide human decisions in a prosocial direction while preserving liberty of choice, as in the case of default options (Thaler and Sunstein,`Reference Thaler and Sunstein2009). Scholarship on the topic has focused on domains with a clear public welfare dimension, such as education and public health. But the insights of behavioral economics can be fruitfully applied to internet media, as contemporary accounts overlook the hidden obstacles and defaults that structure people's behavior (Lorenz-Spreen et al., Reference Lorenz-Spreen, Lewandowsky, Sunstein and Hertwig2020). To take a simple example, modern web browsers come pre-loaded with bookmarks for large news and entertainment sites. Many people still use portals for email and other services which link to headlines, weather and other information. Sometimes, such sites automatically load on startup or with a new tab. It is not hard to customize one's settings, but the perceived cost of doing so may be too high for people lacking in digital literacy, with observable implications for political news diets (e.g., Guess, Reference Guess2021).
The effects of online choice architecture are not always innocuous, as more recent writing on “sludge” (Thaler, Reference Thaler2018) and “dark patterns” (Mathur et al., Reference Mathur, Acar, Friedman, Lucherini, Mayer, Chetty and Narayanan2019) has documented. As worries about online privacy and surveillance become more acute, the ability to protect oneself from insidious efforts to influence consumer and political choices will depend on what Hargittai and Micheli (Reference Hargittai and Micheli2019) call “awareness of what is possible”—a dimension of internet skills comprising knowledge about default settings that can be changed. This arguably also covers defensive measures that can be taken against malicious or unscrupulous actors, such as installing blockers for illicit tracking. At a more basic level, people lacking in digital literacy may be unable to defend themselves against clickbait, misleading advertisements, and spam (perhaps political in nature; see Perlstein Reference Perlstein2012).
Microtargeting and campaign persuasion
The possibility that digital literacy captures heretofore unobserved heterogeneity in people's responses to online “sludge” raises more general questions about the effects of modern campaign techniques. Evidence already suggests that online advertisements can generate substantial heterogeneity; Kaptein and Eckles (Reference Kaptein and Eckles2012) find that heterogeneity in social influence strategies is large relative to the average effect, for example. Moreover, since ads follow the same rules of “engagement” as other types of online content, campaign targeting of favored demographic and political subgroups is subject to feedback loops in which users most likely to respond to appeals will become even more likely to be targeted in the future via platforms’ ad optimization algorithms (e.g., Eckles et al., Reference Eckles, Gordon and Johnson2018; Zarouali et al., Reference Zarouali, Dobber, De Pauw and de Vreese2020). Given generally low clickthrough rates, the kinds of people who are most likely to engage with commercial or political appeals on social media has important implications for democratic participation, representation, and campaign strategy. Future research should explore whether a digital literacy measure that captures overall awareness of how the social media environment operates—similar to the concept of “algorithmic skills” proposed by Klawitter and Hargittai (Reference Klawitter and Hargittai2018)—explains variation in this important but understudied online political behavior.
Acknowledgments
This research was supported by an unrestricted Facebook Integrity Foundational Research Award and approved by the Princeton University Institutional Review Board (Protocol 11745). The authors are grateful to Eszter Hargittai for discussions and feedback on this project as it developed. We are indebted to Melissa Morrone at the Brooklyn Public Library and Kelsey Ockert and Morgan Taylor at the Princeton Public Library for their advice and help recruiting respondents. Thanks to Drew Dimmery, Jennifer Oser, Jason Reifler, the editor, and two anonymous reviewers for providing helpful comments. Special thanks to Nejla Asimovic and Jacob Sweetow for outstanding research assistance.
Supplementary material
The supplementary material for this article can be found at https://doi.org/10.1017/psrm.2022.17.


 Open access