


1 Introduction
1.1 Overview
This Element will establish the crucial role of the 2008 financial crisis for the populist wave in Europe. We focus first on how the crisis affected voters across different occupations. And then on the consequent structural transformation of political parties and movements. Our work contributes to several strands of literature: how old and new parties compete in terms of policy platforms as a function of changes in voters’ preferences and beliefs; what determines the preferences of different occupational groups on economic and cultural dimensions of politics; and what shapes their beliefs about the value of different policies. While focusing simultaneously on both voters and parties is not unique to this Element, our conceptual framework offers a novel interpretation by emphasizing the crisis’s effects on beliefs about the feasibility and desirability of different policies. This focus provides the key to our interpretation and helps us maintain a coherent view of the broader picture.
Economic crises tend to generate economic insecurity and erode trust in existing institutions – both market and governmental. However, while the economic threats posed by immigration, globalization, and automation primarily impact low-skilled workers and their communities, financial crisis tend to have distinct effects on groups that are more exposed to dependent from financial markets, such as the middle class. We illustrate this empirically using a novel methodological approach. The extension of distrust to include the middle class is a critical development, as it signals to politicians and parties that winning over this broader group of disillusioned voters can be decisive for electoral success. Consistent with this intuition, we show that the transformation of the political supply, in terms of new and transformed parties and manifestos, happened right after the financial crisis. Moreover, the transformation and the increase in populist voting happened more evidently in countries plagued by low fiscal space, where the feasibility of inclusive welfare redistributive policies is lower. This, in turn, increases the appeal of exclusionary policy commitments, which are more easily championed by populist parties on the extreme right of the ideological spectrum.Footnote 1
The shrinking fiscal space in many European countries made the financial crisis particularly conducive to the rise of right-wing populist parties. The reason is straightforward: Identity-based protection policies typically require limited public spending, whereas the redistributive welfare policies advocated by left-wing populists became increasingly infeasible and less credible – despite remaining ideologically appealing to a significant portion of the population. As a result, the shift toward right-leaning economic policy preferences can be partly attributed to the perceived decline in the feasibility of more inclusive welfare policies.
Shifts in beliefs about the relative feasibility of left- and right-leaning economic policies have also influenced cultural-political cleavages. Macroeconomic and institutional constraints on fiscal policy have altered perceptions of self-interest about public policies, contributing to polarization along the cultural dimension. When individuals lose faith in the feasibility of inclusive welfare policies – particularly those benefiting minorities – or perceive such policies as misaligned with their own self-interest, they are more likely to support exclusionary measures that heighten cultural tensions. As belief grows that anti-immigration and nationalist identity-protection policies are the most effective means of safeguarding personal interests, support increases for politicians who promote anti-pluralism and oppose values such as diversity, equity, inclusion, and minority rights.
1.2 Some Preliminary Look at the Different Crises
We view the 2008 financial crisis and the resulting great recession as a major factor in the spread of populism in Europe during the twenty-first century. It happened before: One of the first examples of a populist policy in history is that of Urukagina, who seized power in Lagash – a city-state of ancient Mesopotamia – by dethroning his corrupt predecessor Lugalanda. This ruler promised to restore the power of ordinary people during an economic downturn while highlighting his predecessor’s lack of credibility. To gain consensus, Urukagina forgave all loans, relieving debtors while demonizing financiers. He lumped usurers with criminals to be cast out of the city (see Goetzmann, Reference Goetzmann2015).
Much of the economic literature on populism has sought to examine the effect of immigration, globalization, and automation on job destruction, primarily among low-skilled workers. This is thought to have created voter disillusionment in liberal democracies, gradually transforming the demand for policies. In this context, the financial crisis has been treated as yet another factor that enhanced voter appetite for populist policies as a response to economic insecurity. However, this approach has tended to ignore the peculiar effects and consequences of the financial crisis on the middle class.
The effects of globalization and automation on some segments of society are not uniformly negative: There are losers, but undoubtedly there are also winners. Apart from the inequality generated by job destruction and lower wages among workers affected by foreign competition or automation, consumers as a whole have benefited from lower prices of final goods and firms’ intermediate inputs.
This cannot be said of financial crises. It is difficult to think of a beneficial effect that a financial crisis-induced recession might have. Thus, most people, across the entire spectrum of the voter population, lose out. Income losses tend to be deep and universal. Hence, the discontent fostered by the resulting economic insecurity tends to be more pervasive and thus more politically relevant. Moreover, the first thing to note about the financial crisis is that the economic insecurity following the onset of the crisis in 2008 spread to segments of the population that were less affected by the globalization shock. Figure 1, panel (a) shows the share of blue-collar and non-blue-collar workers in the top quartile of economic insecurity in each year of our sample. Prior to the financial crisis, when globalization was the main source of economic insecurity, blue-collar workers were those predominantly experiencing a high level of insecurity (66% on average); during the years after 2008, the share of non-blue-collar increases substantially (by more than 8 percentage points) compared to the years prior to the financial crisis.
Insecurity among blue-collar workers and members of the middle class
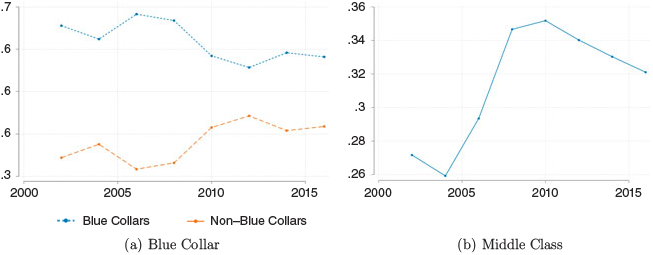
Figure 1 Long description
Figure 1 contains two line graphs on economic insecurity. Panel (a), “Blue Collar,” plots the share of blue-collar and non-blue-collar workers in the top quartile of economic insecurity between 2002 and 2016. The blue-collar line remains consistently higher, fluctuating around 0.56–0.68 and declining slightly after 2008. The non-blue-collar line ranges around 0.31–0.44, rising gradually after 2008 and narrowing the gap with blue-collar workers. Panel (b), “Middle Class,” shows the share of people in the middle 50% of the income distribution experiencing insecurity. Values rise from about 26 in 2004 to a peak above 35 around 2010, then gradually decline to about 32 by 2016.
Panel (b) shows that the financial crisis also increased economic insecurity among the middle class, as shown by the average share of people in the mid-50% of the distribution of income in each country-year. The share of middle-class voters suffering from serious economic insecurity, that is, in the top quartile of insecurity, climbs during the years of the Great Recession. Thus, the financial crisis not only increased insecurity among social strata that were already distressed by globalization and other processes before the crisis (namely, low-skilled workers at the bottom of the income distribution), but it also spread insecurity among segments of the population that had been relatively sheltered from globalization.
In advanced Western countries, where both firms and households are heavily dependent on financing, a financial collapse can represent an existential threat. Obtaining credit becomes more difficult in a financial crisis, as markets stop working smoothly and financial constraints become tighter. In addition, the accompanying fall in asset prices reduces the value of precautionary savings, thus limiting people’s ability to cope with economic insecurity. On the contrary, up until the financial crisis, financial markets were intact and credit was abundant, implying that some of the people hit by the first wave of globalization threats could use borrowing or their own savings when asset prices were still high. The dramatic spike in the bond spread during the years of the European sovereign debt crisis demonstrates quite clearly how difficult it became for governments to secure funding to run their programs during the financial crisis relative to the globalization years.
The different composition of the population feeling economic insecurity is only one effect. Another factor – more difficult to measure but intuitively central to our argument – is the level of confidence in the existing institutional framework and in the credibility of government objectives and traditional policy commitments. Any rational agent applying standard Bayesian updating must be revising downward such a confidence when a large crisis such as the Great Recession finds the status quo elites unprepared (or complicit). Our novel theoretical framework will allow us to explicitly consider these additional differences, and the theory will guide an empirical analysis that will add important nuances to the simple first observation of Figure 1.
1.3 Introducing the Theoretical Framework
As explained in Bellodi et al. (Reference Bellodi, Morelli, Nicolo and Roberti2025), there are clear reasons – from standard principal-agent logic to endogenous changes in accountability – to expect that a decline in trust in governments and politicians determines what they call a “shift to commitment politics,” whereby the trustee model of political agency is replaced by agents proposing implicit contracts based on simple commitments made ex ante.Footnote 2
The shift to commitment politics generates as an epiphenomenon the strategic use of anti-elite rhetoric and identity protection rhetoric for the people, which are the essential parts of observable political strategies that constitute the definition of populist vs non-populist parties in the political science literature. Moreover, as argued formally in Bellodi et al. (Reference Bellodi, Morelli, Nicolo and Roberti2025), it is also intuitive that parties and politicians shifting more and more to policy commitments desire to weaken the checks and balances, bureaucrats, judges, experts, and intellectuals: because they all could constitute obstacles to the implementation of commitments when proved to violate constitutional or international laws (like in the case of deportations).
The theory presented in Section 2 of this Element develops an important feature of the populist commitments: they are almost always “exclusionary commitments” of protection – protectionism on markets, protection from immigrants, identity protection, nationalism, protection from external influences, and even from international organizations and laws.
The financial crisis has played a crucial role in reshaping political preferences. For individuals weighing a policy agenda centered on open borders, open markets, and inclusive policies against one favoring closed borders, protected markets, and the rollback of inclusion efforts, the crisis disproportionately undermined confidence in the former. In contrast, the latter – an agenda of closure – can come to be seen as not only viable but necessary, particularly when the crisis is perceived as stemming from external forces and internal responses are constrained by limited fiscal space.
We capture all the above complex logical connections with a simple theoretical model that clarifies the determinants of both voters’ policy preferences between open market status quo and various types of protectionist commitments as well as voters’ participation decisions given their abilities and ideologies. The simple model will clarify why one should expect the financial crisis to induce differential turnout effects between left and right and thereby cause the entry and success of right-wing populist protectionist parties.
To anticipate some important details of the theory, we assume that individuals are heterogeneous in ability (and hence type of occupations they can obtain), cost of voting, and ideology. The expected utility of an individual if the open market status quo is kept depends both on the probability of being a winner from the open market and on the probability of being bailed out or compensated by institutions when happening to be a loser. Hence, this expected utility (which we also call economic security) can be different across occupations. Ideology enters the picture when considering an alternative policy commitment to protect from the open market, which typically is a bundle of closures, from closed markets to closed borders and beyond. Such closure policy commitments typically give a higher expected utility to right-wing individuals, since left-wing individuals are typically closer to the moral universalism description of Enke et al. (Reference Enke, Rodríguez-Padilla and Zimmermann2023) and hence have some moral disutility from policies that benefit a subset of the population (the “citizens”) while excluding others (the “immigrants”). Thus, when a crisis arrives and reduces the appeal of the open status quo, right-wing individuals can more readily embrace populist protection commitments, whereas left-wing individuals equally disappointed by the status quo may instead choose to abstain. This differential incentive to participate in elections is what triggers the increased probability of winning of right-wing populist parties after the financial crisis.
1.4 Empirical Methodology
On the voters’ side, we use the European Social Survey (ESS), which is conducted in repeated cross-section waves. The data is used to produce an instrumented pseudo-panel analysis of the economic and financial drivers of change in political attitudes and voter behavior in Europe during the financial crisis and subsequently. Each element of the pseudo-panel is a synthetic cohort of individuals and can be associated with a distribution of occupations. This survey data will be complemented by labor market data that will allow us to construct a methodology for identifying the causal effects of the financial crisis, exploiting heterogeneity in the distribution of occupations across cohorts.
In order to establish a causal link between the financial crisis and economic insecurity, trust in politics, and voter abstention, we build a novel instrumental variable that leverages the idea that financial crises are most damaging to individuals who depend more on borrowing to buffer income shocks and thus to manage economic insecurity. Dependence on borrowing is a function of the steepness of an individual’s age-earnings profile: people with a steeper profile must rely more on borrowing to smooth consumption, which makes them more vulnerable to financial shocks.
The cohorts of respondents to the ESS over time and across countries vary in their distribution by occupation. We find marked differences between occupations in the steepness of the age-earnings profiles. Thus, there will be heterogeneity in the sensitivity to a financial crisis across occupations and hence cohorts. We construct a shift-share instrument where the shifter is the aggregate economic shock affecting a country, the share is the weighted average sensitivity/dependence on borrowing by cohort, and the weights are the shares of each occupation within the cohort.
On the supply side, we document in multiple ways the death of traditional parties, birth of new parties, and transformation of the manifestos of surviving parties, giving a comprehensive picture of the transformation of the whole landscape of political platforms after the financial crisis.
In order to define a European party as populist in a given year, we rely on the PopuList proposed by Rooduijn et al. (Reference Rooduijn, Van Kessel, Froio, Pirro, De Lange, Halikiopoulou, Lewis, Mudde and Taggart2019), which is available at www.popu-list.org. This classification is consistent with both the ideational approach and the political strategic approach to defining populism.Footnote 3 Accordingly, the people-vs-elite rhetoric is a straightforward manifestation of populism, which is also the most common measure used in empirical work (Pauwels, Reference Pauwels2011; Hawkins and Littvay, Reference Hawkins and Littvay2019; Gennaro et al., Reference Gennaro, Lecce and Morelli2024).
To give a first sense, just looking crudely at the number of coded populist parties entering, we can already get a sense of the change: Figure 2 plots the average number of populist parties participating in elections up to 2008 and in subsequent years. It is clear that the Great Recession marks a watershed in terms of the supply of populist parties competing for voters.
Populist parties
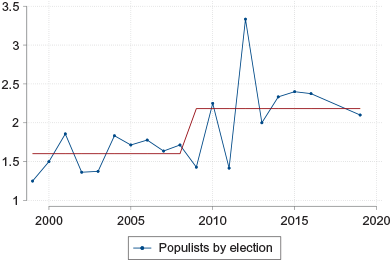
Figure 2 Long description
Before 2008, the blue line fluctuates between 1 and 1.7 with no clear trend, and the red average line sits near 1.6. After 2008, the number rises sharply, spiking to about 3.3 around 2012 before settling between 2 and 2.5 in subsequent years. The red average line steps up to approximately 2.2, indicating a structural break in the supply of populist parties after the financial crisis.
Up until 2008 an average of 1.7 populist parties took part in an election with no clear trend over time. In the years following 2008, the average number of participating populist parties jumps to 2.4 – a 33% increase compared to the precrisis mean – with a spike in the 2012 elections. The financial crisis appears to mark a structural break in the supply of populist parties. And this is just looking at quantity, but, as we will see, content also changes in directions consistent with our arguments within long-lived parties.
The Manifesto Project dataset (Volkens et al., Reference Volkens, Burst, Krause, Lehmann, Matthieß, Regel, Weßels, Zehnter and Sozialforschung2018) will be useful because with the use of Lasso regressions we will be able to trace the most important topic shifts and position shifts directly from the texts. We will complement the analysis on party manifestos over time with the insights from expert surveys, which are useful especially to detect major items of convergence or divergence between populist and non-populist parties on both sides of the ideological spectrum.
1.5 Main Empirical Findings
Our main empirical finding is that economic insecurity triggered by the financial crisis had a causal effect on turnout and on voting choices. Financial shocks specifically hamper the ability to borrow, which particularly affects segments of the middle class characterized by steep age-earnings profiles. This, in turn, significantly expands the pool of voters seeking economic support and who are at the same time losing confidence in the ability of the government to deliver such support. In view of this disappointment in traditional politics, there is an increase in voter abstention, especially among those who had not previously been seriously affected by globalization. Meanwhile, those who were subject to previous crises as well are the most likely to vote for a populist party, especially if ideologically not opposed to exclusionary policy commitments.
The results show that the instrument has a strong predictive power on both the self-reported as well as wage-based measures of economic insecurity. In turn, in IV regressions (that also control for cohort fixed effects as well as for country and time fixed effects), shocks to instrumented economic insecurity tend to cause a reduction in voter turnout, especially among left-wing voters.Footnote 4 The shock also increased populist voting (conditional on turnout). The effects on voter behavior along all three dimensions are significant in magnitude: an increase of one standard deviation in economic insecurity increases populist voting by 7 percentage points, which is about 94% of the sample mean, and it lowers turnout by more than 8 percentage points (about 10% of the sample mean).Footnote 5 We will show that indeed back-of-the-envelope calculations support our financial crisis mechanism, since roughly 70% of the change in voting for populist parties comes from the middle class.
The above numbers suggest that the financial crisis may indeed have been the moment of maximum entry and transformation of parties on the supply side, which in turn gave disillusioned voters new hope. To investigate this hypothesis, we conduct a novel analysis of the dynamics of the supply of populist parties in Europe. We first examine the manifestos of all European parties, distinguishing between long-lived parties (existing both before and after the financial crisis) from the parties that disappeared or emerged at the time of the crisis. The quantitative structural break documented already in Figure 2 is corroborated by a number of findings on contextual interactions and textual content.
In terms of contexts, the party structure transformation phenomenon occurred particularly in countries with a shrinking fiscal space, which is in line with the expectations given our theory and the considerations of credibility of policies mentioned above. A shrinking fiscal space has dramatically different effects on left-oriented versus right-oriented parties. It also reduces the feasibility and thus the credibility of protection policies that are focused on the supply of expensive public goods and on redistributive spending. Hence, the traditional leftist parties suffered the most in terms of credibility, leading to the exit of traditionally leftist parties and the entry of new parties such as the Five Star Movement in Italy and Podemos in Spain. The nationalism and identity protection policies championed by right-wing parties did not need to be altered because they were less dependent on the level of public spending. Thus, nationalist or far-right ideologies do not need to change in a financial and/or fiscal crisis; in contrast, such crises force a shift on the left from (unaffordable) redistributive platforms towards protection rhetoric and pre-distribution. This creates an advantage for right-leaning parties, which are able to advocate the same policies and measures that depend less on public spending.
In terms of textual content, we corroborate the insights on party transformation using expert survey data on topics and salience shifts to see whether non-populist parties also modified their platform and in which direction. We show that there is a postcrisis convergence, with non-populist parties modifying their platforms in the direction of populist ones.
1.6 Contribution to Comparative Politics Literature
Our contribution to the comparative politics literature is on multiple levels. First, we contribute to the understanding of the effects of economic shocks of different nature on the political preferences of voters (see Margalit (Reference Margalit2019) for a review); second, we contribute to the documentation of changes over time in the political attitudes of occupational groups and the corresponding evolution of parties in the electoral space in the last decades in Europe, thereby complementing the work in the Element by Hall et al. (Reference Hall, Evans and Kim2023); third, we emphasize the key role of the financial crisis in the determination of the success of populists, also due to the strong incentives of political entrepreneurs to politicize this issue that captured and interested the middle class – a point well illustrated by De Vries et al. (Reference De Vries, Hobolt and Walter2021). It is useful to zoom separately on these three contributions.
1.6.1 Voters’ Reaction to Shocks
Regarding the first contribution – namely, the channels through which economic shocks can alter political preferences – the macro-level arguments explaining how major economic shocks influence key cleavages and political coalitions are developed in the works of Gourevitch (Reference Gourevitch1986), Rogowski (Reference Rogowski1987), Kriesi et al. (Reference Kriesi, Grande, Lachat, Dolezal, Bornschier and Frey2008), and Bartels (Reference Bartels2014).
For the micro-level analysis of the effects of individual shocks on individual preferences and voting behavior, perhaps the richest empirical studies are Malhotra and Margalit (Reference Malhotra and Margalit2010), Dancygier and Donnelly (Reference Dancygier, Donnelly, Bermeo and Bartels2014), and Ahlquist et al. (Reference Ahlquist, Copelovitch and Walter2020), while on the theory side the role of self-interest is underlined in Meltzer and Richard (Reference Meltzer and Richard1981), Iversen and Soskice (Reference Iversen and Soskice2001), and Mares (Reference Mares2006).
Our contribution here is to reinforce the view that economic shocks do not affect ideologies, but rather the policy preferences for people of the different ideologies. As emphasized in Campbell (Reference Campbell1960), ideological dispositions rarely change. Even significant economic shocks do not change voters’ preferences or views from left to right or vice versa: ideologies tend to persist over people’s lifetime (Krosnick and Alwin, Reference Krosnick and Alwin1989; Newcomb, Reference Newcomb1967) and are resistant to new information (Taber and Lodge, Reference Taber and Lodge2006). However, “within” one’s ideology a significant economic shock can affect trust, willingness to participate in politics, and the decision to continue to support a traditional party or to embrace a new movement.Footnote 6
Golder (Reference Golder2016) and Hobolt and Tilley (Reference Hobolt, Tilley and Laffan2018) focus on an emotional channel for the differential effects between left and right. They focus attention on the anger against the status quo, which often translates in hate or resentment against existing institutions and newly included members of society that should instead be excluded. In our Element we do not focus on the emotional aspects, but rather on the (potentially complementary) rational comparison between exclusionary policies and inclusive redistributive welfare policies. The increase in salience of cultural divisions emphasized by De Vries and Hobolt (Reference De Vries and Hobolt2020) can be perfectly consistent with our conceptual framework. In fact, we stress that even this change in salience may be in part generated by a lower confidence that the economic protection can be obtained other than with exclusionary policies.
As shown in Margalit (Reference Margalit2013), the experience of a job loss typically makes individuals more likely to support welfare measures of the left. But, as we will see, the financial crisis hits in particular the occupations with steep age-earning profiles, namely with potential growth of income over time when initial investments are made possible, and this class of people, such as small employers, typically displays a right-wing propensity. Like us, Oesch and Rennwald (Reference Oesch and Rennwald2018) identify small employers as one of the key swing groups between the center-right and the radical-right (in their categorization) or between opposing and favoring exclusionary policies (in our framing), but our framework and methodology allows us to see why this swing group (together with others with similar age earning profile) reacted to the financial crisis more than to other crises.
1.6.2 Occupational Groups and Parties’ Platforms
As far as the second contribution is concerned, we agree with the Hall et al’s (Reference Hall, Evans and Kim2023) perspective that gives a key role to occupations and views party strategies (in terms of platform choice) as best responses to the changes of political preferences of the occupational groups that they traditionally represent.Footnote 7 We zoom in particular on the role of the 2008 financial crisis but enlarge the analysis to all European countries. Their analysis is instructive on existing pre-trends and connects well also to the theoretical framework that we discuss in the next section. To anticipate, in our framework the preferences on the socio-cultural dimensions that are typical of populist parties can be shaped by changes in the credibility of different policies after crises. Hence, looking at the different impact of the financial crisis on the fears and expectations of different occupations can explain the positioning of parties on both the economic and cultural dimensions.
The employment transformations already started in the 1990s, with jobs being created in the service sector and information technology (see Oesch, Reference Oesch2013; Goos et al., Reference Goos, Manning and Salomons2009; Autor and Dorn, Reference Autor and Dorn2013) obviously matter, but the financial crisis is the one that created fear also for people in occupations with steep age-earning profiles, hence enlarging the pool of social groups and occupations feeling in danger. A set of scholars contends that the creation of populist attitudes relates mostly to the increasing cultural difference between the progressive and inclusive cosmopolitans and those wanting to protect and preserve the identity of the true people (the true settlers, looking at the manifesto of the People’s Party of Bryan in 1890). Our results will support the possibility that the increase in identity politics and exclusionary policy preferences derive from a deterioration of trust in the ability of government institutions to protect the losers from market competition with inclusive welfare policies.Footnote 8 Hence, the economic and cultural dimensions do not evolve independently; they both depend on the changes in beliefs and trust in the feasibility and desirability of different economic policies.
Thus, in contrast with Inglehart (Reference Inglehart2013), Kitschelt (Reference Kitschelt1994), Kriesi et al. (Reference Kriesi, Grande, Lachat, Dolezal, Bornschier and Frey2006), De Vries et al. (Reference De Vries, Hakhverdian and Lancee2013), and Häusermann and Kriesi (Reference Häusermann, Kriesi, Beramendi, Häusermann, Kitschelt and Kriesi2015), we do not frame the political transformation related to populism and its causes as a horse race between the economic and cultural hypotheses. Most importantly, the financial crisis operates almost exclusively on the economic policy preferences, and it would be difficult to identify a direct influence on the cultural dimension that is not mediated by the negative shock on the feasibility of inclusive redistributive policies.
Our interpretation of the fact that radical-right parties have become more important contenders for power, increasingly crucial to governing coalitions on the right (Kriesi et al., Reference Kriesi, Grande, Lachat, Dolezal, Bornschier and Frey2006, Reference Kriesi, Grande, Lachat, Dolezal, Bornschier and Frey2008; Bornschier, Reference Bornschier2010; Häusermann and Kriesi, Reference Häusermann, Kriesi, Beramendi, Häusermann, Kitschelt and Kriesi2015; Hooghe and Marks, Reference Hooghe and Marks2018; Rovny and Polk, Reference Rovny and Polk2020; Marks et al., 2021), is that this is not only due to a greater salience of the cultural dimension, but also to a reduction in trust that other policies, non-exclusionary and hence more inclusive, can work. And this lower trust is the variable affected by the financial crisis, our focus in this Element.
Hall et al. (Reference Hall, Evans and Kim2023) find that, between 1990 and 2018 across eight countries, cultural preferences generally shifted in a more cosmopolitan direction – likely driven in part by the sharp rise in tertiary education. In contrast, they observe a consistent shift to the right on the economic dimension. As we argue in our theory section, declining trust in the feasibility of inclusive, redistributive welfare policies fosters protectionist and nationalist preferences in both economic and social spheres. This, in turn, contributes to growing affective polarization on the cultural dimension, as exclusionary policies increasingly conflict with cosmopolitan and universalist values, producing divergent effects on political engagement and turnout. Hall et al. also show that the shift toward economically right-wing preferences is not limited to workers but extends to small employers, particularly after 2006, aligning with our finding that the financial crisis expanded economic vulnerability to include the middle class. Meanwhile, cultural attitudes became markedly more cosmopolitan among professionals, skilled white-collar workers, lower-level service workers, and managers, whereas production workers, craft and trade workers, and small employers showed little change in their cultural views on average.
Hall et al. (Reference Hall, Evans and Kim2023) use the schema devised by Wagner and Meyer (Reference Wagner and Meyer2017) to group parties into the categories of mainstream left, mainstream right, and radical-right and examine the movement of these party families in the two-dimensional space of economic and cultural positions across all eight countries over the period between 1990 and 2018. We do not group parties that way, because the notion of populism has only a partial overlap with extremism and radicalism. What constitutes the logical link from crisis to support for populist parties is different from the emotional link from anger to hate. However, their classification is nonetheless useful for us to illustrate some parts of our argument that relate to different types of protection policies and their appeal to voters of different occupations and ideologies. Both types of analysis support the view that the change came mostly from the radical right parties (in their analysis) and new populist parties and movements (in our analysis) who moved their economic positions to the left in order to capture the concerns of the occupational classes most concerned by technological change and globalization and now access to credit.
After the crisis, the share of voters experiencing economic insecurity – and therefore demanding economic protection typically associated with left-wing policies – expanded. Beyond this quantitative shift, many of these voters also lost confidence in the feasibility of maintaining, let alone expanding, inclusive welfare policies. As a result, support for exclusionary, conservative positions on the cultural dimension also grew. In other words, for individuals seeking economic protection and weighing the relative merits of traditional redistributive welfare policies versus exclusionary measures – such as anti-immigration and discriminatory policies – the latter become increasingly attractive when the former are seen as less feasible. This shift is further reinforced when trust in politicians’ commitment to protective goals is low. The financial crisis played a significant role in undermining confidence in the viability of open-market solutions, thereby contributing to growing support for policies favoring closed markets, closed borders, and a more exclusionary societal model.
Kitschelt and Rehm (Reference Kitschelt and Rehm2023) interpret electoral realignment of parties as follows: they argue that people with different levels of income and education have stable preferences on economic and cultural issues but salience changes. We argue that crises change preferences for policies by affecting trust and beliefs on what can work. Moreover, we agree with Hall et al. that occupations matter as much as income and education levels.
1.6.3 The Entrepreneurship of Manipulation and Euroskepticism
De Vries (Reference De Vries2018) and Hutter et al. (Reference Hutter, Grande and Kriesi2016) are examples of political analyses of the public opinion backlash against European institutions. De Vries et al. (Reference De Vries, Hobolt and Walter2021) discuss the important role of political entrepreneurs of challenger parties on the extreme left and extreme right to channel the public discontent toward European institutions to gain votes. They argue that what is new in recent years is the level of politicization of the arguments pro and against international cooperation and their salience.
Our Element clarifies why this politicization (and, in particular, manipulative politicization) may have become easier as a consequence of the financial crisis. The key role of the financial crisis in the determination of the success of populists is due to the strong incentives of political entrepreneurs to politicize the issue of how much European institutions constitute a constraint to the implementation of simple protection policies – policies such as citizenship income, reduction of pension age, low carbon prices ignoring green external mandates, and so on. Moreover, as we also argued earlier, the issue of external constraints to simple protection commitments becomes salient also for the middle class, given the shock determined by the financial crisis on the confidence in open markets and market integration. The increased salience of the inability of European institutions to counter the crisis gave overall a greater push to the mobilizers of discontent. The analysis of parties’ manifestos in this Element confirms the anti-internationalism trend on both sides of the ideological spectrum.
The financial crisis has increased Euroskepticism (Fernández-Albertos and Kuo, Reference Fernández-Albertos and Kuo2016; Hobolt and De Vries, Reference Hobolt and De Vries2016), but we stress, in line with our proposed mechanism, that it is mostly in occupations with steep age-earning profiles and small employers that this changed after the financial crisis. For example, a party such as Lega in Italy changed its policy platform after the financial crisis, promising policies that could be implemented more likely in the absence of European constraints, legal constraints, and constraints in terms of macro stability.
1.7 Contribution to the Political Economy of Populism Literature
The conceptual framework developed in Bellodi et al. (Reference Bellodi, Morelli, Nicolo and Roberti2025) and the theory proposed in Section 2 of this Element, which adapts the logic of commitment politics to the differences we want to explain, together push the view that populist policy commitments are a political strategy. The typical features of populist platforms can be traced back to the shift to commitment politics, which in turn emerges naturally at a time of increasing distrust, which is itself shown to be endogenous.
Technological change, and in particular the use of the internet and social media for political communication, have endogenously reduced trust in political agents, and this reduction in trust has increased the use of simple policy commitments; in turn, once political campaigns become more and more focused on policy commitments to voters, this determines the rational use of typical populist strategies such as anti-elite rhetoric, misinformation, and rhetoric and actions against judges, bureaucrats, and all checks and balances to make the executive as free as possible to implement the promised policies.Footnote 9
Our theory presented below makes this general logic more specific to the financial crisis by zooming in on the particular type of policy commitments that we can call commitments to protect. The financial crisis makes governments, and especially those with low fiscal space, unable to continue to support traditional welfare programs. This makes those affected by the market shocks shift to demand of simple exclusionary commitments.
There is an immense literature on the economic and cultural causes of populism. The survey article by Guriev and Papaioannou (Reference Guriev and Papaioannou2022) contains almost all of them. Gidron and Bonikowski (Reference Gidron and Bonikowski2013), Mudde and Kaltwasser (Reference Mudde and Kaltwasser2017), and especially Norris and Inglehart (Reference Norris and Inglehart2019) highlight the relevance of cultural backlashes, which clearly occur simultaneously with an increase in economic insecurity. Both economic and cultural factors matter, but here we want to zoom in particular on the strands of this literature related to the financial crisis and to the role of the fiscal space. Foster and Frieden (Reference Foster and Frieden2017) present the correlation between distrust measures and debt using the Eurobarometer survey. Algan et al. (Reference Algan, Guriev, Papaioannou and Passari2017) show that in elections after 2008, the regions where unemployment rose saw the sharpest decline in the trust placed in institutions and traditional politics,Footnote 10 while Dustmann et al. (Reference Dustmann, Eichengreen, Otten, Sapir, Tabellini and Zoega2017) show that in the aftermath of the crisis, the distrust of European institutions was correlated with the populist vote. Using the age-earnings profiles typical of different occupations, we are able to directly identify the channel through which the specific features of the financial crisis (primarily the inability to borrow) impacted each cohort of citizens in Europe. We are therefore able to provide evidence of causal effects by differentiating such effects across cohorts with different occupational distributions.
There is an interesting literature on financial crises as determinants of extremism (see, for example, Funke et al. Reference Funke, Schularick and Trebesch2016 and Galofré-Vilà et al. Reference Galofré-Vilà, Meissner, McKee and Stuckler2021).Footnote 11 Our analysis of the 2008 financial crisis emphasizes their impact on the political orientation and feasibility of policy platforms on either side of the political spectrum, rather than focusing on extremism specifically.Footnote 12 Voth et al. (Reference Voth, Doerr, Gissler and Peydró2020) were the first to present causal evidence that a financial crisis can fan extreme right populism, based on variation in failing banks in Germany prior to the 1932 elections. In contrast to their findings, we show that the 2008 financial crisis shifted politics in the direction of populism on a broader scale, rather than only on the right. Indeed, the transformation after 2008 occurred primarily on the left.Footnote 13 Furthermore, our method of identification makes it possible to zoom in on the heterogeneous impact of the financial crisis by occupation and to identify the mechanism that creates economic insecurity, regardless of preexisting anti-Semitism or some similar types of ideology.
On the relevance of the fiscal space, Arias and Stasavage (Reference Arias and Stasavage2019) and Fetzer (Reference Fetzer2019) look at the political costs of austerity politics, although they ignore the dynamic transformation we focus on. The role of fiscal constraints in shaping political trust and populist support has also been documented in the Latin American context by Baccini et al. (Reference Baccini, Hicks and Rettl2025). Indeed, we find that it is precisely in the countries with the smallest fiscal space that the financial crisis had a greater impact on politics (and especially on the left).Footnote 14
Rodrik (Reference Rodrik2018) traces the increase in populism to the globalization shock. While this may be true when considered in isolation and for specific events,Footnote 15 Guiso et al. (Reference Guiso, Herrera, Morelli and Sonno2019) show that globalization shocks alone cannot account for the cross-country pattern of populism in Europe. They show that the interaction of globalization with a euro-dummy accounts for the large majority of the explanatory power, and, in the presence of such an interaction variable, globalization shocks alone have little effect. In Section 7, we show that whereas the supply of populism displays a discontinuous jump in 2008, there was no similar increase in 2004, the year of the globalization shock due to the expansion of the EU. One may argue that, in a deep sense, the globalization shock is the root cause of populism, because a macro literature traces the burst of the crisis to the imbalances that originated from globalization. What we show is that a globalization that does not involve a financial crisis is unlikely per se to generate the spread of populism that we have witnessed in Western countries, particularly in countries that are heavily dependent on credit and financial markets.
Moreover, while globalization primarily reduced trust in free markets, the conjunction of the financial crisis and shrinking fiscal space reduces trust in all other institutions as well. It is the collapse of confidence in representative democracy that increases the demand and supply of simple protection commitment policies such as walls, protectionism, and Brexit.
The rest of the Element is organized as follows: Section 2 draws the conceptual framework that generated all our ideas on the role of all crises, and in particular the financial crisis, on voters’ policy preferences and on asymmetric turnout. Parties enter the picture simply in terms of whether they are likely to adopt a populist protectionist commitment or not and why. Section 3 describes our data and measurements. Section 4 describes the important role of voters’ participation incentives and displays descriptive results that are in line with the asymmetric turnout effects of crises that we explain in the theory. Section 5 describes our empirical methodology and identification strategy, and Section 6 displays causal estimates of the effects of the financial crisis on all aspects of voters’ preferences and behavior. section 7 uses manifestos of parties to show the different effects of globalization and the financial crisis on the party structure and policy platforms. Section 8 analyzes strategic entry and strategic positioning by parties in the aftermath of the crisis and looks at the convergence of platforms across parties on each side of the political spectrum using expert surveys. Section 9 concludes with some remarks on the persistence of some of the effects of the financial crisis.
2 Theory
In this section we aim to clarify the effect of a crisis on voters’ preferences on policies through a simple theory on the voters’ thought process when evaluating the pros and cons of the open market status quo with a policy commitment proposal to close markets and/or borders. In the first part of this section we take it as given that there exists a choice like this for a voter, and only at the end of the section we explicitly consider the intuitive conditions for entry of populist parties with such a type of policy closure commitments on the supply side.
2.1 Voters’ Preferences on Closed vs Open Markets
We start from a voter’s evaluation of the tradeoffs involved when considering her expected utility from an open market status quo versus a protectionist reform that would cut out competitors to the voter’s employing firm or potential employing firms, reducing also the instability and market dependence on prices and wages.Footnote 16 The perception of threat to jobs and wages created by the technological changes that were permitting greater and greater open market integration was the central cause of populist voting already in the United States in the last quarter of the nineteenth century.Footnote 17 The globalization literature on the role of the China shock in the determination of populist voting in many Western democracies in the twenty-first century gave rise to an analogous tradeoff. The same tradeoff must have been a central one in the decision by American voters to vote or not to vote for Donald Trump, who made protectionism a central pillar of his campaign(s). Since this key tradeoff has been at the center of so many studies on the fears and insecurities that led to populist voting, let us zoom on this tradeoff.
When evaluating her prospects in an open market status quo, we can simplify the voter’s thought process as follows: she has a belief  to be a winner from the open market and a probability
  to be a loser from it. Let us normalize the utility for a winner to 1 and the loser’s utility to 0.Footnote 18 However, in the open market status quo, with a representative democracy determining the functioning of government institutions, the voter expects that in case she turns out to be a loser from the market process, she will be compensated by such institutions with probability
  . For example, if a voter expects that her government has both “the objective” to protect the losers from market competition with redistribution or public jobs and “the capacity” to do so, then
  is a high number; whereas if one expects the government either to be attentive to other objectives (or interest groups’ influences) or not to have the capacity to compensate, then
  is a low number. Putting things together, the expected utility from an open market status quo (
 ) with a representative government that could, in principle, try to compensate losers is
 (1)
(1)We can think of  as representing the voter’s self-confidence in her skill and the fit of such skills for the open competition. Hence,
  can be very different from voter to voter, because it depends on education, acquired skills, psychology, and so on.Footnote 19 The second parameter,
  , captures in a nutshell “trust” in the government, where once again trust can be high or low depending on both the government or politicians’ objectives and incentives on one hand and capacity on the other. One might have low trust because she does not think that politicians will even care and try to compensate, derailed by other objectives, or may think that the objectives are aligned but there are not enough resources to effectively counter the negative market prospects of a market loser. We will come back to these components of trust when we introduce the mechanism through which the financial crisis and fiscal space interact.
A protectionism reform can be captured for simplicity by a fixed expected utility  that the voter expects if all external competitors are shut out of the market.Footnote 20 The expected utility
  parsimoniously captures the perception of many workers and/or firms that, on the one hand, the market winner’s payoff is higher in an open market, but, on the other hand, with no competitors, her industry, job, and wage are sheltered, and hence the low loser’s payoff can be avoided.
Thus, a voter prefers a protectionist commitment iff
 (2)
(2)Hence, a voter is the more likely to support a protectionist commitment the lower are her confidence  and her trust
  , and the higher is her expected utility from protectionism
  . Even though in reality voters are heterogeneous in all these three parameters, let us simplify the analysis by assuming
  is fixed for all; and as far as
  is concerned, let’s assume for simplicity that it can take two values,
  and
and  , where
  ,
,  represents the expected utility of the protectionist policy for voters of ideology
  , where
  denotes the standard left(right) ideology. Given that the populist exclusionary commitments typically include not only protectionism in trade policies but also closed borders and nationalist policies on multiple dimensions, we can safely assume that
  : The typical left ideology dislikes exclusions, closed borders, closure to other cultures, and so on; hence, a policy bundle based on exclusions and closures gives lower overall utility to left-wing voters. Assuming a fixed share
  of left-wing voters in the population, we denote by
  the average utility from a bundle of closure policies.Footnote 21 Finally, we let
  be distributed on the interval [0,1] with density
  . Assuming that a polity has a unit mass of voters, the standard economic belief that free trade is good in the aggregate can be captured by the following assumption:
Market Efficiency Assumption (MEA):  .
.
Even if all voters believe in the MEA, consistent with most economic studies, it is clear that those for whom (2) holds prefer the protectionist commitment.
2.2 The Effects of Different Types of Crises
A globalization shock, caused, for example, by a technological change making transportation of goods easier or by innovations and new competitors (humans or robots) who appear as external threats, typically determines a reduction in  for some classes or occupational groups. Thus, the common opinion that globalization shocks like the entry of China into the WTO may have been a trigger of populism can be parsimoniously captured by this heterogeneous reduction in
  values in the model. In the binary simplification below, where
  can take only two values,
  and
and  , the globalization and automation shocks affect mostly
  , namely the probability of success for low-skill individuals (or individuals working in exposed industries).
A financial crisis such as the Great Recession affects all levels of  and
and  : an economic agent who was counting on good access to reliable financial markets and banking for her economic prospects and future now sees the probability
  of the good outcome go down and, at the same time, perceives a lower
  that market and government institutions can “bail” her out in case of a negative realization of economic conditions. The financial crisis made most market operators tighten credit, and government institutions had a hard time helping the many losers. Thus, and naturally more so in countries with very low fiscal space,
  must have been shocked downward. Given that
  applies to all, this common component of the crisis effects is what relates in the model to the enlargement of the set of people for whom (2) starts holding after the crisis.
The importance of the trust parameter  can also be appreciated through a number of historical comparisons. At the time of increased import exposure and price instability exposure caused by technological change in the US after the Civil War, there were no income taxes (only una tantum taxes to recover from the Civil War and reconstruction costs). Hence, when the Democratic Party saw the growing success of the People’s Party in 1890 and 1892 with a protectionist campaign due to the perceived effects of market integration on
  , they managed to take back such voters by acknowledging such grievances and by making a pledge to support the demand for a graduated income tax, which had been one of the economic policy components of the People’s Party platform. A federal progressive income tax system came later, but the alignment of the Democratic Party with those stances of the People’s Party was enough, because in case of success of the introduction of redistributive taxes, the perception was that
  could be high. On the other hand, in the twenty-first century the vast majority of liberal democracies are plagued by high debts and low fiscal space, in spite of income taxes already on the downward-sloping portion of a hypothetical Laffer curve. Thus, in the twenty-first century the “capacity” part of the trust parameter
  is very low. Hence, it is more difficult to gain back the support of those who shifted their support to populist protectionist parties.
In all historical cases it is the case that the populist campaigns focused a lot on corruption, and on capture by the elites, and on difficult accountability of traditional politicians, because that “objectives” component of  does not depend on the capacity component, and hence regardless of the latter, an anti-elite and corruption denunciation rhetoric play well as complementary to a protectionist commitment.Footnote 22 In other words, if a party or politician proposes itself as a credible protectionist, then it is in their campaign strategy interest to focus the campaign on further reducing
  with claims or pointers to the capturability of traditional discretionary politicians by interest groups. Anti-elite rhetoric is therefore a clear complement to a policy commitment strategy, especially when running against a candidate proposing themselves as able to handle the potential consequences for some people of a free market economy that is efficient.Footnote 23 Given that anti-elite rhetoric is one of the key elements of what constitutes the measure of populism in parties and politicians in political science, the association of populists with parties and politicians championing protection policy commitments is an “equilibrium” one. Anti-elite rhetoric can also be linked directly to
  and
and  : if the financial crisis and its handling have determined an increase in the belief that elite capture of the institution is responsible, then a corresponding reduction in
  for non-elite members follows naturally, as well as a reduction of
  .
.
A similar logic could be invoked to capture the tradeoff between open- and closed-border policies: on the one hand, in many European countries the demographic trends and the sustainability issues for social security systems make many economists think that free movement of labor is good in the aggregate for a country, and the pros of open borders on average dominate the cons. But, on the other hand, those who fear losing the job or jobs for their children or fear lower wages may support closed borders in spite of what economists claim on the aggregate effects. This is especially true when there is low trust in the willingness or capacity of institutions to protect potential losers under open competition. As the literature on social identification suggests (see, e.g., Bonomi et al. (Reference Bonomi, Gennaioli and Tabellini2021) and the survey by Nouri and Roland), voters who fear being on the losing side of markets have shifted from identifying with other poor people and demanding redistribution, to identifying with their social or ethnic group and demanding protection through exclusion of outsiders – external competitors, other groups, and minorities.
Thus, the logic behind closed border policies is very similar to that behind closed market protectionism. If the protectionist policy bundle on the voter’s table also contains closed borders and anti-immigration stances, the difference between  and
and  can be expected to be larger than in the case of economic protectionism alone. This is because left-wing ideology is socially more inclusive, and hence the threshold to switch to an exclusionary immigration policy is much higher for left-wing than for right-wing voters. The implication is that when
  is shocked downward by a crisis, a disproportionately large fraction of the voters who shift from opposing to supporting condition (2) are right-wing.
2.3 The Consequent Cultural Clashes
One of today’s most pronounced cultural cleavages pits the traditional left’s progressive, inclusive vision – centered on diversity and equal opportunity – against a conservative impulse to protect identity by excluding immigrants and minority cultures from the political agenda. In other words, an “open” versus “closed” society. While other external factors (see Section 1.6) may also have heightened this divide, our key argument is that polarization on cultural issues can emerge naturally from shifting preferences over economic openness versus protectionism, even if individual ideologies remain unchanged.
In fact, for a moderate voter with no animosity against other groups based on hate or conflict history or whatever, but simply concerned about jobs and wages and alike, the decision to endorse a protectionist policy in the economic domain goes hand in hand with a closed borders support, which naturally leads to support a politician who campaigns on a set of exclusionary commitments. Thus, even moderate people now split in supporters for exclusion versus inclusion, even though they are still the same ideologically moderate people.
While any type of economic crisis may shift individual preferences toward protectionist commitments, it is important to distinguish which occupational groups are primarily affected. In our simplified model with two types of agents – those with low and high baseline probability  of being a market winner – globalization shocks (e.g., the China shock) mainly reduce
  , thereby increasing insecurity particularly among occupations already vulnerable to external competition. Financial crises, by contrast, typically affect both
  and
and  . Thus, the above implications for cultural division coming from the policy preferences effects extend to the classes that were not affected by the globalization shock. The increase in survey responses highlighting divisions on inclusion versus exclusion preferences is, therefore, potentially a simple byproduct of the extension of protection commitment preferences to the middle class.
If the model is correct, we should observe that the China shock increased reported economic insecurity mostly among the “low- ” occupations, whereas the financial crisis triggered declines across the board but relatively more for the “high-
 ” group. This suggests that cultural polarization may be an indirect effect of differentiated economic shocks across occupational strata, and the empirical analysis will support this mechanism. Posturing on culturally divisive issues has always been an equilibrium behavior (see Ash et al., Reference Ash, Morelli and Van Weelden2017), but especially so when traditional economic policy positions on left and right lost support across classes due to the crises affecting most of them.
2.4 Turnout Effects
In the simple theoretical framework described so far, we used the language of “preferences” for one or the other policy; but having a preference for one policy over another does not necessarily mean that the voter will turn out to vote. Participation is, of course, a crucial component of elections.
Using the as-if-pivotal voting assumption (see, e.g., Alesina and Rosenthal, Reference Alesina and Rosenthal1996), combined with the standard assumption of an orthogonal distribution of stochastic voting costs, the simplest theory of turnout predicts that a citizen will vote whenever the difference in expected utility between her preferred policy and the alternative exceeds her realized cost of voting. In this framework, citizens who are nearly indifferent between alternatives (i.e., for whom  is very close to
  ) are the least likely to vote.
Thus, a downward shock in  caused by a crisis or corruption scandal is likely to increase abstention among those who previously had
  . Given that the
  shock affects everyone in the same direction, those who were previously abstaining may now shift to voting for a populist protectionist platform. For citizens experiencing a very large drop in the expected utility of the status quo, there can be a direct switch from one voting choice to the other. More commonly, however, the two effects operate separately: abstention becomes more attractive for those who previously supported open markets, while the populist option becomes more appealing to those who were previously near-indifferent and abstaining.
Moreover, given  , the prediction on turnout for left- and right-wing voters when
  is shocked downward by a crisis is different: turnout of left-wing voters may go down because the distribution of
  values is correlated with income and class, such that the increased fraction of potential losers is more concentrated on the left, but since
  is lower such left-wing citizens are more likely to station in the abstention pool; on the other hand, among those right-wing voters who were close to indifferent before the crisis, it is more likely that they jump over to vote for a protectionist closed markets and closed border party, since
  is higher.
Let us illustrate the point with a numerical example.
Suppose  ,
,  ,
,  ; the initial
  was 0.5 and the new after crisis is 0.3. Finally, suppose that among left-wing voters
  is simply that half have
  and the other half have
  . Among right-wing voters, those with
  are actually 70%. Thus, within this numerical example, condition (2) has to be evaluated differently not only for left and right but also for
  and
and  types within each ideology; hence there are four different conditions.
For a high-ability right-wing citizen, the expected utility of open market is 0.75 before the crisis, thus greater than the 0.7 of protectionism; hence before the crisis all the high-ability right-wing prefer open markets. Low ability  types among right-wing citizens have 0.6 from open market, hence they prefer protectionism. On the left, all prefer open markets or borders over closed markets or borders before the crisis because of the much lower
  . So, in terms of preferences between the two alternative policies, only low-ability right-wing citizens prefer to close everything, but for any cost of voting
  we need to zoom in on willingness to turnout as well: for high-ability right-wing voters, the difference in expected benefit between the two alternative policies is only 0.05; hence only those in that set with very low cost realization will turn out to vote. On the other hand, for low-ability right-wing people the difference in expected benefit is 0.1 (in favor of protectionism), and thus the expected turnout among right-wing voters is higher within the low-ability segment. On the left, on the other hand, for high-ability citizens the expected benefit gap is 0.35, and hence they likely vote, if the distribution of costs, for example, goes from zero to 1. Finally, among low-ability left-wing people the expected benefit gap is 0.2, and therefore their turnout rate is somewhere between that of high-ability left-wing and that of right-wing voters. Thus, in the status quo precrisis only low-ability right-wing people would be interested in a populist protectionist policy, and they would almost surely lose, given the higher turnout on the left and low expected turnout on the right. Hence, a populist party might not even enter the race.
After the crisis, which shocks downward  to 0.3, the picture changes:
Now all right-wing citizens prefer the protectionist policy, but the benefit gap is 0.05 (the opposite direction wrt precrisis) for high ability and 0.26 for low ability. So the high-ability right-wing people have the same turnout rate as before crisis, but the turnout rate among low-ability right-wing citizens jumps significantly up. On the other hand, on the left we have that the high-ability types continue to prefer openness but with an expected benefit gap of 0.25, hence a reduction in turnout; the low-ability left-wing have a benefit gap of only 0.04, hence they almost all stay home rather than voting. Thus, this example clarifies that
Remark. a crisis can definitely shock downwards the turnout on the left and shock upwards the turnout on the right, increasing thereby the probability of victory of a populist protectionist.
Formally, assuming costs of voting distributed uniformly from zero to one and a discrete support for  , the turnout rate within group
  ,
,  is
is
 (3)
(3)
and hence expected turnout for group  increases (decreases) when
  decreases if and only if (2) holds (doesn’t hold) before the crisis for such a group.
Whether the market efficiency assumption holds in the status quo before crisis obviously depends on the percentage ( ) of left-wing voters, because, given the correlations mentioned above, left-wing voters typically not only have
  but also have a lower percentage
  of members with
  ,
,  .
.
Formally, MEA holds iff
 (4)
(4)With  the LHS of (2.4) is
  , while the RHS is
  , hence MEA holds. If the crisis is such that
  drops to 0.3, then the RHS drops to
  , and hence MEA continues to hold in the numerical example even after the big drop in
  .
.
Let us now compare the probability of winning for a party proposing the closure commitment before and after the crisis. With  the expected turnout of voters supporting the closure commitment is
  , whereas the total expected turnout in favor of the open market status quo (defended by traditional parties based on MEA rhetoric) is
  plus
plus  . Thus, with these expected turnouts, the probability of winning for the closure party is almost zero. Hence, as intuitively argued below, one might not even expect the closure party to materialize in the electoral race in the first place before the crisis.
After the crisis, expected turnouts change as follows: now the right-wing are all in favor, and their total expected turnout is roughly 0.21, where the left is all against but turnout drops to below that, and hence the probability of winning for the closure commitment proposer is significant and entry by populist protectionist party is guaranteed.
While the example computations above are made by assuming that a crisis shocks only  , it is easy to obtain a similar example even for the case in which a crisis also shrinks
  .
.
To illustrate the example in a compact way, Table 1 reports the expected utility from the open market status quo, the utility from protectionist policies, and the resulting preference and turnout gap for each type of voter. The table compares outcomes before and after a crisis that reduces  from 0.5 to 0.3, using the same numerical assumptions discussed earlier. The turnout gap corresponds to the absolute difference in utility between the preferred and alternative options, which directly maps into the share of individuals within each type expected to vote under the uniform cost distribution assumption.
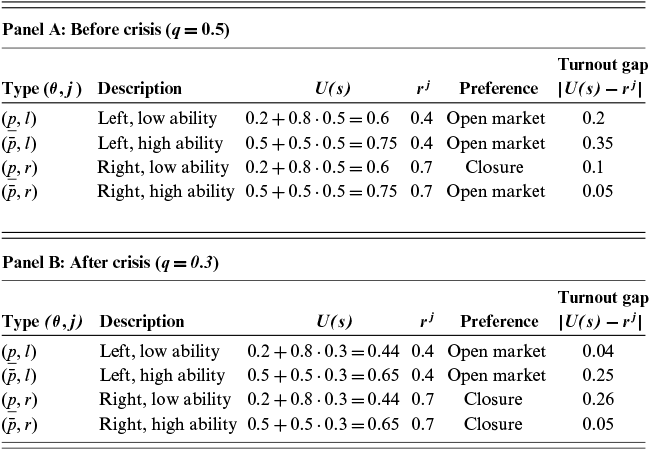
Notes: Each row in the table reports the expected utility from the open market status quo  for a given voter type
  , where
  denotes ability (or perceived benefit from openness), and
  denotes ideology. The table compares this to the utility from protectionist policies
  and indicates which policy is preferred by the voter (based on which utility is higher), along with the absolute utility difference between the two options (Turnout gap), which determines the likelihood of turning out under the assumption of uniformly distributed voting costs. A higher turnout gap implies a greater incentive to vote. The table highlights how a crisis-driven decline in
  can shift preferences toward protectionism among right-wing voters and simultaneously reduce turnout among left-wing voters, thereby increasing the relative electoral viability of populist protectionist parties even if the open market equilibrium remains efficient.
An important note about this example: It shows that even after a big negative shock in trust  in the objectives and or capacity of institutions to make inclusive welfare policies work, the open market status quo can still remain the efficient solution (MEA holds even with
  ); but the probability of winning (and hence the incentive to enter) for a right-wing populist party with a closure bundle of policy commitments jumps up significantly. This is exactly what we observe in the data.
2.5 Entry of Populist Parties
Like for voters, obviously there is a cost of entry also for a political party (organizational cost and opportunity costs). Intuitively, the expected benefit from entering on the competitive supply of politics with a protection commitment campaign is higher, hence outweighing the costs, the larger the pool of citizens who could turn out to vote for them conditional on running. Thus, given the above analysis, it is natural that drops in  or
or  eventually enlarge enough the pool of disillusioned voters such that entry occurs. Thus, if the financial crisis caused a reduction of
  for a new class of voters and a reduction of
  for all, it is natural to expect the financial crisis as a moment of great endogenous transformation also on the supply side.
Moreover, in principle multiple protection policy commitments could come to the voter’s table, perhaps one championing almost exclusively economic protection commitments such as tariffs, quotas, and so on while another bundle of protection commitments by another (typically more right-wing) party includes anti-immigration commitments of a brutal type and other social exclusion policies on other dimensions. The intuitive reason why in a country both a left-wing populist party with weaker closures on the social dimension and a right-wing populist party championing a tougher set of exclusionary policies may simultaneously or sequentially decide to enter the electoral race after a big crisis relates to the turnout message conveyed by the above example: left-wing voters, if they find the status quo depressing, may simply abstain if the only protection alternative on the table has ugly components of anti-diversity, anti-pluralist, and anti-integration stances; hence, if there exists only a tough right-wing populist option the predicted asymmetric turnout effects described above are unavoidable.
A populist party with softer closures on the social dimension can instead attract those depressed and abstaining left-wing voters. Since the entry conditions depend on too many factors outside our model, we do not attempt to obtain a set of sufficient conditions for the existence in equilibrium of one or two or more populist parties on one or both sides of the ideological spectrum, but it is clear that such sufficient conditions always exist, and hence in the empirical analysis we expect to find evidence of greater appeal for populist parties coded to be on left or right for voters of the two sides. Thus, ideology simply partitions incentives. In the empirical analysis of the transformation of the political supply, we will show that indeed the six most important determinants of the populist transformation of manifestos have to do with closures of different intensities on the two ideological sides.
2.6 Transition to Empirics
We present empirical evidence supporting the predictions of our simple model. The survey data described below quantify economic insecurity across occupations before and after the crisis. Because populist parties did not gain the power to immediately change policy in its aftermath, we can map these measures of insecurity directly on our theoretical framework as follows: the economic security of an individual of type  at a time with trust
  is given by
  . Denoting by
  and
and  , our arguments above point to the fact that the globalization and automation shocks should be expected to affect downward
  , whereas the financial crisis affects
  and
and  probably more, and hence empirically we should see a significant change in
  around the financial crisis.
  could, for example, be constructed from the survey responses as the average level of economic security declared by individuals with an age-earning profile above the median.
In the empirical analysis, we will also need to consider voters’ preferences and participation decisions when multiple populist parties exist. In particular, when a populist party positions itself on the left but embraces protectionist economic policies – without adopting the exclusionary or deportation measures that left-wing voters oppose – we would expect left-wing turnout to rise. In this scenario, voters’ perceived utility from a “softer” protectionist platform exceeds their utility under the status quo.
Even if the radical right-wing party and the moderate populist-left party split the protectionist vote, the overall shift in demand toward closure policies makes it more likely that some form of protectionism becomes politically dominant. Stylized predictions on convergence toward protectionism follow naturally: when economic insecurity is widespread, even voters with inclusive social preferences may favor market closure – if such a policy is offered in an acceptable ideological form. The supply dynamics will display a consistent pattern.
3 Data and Important Measurement Choices
The individual data is primarily drawn from the ESS, which systematically tracks socioeconomic status, opinions, and attitudes. It is carried out in all European countries as repeated cross-sections, though not every country participates in every wave. Data has been collected by means of face-to-face interviews biannually since September 2002, where a random sample of individuals is surveyed each time. Sample size varies by country, ranging from 1,000 for smaller countries to 3,000 for larger ones. To study the dynamics of populist party support, we use all eight waves up to 2016.
We extract from them a synthetic panel after grouping people into fourteen 5-year birth cohorts of men and women in each country, as in Deaton (Reference Deaton1985). These waves cover the full cycle preceding and following the financial crisis. By 2016, almost all European countries had recovered to the levels of income prevailing in 2006 and, as we will show, by 2016 individual economic insecurity was back down to precrisis values. The ESS questionnaire consists of a core module, which is fixed from round to round, and smaller-scale rotating modules on selected topics that are repeated at intervals. We focus on the core module, which covers a wide range of social, economic, political, psychological, and demographic variables. Table 2 presents the descriptive statistics.Footnote 24
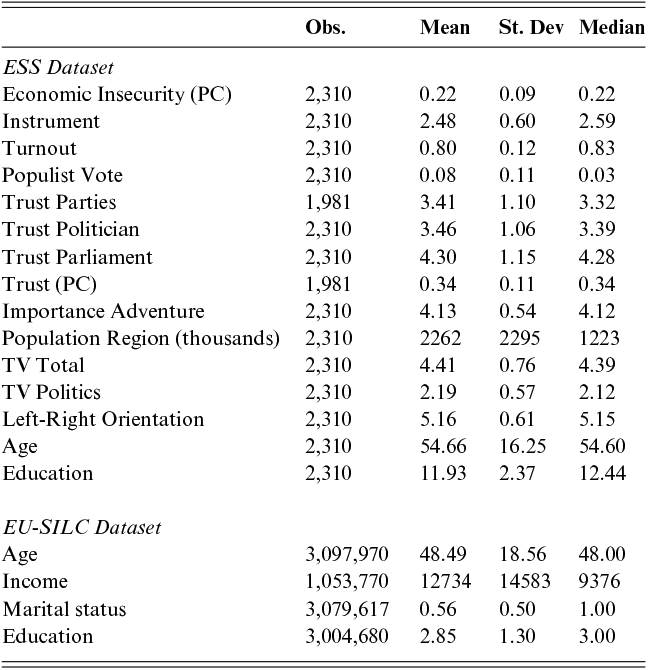
Table 2 Long description
ESS Dataset section includes fifteen variables with 2,310 observations each except Trust PC and Trust Parties with 1,981. Key means: Economic Insecurity 0.22, Turnout 0.80, Populist Vote 0.08, Trust Parties 3.41, Age 54.66, Education 11.93. EU-SILC section includes Age with mean 48.49 over 3 million observations, Income with mean 12,734 over 1 million observations, Marital status mean 0.56, and Education mean 2.85.
Notes: Authors’ computations based on the European Social Survey (ESS) data and the European Union Statistics on Income and Living Conditions (EU-SILC) data.
Voter choice and turnout. The ESS asks respondents whether they voted in the last parliamentary election in their country and which party they voted for.Footnote 25
This provides us with an indicator of turnout and an indicator of voting for a populist party. The method for identifying these parties is described in detail below.Footnote 26
Age-earnings profiles. As discussed in Section 5, constructing the instrument for economic insecurity requires individual panel data with well-measured labor income for each European country in the sample. This is obtained from the European Union Statistics on Income and Living Conditions (EU-SILC), which covers the period from 2003 to 2012. The main purpose of the EU-SILC is to collect information over time on labor market experiences and outcomes for a representative panel of individuals in each European country. In particular, it collects annual data on employment spells and labor earnings, apart from a wealth of demographic characteristics. Since we know the year of birth, gender, and country of the respondents, we can use EU-SILC to retrieve several variables for our synthetic panel, particularly  , the steepness of the age-earnings profiles for each occupation
  , and
, and  , the occupation weights for each cohort and country prior to the 2008 financial crisis. To reiterate, the age-earnings profile is a very relevant parameter for an occupation because the steeper it is, the more it suggests that people in this occupation rely on credit markets at early stages to smooth consumption and for investment. Hence, based on our theory, the cohorts with a large fraction of workers in this type of occupation group should show a particular sensitivity to the financial crisis.
Controls. Two proxies for voters’ ability to understand the pitfalls of the populist platforms are used as controls: education and a measure of attention devoted to politics (details in Appendix B). We also control for age dummies, risk tolerance, and left-right orientation. Education is measured by four dummies indicating quartiles of the education distribution. The measure of attention devoted to politics is captured by two variables: hours per week devoted to watching TV in general and the portion of those hours spent watching news or programs about politics and current affairs.Footnote 27 Watching TV in general is taken as a proxy for low interest in politics and thus being poorly informed about political platforms. The portion of hours spent watching the news and programs about politics is used to proxy information level. Voting for an anti-establishment party may entail some risk and therefore may appeal more to risk-loving voters. Similarly, sensitivity to policies that offer short-term protection at the expense of long-term benefits likely depends on individuals’ subjective discounting. Four age dummies for cohort age quartile are used as a proxy for subjective discounting, on the assumption that older people are less likely to bear the future cost of current policies. The ESS indicator of whether people consider it important to avoid taking risks is used as a proxy for risk tolerance. In all the regressions, we control for political orientation, as measured on a scale from 0 (far left) to 10 (far right).
Economic insecurity. We use three indicators from the ESS data to construct the economic insecurity variable: (1) whether the voter has been unemployed at some time in the past five years, thus forcing him to search for a new job; (2) a measure of financial distress, based on whether the respondent finds it hard to live on her current income;Footnote 28 and (3) an indicator of exposure to the business cycle, based on type of employment, industry, and skill level, such that low-skilled workers in manufacturing are most exposed. The indicator takes a value of 1 if the individual is a blue-collar worker in manufacturing and 0 otherwise. We will find it useful to combine these three objective measures of financial and economic distress into a single composite index of economic insecurity. This will be done by taking the first principal component and rescaling it to vary between 0 (least insecure) and 1 (most insecure). By using this measure, we are agnostic about the specific factor causing economic insecurity.Footnote 29 This composite index maps closely to the theoretical construct  , which captures perceived economic security as a function of a voter’s market position (
 ) and trust in government (
 ). Hence, our measure of economic insecurity empirically proxies for low values of
  and/or
  in the theoretical model.
Figure 3 shows the time profile of our index of economic insecurity using individual-level data when we pool the data in our full sample of European countries. The index is on the rise in the early 2000s, presumably as a consequence of the globalization shock but notably, it jumps significantly with the onset of the financial crisis. Indeed, in 2010 and 2012 it is 20% higher than it was in the first wave of the ESS in 2002. Economic insecurity reverts to the level prevailing in 2002 after the 2014 wave, by which time most countries had recovered from the Great Recession.
Economic insecurity by year
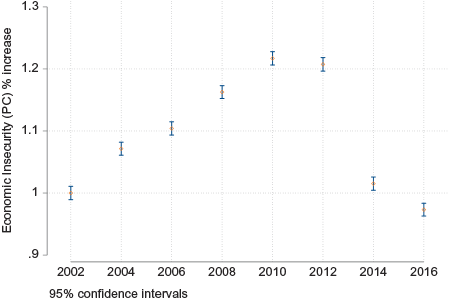
Figure 3 Long description
Insecurity starts near 1.0 in 2002, rises to about 1.08 in 2004 and 1.11 in 2006, accelerates to 1.16 in 2008, peaks at approximately 1.22 in 2010 and 1.21 in 2012, and then falls sharply to 1.03 in 2014 and 0.97 in 2016. Confidence intervals are narrow throughout, indicating precise estimates.
Parties. To identify populist parties in Europe, we rely on the PopuList that was proposed by Rooduijn et al. (Reference Rooduijn, Van Kessel, Froio, Pirro, De Lange, Halikiopoulou, Lewis, Mudde and Taggart2019) and is available at www.popu-list.org. The PopuList is a list of populist European parties that obtained at least 2% of the votes in at least one national parliamentary election since 1998. Peer-reviewed by more than thirty academics, the list is kept up to date with changes in the classification of individual parties over time. Thus, it is a reliable source of information and well suited to our needs. Rooduijn et al. (Reference Rooduijn, Van Kessel, Froio, Pirro, De Lange, Halikiopoulou, Lewis, Mudde and Taggart2019) base their classification of populist parties on criteria derived from the classic definition provided by Mudde (Reference Mudde2004).Footnote 30 We were able to identify 121 populist parties in the sample of 30 countries examined. The full list of parties can be found in Appendix D.
Manifestos. The parties’ policy positions were obtained from the Manifesto Project,Footnote 31 which provides a content analysis of parties’ electoral manifestos in electoral years. The data covers over a thousand political parties starting from 1945. It relies on textual analysis to identify a party’s position on a large number of issues grouped into seven domains. The process yields a total of fifty-six variables.Footnote 32 Each variable is assigned a score that increases with the party’s support of that issue. There are sometimes separate scores measured for positive and negative mentions in the parties’ manifestos.Footnote 33 In order to examine the change in the parties’ positions, we selected one manifesto prior to 2008 and one subsequent to 2008. More specifically, we choose the manifesto closest to 2006, but (strictly) before 2008, and the one closest to 2013, but (strictly) after 2008.
4 Voter Turnout/Abstention
In this section, we take an in-depth look at voter turnout, which has largely been neglected in the literature, and at how it interacts with economic insecurity and populist voting. The analysis here tends to be more descriptive, a stronger identification analysis is presented in the subsequent sections.
The pseudo-panel consists of 840 age/country/year-of-birth/gender groups/cohorts. Cohorts are relatively large, with an average of 358 observations, and therefore measurement error in the cohort is likely to be negligible. Dropping cohorts with fewer than fifty observations (4.8% of the total) does not alter the results.
In Table 3, we split cohorts between left- and right-oriented individuals and compute average turnout in elections taking place before and after the financial crisis, and the rise in economic insecurity. The table suggests that the drop in turnout took place almost entirely on the left. Thus, although voter turnout is on average higher among left-oriented voters, the crisis reduced their participation rate by 1.56%. In contrast, turnout among right-oriented voters hardly changed (and if anything increased slightly). This suggests that left-leaning voters suffered greater disappointment with traditional political parties, which was not tempered by the appearance of populist parties. This first descriptive finding is in line with our theory: the crisis reduces both  (for some occupations in particular) and
  ; hence, those who shift to the demand of protectionism of populist parties are disproportionately among low-income categories and occupations, and it makes sense to observe that turnout decreases mostly on the left: it is voters who previously supported open markets with welfare redistribution who become less convinced and move into the abstention pool, while some of the low-prospects individuals who were previously abstaining now start turning out, but mostly for right-wing parties who champion closure commitments. Hence, both sides of the descriptive finding are consistent with the theory.
| Left | Right | |
|---|---|---|
| Pre | 0.834 | 0.744 |
| Post | 0.821 | 0.746 |
| % change | –1.56% | 0.27% |
Notes: The table shows the pre- and postcrisis average level of turnout among left- and right-oriented individuals, together with their relevant percentage change.
To better understand this phenomenon, we first compute the cohort-specific growth rate in abstention in the vicinity of the crisis by comparing the first election after the financial crisis with the last one before it, which is denoted as  . We then create a country dummy that takes a value of 1 if in that period there is an increase in the number of populist parties available to voters, which is denoted as
  . With those variables in hand, we estimate the following specification and present the results in column 1 of Table 4:
 (5)
(5)where  is the cohort,
  is the country, and
  is time. The variable
  is a vector of time-varying voter controls (described in Section 3), while
  are wave fixed effects. In column 2 we replace the
  with a somewhat different dummy, which takes a value of 1 when the number of leftist (rightist) populist parties available to left-leaning (right-leaning) voters increases in that period. The drop in turnout following the financial crisis shock is smaller in the presence of a populist party on the same side of the political spectrum as the voter.
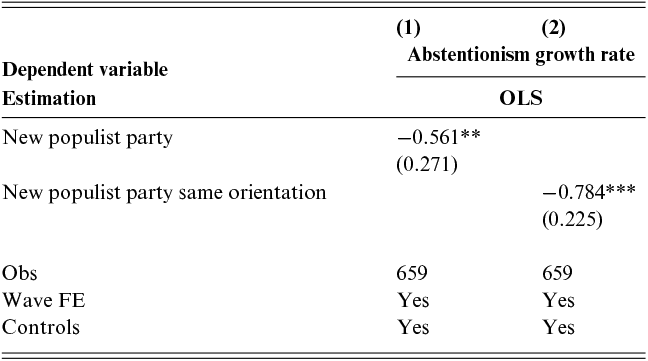
Notes: OLS estimation. Dependent variable: Abstentionism growth rate (comparing the first election after the financial crisis with the last one before it). New populist party is a dummy equal to 1 if there is an increase in the number of populist parties for that country-year. New populist party same orientation is a dummy equal to 1 if there is an increase in the number of populist parties of the same orientation as the cohort for that country-year. In all regressions, we control for wave fixed effects, together with cohort-level time-varying controls described in section 3. Table A11 in Appendix J presents the control variables’ coefficients. Errors are clustered at the cohort level.
These correlations are consistent with the idea that the presence of populist parties mitigated the disappointment of voters on the left and the right, and reduced abstention but only if those populist parties had the same ideological orientation as the voter. A populist right-wing party is one championing exclusionary policies on both economic and social dimensions, and hence if the supply contains only right-wing populist parties, then left-wing voters are more likely to react to a crisis simply by abstaining more.
Table 5 enriches the evidence on the dynamics of voter turnout and choice by splitting the cohorts into two groups: high abstainers, denoted by HA, which are the cohorts in each country with the highest abstention rate in the last election before the crisisFootnote 34 and the complement set of cohorts, denoted by O. We calculate the change in abstentionism for each of the two groups between the current and the following election. Panel (a) shows that abstentionism increases by 9% in the O group relative to the precrisis level; in contrast, it falls by a remarkable 29% in the HA group. Panel (b) shows the mean vote shares received by populist parties in elections before and after the crisis for each group. Populist vote share increases by 32% in the O group, but increases by twice as much (65%) in the  group, suggesting that populist platforms were particularly appealing to disappointed voters. In panel (c) and (d) we split the HA group into two, according to level of economic insecurity (EI).Footnote 35 Panel (c) indicates that the drop in abstentionism in the group HA is similar in both subgroups at about 30%. On the other hand, there is a significant difference between the two subgroups in terms of vote choice: voting for populist parties increases by more than 100% among voters with high EI, compared to only 20% among those with low EI. These data anecdotally suggest that when a populist alternative was available, disappointment translated into a remarkable increase in support for populist parties among the most insecure cohorts. This also motivated them to vote, thus driving abstentionism down. Put differently, the emergence of populist parties mitigated the drop in turnout due to disappointment with traditional parties, and these additional votes tended to go to populist parties.
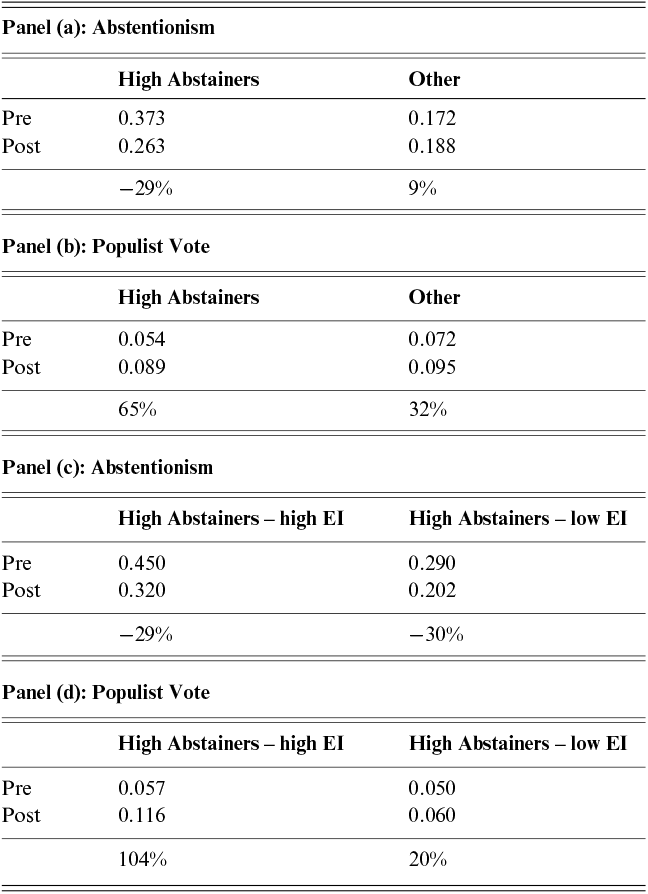
Table 5 Long description
Panel (a): Abstentionism: High Abstainers drop from 0.373 to 0.263, a decrease of 29 percent; Others rise from 0.172 to 0.188, up 9 percent. Panel (b): Populist Vote: High Abstainers rise from 0.054 to 0.089, up 65 percent; Others from 0.072 to 0.095, up 32 percent. Panel (c): Abstentionism among High Abstainers split by economic insecurity: high-EI drop 29 percent from 0.450 to 0.320; low-EI drop 30 percent from 0.290 to 0.202. Panel (d): Populist Vote among High Abstainers: high-EI rise 104 percent from 0.057 to 0.116; low-EI rise only 20 percent from 0.050 to 0.060.
Notes: In Panel (a) we compare the pre- and postcrisis average levels of abstentionism among High Abstainers (which contains for each country the cohorts with the highest abstention rate in the last election before the crisis) and Other (the complement set of cohorts). In Panel (b) we make the same comparison in terms of Populist Vote. In the last two panels we replicate the analyses on Abstentionism, Panel (c), and Populist Vote, Panel (d) but focusing on High Abstainers only, splitting them among High Abstainers - high EI (who are above the median of economic insecurity within the High Abstainers group) and High Abstainers - low EI (the complement set).
Our theoretical framework suggests that declining fiscal space should have heterogeneous effects across the ideological spectrum. When governments face tighter fiscal constraints, the credibility of redistributive welfare policies – traditionally championed by left-wing parties – diminishes. This may lead left-leaning voters to disengage from electoral participation at higher rates than their right-leaning counterparts.
To test this hypothesis, we construct a country-year measure of fiscal space using principal component analysis, combining three indicators: the debt-to-GDP ratio, the labor income tax wedge, and sovereign spreads. Figure 4 shows that this measure exhibits substantial variation both across countries and over time, with a particularly sharp contraction following the financial crisis in peripheral Eurozone countries (PIIGS).
Evolution of fiscal space: PIIGS vs. Non-PIIGS countries
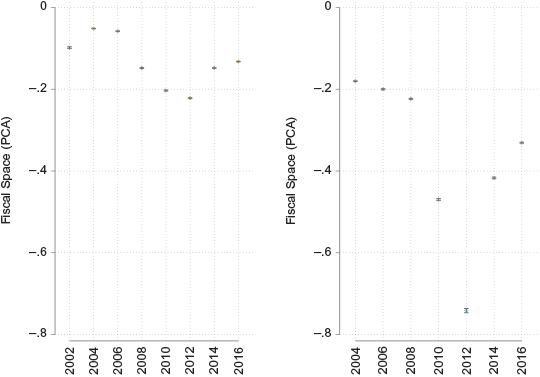
Figure 4 Long description
Panel A, non-PIIGS countries, 2002 to 2016: fiscal space starts near minus 0.1, improves slightly to minus 0.06 by 2006, declines to about minus 0.22 around 2010 to 2012, and then partially recovers to minus 0.15. Panel B, PIIGS countries, 2004 to 2016: starts near minus 0.15, drops to minus 0.2 by 2008, and then collapses to minus 0.4 in 2010 and minus 0.75 in 2012, before recovering to approximately minus 0.4 in 2014 to 2016. The contraction is dramatically steeper for PIIGS countries.
Table 6 presents the results of regressing individual turnout on fiscal contraction, interacted with voter ideology. We find that fiscal contraction is associated with reduced turnout overall, but this effect is significantly amplified among left-wing voters. The interaction term is negative and highly significant: the marginal effect of fiscal shrinkage on turnout is nearly twice as large for left-wing voters compared to right-wing voters.
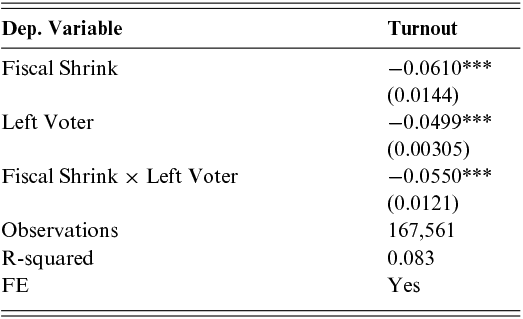
Notes: OLS regression at the individual level. Fiscal Shrink is the (reversed) PCA measure of fiscal space. Left Voter is a dummy equal to 1 if the respondent’s left-right self-placement is  . All regressions include wave and country fixed effects plus individual-level controls. Standard errors in parentheses. *** p<0.01.
This pattern is consistent with our theoretical mechanism: when fiscal constraints tighten, left-wing voters – who place greater value on redistributive policies that become less feasible – experience a sharper decline in the expected utility of electoral participation. Unable to find credible policy alternatives that match their preferences, they disengage from the political process at higher rates than right-wing voters, for whom exclusionary and identity-based protection policies remain viable regardless of fiscal conditions.
5 Identification Strategy
To complement the descriptive analysis above, we now test more rigorously whether increased economic insecurity during the Great Recession in Europe affected voter preference for populist parties and voter turnout. We estimate the following panel-data model:
 (6)
(6)where  is a generic outcome variable (voting for a populist party, turnout, or trust in the political system) for cohort
  in country
  in year
  ,
,  is a vector of time-varying voter controls,
  is the index of economic insecurity, and
  is an error term that varies across cohorts, countries, and time. Unobserved heterogeneity is controlled for by the cohort-specific fixed effects
  . We also include country fixed effects (
 ) and wave fixed effects (
 ) in order to capture common trends in the outcome variables and in economic insecurity and systematic differences in both across countries.Footnote 36
Any effect of economic insecurity on the outcome variable stems from the correlation between changes over time in the economic insecurity of the various cohorts and the corresponding change in the outcome variable. OLS estimation would produce a consistent estimate of the parameter  , which captures the causal effect of economic insecurity on the outcome variable, only if, conditional on the controls and fixed effects, economic insecurity is uncorrelated with the error term. There are two reasons why this may fail: first, despite the presence of cohort-level time-varying controls, the control function may not capture all relevant variables that affect the change in the outcome, and therefore some may end up in the error term and may be correlated with economic insecurity (known as omitted variable bias). The second realistic possibility is measurement error in economic insecurity. As we will discuss in the next section, we use various proxies to gauge individual economic insecurity, yet precisely because they are proxies, they are likely to imperfectly capture the true state of an individual economic insecurity.
In order to address the above problems and focus on the financial sources of economic insecurity, we propose a new instrument. This involves exploiting the heterogeneity across members of the different cohorts in terms of exposure to the financial crisis in order to generate the instrument and obtain exogenous variation in each cohort’s economic insecurity. Specifically, we rely on the idea that individuals who are more dependent on external financing tend to be hit harder by the tighter restraints on borrowing during a financial crisis. To obtain a measure of dependence on external finance we leverage on the idea that individuals that face steeper age-earning profiles need to borrow more intensively in order to smooth lifetime consumption or invest at early stages. Accordingly, they suffer more when a financial shock hits the economy compared to individuals with less steep income profiles. We exploit variation in the steepness of the income profile across types of occupations; for example, originating by differences across occupations in education requirement or on-the-job accumulation of human capital in the tradition of Becker (Reference Becker1962) and Mincer (Reference Mincer1975).
5.1 Building the Instrument
Let  denote the steepness parameter of the age-earnings profile of workers in occupation
  and let
  denote the share of workers that belong to cohort
  in country
  who are employed in occupation
  , relative to all workers in the cohort at the beginning of our sample. Our instrument is then:
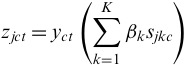 (7)
(7)where  is country
  ’s GDP in year
  , which is set to 1 in 2008. Hence, it captures the dynamics of GDP in a country relative to 2008 and differences across countries in terms of the crisis’ impact on the country’s economy. The instrument allocates the shock to a country’s GDP among the various cohorts according to the relative importance of the various occupations in each cohort and the exposure of each occupation to financial shocks. Hence, when a country’s GDP falls following the onset of a financial crisis, cohorts that have a higher incidence of occupations with greater dependence on external financing should experience a larger increase in economic insecurity. In other words, the instrument
  should correlate negatively with cohort economic insecurity
  . In Section 6, we discuss in detail how the measures of
  were obtained and how we constructed the instrument.
To build the instrument, we first use the EU-SILC panel data for the period 2003–2012 and estimate for each of the two-digit ISCO occupation codes (comprising twenty-six occupations) the following model of labor income:
 (8)
(8)where  is occupation,
  is the individual,
  is the country, and
  is time. The variable
  is logged labor income,
  is the individual’s age, and
  is the residual shock to labor income. The model also includes an individual fixed effect
  that captures relevant time-invariant individual characteristics, a vector
  of controls that include time-varying individual demographics (marital status and education, which vary over time for some members of the sample), and year fixed effects (
 ) reflecting business cycle and aggregate productivity dynamics.
From this estimation, we retrieve the slope of the profile  . The estimated values of
  range from 1.99 to 4.37, with a mean of 3.18 and a standard deviation of 0.53, suggesting that there is a remarkable degree of heterogeneity in ISCO occupation age-earnings profiles. At age 40, an extra year on the job is associated with an increase in labor income that ranges from 5% in the occupation with the flattest profile to 11% in the occupation with the steepest. Table A4 in Online Appendix E lists the occupations and their relative
  .
.
We next use the EU-SILC 2003, 2004, and 2005 waves, for each cohort  and country
  , to compute the weights
  , that is, the share of workers in occupation
  belonging to cohort
  in country
  , prior to the financial crisis shock. We then compute the instrument:
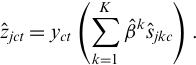 (9)
(9)This instrument captures exogenous variation in  that corresponds to theory-based shocks to
  and
and  : occupations with steeper earnings profiles rely more on financial access in early stages, making them more vulnerable to a fall in perceived success probability
  and in institutional support
  after a financial crisis.
Figure 5 presents a bin scatter plot of the instrument plotted against the index of economic insecurity across the cohorts in our sample, highlighting a clear negative correlation between the instrument and economic insecurity. Thus, cohorts with a higher than average share of individuals in occupations characterized by steep age-earnings profiles experienced a greater increase in economic insecurity when the financial crisis reduced a country’s GDP, that is, when  dropped below 1 in the years following the financial crisis.
The instrument and economic insecurity
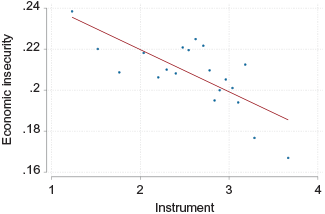
Figure 5 Long description
The x-axis ranges from 1 to 4 and the y-axis from 0.16 to 0.24. Around 20 binned dots are scattered mostly between instrument values of 1 and 3.5. The fitted line slopes downward from approximately 0.235 at the left to 0.185 at the right. Cohorts with steeper age-earnings profiles experienced greater increases in economic insecurity following the financial crisis.
Table 7 presents the results of regressing the instrument against economic insecurity, where the first column controls for cohort, country, and wave fixed effects, and the second adds the cohort-level time-varying controls described in Section 3, thus reproducing the first stage of our IV estimation. The instrument has the expected sign and is highly statistically significant, suggesting that we are likely to have enough power to use this instrument in regressions estimating the effect of economic insecurity on voting and the other outcome variables.
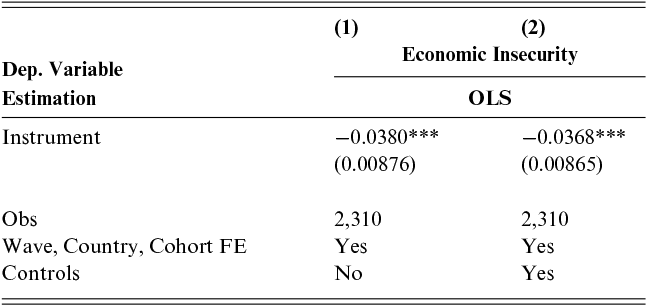
Notes: OLS estimation. Dependent variable: Economic insecurity. Instrument is the variable computed as in equation 9. In both regressions we control for cohort, country, and wave fixed effects. In column 2, we add the cohort-level time-varying controls described in section 3. Table A12 in Appendix J includes the control variables’ coefficients. Errors are clustered at the cohort level.
A potential concern with our identification strategy is that the occupational composition of cohorts – which determines their borrowing sensitivity – may also correlate directly with political preferences, violating the exclusion restriction. In Appendix F, we show that the borrowing sensitivity component of our instrument does not predict political outcomes in the absence of the GDP shock interaction, supporting the validity of our identification strategy.
6 The Financial Crisis and Voters’ Reaction
6.1 Economic Insecurity
We begin our empirical analysis by documenting a salient descriptive pattern: the evolution of economic insecurity across income groups in the wake of the 2008 financial crisis. This provides an initial, non-parametric validation of the theoretical mechanism discussed in Section 2, before turning to more rigorous regression-based identification.
Using repeated cross-sectional data from the ESS, we construct a principal component index of economic insecurity (described in Section 3) and track its evolution across two waves: the one closest to 2006 (precrisis) and the one closest to 2010 (postcrisis). To capture heterogeneous effects by baseline economic status, we split individuals within each country into two groups based on whether their income is above or below the national median.
Figure 6 presents the resulting comparison. The left panel shows that among individuals below the median income, economic insecurity remains largely stable across the two periods. The small postcrisis decline is not statistically significant. In contrast, the right panel reveals a sharp and statistically significant increase in perceived insecurity among individuals above the median. Their average PCA index of insecurity rises by approximately 30%, indicating that the financial crisis caused substantial subjective economic distress even among relatively advantaged individuals.
Change in economic insecurity, below and above median income
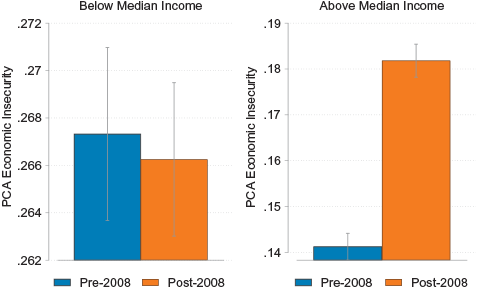
This pattern is consistent with our theoretical framework, where the financial crisis is modeled as a common shock that reduces both the probability of market success (especially  ) and the trust in institutional compensation mechanisms (
 ). While globalization shocks mainly affect low-
 individuals (typically low-income), financial crises extend economic insecurity to previously secure groups, thus reducing the expected utility
  for a broader segment of the population.
To further investigate the specific role of credit market conditions, we exploit variation in the tightening of lending standards across European countries. Using the ECB Bank Lending Survey, we construct a country-year measure of the worsening of credit access conditions for households. For each ESS wave, we classify countries as experiencing above- or below-median credit tightening. Figure 7 presents the results. Focusing on individuals above the 25th percentile of the income distribution – to isolate voters for whom credit constraints are most plausibly binding while excluding those least likely to rely on credit markets – we find that populist vote shares are significantly higher in countries experiencing more severe credit tightening. The difference is statistically significant at the 5% level (p-value = 0.029). This finding provides direct evidence for our theoretical mechanism: the financial crisis affected political preferences not merely through general economic distress but specifically through the credit channel. When banks tightened lending standards, individuals who relied on borrowing to smooth consumption or finance investments – particularly those with steeper age-earnings profiles – experienced a sharper decline in economic security, leading to greater support for populist alternatives.
Populist vote by credit tightening intensity
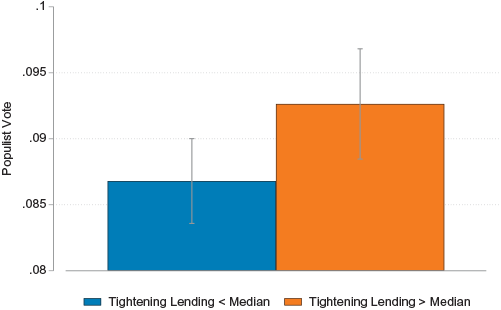
Figure 7 Long description
Left panel, below-median income: pre-2008 insecurity is about 0.267 and post-2008 is about 0.266, with overlapping confidence intervals. Right panel, above-median income: pre-2008 insecurity is about 0.141 and post-2008 rises to about 0.181, a substantial increase with non-overlapping confidence intervals. The crisis disproportionately affected middle and upper-income groups.
In what follows, we estimate the causal effect of economic insecurity on turnout and populist voting, and we examine how political supply responded to the new distribution of insecurity.
6.2 Voting Populist
In light of equation (2) in the theoretical model, rising economic insecurity implies that more individuals satisfy  and thus prefer closure policies. We test this implication by estimating the effect of
  on populist vote shares.
Table 8 presents the estimation results for model (6) where the outcome variable is the share of votes going to populist parties. The first two columns present the OLS estimates, where the first column controls for cohort, wave, and country fixed effects while the second adds the time-varying cohort controls described in Section 3. In both cases, a cohort’s support for populist parties correlates positively with the variation over time in the level of economic insecurity experienced by the cohort in a particular country. The effect is highly statistically significant and of similar magnitude in both specifications. The other two columns show the 2SLS estimation results for the corresponding specification. The effect of economic insecurity on the populist vote is strongly positive and significant. The IV estimates show a larger effect than the OLS estimates, which is consistent with the idea that the index of economic insecurity imperfectly captures economic distress, thus resulting in attenuation bias in the OLS estimates. Based on the estimates in the last column, an increase of one standard deviation in economic insecurity leads to an increase in the populist vote of 7 percentage points, which is about 94% of the sample mean. The Kleibergen-Paap Wald F statistic reported at the bottom of the table indicates that the estimates do not suffer from a weak instrument problem.
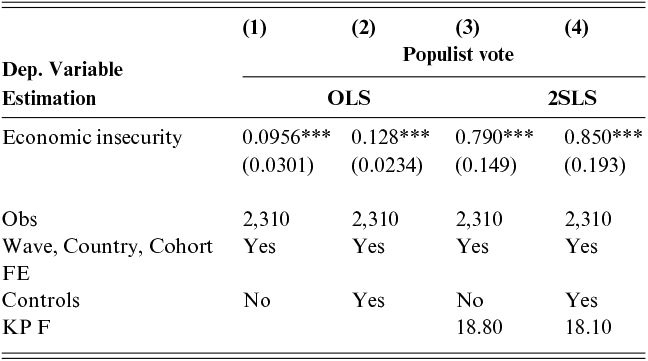
Notes: OLS estimation in columns 1 and 2, 2SLS estimation in columns 3 and 4. Dependent variable: Populist vote. Economic insecurity is the survey-based measure of economic insecurity. In all regressions we control for cohort, country, and wave fixed effects. In columns 2 and 4 we add also cohort-level time-varying controls described in section 3. Table A13 in Appendix J includes control variables’ coefficients. Errors are clustered at the cohort level. Kleibergen-Paap F-statistic are reported for columns 3 and 4.
6.3 Back-of-the-Envelope Calculation
To quantify the contribution of the middle class to the rise of populism, we perform a back-of-the-envelope calculation. Using our 2SLS estimate of the effect of economic insecurity on populist voting ( ), the observed increase in economic insecurity among the middle class (approximately 10 percentage points, as shown in Figure 1, panel b), and the weight of the middle class in the population (50%), we can compute the share of the increase in populist voting attributable to rising middle-class insecurity. The calculation yields:
 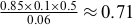 . This implies that the extension of economic insecurity to the middle class – a distinctive feature of the financial crisis relative to earlier globalization shocks – can account for roughly 70% of the observed increase in populist vote shares. This finding underscores the political significance of the crisis’s reach beyond traditionally vulnerable low-income groups: The enlargement of the pool of economically insecure voters to include substantial portions of the middle class was a critical driver of populism’s electoral success in Europe.
6.4 Turnout
Table 9 shows the estimation results for voter turnout, based on OLS (column 1) and 2SLS (columns 2–4) estimates, including in all cases all the controls (cohort, wave, and country fixed effects and time-varying cohort controls). The results indicate that an increase in economic insecurity discourages people from voting. This is true for both the OLS estimates and the 2SLS estimates. As in the case of voting populist, the IV estimate of the effect of economic insecurity is much stronger than the OLS estimate, which is consistent with the presence of measurement error in the index of economic insecurity. From an economic perspective, the estimates in the second column imply that an increase of one standard deviation in economic insecurity reduces turnout by more than 8 percentage points or about 10% of the sample mean.
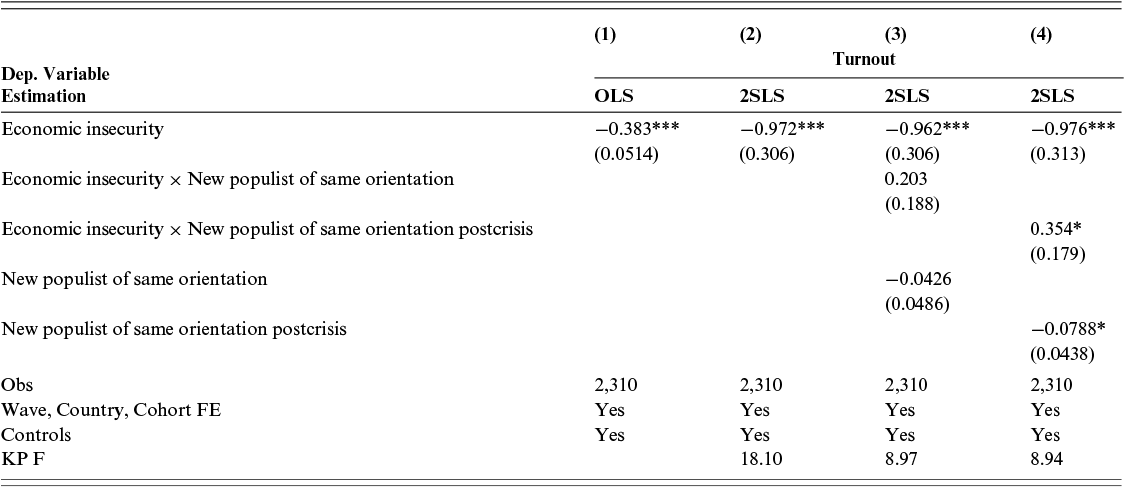
Notes: OLS estimation in column 1, 2SLS estimation in columns 2-4. Dependent variable: Populist vote. Economic insecurity is the survey-based measure of economic insecurity. New populist same orientation is a dummy equal to one if a new populist party exists in the country and whether it is of the same orientation as that of the voters in the cohort. New populist same orientation post-crisis is a dummy assuming value one when the new populist appears just after the burst of the financial crisis. In all regressions we control for cohort, country, and wave fixed effects, together with cohort-level time-varying controls described in section 3. Table A14 in Appendix J includes control variables’ coefficients. Errors are clustered at the cohort level. Kleibergen-Paap F-statistic are reported for columns 2-4.
The evidence is consistent with the idea that the economic insecurity resulting from the crisis led to disappointment with traditional political parties, and as a result voters either became more receptive to populist, anti-elite, and protectionist rhetoric and more likely to vote for populist parties, or they became more inclined to abstain.
We next investigate whether the appearance of a populist party constitutes a valid alternative for disappointed voters, thus mitigating their tendency not to vote. In column 3, we add an indicator for whether a new populist party with the same orientations as the voters in the cohort exists in that country, as well as its interaction with the economic insecurity variable.Footnote 37 The results show that neither of the two variables is statistically significant. In column 4, we replace the indicator for a new populist party with one indicating whether or not a populist party appears just after the onset of the financial crisis. This is based on evidence, albeit weak, that the presence of a populist party of the same orientation at the onset of the crisis reduces the tendency to abstain from voting. This suggests that political orientation matters and that a populist party can more easily attract the disappointed voters who share its ideology. Among such voters, the effect of economic insecurity on turnout is 1/3 smaller (in absolute value) than among voters who do not share the orientation of the populist party (−0.976 as compared to −0.622, which is the difference between −0.976 and 0.354).
This is aligned with the model’s prediction that abstention is mitigated only when voters are offered a protectionist platform with a compatible  value – i.e., left-oriented voters are more likely to turn out if a non-exclusionary protectionist party enters, thus raising their perceived utility from closure above
  .
.
6.5 Robustness and Trust
In Appendix G, we show how economic insecurity also triggered substantial distrust in politicians and political parties. Importantly, all these results survive several robustness checks (Appendix H), which include using alternative (data-driven and not self-reported) measures of economic insecurity (following Guvenen et al., Reference Guvenen, Ozkan and Song2014), potential nonrandom exposure to the shocks (Borusyak and Hull, Reference Borusyak and Hull2020) and different clustering of the standard errors and/or different fixed effects schemes.
The results, taken together, lend support to our thesis that deterioration in individual economic security leads to a loss of confidence in political parties, which may in turn lead to disappointment and voters’ abstention.
7 Supply Side: The Financial Crisis and Party Dynamics
In this section, we present evidence that the political supply of populist parties was substantially altered by the financial crisis. As noted earlier, voters’ reactions to the increased economic insecurity were modified by the appearance of new populist parties. In this section, we provide a detailed account of the change by examining the platforms of all the political parties that existed during that period. For each party we examine the last platform adopted before 2008 and the first adopted after 2008. Before doing so, however, it is worth presenting some summary statistics in order to get an initial impression of the political transformation that occurred following the onset of the crisis: the number of long-lived parties, that is, they existed before and after the 2008 crisis, is 173; the number of dead parties, that is, they existed only prior to 2008, is 92; the number of newborn parties, that is, they appeared after 2008, is 152, of which 30 were populists, and the turnover ratio, that is, the sum of newborn and dead parties divided by the precrisis total number of parties, in 2008 is 58%, which is notably higher than prior to the crisis. Indeed, it is 38% higher than in 2004, another watershed in which the EU was expanded.
To quantify the changes in the political platforms, we use lasso regressions and isolate the top six policy items that tend to be most associated with populist positions (whether before or after the financial crisis, or both), namely anti-EU, protectionism, anti-internationalism, anti-multiculturalism, protection of national way of life, and anti-corruption (see Appendix I for a full explanation of the methodology). Among those, anti-multiculturalism and protection of the national way of life appear to be particularly relevant for populists on the right (herein “right policies”), whereas the other four are characteristics of all populist parties, although two, namely anti-EU and protectionism, are more characteristic of left-oriented populists (herein “left policies”). Anti-corruption and anti-internationalism characterize both left and right; therefore, we do not include them in the comparative analysis of the two orientations.
The common feature of all six policies is that they stress protection against some perceived threat – whether from immigrants and foreigners or from economic and cultural shocks. As argued by Guiso et al. (Reference Guiso, Herrera, Morelli and Sonno2017), this emphasis on protection is a distinctive feature of populist parties, alongside anti-elite rhetoric, which is captured here by the anti-corruption position.
We now take the positions of all long-lived parties on these six issues before and after the crisis and construct a delta policy variable for the change in their positions. To identify possible drivers of change in a party’s position on these issues, we run the following regression model:
 (10)
(10)where  is the index of the issue,
  is the party, and
  is the country;
  is the delta policy variable described above;
  is the party’s precrisis position on issue
  ;
;  is a dummy for whether party
  is populist and
  is a dummy for whether party
  is left-oriented, and
  measures the difference between the average country-level five-year sovereign CDS spread during 2009–2012 and the average country-level five-year sovereign CDS spread during 2005–2007. This captures the deterioration in a country’s access to the bond market and thus the ability to finance fiscal policy. In other words, it is a proxy for the change in the fiscal space following the financial crisis. Finally,
  is a policy-fixed effect and
  is a country fixed effect. The OLS estimates of equation (10) are presented in Table 10. Column 1 pools the six policies together. The precrisis platform is relevant to explain the change in the party’s platform: the higher the initial score for its policy - that is, the more protection-oriented it was prior to the crisis - the less “room for maneuverer” it has at the onset of the crisis. Populist parties, on average, appear to have changed their platform the most, with right-oriented parties moving toward greater protection. However, the effect of orientation on a party’s platform depends on the available fiscal space. In the case of a shrinking fiscal space, left-oriented parties tend to move their platform toward increased protection. Nonetheless, the regression reported in Column 1 makes no distinction between the nature of the parties’ platforms. In columns 2 and 3 we estimate the same model but separately for “right policies” and “left policies,” respectively. Interestingly, in the case of “right policies,” left-oriented parties are less prone to advocate more protection in response to a crisis even when the fiscal space has tightened, as can be seen by the fact that the interaction between the left party variable and the fiscal space proxy is no longer significant. In the case of “left-policies,” left-oriented parties advocate greater protection, which is supported by left-oriented voters when the fiscal space is shrinking, where the magnitude of the interaction term is more than four-fold prior to that estimated in column 1.Footnote 38 Before the financial crisis and even more so before the acceleration of globalization, the platforms of left-oriented parties often involved spending as a way to address individuals’ economic insecurity and their demand for greater protection. Thus, a shrinking fiscal space that occurs simultaneously with a financial crisis requires a much larger readjustment with respect to the right, whose identity-protection policies require no spending.
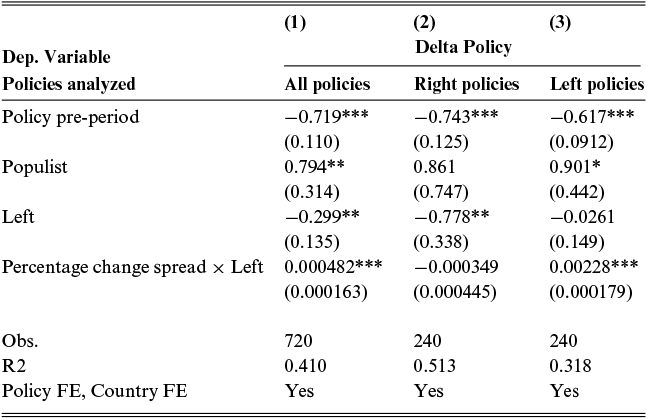
Notes: OLS estimation. Dependent variable: Delta policy, defined as the difference between the policy in the (closest) manifestos in 2013 and 2006; in column (1) all policies are included; in column (2) only left policies are included; in column (3) only right policies are included. ***,**,* = indicate significance at the 1, 5, and 10% level, respectively. Policy pre-period is the policy in the (closest) manifesto in 2006. Populist is a dummy = 1 when the party is populist. Left is a dummy = 1 when the party is left-oriented. Percentage change spread is the country-level spread (5-year sovereign CDS spread) percentage change between precrisis (average 2005–2007) and postcrisis (average 2009–2012) periods. All specifications include policy FE and country FE. Standard errors are clustered at the country level.
These results align closely with the theoretical mechanism linking reduced fiscal capacity to lower institutional trust  , which in turn reduces support for the open market status quo. When
  falls below
  , parties face incentives to shift their platforms toward protectionist policies. This shift is most pronounced among left-wing parties facing tighter fiscal constraints, as shown by the significant interaction term in column (3), and is consistent with the model’s prediction that political supply adapts when compensatory redistribution becomes less credible. Moreover, the results in column 3 suggest that indeed political leaders within long-lived parties immediately understood the feasibility constraint and immediately adjusted the platform toward more protectionism and anti-EU positioning.
In Table 11, we compare the average scores of the platforms of dead parties (534 in total) to those of newborn parties (882 in total). The former are obviously measured prior to the crisis and the latter after it. A comparison between the two offers some insight into how the financial crisis influenced the platforms of new parties. Taking all the platforms together, we find a significant difference between the dead parties and the newborn ones. Compared to dead parties, newborn parties offer policies that are even more protection-oriented, particularly in the case of parties in high-spread countries (above the median) where fiscal space is more constrained. Focusing separately on right and left policies, we find that the right policies of newborn parties are no different (in level and statistically) from those of dead parties. Meanwhile, the left policies of newborn parties are much more tilted toward protection than those of dead parties, particularly in countries with limited fiscal space (i.e., high spread countries). The fact that manifestos of newborn parties on the left compared to dead parties on the left display significantly more protectionism and anti-EU components in countries with low fiscal space, together with more anti-corruption, suggests that the new entrants on the supply side understood the essence of the problem identified in our framework and highlighted by our predictions.
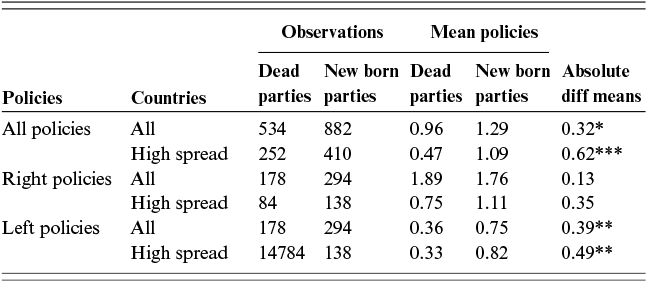
Notes: The table reports the difference in (mean) policies and its significance among parties who did not survive the 2008 crisis (Dead parties) and parties who were born after the 2008 crisis (New born parties). The policies analyzed are either All policies (anti-EU, protectionism, anti-internationalism, anti-multiculturalism, national way of life, anti-political corruption), Right policies (anti-multiculturalism, national way of live), or Left policies (anti-EU, protectionism). The comparison is performed among All countries and High spread (above the median) countries.
The results in Tables 10 and 11 are consistent with the idea that the 2008 crisis indeed led to a major shift in the supply of political parties in Europe toward populism. To test whether this is unique to the crisis, we run a placebo test using the 2004 enlargement of the EU. As Guiso et al. (Reference Guiso, Sapienza and Zingales2016) argue, this event constitutes one of the three critical junctures in the European construction process.Footnote 39 They show that it was a source of tension based on individuals’ sentiments toward the EU, but that it did not have the same effect in the political arena. Specifically, reestimating the same model as in equation (10), with the boundary as 2004 rather than 2008, leaves policy positions unchanged along the six dimensions of populism mentioned earlier.Footnote 40 Similarly, in comparing newborn and dead parties, the replacement of 2008 with 2004 does not lead to any significant change in populist platforms (even in the case of high-spread countries).
In sum, the difference-in-difference results presented in this section suggest that the globalization shock was not sufficient to change the platforms of long-lived parties significantly nor to create new parties at a faster rate. It would appear that the globalization shock affected economic insecurity only on the “market side,” leaving room for political competition on state provision of welfare protection. This is consistent with the increasing number of countries who violated the Maastricht limit on government debt following the entry of China into the WTO and prior to the start of the Great Recession.Footnote 41 On the other hand, the financial crisis, which was combined with (or contributed to) a shrinking fiscal space, led to much greater disillusionment also on the “state side.” Thus, the distrust in markets, as well as in state institutions that were already facing constraints, encouraged political competition that led to more radical platforms.
8 Entry Decisions and Strategic Party Positioning
Having highlighted the dramatic reshuffling of party landscapes following the financial crisis – with numerous parties dissolving and new ones emerging – we now turn to the mechanics of party entry. Each party faces two decisions: whether to adopt a populist platform or, if so, where to position itself on the left-right spectrum. Once its orientation is chosen, a party’s entry decision hinges on the expected vote share it can secure under that platform. Moreover, the cost of launching a populist campaign – shaped by country-specific political and regulatory factors – also influences whether a party enters the race.
The expected share of votes will depend on the extent of voters’ disappointment with mainstream parties, itself a function of the economic insecurity that voters experience. Conditional on entry, the populist party will position itself on the side of the political spectrum where there are more voters and where its rhetoric is more effective in mobilizing them. We capture the adoption and orientation decisions with the following two empirical specifications:
 (11)
(11) (12)
(12)Equation (11) models entry/adoption;  is the number of populist parties in country
  in year
  and is equal to zero if no populist party is present;
  is the average level of voters’ disappointment - an increasing function of the voters, degree of economic insecurity in country
  in year
  ,
,  ;
;  is a vector of features of the institutional and political system, possibly time-varying, that affect the cost of setting up a party with a populist platform; and
  an error term. In equation (12)
  is the orientation of populist party
  in country
  at
at  , increasing in orientation to the right;
  and
and  the shares of left- and right-oriented voters;
  and
and  the left- and right-salient factors; and
  an error term. Details about how we compute each of these variables are presented below. This formulation captures the idea, stressed by Rodrik (Reference Rodrik2017), that in a country a populist party chooses to position itself more to the right if there is a larger share of right-oriented voters, catering toward some salient issue to which right-oriented voters are particularly sensitive, for example, immigrants. Vice versa, it will position more to the left if the share of left-oriented voters is larger and will cater to some salient issue to which these voters are responsive, such as income inequality. We will see at the end how even in the data these two separate types of policies share the protection strategy features.
The estimation of populist parties, existence does not pose particular problems. Equation (11) is a reduced form regression and can be estimated using standard methods such as an ordered probit or a Poisson regression.
An issue emerges in estimating equation (12), which studies populist party orientation, because the latter is only observed if a populist party is present. Because the presence of a populist party is endogenous, if we ignore this selection issue, there may be sorting among populist parties, presence and local voters, preferences. Hence the estimated orientation choice will be representative of the countries that have a populist party but not of the population of all countries. We deal with this issue by running a probit for the presence of a populist party and obtaining a Mills ratio that is then added to the choice of orientation regression as a control; the specification of equations (11) and (12) imply that valid instruments are the institutional variables in vector  which affect the probability that a populist platform is offered.
The five waves (1999, 2002, 2006, 2010, 2014) of the CHES serve to determine whether populism, once it appears, spills over to non-populist parties. For each of the 246 parties included, which belong to all the countries in our sample, CHES gives a measure of the position on a set of relevant issues, which we use to obtain measures of distance between the position of a non-populist party and that of the populist party in the same country. Table 12 shows summary statistics of these measures.
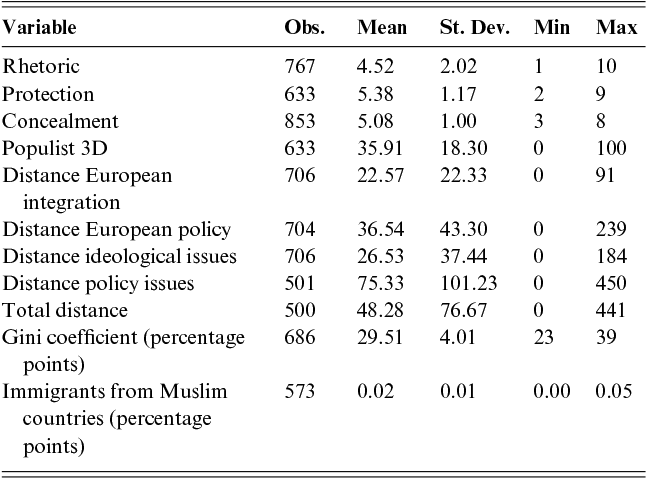
Table 12 Long description
Rhetoric has 767 obs, mean 4.52. Protection has 633 obs, mean 5.38. Concealment has 853 obs, mean 5.08. Populist 3D has 633 obs, mean 35.91. Four distance measures range from mean 22.57 for European integration to 75.33 for policy issues. Gini coefficient mean is 29.51 percentage points over 686 obs. Immigrants from Muslim countries mean is 0.02 over 573 obs.
Notes: The table shows summary statistics of the CHES variables used.
Figure 8 summarizes the temporal and cross-sectional variation in the presence of populist parties across Europe. The left panel shows the share of countries with at least one populist party among the thirty-one in our sample. In 2000, just over 60% of countries had at least one such party; by 2009, the figure had climbed to nearly 85%, confirming that the financial crisis marked a pivotal turning point for the rise of populism in Europe.
The right panel displays the distribution of the number of populist parties across countries and years. It highlights considerable heterogeneity: while some countries have only one active populist party in a given year, others have as many as four or five.
The rise of populism
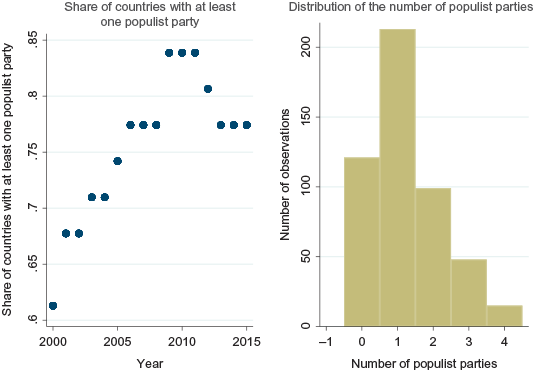
Figure 8 Long description
Left panel: The share rises from about 0.61 in 2000 to 0.65 by 2002, then climbs to approximately 0.77 by 2006, peaks near 0.84 around 2010 to 2011, dips slightly to 0.81, and stabilizes around 0.78 by 2015. Right panel: The histogram shows that one populist party is the most common outcome with over 200 observations, followed by zero parties at about 120, two parties at about 100, three at about 45, and four at about 30.
This variation is important for interpreting equilibrium supply responses. According to our model, when the voter base demanding protectionist commitments grows large enough, multiple entrants may emerge, occupying different ideological niches (e.g., one party with strong exclusionary rhetoric on the right, another focused on economic protectionism from the left). Hence, the right panel not only confirms the diffusion of populism but also suggests strategic positioning and possible segmentation in the populist supply. The fat right tail of the distribution supports this view and motivates the richer analysis of entry and ideological orientation presented in the next section.
Table 13 displays the results of the estimation of equation (11) from a Poisson model, controlling for year fixed effects (to account for the common trend in populist parties documented in Figure 8) and macro Euro-regions fixed effectsFootnote 42 and clustering standard errors at the country level, as some countries have more than one populist party. The first column shows the results proxying  with the share of the votes going to opposition party. The supply of populism is greater where economic insecurity is more widely diffused among the population and in countries more highly exposed to globalization. It is smaller where opposition parties are strong. All the effects are statistically significant; they are also economically relevant. All else being equal, the expected number of populist changes is by a multiplicative factor of 1.35, for an increase in economic insecurity of 1 standard deviation (i.e., a 35% increase in number of populist parties). An expected increase of 22% of populist parties obtains for an increase of import of 1 standard deviation. An increase in opposition vote share by 1 standard deviation decreases by 23% the expected number of populist parties. The second column shows that the results are similar proxying
  with the share of the votes going to nonaligned parties, but smaller in magnitude, that is, 1 standard deviation increase in nonaligned vote share decreases the expected number of populist parties by 7%). The effects of measures of economic insecurity are somewhat stronger. The third column shows that the two proxies maintain their relevance and significance also when considered together. The negative effect of our proxies for
  lends support to our thesis that a populist platform has a better chance of winning consensus and thus of inducing a party to propose it, when people lose faith in all the established parties. A strong opposition party or the presence of strong nonaligned parties weakens the anti-elite pillar, rendering a populist strategy less attractive.
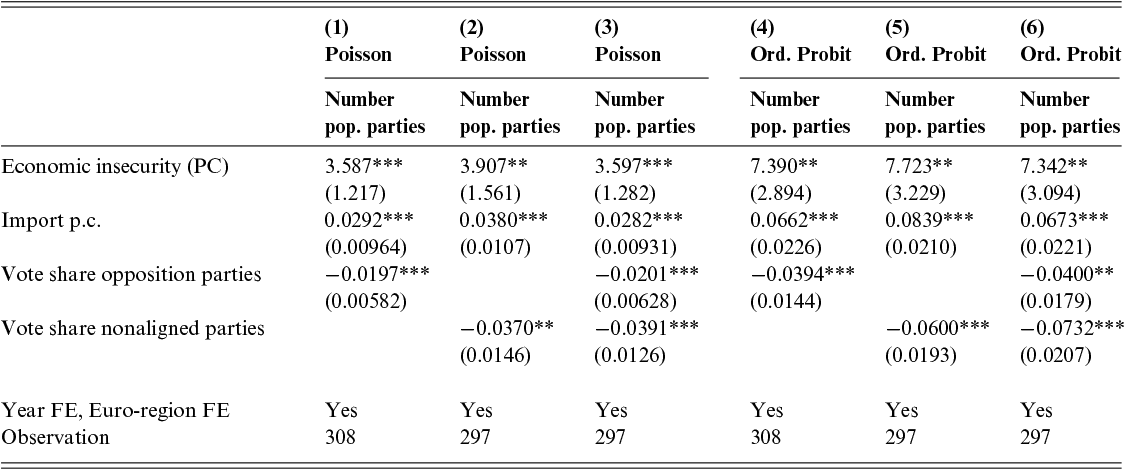
Notes: The table shows regression results for the number of populist parties in a country as a function of measures of voters’ insecurity and countries’ institutional characteristics. The dependent variable is the number of populist parties in a country in a given year. Voters’ characteristics are those in the most recent ESS survey. All regressions include year and macro Euro-regions fixed effects. Columns (1) – (3) are estimated with a Poisson regression, while columns (3) – (6) using Ordered Probit. Robust standard errors are shown in parentheses. *** significant 1% or less; ** significant at 5%; * significant at 10% confidence level.
8.1 The Entry Choice Between Left and Righ
The choice of entering on the left or on the right should depend on the relative entry space. The latter, in turn, depends on the ideological orientation of the electorate and on the salient features of the main economic insecurity determinants. We verify this by estimating (12).
The party orientation is observed in the CHES survey and measured on a scale from 1 (far left) to 10 (far right), so our data are limited by the CHES coverage. The shares of left- and right-oriented voters, also on a 1-to-10 scale, are obtained from the waves of the ESS. As a measure of left-salient factors, we use the Gini coefficient of income inequality (from the World Bank World Income Inequality Database) and as a measure of the right-salient factor the share of immigrants from Muslim countries in the total population. This variable, obtained from the World Bank Bilateral Migration Matrix, is available for three years (1999, 2010, and 2013). We predict  and
and  .
.
Relative entry space should be a critical determinant of the orientation choice whenever the individual characteristics of left- and right-leaning voters are similarly distributed in terms of the key variables of economic insecurity, trust, and ability to assess populist policies that drive the consensus for populist parties. Table 14 confirms that this is indeed the case. The distribution of proxies for the determinants of voting, summarized by mean and standard deviation, is extremely similar between left- and right-oriented voters.
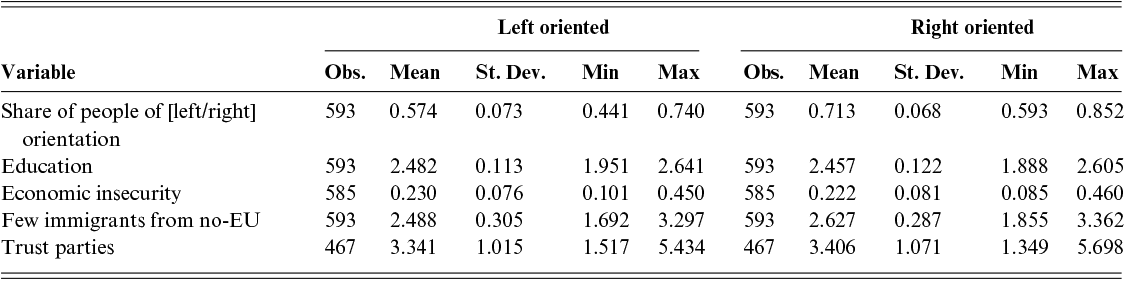
Notes: The table reports summary statistics of characteristics of left-oriented and right-oriented voters in our sample.
Figure 9 shows that in the CHES data, the distribution of the orientation of populist parties is sharply different from that of non-populist parties: populists have a much higher density on the right.
Left/right orientation
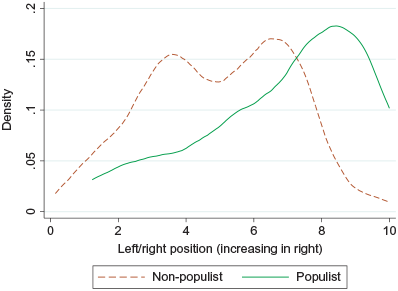
Figure 9 Long description
The dashed non-populist curve rises from near zero, peaks around 0.155 at position 3, dips to about 0.13 near position 5, rises again to about 0.155 near position 7, and then drops sharply toward zero by position 10. The solid populist curve stays below 0.05 until position 3, rises steadily, crosses above the non-populist curve around position 6, peaks at approximately 0.18 near position 8, and then declines. Populist parties are concentrated toward the right of the ideological spectrum.
Table 15 (first column) shows that the heterogeneity in populist party orientation is consistent with our hypothesis. Income inequality weighted by the population share of left-oriented voters tends to pull the orientation of populist parties to the left, and the effect is statistically significant. A 1-standard-deviation increase in this factor shifts orientation to the left by more than one unit in the scale or 21% of the sample mean. The share of immigrants from Muslim countries weighted by the share of right-oriented voters has a positive and highly statistically significant effect, pulling populist parties’ orientation to the right. A 1-standard-deviation increase in this factor increases the score by 1.51 points or 29% of the sample mean orientation. Interestingly, it is not immigration per se that affects the populist orientation but its origin from Muslim countries (see, e.g., Laitin, Reference Laitin2018). If we replace immigration from Muslim countries with the population share of all immigrants or of immigrants from EU countries, the immigration variable (weighted by the share of right-oriented voters) is not statistically significant. This strengthens our interpretation of the results, as it strongly suggests that the orientation chosen is the one most susceptible to effective populist rhetoric (see Rodrik, Reference Rodrik2017). Results are unchanged if we account for selection due to endogenous populist party entry (second column) by adding as a control a Mill’s ratio computed from a first-stage Probit for the presence of a populist party using as instruments the controls in the third column of Table 13.
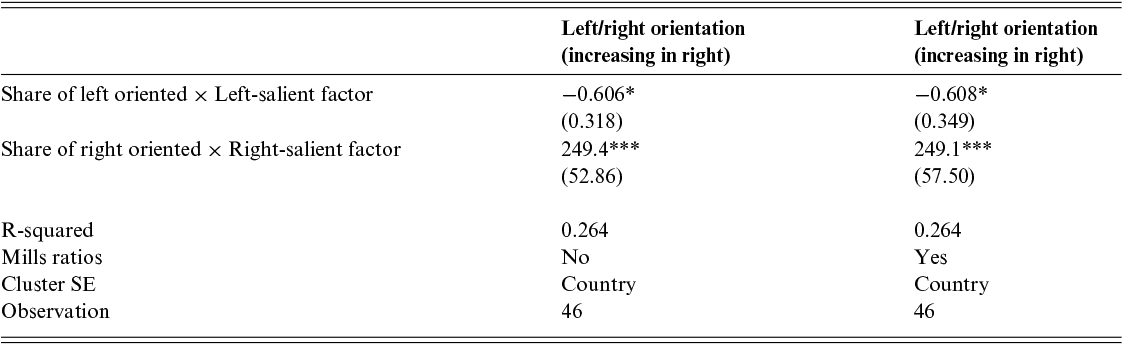
Notes: The table reports regressions of the orientation of the populist parties in our sample on measures of relative entry space. The measure of party orientation is defined on a scale from 1 (extreme left) to 10 (extreme right). In the second column Mill’s ratio computed from a first-stage probit for the presence of a populist party using as instruments the controls in the third column of Table 12 is added. Standard errors clustered at the country level are shown in parenthesis. *** significant 1% or less; ** significant at 5%; * significant at 10% confidence level.
These results corroborate the theoretical intuition that the composition of  – which includes preferences over both economic and social exclusion – determines the relative attractiveness of entry on the right versus the left. In environments where
  falls and social exclusion gains salience, right-wing entry becomes more likely. These findings also corroborate the tenet that populist platforms are a strategy and can adjust the content of the strategic exclusionary commitment to the ideology of their targeted voters.
Populist parties and platforms appear when the popular disappointment is sharp enough to raise realistic hopes of winning a share of the total vote - a scale effect - large enough to outweigh the entry cost. Conditional on entry, the party chooses its political orientation strategically, tilting toward voters, ideology and where the factors behind the crisis are more salient - a relative size effect.Footnote 43 There may have been other ideological and cultural reasons for the orientation choice of a new party, but we have shown that even the most standard office-seeking motivation can explain the observed variation.
8.2 Populist Platforms’ Content
Having shown the determinants of entry and orientation choices, we can now illustrate the third supply choice, namely the policy platform choices.
Using the 2014 Chapel Hill Expert Survey (CHES), in which national experts rate European parties on a range of positions, policies, and salient issues, we construct continuous measures of three important dimensions of populism: (1) anti-elite rhetoric, (2) protectionism, and (3) concealment of long-term costs for all the parties in the CHES database. We use these measures to see if it is true that those parties identified as populist in the categorization of PopuList which was proposed by Rooduijn et al. (Reference Rooduijn, Van Kessel, Froio, Pirro, De Lange, Halikiopoulou, Lewis, Mudde and Taggart2019) (using dimension 1) are indeed significantly more likely to choose policy platforms that conform to the second and third dimensions. The rhetoric variable averages the scores assigned to a measure of the salience of anti-establishment and anti-elite rhetoric and of reducing political corruption, on a scale from 0 (not important at all) to 10 (very important). The protectionism measure is the average of the scores for the position on five policies that may offer economic protection in different domains: deregulation (10 strongly opposes deregulation of markets); immigration (10 strongly in favor of tough policy); tax policy: (10 strongly favors tax cuts vis-a-vis improving government services); economic intervention (10 fully in favor of state intervention); cosmopolitanism (0 strongly advocates cosmopolitanism, 10 strongly advocates nationalism); redistribution of wealth (10 fully in favor of redistribution). To capture the third dimension, we average parties’ positions on two long-term issues: the environment and international security or peacekeeping. Policies on these issues will pay off in the long run, the first by limiting global warming and the second by guaranteeing a stable international order. We interpret a high score on downplaying the importance of these issues as the gauge of a strategy of hiding the long-term costs of protectionism. Table 16 shows regressions of each of the three indexes on the populist party identifier, after controlling for the political orientation of the party (0, far left; 10, far-right).
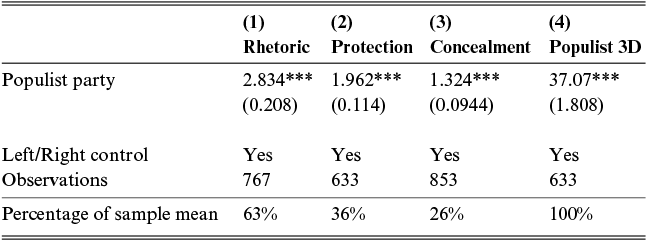
Notes: The table shows OLS regressions of each of the three indexes (Anti-Elite Rhetoric, Protection, and Concealment of the long-term costs of short-term protection) as well as of the principal component on the populist identifying dummy. Each regression controls for the left/right orientation of the party. The last row shows the difference in the score of populist parties from the sample mean.
Independently of political orientation, populist parties all score higher in each of the three indexes. The difference between populist and non-populist parties is sharpest on the anti-elite/anti-corruption dimension (63% above the sample average), but it is substantial for the other two (36% and 26% above average).
8.3 Non-populist Parties’ Reaction to Populism
Recalling that our theoretical framework strongly suggests that populist commitments are a rational strategy to accommodate the drop in  and
and  (trust in markets and governments), a consistent testable hypothesis is that after the financial crisis even non-populist parties moved their platforms in the same general direction. To test this hypothesis, we use the five waves of the Chapel Hill Expert Survey (CHES). For each of a list of issues (see Appendix K for the full description), the CHES reports the position of the party on a scale of 0 to 10 (for some issues, the CHES scale is 1 to 7, but we rescale them to 0-10). To assess the party position, CHES questions a pool of experts in each country. For instance, on the issue of deregulation/regulation the position of the party is gauged by a number, running from 0 (strongly opposed to deregulation) to 10 (strongly in favor). We disregard issues present in only one or two surveys, considering only those that are assessed in at least three and preferably all five surveys. We group the positions into four families: overall European integration (P_EI); European policy (P_EU, obtained by summing the scores on three issues: powers of European institutions, European cohesion policy, and EU foreign and security policy); ideology (P_ID, obtained by summing the scores on three issues: general ideological stance (left/right), stance on intensity of government intervention in the economy, and libertarian versus traditional/authoritarian stance); and an index of the positions on a set of eleven policy issues (P_PD: government expenditure versus taxation, deregulation, redistribution of wealth, civil liberties versus law and order, social lifestyle, religious principles in politics, immigration policy, multiculturalism, urban versus rural interests, political decentralization to regions/cities, and position toward ethnic minorities). The first three indexes are available for all surveys, the fourth for the last three waves.
To compare platforms we proceed as follows. Let  denote the position of party
  in country
  on issue
  (EI, EU, ID, PD) in year
  . We distinguish between platforms of populist parties, P, and non-populist, NP, and let
  denote the distance between the platform of non-populist party
  and the main populist party in its country, if there is one. Let
  denote the share of the vote going to the populist party or parties in the last election before the survey. We test the electoral competition hypothesis by running the regression:
 (13)
(13)where  are time fixed effects,
  are non-populist party fixed effects, and
  an error term. Because parties are country-specific, the party fixed effects also capture systematic national differences across countries. Most electoral competition models would predict a negative value for
  , that is, the platforms of non-populist parties should move closer to that of the populist party as the latter becomes more successful.
Figure 10 plots the relation between the distance of the platforms of non-populist parties from those of the populist, and the populist share of the vote in the most recent election for each of the issues and for the overall index. To pick up possible non-linearities, we plot a local polynomial regression with the 95% confidence band. In all the issues the distance decreases as populist parties gain support, which jibes with the thesis that populist policies are more palatable to the electorate at times of systemic crisis. Table 17 shows the estimates of the linear regression specified above, confirming the visual inspection of Figure 10: as populist parties gain support, their non-populist adversaries appear to adapt their platforms to reduce the distance from the populists. The effects, which account for endogenous presence of populist parties,Footnote 44 are substantial: increasing the share of votes to the populist party by 1 standard deviation (15 percentage points) shortens the distance between the non-populist and populist platforms by 34%, 18%, 27%, and 28% of the sample mean of our issues EI, EU, ID, and PD, respectively. Table 18 rules out the possibility that it is the populist party that moves closer to the traditional parties as it gains consensus. To show this, we regress the change in populist positions on the populist share of the vote. We find that populist parties do not revise their position as their share of votes increases. Overall, this evidence means that simply counting the number of populist parties, or tallying their share of votes/seats, understates the supply of populist policies in a country.
| Dependent variable | Coefficient | Std. Err. | Party FE | Year FE | Mills ratio | Obs. | R2 |
|---|---|---|---|---|---|---|---|
| (1) P_EI | −0.514*** | (0.121) | Yes | Yes | Yes | 364 | 0.915 |
| (2) P_EU | −0.456*** | (0.174) | Yes | Yes | Yes | 363 | 0.923 |
| (3) P_IQ | −0.481** | (0.213) | Yes | Yes | Yes | 364 | 0.891 |
| (4) P_PD | −1.438* | (0.845) | Yes | Yes | Yes | 264 | 0.900 |
Notes: The table shows the regression of the distance between the positions of non-populist and populist party on four separate issues and the share of the vote that went to the populist parties in the last past election. All regressions include year fixed effects and Mill’s ratio computed from a first stage Probit for the presence of a populist party using as instruments the controls in the third column of Table 7. Robust standard errors are shown in parenthesis. *** significant 1% or less; ** significant at 5%; * significant at 10% confidence level.
| Dependent variable | Coefficient | Std. Err. | Party FE | Year FE | Obs. | R2 |
|---|---|---|---|---|---|---|
| (1) P_EI | 0.0695* | (0.0382) | Yes | Yes | 73 | 0.872 |
| (2) P_EU | 0.0501 | (0.107) | Yes | Yes | 73 | 0.887 |
| (3) P_IQ | 0.0771 | (0.170) | Yes | Yes | 73 | 0.807 |
| (4) P_PD | 0.191 | (0.732) | Yes | Yes | 59 | 0.790 |
Notes: The table shows the regression of the change in populist positions on four separate issues and the share of the vote that went to the populist parties in the last past election. All regressions include year fixed effects. Robust standard errors are shown in parenthesis. *** significant 1% or less; ** significant at 5%; * significant at 10% confidence level.
Distance from the populist platform and share of votes to populist parties
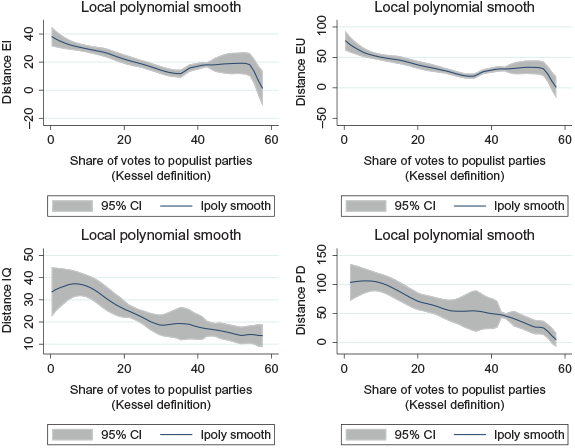
Figure 10 Long description
Each panel plots share of votes to populist parties on the x-axis from 0 to 60 with a fitted curve and 95 percent confidence band in gray. Top-left, Distance EI: starts near 38, declines to about minus 10 at vote share 50. Top-right, Distance EU: starts near 75, declines to about minus 25. Bottom-left, Distance IQ: starts near 40, declines to about 15. Bottom-right, Distance PD: starts near 100, declines to about minus 25. In all four dimensions, non-populist parties converge toward populist platforms as populist vote share increases.
9 Concluding Remarks
We have shown that the financial crisis was a catalyst in the rise of populism in Europe. On the demand side, we have documented this with a novel methodology, while on the supply side a standard difference-in-differences methodology has revealed a consistent pattern of policy change both among long-lived parties and in the comparison between dead and newborn parties. We have also complemented the supply-side analysis with expert surveys that suggest that even parties coded as non-populist are shifting somewhat toward more populist content and style.
The fact that, well after the crisis, populism continues to persist and thrive in Europe could be interpreted in multiple ways. A simple argument is that the financial crisis was the most consequential among several shocks, and the accumulation of various threats – from globalization to immigration – has created a low level of trust in both governments and markets that is difficult to rebuild. Since the focus here is the financial crisis as a watershed of the rise of populism, it is worth discussing some potential sources of “persistence” that are specific to the financial crisis itself. A financial crisis destroys capital, which takes time to rebuild (in Italy the GDP per capita of 2008 has not yet been reached). Second, a financial crisis makes people who were relying on a functioning credit market change activity or simply abandon the optimistic “animal spirits” of precrisis investors. While the above two channels of persistence relate to the changes in  in the model, more channels of persistence exist that relate to the drop in
  : a reduction in
  at the national level comes both from an update of the probability of elite capture of institutions and from an update of the low capacity of such institutions to intervene, and it is important to note that both the misalignment and the capacity constraints did not rebound when economic conditions improved – and even for the reaction to the Covid emergency national level capacity was considered inadequate. Finally, an important and general source of persistence is the vicious trust circle: as we have seen theoretically and empirically, the crisis reduced trust in representative liberal democracy and increased the appeal of simple protection commitments, but, as established in Bellodi et al. (Reference Bellodi, Morelli, Nicolo and Roberti2025), low trust can be kept and even further pushed down by the communication strategies of populist politicians and parties who do not want their commitments blocked. Hence, there are definitely many political players that actively want to keep trust down.
A final remark on the persistence of the political changes induced by the financial crisis relates to the difficulties the populist transformation creates for the European integration process: given the greater and greater focus on exclusionary commitments, the populist rhetoric merged with all forms of nationalism. In other words, the shift from inclusion to exclusionary commitment and protection rhetoric has exacerbated the nationalism versus Europeanism cleavage, exactly at a time when instead international security challenges increase the desirability of abandoning political fragmentation.
Acknowledgments
We thank Luca Vitale for excellent research assistance, and the audiences at the 7th International Conference on European Economics and Politics (keynote), University of Nottingham, University of Cambridge, King’s College London, and University of New South Wales for helpful comments. We wish to thank ERC grant 694583 and the IGIER and Baffi research centres for financial support. We acknowledge financial support from the ministry for university research MUR through a PRIN grant entitled “Political Economy of Reforms and the Costs of Populism” (PERCOP) – part of Next Generation EU funding.
Catherine De Vries
Bocconi University
Catherine De Vries is a Dean of International Affairs and Professor of Political Science at Bocconi University. Her research revolves around some of the key challenges facing the European continent today, such as Euroscepticism, political fragmentation, migration and corruption. She has published widely in leading political science journals, including the American Political Science Review and the Annual Review of Political Science. She has published several books, including Euroscepticism and the Future of European integration (Oxford University Press), received the European Union Studies Association Best Book in EU Studies Award, and was listed in the Financial Times top-5 books to read about Europe’s future.
Gary Marks
University of North Carolina at Chapel Hill and European University Institute
Gary Marks is Burton Craige Professor at the University of North Carolina Chapel Hill, and Professor at the European University Institute, Florence. He has received the Humboldt Forschungspreis and the Daniel Elazar Distinguished Federalism Scholar Award. Marks has been awarded an Advanced European Research Council grant (2010–2015) and is currently senior researcher on a second Advanced European Research Council grant. He has published widely in leading political science journals, including the American Political Science Review and the American Journal of Political Science. Marks has published a dozen books, including A Theory of International Organization and Community, Scale and Regional Governance.
Advisory Board
Sara Hobolt, London School of Economics
Sven-Oliver Proksch, University of Cologne
Jan Rovny, Sciences Po, Paris
Stefanie Walter, University of Zurich
Rahsaan Maxwell, University of North Carolina, Chapel Hill
Kathleen R. McNamara, Georgetown University
R. Daniel Kelemen, Rutgers University
Carlo Altomonte, Bocconi University
About the Series
The Cambridge Elements Series in European Politics will provide a platform for cutting-edge comparative research on Europe at a time of rapid change for the disciplines of political science and international relations. The series is broadly defined, both in terms of subject and academic discipline. The thrust of the series will be thematic rather than ideographic. It will focus on studies that engage key elements of politics – e.g. how institutions work, how parties compete, how citizens participate in politics, how laws get made.


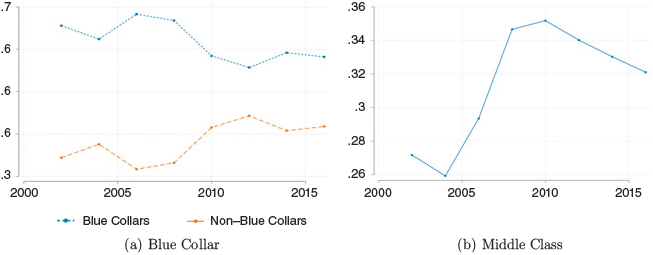
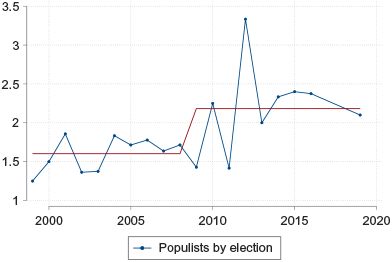
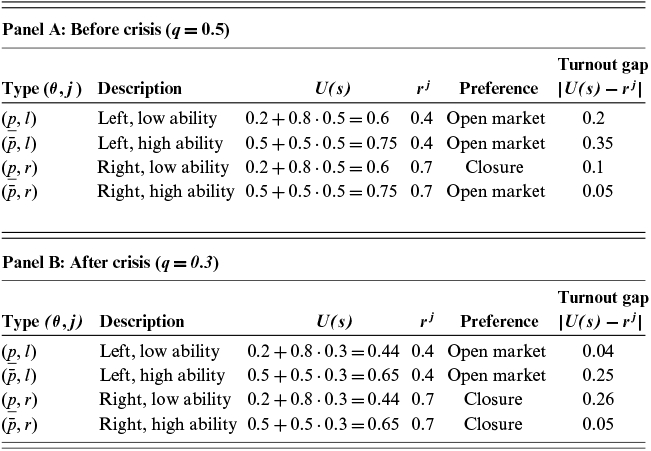
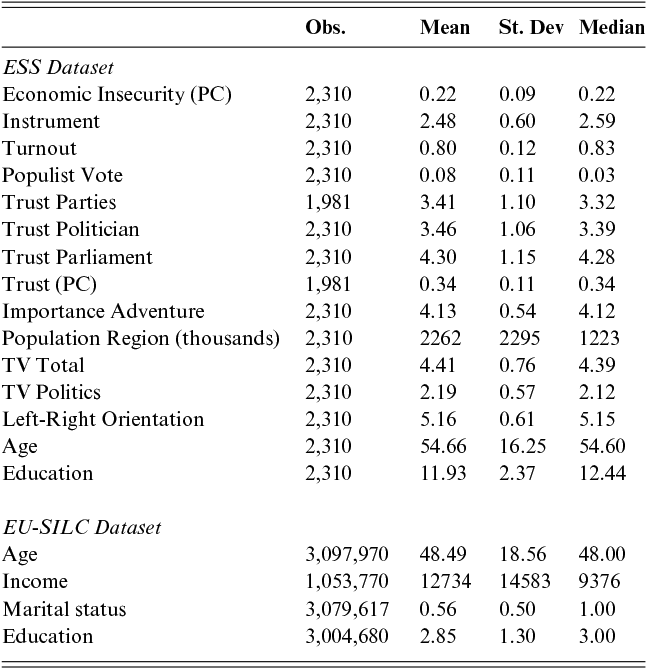
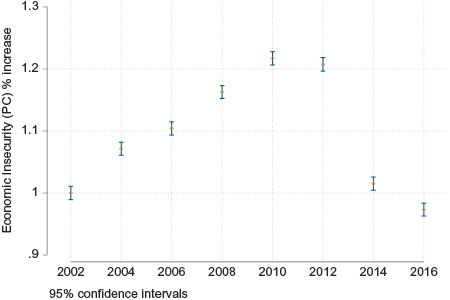
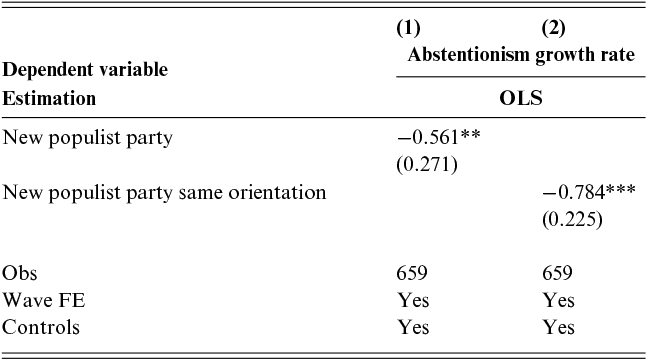
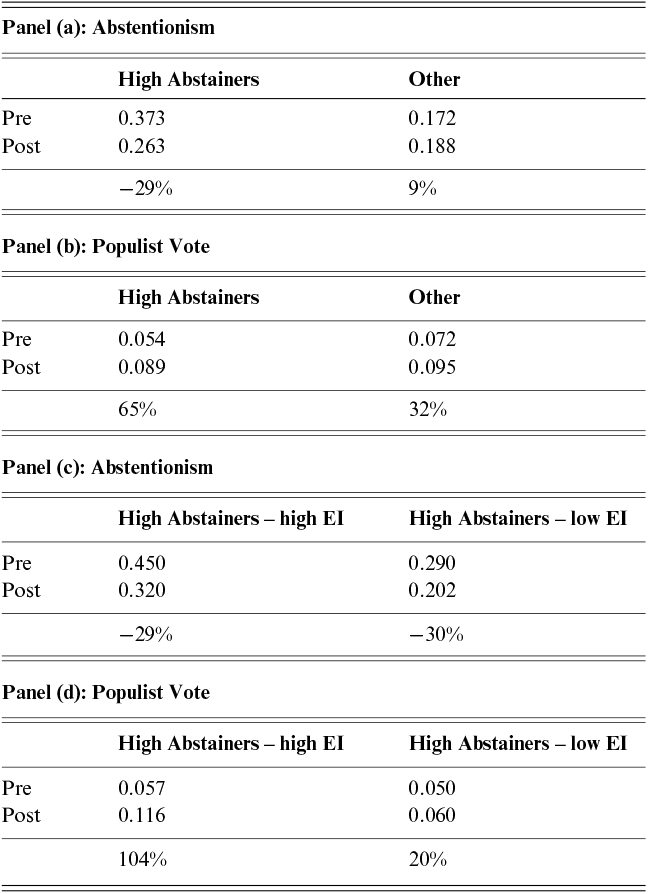
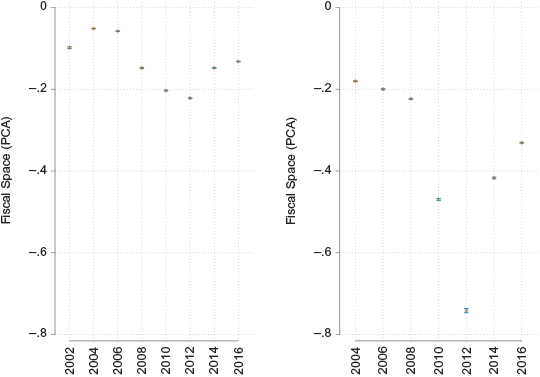
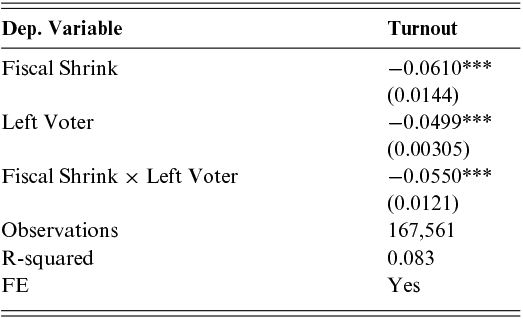
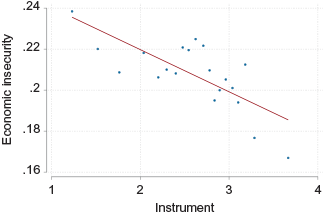
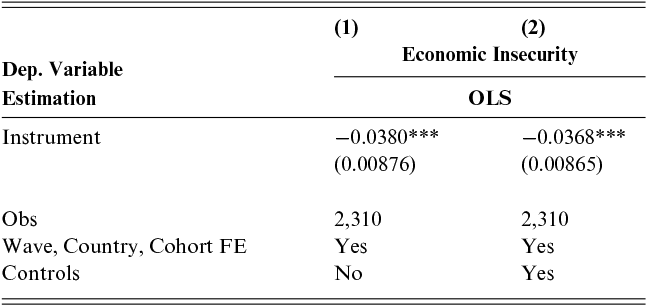
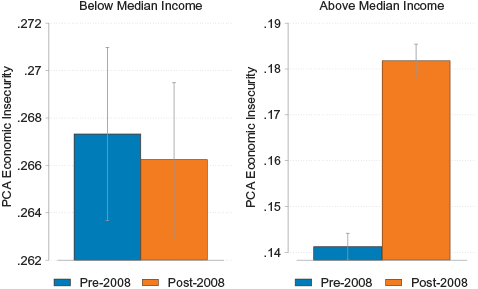
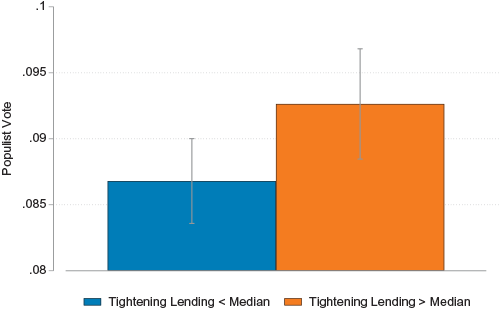
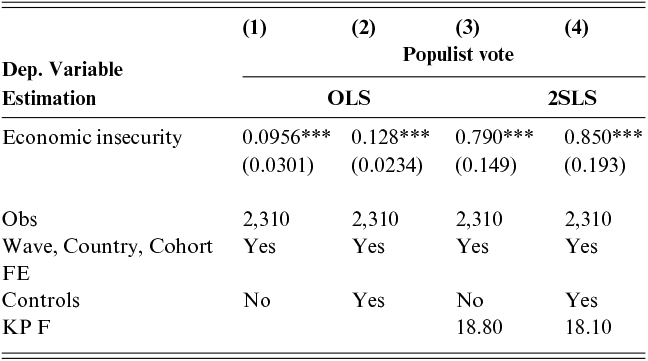
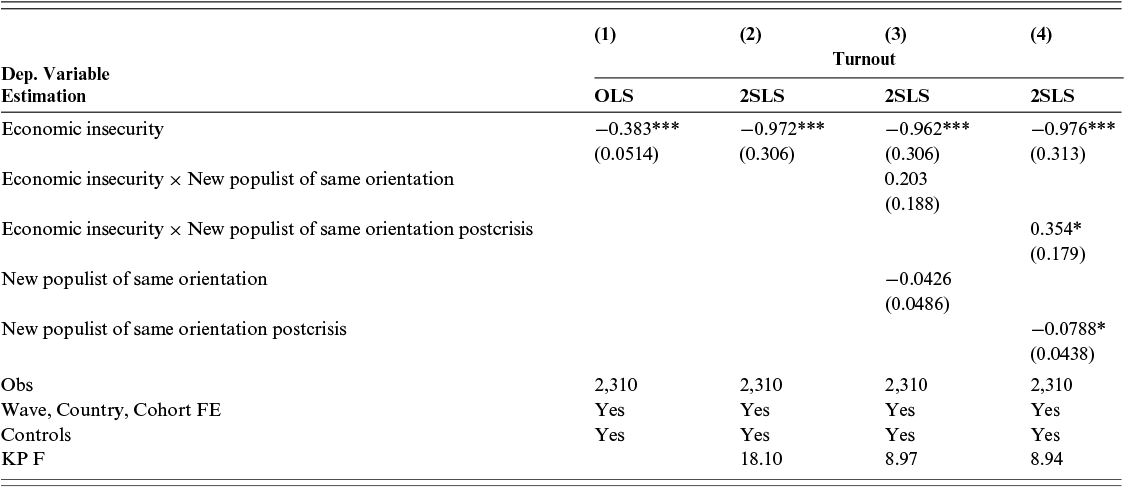
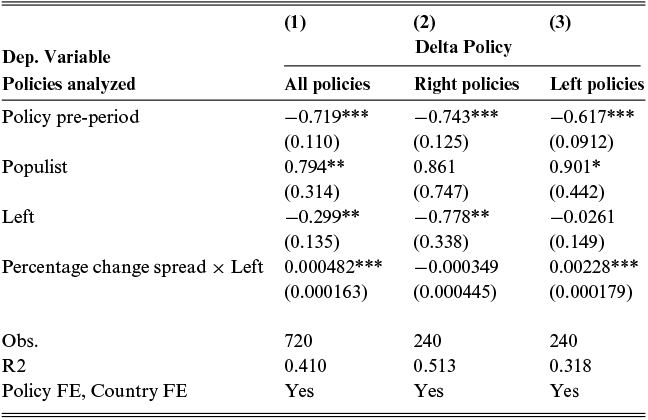
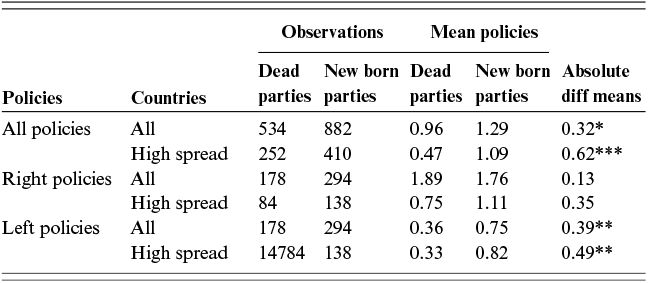
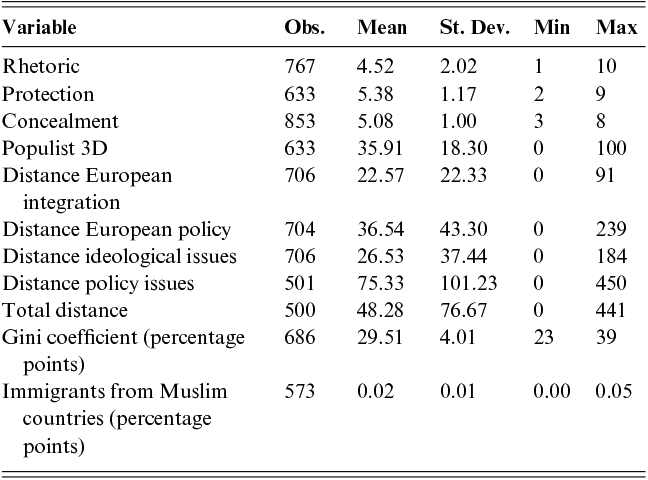
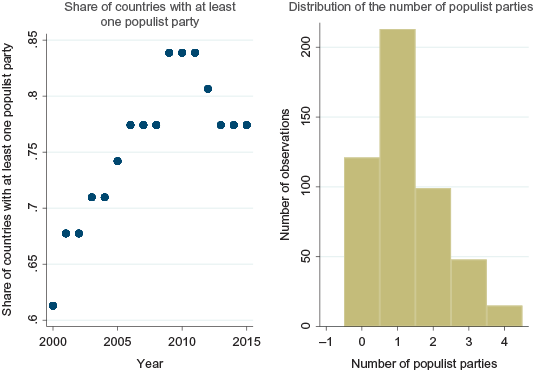
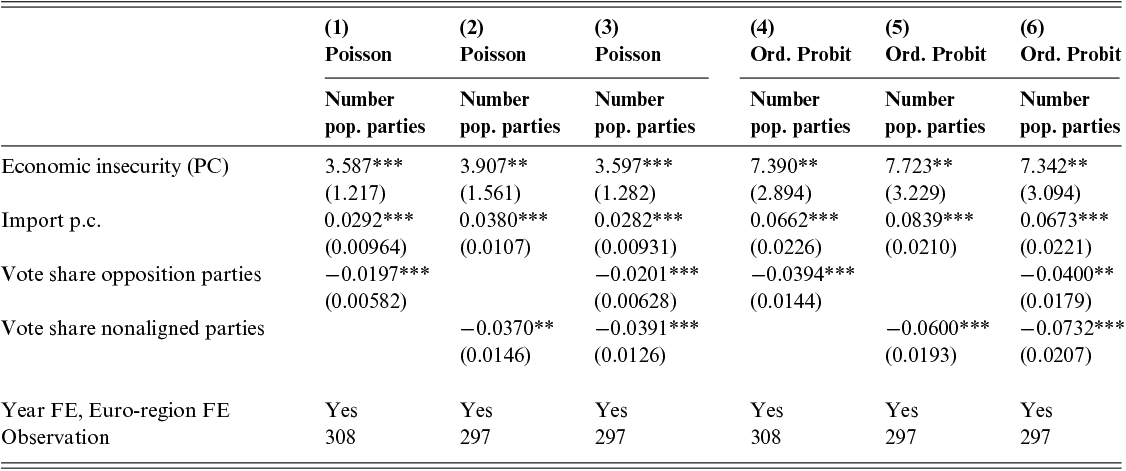
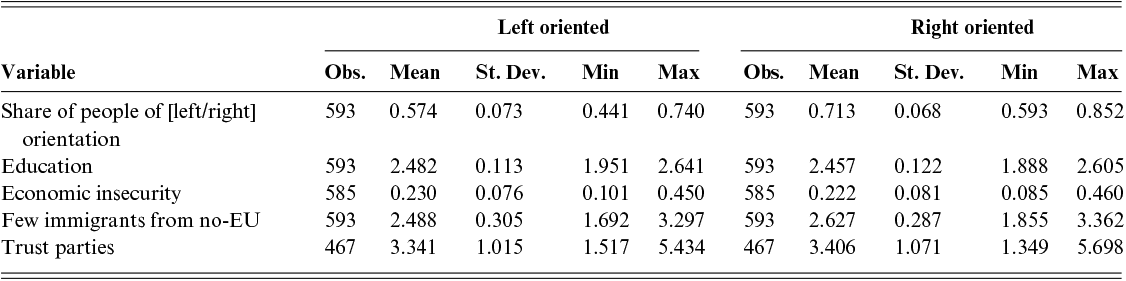
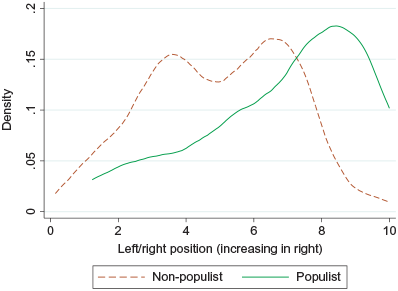
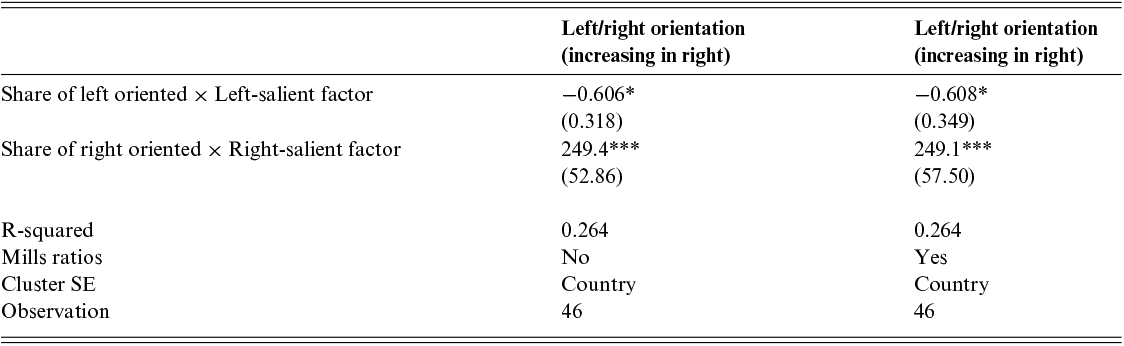
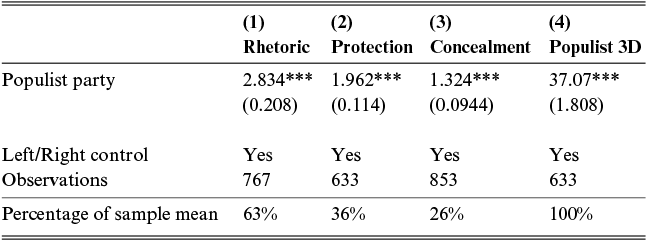
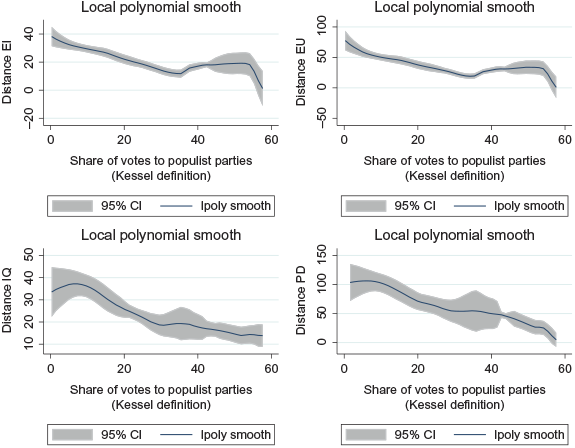

 Open access