


Introduction
Ice shelves, the ungrounded, seaward extensions of grounded ice sheets, restrain the flow of ice from upstream and across the grounding zone, where ice begins to float (e.g. Gudmundsson, Reference Gudmundsson2013). Pinning points, areas where the ice-shelf base is in contact with subglacial bathymetric features, enhance the resistive back forces of the ice shelf, known as buttressing (Matsuoka and others, Reference Matsuoka2015; Still and others, Reference Still, Campbell and Hulbe2019; Miles and Bingham, Reference Miles and Bingham2024). Buttressing originating from pinning points is suggested to substantially stabilize ice shelves and regulate the outflow of land ice from ice streams in both paleoglaciological and modern records (e.g. Halberstadt and others, Reference Halberstadt, Simkins, Greenwood and Anderson2016; Gudmundsson and others, Reference Gudmundsson, De Rydt and Nagler2017). Despite their well-documented stabilizing effects in quickly evolving regions (e.g. Tinto and Bell, Reference Tinto and Bell2011; Alley and others, Reference Alley2021; Wild and others, Reference Wild2022), the evolution of pinning-point stabilization is poorly understood through observations (Matsuoka and others, Reference Matsuoka2015; Miles and Bingham, Reference Miles and Bingham2024). Quantifying the rates of and mechanisms for grounding zone and thickness evolution at pinning point regions in the observational record can provide key constraints on past, present, and future changes in ice-shelf buttressing.
The Ross Sea sector of the West Antarctic Ice Sheet contains dynamic ice streams, fast-flowing rivers of grounded ice, that transport ice across the Gould, Siple, and Shirase coasts’ grounding zones and into Ross Ice Shelf (Fig. 1a; Joughin and others, Reference Joughin2005; Catania and others, Reference Catania, Hulbe, Conway, Scambos and Raymond2012). Ross Ice Shelf contains many pinning points near the grounding zone (Fig. 1a; Dupont and Alley, Reference Dupont and Alley2005; Fürst and others, Reference Fürst2016; Still and Hulbe, Reference Still and Hulbe2021), which enhance buttressing and reduce the ice-stream flux feeding the ice shelf. The ice-stream networks of the Ross Sea sector together maintain a positive mass balance (e.g. Rignot and others, Reference Rignot2019), but the mass balances of individual ice streams vary (e.g. Smith and others, Reference Smith2020) as a result of internal variability-driven ice-stream processes (Hulbe and Fahnestock, Reference Hulbe and Fahnestock2007; Robel and others, Reference Robel, Schoof and Tziperman2014). Although Ross Sea sector ice-stream flow variability cycles occur on century timescales (Catania and others, Reference Catania, Hulbe, Conway, Scambos and Raymond2012; Robel and others, Reference Robel, Schoof and Tziperman2014), changes to ice-stream margins, grounding zone geometries, and local thickness resulting from ice-stream cycles are observable on comparatively shorter decadal (or sub-decadal) timescales (Conway and others, Reference Conway2002). As such, this region provides a unique opportunity to isolate the interplay of dynamic ice-stream stagnation-reactivation and pinning-point mass changes on observational timescales.
(a) Map of Ross Ice Shelf and its pinning points (highlighted light pink; Crary Ice Rise highlighted dark pink) along the Gould, Siple, and Shirase coasts (labeled with red lines). Inset map shows the location in Antarctica; boxed region shows the location of panels b and c. (b) Crary Ice Rise region, where lower Whillans Ice Plain flows across the Crary peninsula into Crary Ice Rise (CIR) and Ross Ice Shelf at the Gould Coast grounding zone. Historical ice-surface velocities (black arrows) from historical field measurements (Thomas and others, Reference Thomas, MacAyeal, Eilers and Gaylord1984) and modern ice-surface velocities (gray arrows) based on MEaSUREs phase-based InSAR velocity product (Mouginot and others, Reference Mouginot, Rignot and Scheuchl2019); location of the Northern Sticky Spot (NSS; Winberry and others, Reference Winberry, Anandakrishnan, Alley, Wiens and Pratt2014), which contributes to the modulation of ice flow into Ross Ice Shelf, marked by pink crossmark. (c) Mass change in the Crary Ice Rise region between 2003–09 and 2018–19 as seen in Smith and others (Reference Smith2020). Red indicates regions of mass loss and blue indicates regions of mass gain. Background of all panels has imagery from the MODIS Mosaic of Antarctica (Scambos and others, Reference Scambos, Haran, Fahnestock, Painter and Bohlander2007) with grounding line (white) from Depoorter and others (Reference Depoorter2013); panels a and b have modern ice-surface velocities (colored background) from the MEaSUREs phase-based InSAR velocity product (Mouginot and others, Reference Mouginot, Rignot and Scheuchl2019) and subglacial lake geometries (cyan, Siegfried and Fricker, Reference Siegfried and Fricker2018), including Engelhardt Subglacial Lake (SLE in panel b), overlain.
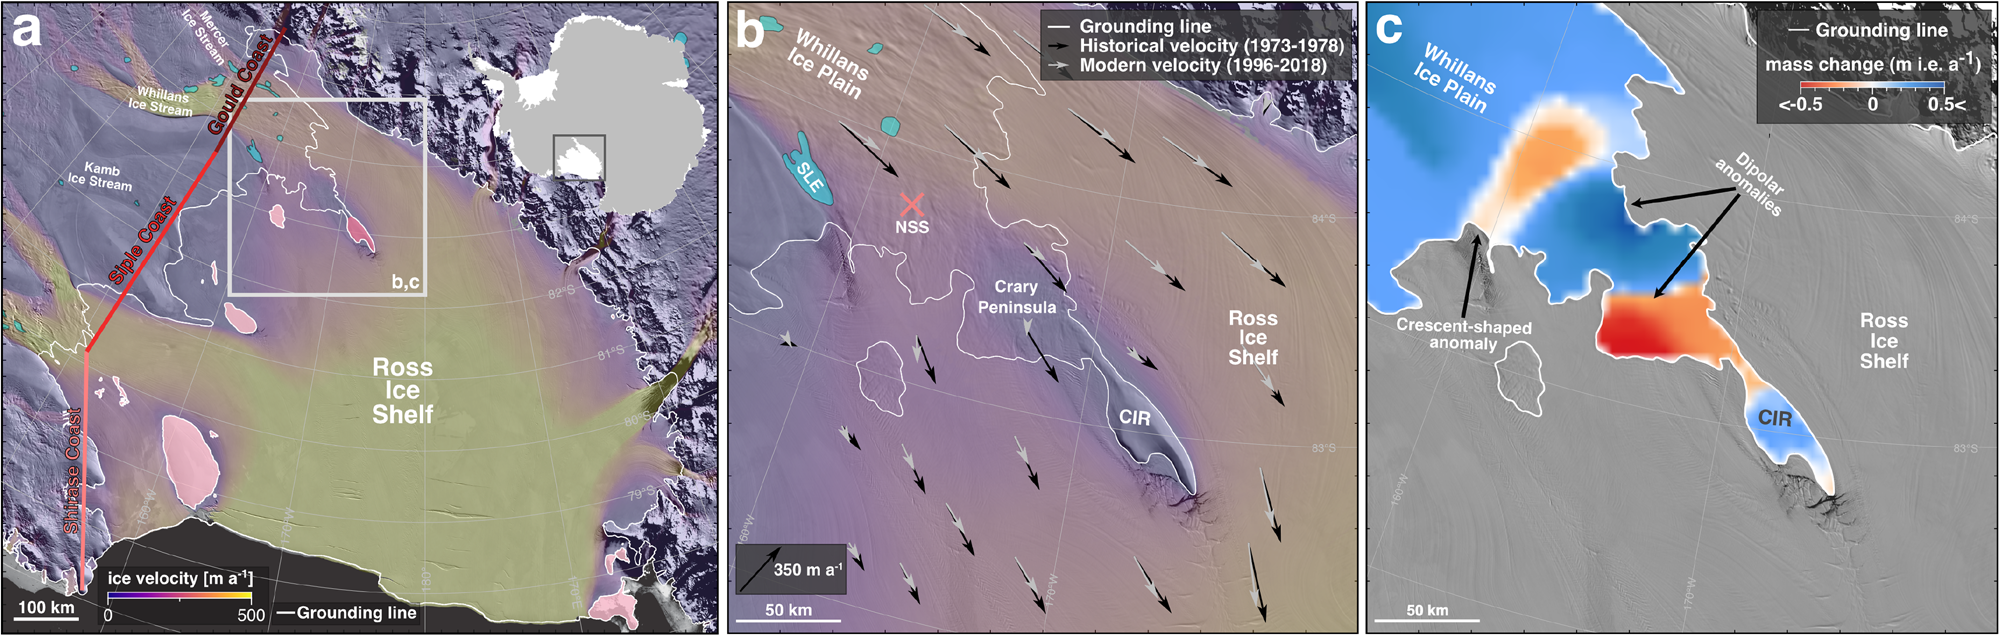
Crary Ice Rise (CIR), a Ross Ice Shelf pinning point located adjacent to the Gould Coast grounding zone, lies downstream of ice discharged from Whillans Ice Stream (WIS) and Mercer Ice Stream (Fig. 1b; Still and others, Reference Still, Campbell and Hulbe2019). CIR formed ~1100 years ago (Bindschadler and others, Reference Bindschadler, Roberts and Iken1990; Catania and others, Reference Catania, Hulbe, Conway, Scambos and Raymond2012) when Ross Ice Shelf thickened and locally re-grounded on marine sediments, driving enhanced resistance to ice flow and reduced spreading rates in this region (Matsuoka and others, Reference Matsuoka2015). Based on regionally averaged mass balance estimations and ice flow models, CIR accounts for approximately 50% of ice-stream buttressing in this region when ice-shelf contact with the pinning point (i.e. pinning-point geometry) is considered static (MacAyeal and others, Reference MacAyeal, Bindschadler, Shabtaie, Stephenson and Bentley1987; MacAyeal, Reference MacAyeal1987; MacAyeal and others, Reference MacAyeal, Bindschadler, Stephenson, Shabtaie and Bentley1989). This buttressing force is transmitted across the ice shelf and a grounded intermediate region (hereafter referred to as ‘Crary peninsula’; Fig. 1b) that connects CIR to the larger West Antarctic Ice Sheet. Just upstream of Crary peninsula, there is a low-sloped, lightly grounded region of ice where the Mercer Ice Stream and WIS trunks merge called Whillans Ice Plain (WIP; Fig. 1). The large plain of plastic subglacial till that underlies WIP effectively transmits frictional backstresses, amplifying the effect of upstream buttressing provided by CIR (Bougamont and others, Reference Bougamont, Price, Christoffersen and Payne2011; Fried and others, Reference Fried, Hulbe and Fahnestock2014; Still and others, Reference Still, Campbell and Hulbe2019). Given how close to flotation this region is (Bindschadler and others, Reference Bindschadler, Vornberger, King and Padman2003), the buttressing regime of this area is particularly sensitive to small changes in ice thickness (Fried and others, Reference Fried, Hulbe and Fahnestock2014). Observations of ongoing WIS deceleration and subsequent regional thickness changes affecting ice mass distribution (Joughin and others, Reference Joughin2005; Beem and others, Reference Beem2014; Winberry and others, Reference Winberry, Anandakrishnan, Alley, Wiens and Pratt2014; Siegfried and others, Reference Siegfried, Fricker, Carter and Tulaczyk2016) imply the impact of CIR buttressing will likely change in response.
Previous studies of surface-elevation change on the CIR complex (i.e. where the pinning point consists of the main ice rise and a collection of smaller adjacent pinning-point features) (e.g. MacAyeal and others, Reference MacAyeal, Bindschadler, Shabtaie, Stephenson and Bentley1987, Reference MacAyeal, Bindschadler, Stephenson, Shabtaie and Bentley1989) and lower WIP (e.g. Bindschadler and others, Reference Bindschadler, Vornberger and Shabtaie1993) revealed positive mass balances due to regional thickening. Although these studies hypothesized ice rises respond to changes in ice-stream flux, they had not yet observed changes to the pinning points in response to the current slowdown of WIS. More recent studies of ice-stream interaction with CIR observed decreased velocity and flow redirection around CIR since the 1960s due to WIS flux variability (e.g. Bindschadler and Vornberger, Reference Bindschadler and Vornberger1998). Observations since 1963 show WIP slowing (Stephenson and Bindschadler, Reference Stephenson and Bindschadler1988), with the rate of slowing increasing more recently (Beem and others, Reference Beem2014; Winberry and others, Reference Winberry, Anandakrishnan, Alley, Wiens and Pratt2014; Siegfried and others, Reference Siegfried, Fricker, Carter and Tulaczyk2016).
The modern satellite record captures mass changes at CIR: between 2003–09 and 2018–19, WIS and WIP show thickening over a broad region (Fig. 1c; Smith and others, Reference Smith2020) that is likely associated with ongoing stagnation (Fig. 1b). Just downstream of WIP, there are distinct, heterogeneous patterns of thickness changes: (i) a crescent-shaped thinning anomaly on lower WIP and (ii) a dipolar anomaly upstream of CIR consisting of adjacent thickening and thinning patterns (Fig. 1c). Although this record covers nearly 20 years of change, the approach of linearly interpolating ice surface-elevation change rate (dh/dt) estimates taken only at inter-mission crossover points (as described in Smith and others, Reference Smith2020) limits our knowledge of the variability of this unique pattern of change surrounding a major Ross Ice Shelf pinning point.
Here, we investigate the 20-year adjustment of the grounded region encompassing lower WIP and CIR (hereafter referred to collectively as ‘the CIR region,’ as shown in Fig. 1b) with increased spatial and temporal resolution to quantify the time-variability of mass redistribution due to ice-stream/pinning-point interaction. We used all available satellite altimetry data with sufficient spatial resolution (i.e. footprints <1 km2) to resolve the spatially heterogeneous evolution of the CIR region. After generating a time series of anomalous dh/dt, we estimated the anomalous mass balance of CIR and the surrounding region during WIS stagnation. We suggest that WIS deceleration initiated local flow rotation, regional ice mass redistribution, and a reduction in grounded pinning-point region area, which could substantially impact CIR buttressing of the ice streams that feed the southern Ross Ice Shelf embayment.
Data and methods
Study region
We targeted the grounded CIR region (an area of approximately 300 km × 300 km) that contains the decelerating lower WIP, Crary peninsula, the CIR complex, and the Gould Coast grounding zone (Fig. 1). The subglacial environment of WIP consists of interconnected networks of subglacial lakes (e.g. Fricker and others, Reference Fricker, Scambos, Bindschadler and Padman2007; Siegfried and Fricker, Reference Siegfried and Fricker2021) and sticky spots (e.g. Pratt and others, Reference Pratt, Winberry, Wiens, Anandakrishnan and Alley2014; Winberry and others, Reference Winberry, Anandakrishnan, Alley, Wiens and Pratt2014) that help regulate the pacing of ice flow before reaching CIR and Ross Ice Shelf. Ice flow of lower WIP diverges as it flows into CIR: ice on the southwestern flank (grid northeast) of CIR maintains its flow direction until it flows past the ice rise, whereas ice on the northeast flank (grid southwest) diverts to the geographic north to flow past the Crary peninsula and around the ice rise. Where the ice reaches the topographic high at the bed of CIR, the frictional back-stress on the ice forms the dome-shaped expression of the pinning point at the ice surface (‘CIR’ in Fig. 1b).
Velocity data
We used two velocity datasets capturing historical and modern ice flow direction and regional patterns of flow deceleration across the CIR region since the 1970s. Between 1973 and 1978, the Ross Ice Shelf Geophysical and Glaciological Survey (RIGGS) estimated surface velocity using conventional surveying techniques corrected via Doppler satellite tracking observations at a set of field stations across Ross Ice Shelf and the Gould, Siple, and Shirase coast grounding zones (black vectors in Fig. 1b; Thomas and others, Reference Thomas, MacAyeal, Eilers and Gaylord1984). Modern spaceborne estimates of surface velocity taken between 1996 and 2018 have been compiled in the MEaSUREs phase-based InSAR velocity product (gray vectors in Fig. 1b; Mouginot and others, Reference Mouginot, Rignot and Scheuchl2019), which used interferometric phase and speckle tracking from various satellite synthetic aperture radars to produce high-resolution ice velocity maps across Antarctica. We used a bicubic grid interpolation scheme implemented in PyGMT (Tian and others, Reference Tian2023) to resample the modern velocity product at the locations of the RIGGS survey over the CIR region. This produced a modern velocity map directly comparable to the 1970s measurements (Fig. 1b).
Multi-decadal altimetry analysis from ICESat, CryoSat-2, and ICESat-2
Satellite altimeters measure surface elevation over time on Earth's surface, enabling estimates of dh/dt over polar ice sheets. Considered individually, no single mission provides the altimetry record length and spatial detail necessary to develop our understanding of regional, multi-decadal responses to century-scale ice-stream processes. Therefore, we constructed a self-consistent, multi-mission dh/dt product from NASA's Ice, Cloud, and land Elevation Satellite (ICESat), the European Space Agency's CryoSat-2, and NASA's ICESat-2 missions spanning 20 years (2003–22) of observations. The instrument designs of both the CryoSat-2 (Wingham and others, Reference Wingham2006) and ICESat-2 (Markus and others, Reference Markus2017) missions provide substantially greater spatial sampling than the ICESat mission (Schutz and others, Reference Schutz, Zwally, Shuman, Hancock and DiMarzio2005), so we focused our dh/dt record construction around ICESat orbital ground tracks for consistent spatial sampling for inter-mission comparison. We corrected elevation measurements for surface mass balance (SMB) and firn air content (FAC) using NASA's Goddard Space Flight Center's firn densification model (GSFC-FDM; Medley and others, Reference Medley, Neumann, Zwally, Smith and Stevens2022), which is driven by NASA's Modern-Era Retrospective analysis for Research and Applications, Version 2 (MERRA-2; Gelaro and others, Reference Gelaro2017), yielding the dynamic component of ice-thickness change in m of ice equivalent over grounded ice. In this section, we describe each of these altimetry datasets and our time-series generation process.
ICESat data (2003–09)
NASA's ICESat laser altimetry mission collected repeat-track surface-elevation measurements in the CIR region from 2003 to 2009 using the single-beam Geoscience Laser Altimetry System (GLAS) instrument. ICESat measured surface elevations along a set of reference tracks two to three times per year with a 50–70 m footprint every 170 m along-track (Schutz and others, Reference Schutz, Zwally, Shuman, Hancock and DiMarzio2005; Smith and others, Reference Smith, Fricker, Joughin and Tulaczyk2009) and a vertical accuracy of ±0.1 m (Siegfried and others, Reference Siegfried, Hawley and Burkhart2011; Borsa and others, Reference Borsa, Fricker and Brunt2019). The spacing between reference tracks was approximately 2.5 km at the latitudes of the CIR region due to the satellite's polar orbit with a $94^\circ$ inclination. We used the GLAS/ICESat L2 Global Antarctic and Greenland Ice Sheet Altimetry Data (GLA12), Version 34 data product (Zwally and others, Reference Zwally, Schutz, Hancock and Dimarzio2014), corrected for saturation bias, Gaussian-centroid offset, and TOPEX to WGS-84 reference ellipsoid.
CryoSat-2 data (2010–present)
The European Space Agency's CryoSat-2 mission, launched in 2010, uses its Synthetic Aperture Interferometric Radar Altimeter (SIRAL) instrument in three different modes over polar regions (Wingham and others, Reference Wingham2006). Over the CIR region, SIRAL is in Synthetic Aperture Radar Interferometric (SARIn) mode, which can resolve surface elevation both at the Point-of-Closest-Approach (POCA) beneath the satellite (McMillan and others, Reference McMillan2013) and across-track swaths through a phase-unwrapping technique (e.g. Hawley and others, Reference Hawley, Shepherd, Cullen, Helm and Wingham2009; Gray and others, Reference Gray2013; Gourmelen and others, Reference Gourmelen2018). We used the CryoTEMPO-EOLIS Baseline 1 phase-unwrapped SARIn data product (Gourmelen and others, Reference Gourmelen2018) collected between September 2010 and December 2022, which has along-track spatial resolution of approximately 400 m and an incident-angle-dependent across-track spatial resolution in the range of 100s of m with a vertical resolution of 1s of m (Gray and others, Reference Gray2013; McMillan and others, Reference McMillan2013; Gray and others, Reference Gray2017).
ICESat-2 data (2018–present)
NASA's ICESat-2 laser altimetry mission (the follow-on mission to the ICESat mission) has collected surface-elevation measurements using the multi-beam Advanced Topographic Laser Altimeter System (ATLAS) instrument since its launch in September 2018. The ICESat-2 repeat-track orbit provides surface elevations every 91 days along a set of reference tracks with a 13 m footprint and 0.7 m along-track spacing between laser pulses (Magruder and others, Reference Magruder, Brunt and Alonzo2020). The single ATLAS laser diffracts into six beams organized into three pairs with ~3.3 km separation across-track and ~90 m separation within each pair, increasing the spatial sampling (Markus and others, Reference Markus2017). We used the ATL06 ATLAS/ICESat-2 L3A Land Ice Height, Version 006 data product (Smith and others, Reference Smith2023), which provides a surface-elevation estimate every 20 m along-track with 40 m resolution, for our dh/dt calculations. We separately used cycle 14 (22 December 2021 through 23 March 2022) dh model surface of the 1 km resolution ATL15 ATLAS/ICESat-2 L3B Gridded Antarctic and Arctic Land Ice Height Change, Version 2 data product (Smith and others, Reference Smith2022) to derive higher spatial resolution outlines of dh/dt pattern geometries.
MERRA-2 and GSFC-FDM
NASA's MERRA-2 is a global atmospheric reanalysis model (Gelaro and others, Reference Gelaro2017) contemporaneous with the satellite era (1980 to present) that provides atmospheric variables on a 0.625° longitude × 0.5° latitude resolution grid at hourly intervals. MERRA-2 was used to drive a firn-densification model (Medley and others, Reference Medley, Neumann, Zwally, Smith and Stevens2022) to generate realistic SMB and FAC components of surface-elevation change throughout Antarctica (e.g. Smith and others, Reference Smith2020). We used MERRA-2 and GSFC-FDM through the SMBcorr Python package (Sutterley and others, Reference Sutterley2018) to estimate the contributions of SMB and FAC surface processes to height at every ICESat, CryoSat-2, and ICESat-2 elevation measurement within the study region. We then subtracted the surface process components from each surface-elevation measurement and interpreted the following dh/dt estimates as representative of the component related to dynamic ice-sheet processes.
Estimation of surface-elevation change time series
The ICESat mission provided the coarsest sampling of surface-elevation measurements, so the finest comparable resolution for our combined 20-year record must be limited to the ICESat sampling density. Due to variations in pointing control, ICESat repeat-tracks deviated up to 100s of m from the reference ground track (Siegfried and others, Reference Siegfried, Hawley and Burkhart2011), and therefore we could not directly estimate dh/dt on a footprint-by-footprint basis. Instead, we generated an ad hoc, local reference track for each repeated ICESat track in the grounded CIR region. We divided this local reference track into 1 km × 1 km patches separated by 250 m along-track for aggregating data from which to calculate dh/dt. Within each patch, we accumulated all SMB- and FAC-corrected elevation data and filtered the data to ensure aggregated elevations spanned at least five years to reduce temporal bias in the resulting dh/dt estimates. We also excluded outlying elevations greater than three standard deviations from the mean elevation of each patch.
We then simultaneously solved for the best-fit plane to the data and secular dh/dt within a patch during the ICESat period following Smith and others (Reference Smith, Fricker, Joughin and Tulaczyk2009) using:

where h(x, y, t) represents ICESat observations of surface elevation (in m) at a position (x, y) and given time t, and α represents the model variables needed to describe the planar model (α 0−2) and dh/dt (α 3). The difference between the spatio-temporal position of an observation and $( \bar {x},\; \, \bar {y},\; \, \bar {t})$ , the mean spatiotemporal positions within a patch, was multiplied by model variables to form a best-fit planar model and dh/dt estimate. Equation (1) generates a system of equations where the number of equations equals the number of altimetric observations within a patch. We solved for the model parameters (α 0−3) using the linear algebra subpackage of SciPy, a scientific computing software package in Python (Virtanen and others, Reference Virtanen2020), for each patch along the ICESat ad hoc reference tracks. We then assigned the resulting estimated dh/dt value (in m a−1) to the center of the patch.
We repeated this process over the ad hoc ICESat reference tracks for data from the CryoSat-2 (2010–22) and ICESat-2 (2018–22) missions to generate time series of dh/dt over the CIR region at inter-mission comparable locations (Fig. S1). We limited CryoSat-2 dh/dt estimations to five-year periods posted annually (e.g. 2010–14, 2011–15) to approximately match the temporal resolution of our ICESat and ICESat-2 analyses. We additionally calculated the root mean square error within each patch to test the fit of the modeled dh/dt estimates compared to altimetry observations (Fig. S2).
Anomalous surface-elevation change time series
After generating the dh/dt time series (Figs. 2, S1), we removed the regional mean value of dh/dt at each time interval (Fig. S3) to evaluate the magnitudes and trends of spatial anomalies in the dh/dt field (Figs. 3, S4). Non-zero regional means captured long-wavelength background signals (e.g. regional dynamic thickening from increasing basal friction; Joughin and others, Reference Joughin, Tulaczyk, Bindschadler and Price2002; Stearns and others, Reference Stearns, Jezek and Van Der Veen2005; Beem and others, Reference Beem2014) shared by all data in the region as well as any time-variable altimetric or reanalysis/surface mass balance biases that are regionally coherent (e.g. Bromwich and others, Reference Bromwich, Nicolas and Monaghan2011; Nilsson and others, Reference Nilsson, Gardner, Sørensen and Forsberg2016). By looking at the time series of dh/dt changes relative to the regional average (Figs. 3, S4), we isolate local changes to thickness gradients, which impacts the force-balance of the system. We refer to dh/dt data without means removed as ‘dh/dt’ and dh/dt data with regional means removed as ‘anomalous dh/dt.’ We used the anomalous dh/dt time series for our analyses of height-change anomaly persistence and anomalous mass balance trends in this study.
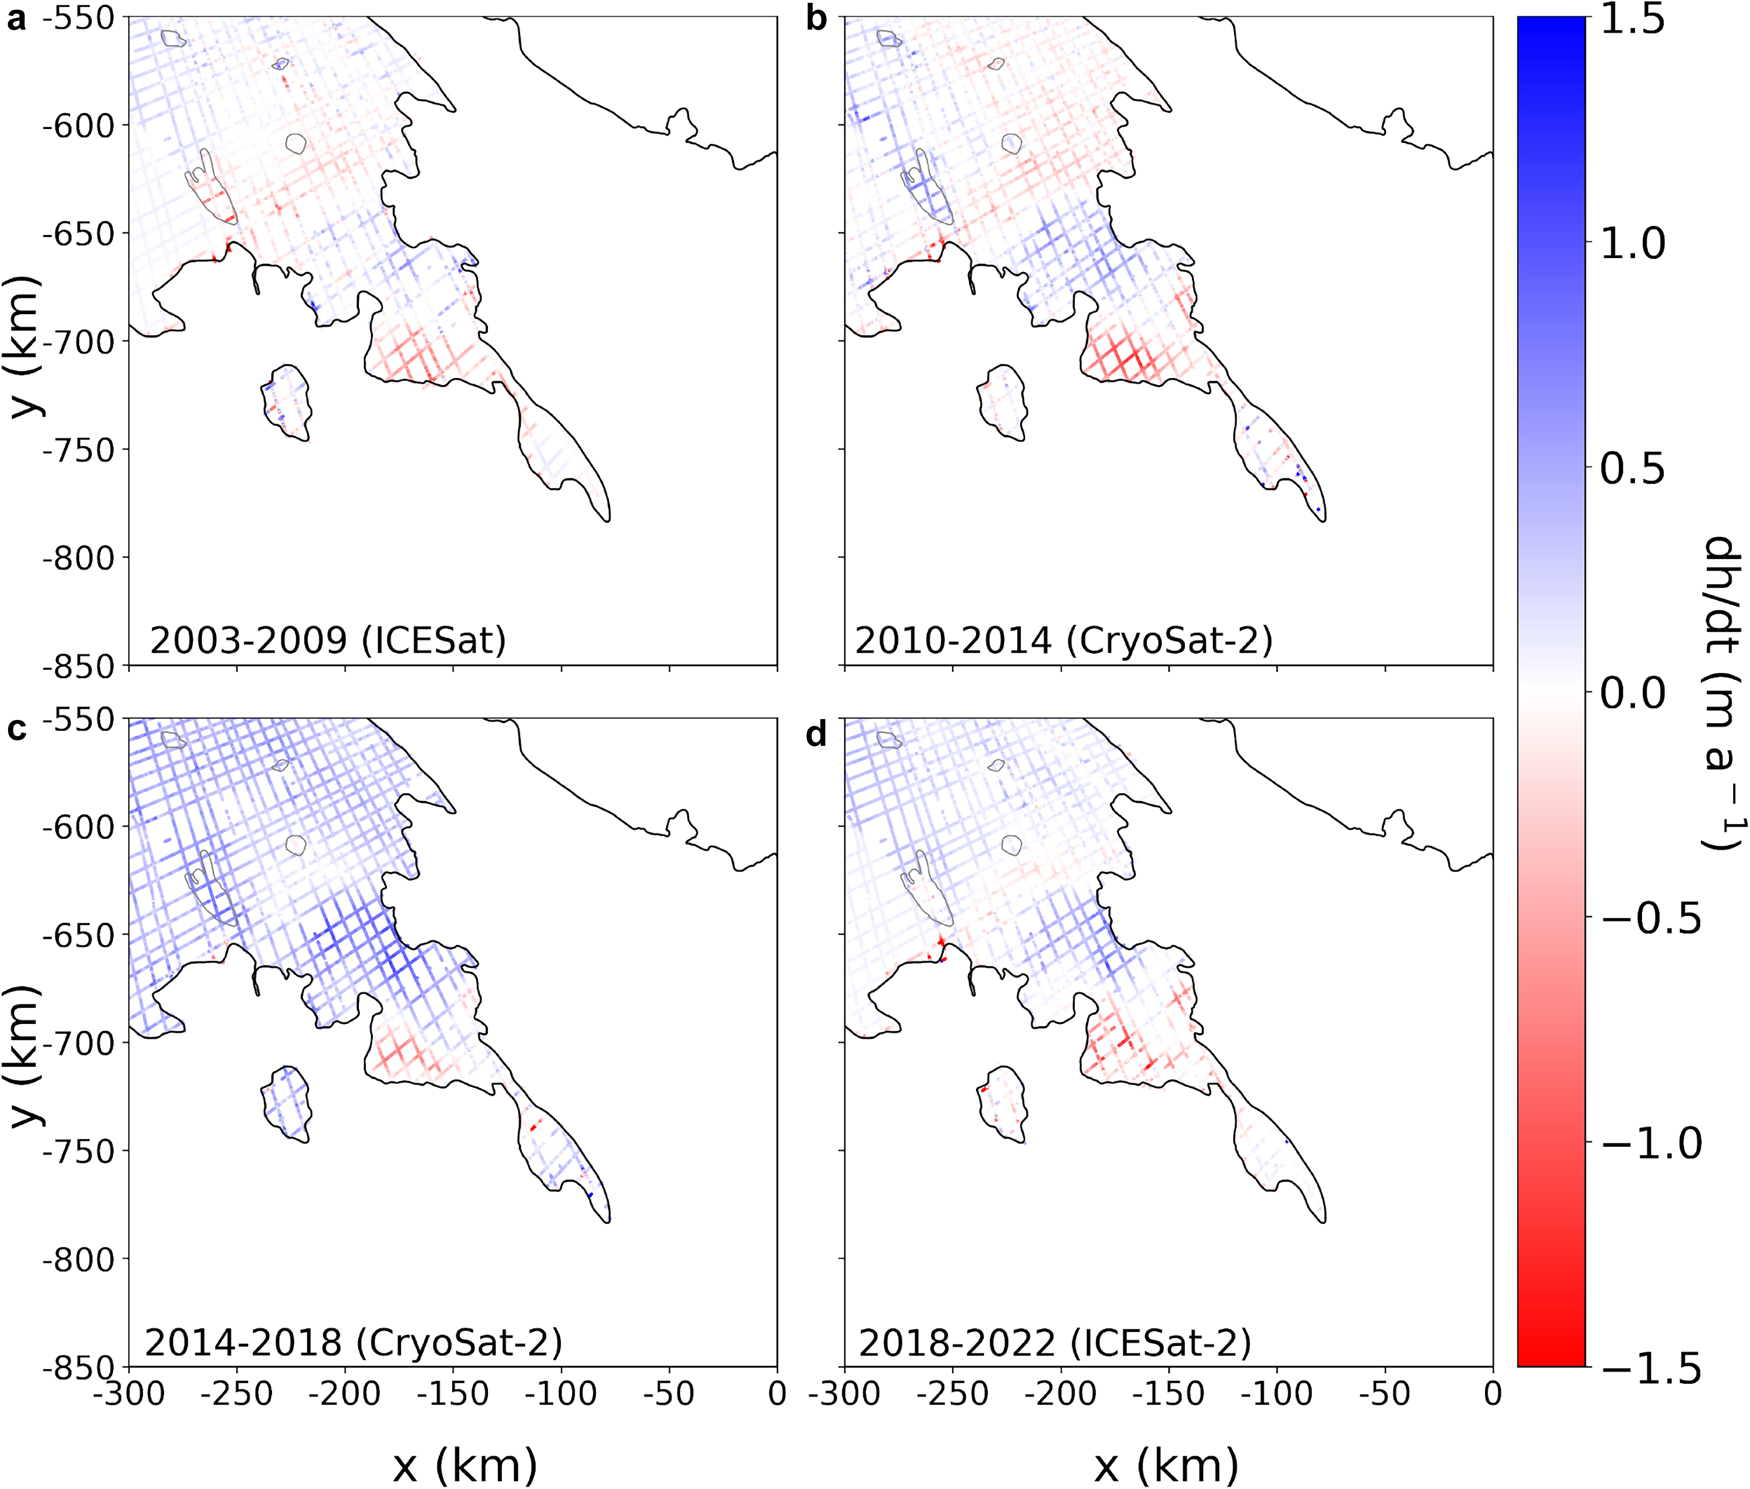
Snapshots from our 20-year time series of ice surface-elevation change rate (dh/dt) over grounded ice in the Crary Ice Rise region from satellite altimetry. All altimetry missions sampled to match locations of ICESat ad hoc reference tracks. Estimates of annual dh/dt (m a−1) were generated from data partitioned in five-year periods. The panels represent along-track dh/dt estimates derived from (a) ICESat (2003–09), (b) CryoSat-2 (2010–14), (c) CryoSat-2 (2014–18), and (d) ICESat-2 (2018–22) observations. Grounding line (Depoorter and others, Reference Depoorter2013) shown in black. Subglacial lake geometries (Siegfried and Fricker, Reference Siegfried and Fricker2018) outlined in gray. Estimates of dh/dt over floating ice and the Transantarctic Mountains are excluded. The complete 20-year time series is shown in Fig. S1.
20-year time series of anomalous ice surface-elevation change rate (dh/dt) estimates after removing the mean dh/dt value of the corresponding five-year interval. All missions sampled to match locations of ICESat ground tracks. Panels represent along-track anomalous dh/dt estimates derived from (a) ICESat (2003–09), (b) CryoSat-2 (2010–14), (c) CryoSat-2 (2014–18), and (d) ICESat-2 (2018–22) missions. Grounding line (Depoorter and others, Reference Depoorter2013) shown in black. Subglacial lake geometries (Siegfried and Fricker, Reference Siegfried and Fricker2018) outlined in gray. Estimates of anomalous dh/dt over floating ice and the Transantarctic Mountains are excluded. The complete 20-year time series of anomalous dh/dt estimates is located in Fig. S4.

Surface-elevation anomaly delineations
One of our goals was to evaluate the time evolution of anomalous dh/dt patterns in the CIR region. Guided by regional anomalies identified by Smith and others (Reference Smith2020), we located anomalous thickening and thinning signals in the CIR region using a 5 km, low-pass filtered form of the ICESat-2 ATL15 data product (cycle 14; Smith and others, Reference Smith2022). We used the cycle 14 dh/dt contours to delineate (fixed) boundaries for coherent anomaly geometries. The resulting spatial boundaries were used to mask sub-regions of our anomalous dh/dt estimates and generate a 20-year time series of mean anomalous dh/dt within each boundary (reported, in the main text, as mean ± standard error) and its variability across the sub-regions (as mean ± standard deviation, provided in the supplementary material).
Mass balance estimates
We constructed time series of anomalous geodetic mass balance (e.g. Zwally and others, Reference Zwally2015; Smith and others, Reference Smith2020; Goel and others, Reference Goel, Morris, Moholdt and Matsuoka2022) using the anomalous dh/dt estimates to approximate the evolution of relative ice distribution within the CIR region throughout the observational period. We estimated mass balance with:

where M is the anomalous geodetic mass balance (in Gt a−1), $\overline {{{\rm d}h\over {\rm d}t}}$ is the average of anomalous dh/dt estimates within a specified area (in m a−1), c is a conversion factor (10−12 Gt kg−1), ρ i is the density of ice (917 kg m−3), and A is the area of a defined subregion (using an Antarctic Polar Stereographic projection; in m2). SMB and FAC corrections removed the signal of surface processes from our estimated dh/dt, and by starting from the assumption that the ice is consistently grounded, all height changes can be converted to mass changes. The resulting signal reflects anomalous mass redistribution in the region, likely the result of internal flow variability (as the large and slow-changing Ross Ice Shelf largely buffers the CIR region from external forcing; Rignot and others, Reference Rignot, Jacobs, Mouginot and Scheuchl2013). We revisit these assumptions in our discussion.
Results
A comparison of historical and modern velocities (Fig. 1b) yields a record of regional flow deceleration and rotation since the 1970s observations. The ongoing slowdown of WIS is reflected in reduced modern velocities in the CIR region. Additionally, the modern flow direction (gray arrows in Fig. 1b) shows that CIR generates a more pronounced diversion in ice-shelf flow than in the historical velocity observations (black arrows in Fig. 1b), indicating the development of regional flow rotation in the CIR region since the 1970s observations.
WIP exhibited notably increased regional thickening between the 2013–17 and 2016–20 intervals (Figs. 2c, S1, S3), which caused the CIR region to reach its peak average dh/dt magnitude (mean of 0.340 ± 0.002 m a−1) in the 2014–18 interval. Large, positive regional mean dh/dt values concentrated in the middle of the time series (Figs. S1, S3) may indicate a time-variable ice dynamic process (e.g. regionally increasing basal friction) or systemic bias in the time series (e.g. Nilsson and others, Reference Nilsson, Gardner, Sørensen and Forsberg2016), both of which are independent of what dynamics cause the anomalies. We therefore use the anomalous dh/dt time series focused on anomalous thickness processes in the pinning-point region (i.e. data from Fig. 3) for the remainder of the analyses in this study. Regional-scale signals of increased thickening between the 2013–17 and 2016–20 intervals did not change the persistence of the anomalous dh/dt patterns across WIP and the Crary peninsula (i.e. Fig. 3c compared to Figs. 3a, b, d).
Evolution of surface-elevation anomalies
The 20-year combined altimetry record of dh/dt revealed heterogeneous surface-elevation change across the CIR region that persisted throughout the observational record (Figs. 2, 3, S1, S4). Our time series shows dh/dt anomalies in locations consistent with Smith and others (Reference Smith2020) (Fig. 1c), but with a higher spatial and temporal resolution capturing anomaly evolution. We target our analysis around four anomalies: (i) the crescent-shaped anomaly (Figs. 4a, b); (ii) the thickening portion of the dipolar anomaly (Figs. 4a, c); and the thinning portion of the dipolar anomaly, which we split into the (iii) inland portion of the thinning signal (Figs. 4a, d) and (iv) seaward portion of the thinning signal (Figs. 4a, e). In this section, we present the dh/dt anomaly evolution of the four anomalies throughout the time series (Figs. 4, S5).
20-year record of mean anomalous ice surface-elevation change rate (dh/dt) estimates within the major dh/dt anomalies of the Crary Ice Rise region. (a) Map of the Crary Ice Rise region with delineated dh/dt anomaly subregions: the crescent-shaped anomaly in yellow, the thickening dipolar anomaly in turquoise, the landward thinning dipolar anomaly in pink, and the seaward thinning dipolar anomaly in purple. Background colors show ICESat-2 ATL15-derived surface-elevation change (calculated between 22 December 2021 through 23 March 2022 (cycle 14) and the ATL14 reference DEM), which we used to delineate height anomaly regions. Grounding line (Depoorter and others, Reference Depoorter2013) is shown in black. 20-year time series of five-year anomalous dh/dt estimates (in m a−1) for (b) the crescent-shaped anomaly, (c) the thickening area of the dipolar anomaly, (d) the landward thinning area of the dipolar anomaly, and (e) the seaward thinning area of the dipolar anomaly respectively. X-axis positions of symbols on panels (b) to (e) represent the middle of the five-year data intervals and the y-axis positions represent the mean anomalous dh/dt value within the delineated region. Horizontal bars indicate the time period over which we calculated the anomalous dh/dt estimate. Formal error of each mean anomalous dh/dt estimate is smaller than the marker.

The dh/dt thresholds we used to delineate continuous boundaries around the anomalies in the ICESat-2 ATL15 data product (Fig. 4a) and their fixed areas were: −0.050 m a−1 for the crescent-shaped anomaly covering an area of 917 km2; 0.080 m a−1 for the thickening dipolar anomaly covering an area of 1743 km2; −0.35 m a−1 for the inland thinning dipolar anomaly covering an area of 577 km2; and the space between the inland signal boundary and the previously mapped grounding zone (Depoorter and others, Reference Depoorter2013) for the seaward thinning dipolar anomaly covering an area of 552 km2. Within each fixed boundary, we estimated the mean anomalous dh/dt for each period of the time series (Fig. 4) and describe the resulting height changes below.
The anomalous dh/dt signal of the crescent-shaped anomaly remained steady with a mean of −0.173 ± 0.003 m a−1 throughout the time series (Fig. 4b). The peak magnitude of the crescent-shaped anomaly, −0.208 ± 0.003 m a−1, occurred during the 2015–19 interval.
The thickening portion of the dipolar signal sustained its anomalous signal over the 20-year time series with a mean of 0.301 ± 0.004 m a−1 (Figs. 4a, c). The anomalous thickening signal here reached its maximum magnitude of 0.420 ± 0.005 m a−1 in the 2012–16 interval.
The adjacent thinning portion of the dipolar anomaly, on the other hand, appeared to be the most time-variable of the anomalies in the CIR region. Both the inland (Fig. 4d) and seaward (Fig. 4e) portions of the thinning anomaly maintained anomalous thinning signals (with mean anomalous dh/dt values of −0.595 ± 0.010 m a−1 and −0.434 ± 0.010 m a−1, respectively) throughout the time series. However, as the inland thinning signal began increasing in magnitude (i.e. more negative) after the 2012–16 interval (with mean anomalous dh/dt values from −0.575 ± 0.011 m a−1 in 2012–16 to its maximum of −0.703 ± 0.014 m a−1 in the ICESat-2 2018–22 interval), the seaward signal decreased in magnitude (from −0.589 ± 0.012 m a−1 in 2012–16 to −0.206 ± 0.007 m a−1 in the CryoSat-2 2018–22 interval).
Mass balance estimation
We used the anomaly delineations to partition the CIR region into four subregions for anomalous mass balance calculations based on anomalous dh/dt: WIP, Crary (an area encompassing the crescent-shaped anomaly to the CIR complex, excluding WIP), the thickening portion of the dipolar anomaly, and the thinning portion of the dipolar anomaly (Figs. 5, S6). Throughout the time series, the WIP subregion (Fig. 5b) and both the Crary (Fig. 5c) and thickening dipolar (Fig. 5d) subregions exhibited opposite trending signals (i.e. when WIP experiences increased anomalous mass gain, Crary and the thickening dipolar subregion experience increased anomalous mass loss). Between the 2012–16 and 2015–19 intervals, the WIP subregion increased its anomalous mass gain rate from 0.159 ± 0.011 Gt a−1 to 0.563 ± 0.011 Gt a−1 (Fig. 5b). The thinning of the Crary subregion, on the other hand, amplified from an anomalous mean of −0.025 ± 0.031 Gt a−1 in the 2012–16 to −0.694 ± 0.026 Gt a−1 in the 2015–19 interval (Fig. 5c). Likewise, the thickening dipolar subregion decreased from a mean anomalous thickening of 0.671 ± 0.007 Gt a−1 in the 2012–16 interval to a mean of 0.416 ± 0.006 Gt a−1 in the 2015–19 interval (Fig. 5d). The thinning dipolar subregion maintained a steady anomalous mass loss rate with a mean of −0.537 ± 0.009 Gt a−1 (Fig. 5e). Considered together over the entire time series, the anomalous mass balance of the dipolar anomalies had a mean of −0.028 ± 0.008 Gt a−1.
20-year record of mean anomalous geodetic mass balance derived from anomalous ice surface-elevation change rate (dh/dt) estimates within large subregions of the Crary Ice Rise region. (a) Outlines of subregions within the study area: WIP (yellow), Crary (pink), thickening area of the dipolar anomaly (blue), and thinning area of the dipolar anomaly (purple). Background colors show ICESat-2 ATL15-derived surface-elevation change (calculated between 22 December 2021 through 23 March 2022 (cycle 14) and the ATL14 reference DEM). Grounding line (Depoorter and others, Reference Depoorter2013) shown in black. Inset map of the subregions provided for clarity with striped regions indicating region c includes data from subregions d and e. 20-year time series of mean anomalous geodetic mass balance (in Gt a−1) for (b) WIP, (c) Crary, (d) thickening area of the dipolar anomaly, and (e) thinning area of the dipolar anomaly. X-axis positions of symbols on panels b to e represent the middle of the five-year data intervals used to estimate anomalous dh/dt and the y-axis positions represent mean anomalous mass balance within the delineated region. Horizontal bars indicate the time period over which we estimated anomalous mass balance. Formal error of each anomalous mass rate estimate is smaller than the marker.

Discussion
The combined satellite altimetry observations from the ICESat, CryoSat-2, and ICESat-2 missions, all processed using a unified framework that ensures consistency between dh/dt estimates, provided a previously unavailable opportunity to capture patterns of pinning-point region thickness variability across two decades. The 20-year persistence of the dh/dt anomalies in the CIR region (Fig. 3) provides evidence that the anomaly timescales are not solely products of short-term system variability (e.g. from atmospheric or tidal forcing). Below, we discuss the relationship between each of the locations of the persistent dh/dt anomalies and ongoing, long-term WIS deceleration and ice-flow redirection concentrated over the Crary peninsula (as seen by the rotation of modern velocity since observations in the 1970s; Figs. 1b, 6).
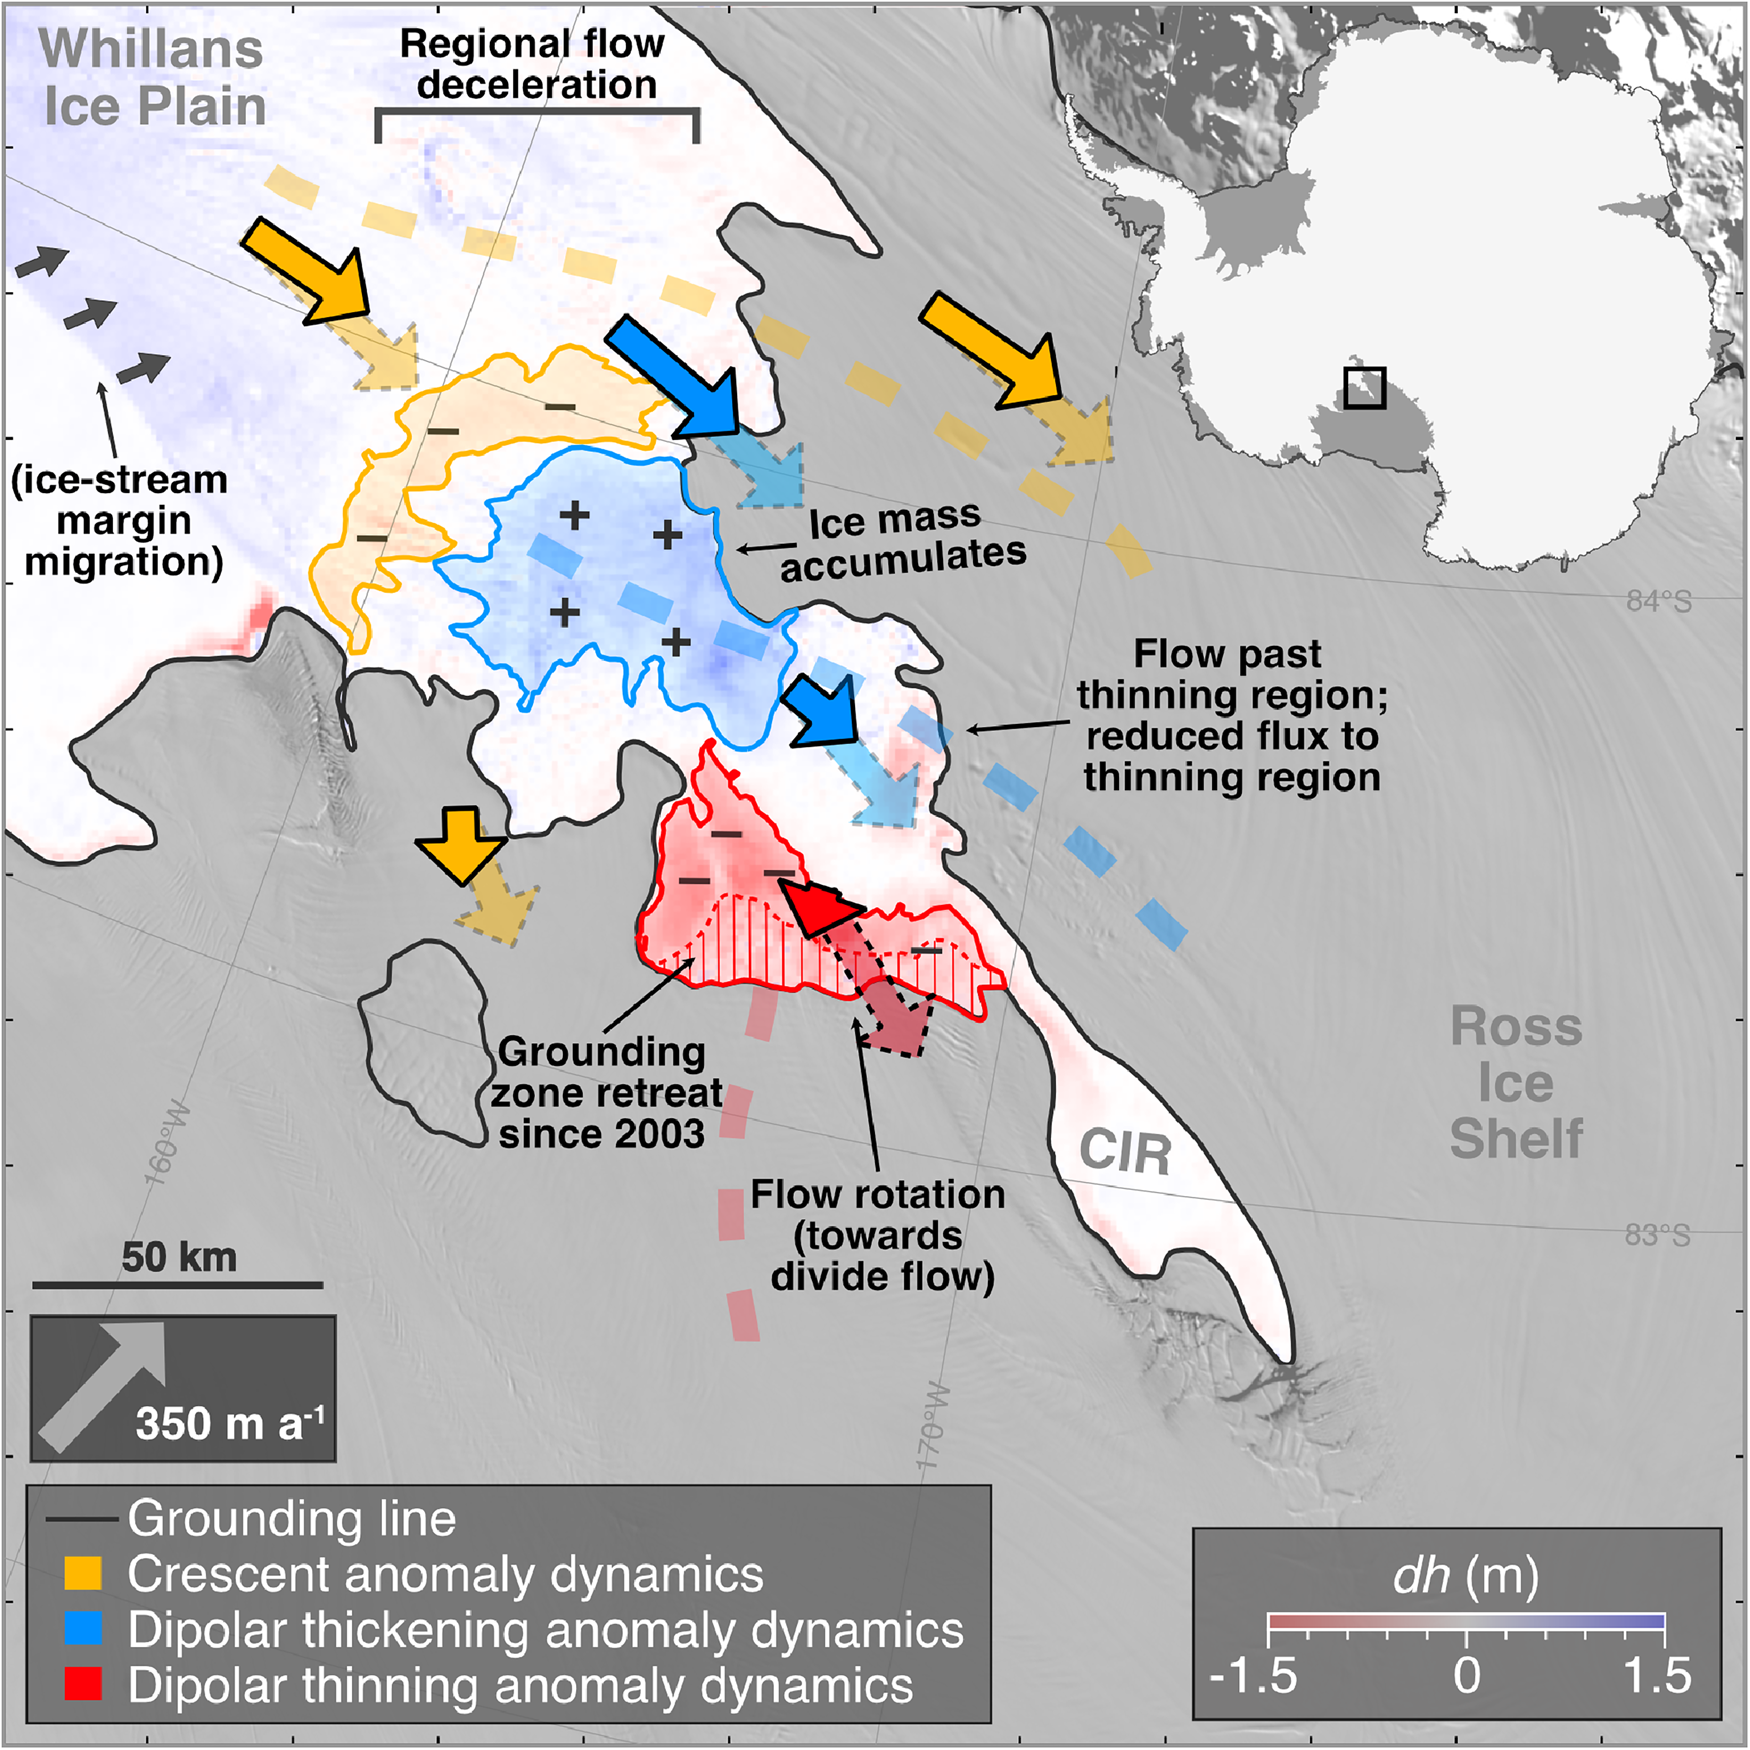
Summary of observed ice dynamics contributing to the major ice surface-elevation change rate (dh/dt) anomalies of the Crary Ice Rise region. Crescent-shaped anomaly dynamics in yellow; dipolar thickening anomaly dynamics in blue; dipolar thinning anomaly dynamics in red. Modern velocity shown with opaque arrows, and historic velocity shown with transparent arrows. Dashed curves are schematic representations of flowlines. Black annotations describe observed ice dynamics and hypothesized future ice dynamics in parentheses. Background colors show ICESat-2 ATL15-derived surface-elevation change (calculated between 22 December 2021 through 23 March 2022 (cycle 14) and the ATL14 reference DEM; Smith and others, Reference Smith2022); background imagery from the MODIS Mosaic of Antarctica (Scambos and others, Reference Scambos, Haran, Fahnestock, Painter and Bohlander2007); grounding line (black line) from Depoorter and others (Reference Depoorter2013); inset map shows the location in Antarctica.
Crescent-shaped dh/dt anomaly
The crescent-shaped anomaly maintained its position between lower WIP and Crary peninsula throughout the 20-year record (Figs. 2, 3). The persistent location and magnitude of this anomaly are likely a product of ongoing flow divergence resulting from both WIP deceleration and downstream flow rotation away from the Crary peninsula (Figs. 1b, 6). As ice flow from upstream rotates south, the amount of ice flowing into the crescent-shaped area decreases while outflow appears to be maintained. In addition to potentially encouraging future shear margin migration due to deceleration-induced flow rotation on WIP (e.g. Hulbe and Fahnestock, Reference Hulbe and Fahnestock2004; Stearns and others, Reference Stearns, Jezek and Van Der Veen2005; Catania and others, Reference Catania, Scambos, Conway and Raymond2006), the resulting persistent thinning observed at the crescent-shaped anomaly (Fig. 4b) may indicate an ongoing tendency towards further isolation of Crary peninsula and development of divide flow upstream of CIR (Fig. 6).
The position of the crescent-shaped anomaly also approximately corresponds to the location of the Northern Sticky Spot, a localized region of high basal friction surrounded by a well-lubricated bed that, in part, regulates the flow of WIP (Fig. 1b; Winberry and others, Reference Winberry, Anandakrishnan, Alley, Wiens and Pratt2014). In addition, Engelhardt Subglacial Lake is located on the northeast end of this anomaly (Fig. 1b), where the crescent-shaped anomaly meets WIP's northern shear margin (a boundary where ice transitions from fast (i.e. streaming) to slow flow). Engelhardt Subglacial Lake has been observed draining, then refilling (e.g. Fricker and others, Reference Fricker, Scambos, Bindschadler and Padman2007; Siegfried and Fricker, Reference Siegfried and Fricker2018) during this observational period, with a potential indication of drainage in the most recent 2018–22 ICESat-2/CryoSat-2 period (Figs. 2d, 3d, S1j, S1k, S4j, S4k), suggesting a redistribution of basal water affecting flow along WIP over the past two decades. Although the dynamic interplay between a region of persistent thinning that increases ice-thickness gradients, a sticky spot, and a large active subglacial lake has never been comprehensively assessed, this region has been identified as a potential location of rapid and substantial shear margin migration that could narrow WIP by 25 km or more (Bougamont and others, Reference Bougamont2015; Elsworth and Suckale, Reference Elsworth and Suckale2016); such an event would substantially modify the overall mass balance of West Antarctica, suggesting deeper examination of the complex dynamics in this location is needed for refined projections of ice-sheet mass balance in the Ross sector of Antarctica.
Dipolar dh/dt anomalies
The positions of the dipolar anomalies on the Crary peninsula correspond to the region experiencing the greatest modern flow redirection (up to a $35^\circ$ rotation to the north; Figs. 1b, 6). The more rapid deceleration and greater flow rotation on the north side of Crary peninsula encouraged ice accumulation in the thickening portion of the dipolar anomaly (Figs. 4c, 6). The reconfigured flow regime that developed since the 1970s starves the thinning portion of the dipolar anomaly of ice influx (Fig. 6). Combined mass balance of the dipolar anomalies from 2003–22, however, remains near zero (assuming anomaly areas remained grounded; Figs. 5d, e): this pattern may therefore represent a substantial mass redistribution on Crary peninsula despite the overall regional thickening and mass gain upstream on WIP (e.g. Joughin and others, Reference Joughin2005; Smith and others, Reference Smith2020).
The two subregions we identified in the thinning portion of the dipolar anomaly evolved differently over the 20-year record: whereas the landward subregion experienced increased magnitudes of thinning over the time series (Fig. 4d), the seaward subregion exhibited rapidly decreased magnitudes of thinning starting in 2015 (Fig. 4e). We suggest this observation is evidence of localized grounding zone retreat (Fig. 6). Unlike the other anomaly regions (Figs. 4b, c), the thinning signal exhibits much greater spatial and temporal variability (Figs. 4d, e). The most diagnostic piece of evidence is that the zone of maximum dh/dt migrates landward of the original grounding zone (Figs. 2, 3, 4d, e), implying the surface-height change due to thinning in the seaward subregion is partially offset by flotation. As sites transition from fully grounded to fully floating, surface observations of dh/dt for a given thinning rate decrease by up to 90% (e.g. Robin, Reference Robin1958; Holdsworth, Reference Holdsworth1969).
Previous work using tidal repeat-track analysis of ICESat-2 data also suggested grounding zone retreat of up to 15 km landward in this area between the ICESat and ICESat-2 eras (Li and others, Reference Li, Dawson, Chuter and Bamber2022); our method provides an updated areal extent and more precise timeline of grounding zone dynamics: an area of 552 km2 ungrounded between 2015 and 2022, likely due to thinning induced by the localized reduction of inflowing ice (Fig. 6). If grounding zone retreat and thinning continue at the Crary peninsula, the impact of buttressing contributions from the CIR complex downstream may further decrease because of deceleration and regional thickening. For now, the backstress appears to be redistributed upstream from CIR to WIP, although the continuity of total backstress to WIS from this new regional stress-balance reconfiguration is unknown. Paleo-ice-sheet records from the Ross Sea continental shelf indicate that full decoupling from a pinning point after 100s or 1000s of years can abruptly initiate grounding line retreat of 100s of m a−1 (Halberstadt and others, Reference Halberstadt, Simkins, Greenwood and Anderson2016; Bart and Kratochvil, Reference Bart and Kratochvil2022), presenting a potential analog for the future of CIR and WIP if grounding zone retreat and divergence-driven thinning continue.
The co-evolution of ice-stream dynamics and pinning points
When the WIP subregion experienced an increase in anomalous mass gain between the 2012–16 and 2015–19 intervals (Fig. 5b), the Crary subregion exhibited increased anomalous mass loss (Fig. 5c). This relationship suggests that deceleration and thickening of WIP ultimately reduced the flux of ice from WIP into the Crary subregion—a critical region that historically buttressed upstream ice (MacAyeal and others, Reference MacAyeal, Bindschadler, Shabtaie, Stephenson and Bentley1987, Reference MacAyeal, Bindschadler, Stephenson, Shabtaie and Bentley1989; Still and others, Reference Still, Campbell and Hulbe2019). This on-going starvation of inflowing ice to the Crary subregion likely initiated the unique dynamics of the Crary peninsula we identified in the dipolar anomaly (Fig. 6). The dipolar anomaly represents an adjustment within the pinning-point region to the slow-down of WIS along with on-going responses to prior flux variation on WIS and the neighboring stagnant Kamb Ice Stream. In the CIR region, we have observed: (i) a redistribution of mass southward (Figs. 5, 6); (ii) grounding zone retreat (Figs. 4e, 6), and (iii) ice-flow rotation (toward divide flow; Figs. 1b, 6).
On-going, coupled pinning-point region adjustments and flow rotation here, with evolving ice influx and the opposing mass balance of WIP and the Crary subregion, suggest that the buttressing contributions of the CIR region are also time-variable. The observations of persistent dh/dt and mass balance patterns in the CIR region (Figs. 2, 3, S1, S4) provide new evidence that as WIS continues to decelerate, its interactions with evolving pinning-point regions potentially introduce feedbacks between deceleration and buttressing that complicate the mode of and evolution toward stagnation. The ice-stream/pinning-point interactions we observed in the surface signals here likely predate our observations given the history of WIP dynamics (e.g. Bindschadler and Vornberger, Reference Bindschadler and Vornberger1998; Beem and others, Reference Beem2014). Additionally, the impact of far-field buttressing contributions in a co-evolving ice-stream/pinning-point region, such as those transmitted from Ross Island (e.g. Reese and others, Reference Reese, Gudmundsson, Levermann and Winkelmann2018), may influence regional buttressing evolution. We would therefore need to include observational records that reach much farther in the past (e.g. deformation history from englacial radar) to fully investigate the feedbacks here.
The limited coverage of satellite-derived velocity estimates this far south also prevents more in-depth interpretations of stress changes around the current CIR pinning point. However, the patterns of surface-height changes can still be diagnostic of the governing processes driving regional change and provide a window into the force-budget evolution (e.g. Hulbe and others, Reference Hulbe, Scambos, Lee, Bohlander and Haran2013). For example, the modeled response in ice thickness generated by a simultaneously decreased ice flux from upstream WIS and increased basal resistance across WIP is more spatially complex in the CIR region than the impact of either process individually even when the boundary-condition modifications are applied uniformly (Hulbe and others, Reference Hulbe, Scambos, Lee, Bohlander and Haran2013); the spatial complexity of our observational time series, particularly compared to previously modeled height perturbations, suggests the interplay of multiple regional processes and local responses as a result of CIR providing an obstacle to changing flow. Further, the changes in ice-thickness gradients feedback into the regional force-budget, modifying the inferred basal traction and therefore the underlying water systems that affect ice-stream flow (e.g. Still and Hulbe, Reference Still and Hulbe2021). We demonstrate that the evolution of these diagnostic transients, which arise from the co-evolution of the coupled ice-stream/pinning-point system, is now observable in the satellite record. Continuing our multi-decadal observations of dh/dt, particularly together with increased satellite velocity mapping capabilities (e.g. by the left-looking NASA-ISRO SAR (NISAR) mission; Rosen and Kumar, Reference Rosen and Kumar2021), will be necessary to fully resolve the ambiguities of past, present, and future co-evolution of ice-stream flux and pinning-point region processes not yet captured by models.
Summary
We generated a 20-year (2003–22) time series of surface elevation and anomalous surface elevation over the CIR region using combined altimetry observations from ICESat (2003–09), CryoSat-2 (2010–22), and ICESat-2 (2018–22). Our time series revealed persistent, localized signals of anomalous thickening and thinning throughout the multi-decadal observational period indicating active pinning-point adjustment. Although these adjustments may be in-part a response to ongoing ice-stream reorganization, the ice-stream/pinning-point interactions we observed in the surface signals here likely represent more complex feedbacks between ice-stream stagnation and pinning-point buttressing that predate our observations.
Our 20-year record of surface-elevation anomalies detected in the CIR region provides insights into ice-dynamic co-evolution between pinning points and ice-stream cycles and its impact on localized trends in mass balance. This mass redistribution modifies the buttressing regime of the southern Ross Ice Shelf embayment through grounding zone retreat, reduced regional mass, and the tendency towards pinning-point isolation. Future work combining our multi-mission satellite altimetry records with comprehensive, time-resolved maps of ice velocity and ice-penetrating radar will help quantify feedbacks between ice-stream dynamics and pinning-point evolution.
Supplementary material
The supplementary material for this article can be found at https://doi.org/10.1017/jog.2024.79.
Data
All code used to generate figures and analyze data is available via GitHub (Verboncoeur and others, Reference Verboncoeur2024b). Surface-elevation change time series from this study are available for download from Zenodo (Verboncoeur and others, Reference Verboncoeur2024a).
Acknowledgements
This research was supported by US National Science Foundation (NSF) grant to M.R.S. (grant OPP-2049302). Contributions from N.H. supported by NASA award 80NSSC20K0958. Contributions by W.S. and D.B. supported by NASA award 80NSSC21K0912. NSF supported H.V.'s contribution to the manuscript through their Graduate Research Fellowship (grant DGE-2137099). We give special thanks to J. Millstein and R. Venturelli for insightful discussions. We thank two anonymous reviewers and the scientific editor for thoughtful comments that improved our manuscript.


 Open access