




Introduction
Many insects are in decline worldwide (Hallmann et al. Reference Hallmann, Sorg, Jongejans, Siepel, Hofland and Schwan2017), with habitat loss considered to be one of the main contributing factors for many species (Wagner Reference Wagner2020). In the prairie region of North America, most land was converted into agricultural production during the time of western expansion. In Manitoba, this began in the early 1800s, but conversion of land to agriculture rapidly increased in the 1870s, when railways were constructed (Henderson and Koper Reference Henderson and Koper2014). Today, less than 30% of historic prairie land exists in Manitoba, and this amount continues to decrease (Alemu et al. Reference Alemu, Henebry and Assefa2020). The conversion of prairies has resulted in the decline of many insect species, with many listed as endangered in this region (Hall et al. Reference Hall, Catling, Lafontaine and Floate2011). This is problematic because insects provide many ecological functions, including pollination (Klein et al. Reference Klein, Vaissière, Cane, Steffan-Dewenter, Cunningham, Kremen and Tscharntke2007), biological control (Rutledge et al. Reference Rutledge, O’Neil, Fox and Landis2004), and nutrient recycling (Belovsky and Slade Reference Belovsky and Slade2000). Bees are one of the most important pollinators: they directly collect pollen and nectar to feed their offspring, which often results in greater crop yield and quality (Garibaldi et al. Reference Garibaldi, Steffan-Dewenter, Winfree, Aizen, Bommarco and Cunningham2013). Bee pollination services contribute to at least 25% of global food production (Klein et al. Reference Klein, Vaissière, Cane, Steffan-Dewenter, Cunningham, Kremen and Tscharntke2007). However, bee populations are in decline (Grixti et al. Reference Grixti, Wong, Cameron and Favret2009).
Bees, as with many organisms, require access to food, mates, and shelter to reproduce. Oligolectic bees collect pollen from a narrow range of hosts, and polylectic bees forage on a wider assortment of floral families. Some oligolectic bees specialise on crops, including blueberries (Ericaceae) (Cane and Payne Reference Cane and Payne1988), cranberries (Ericaceae) (Payette Reference Payette2013), sunflowers (Asteraceae) (Frolich and Parker Reference Frolich and Parker1983), and squash (Cucurbitaceae) (López-Uribe et al. Reference López-Uribe, Cane, Minckley and Danforth2016). The specialisation of oligolectic bees makes them important for crop pollination, but their narrow dietary range can sometimes increase rates of population declines (Bartomeus et al. Reference Bartomeus, Ascher, Gibbs, Danforth, Wagner, Hedtke and Winfree2013; Wood et al. Reference Wood, Gibbs, Graham and Isaacs2019) and increase the species’ vulnerability to global climate change (Böttcher Reference Böttcher2023).
Bees may build nests in a variety of locations, including in the ground (Antoine and Forrest Reference Antoine and Forrest2021), in plant stems (Krombein Reference Krombein1967), and in hives (Kwafo et al. Reference Kwafo, Galpern and Cartar2023). Many ground- and stem-nesting species are solitary, generally living their lives alone, but many hive-nesting species are also eusocial, building colonies with hundreds or even thousands of worker bees (see Gibbs et al. Reference Gibbs, Hanuschuk, Miller, Dubois, Martini and Robinson2023 for bee species traits). These traits may make species more or less vulnerable to environmental changes (Caitano et al. Reference Caitano, Chaves, Dodonov and Delabie2020), but overall, effects vary between locations (Bartomeus et al. Reference Bartomeus, Cariveau, Harrison and Winfree2018).
Various contributing factors for bee population declines have been identified (Goulson et al. Reference Goulson, Nicholls, Botías and Rotheray2015), but the causes of these declines are often numerous and compounded, resulting in a “death by a thousand cuts,” as Wagner et al. (Reference Wagner, Grames, Forister, Berenbaum and Stopak2021) described. Given bees’ importance for crop production, their increased rates of decline in agricultural areas, and the inconsistent landscape effects between regions, understanding ways to conserve their populations should be a priority.
In western Manitoba, livestock production, especially cattle production, is a common form of agriculture (Agriculture and Agri-Food Canada 2020). Much of the native prairie grasslands in the region have been lost (Samson and Knopf Reference Samson and Knopf1996), and areas that are used for grazing may act as a managed substitute. Grazed pastures may increase local vegetation diversity and insect capture rates relative to those found in surrounding areas (Vulliamy et al. Reference Vulliamy, Potts and Willmer2006) and also may act as a reserve of insects in areas where little natural vegetation grows (Morandin et al. Reference Morandin, Winston, Abbott and Franklin2007).
Most bee conservation programmes aim to change local landscapes to benefit pollinators. This is generally accomplished by increasing either floral abundance or nesting areas. Sowing seed mixes (Blaauw and Isaacs Reference Blaauw and Isaacs2014) or altering local agricultural practices, including grazing (Kimoto et al. Reference Kimoto, Debano, Thorp, Taylor, Schmalz and Delcurto2012), may increase floral abundance. Sowing seed mixes generally increases pollinator capture rates and diversity (Blaauw and Isaacs Reference Blaauw and Isaacs2014; Kordbacheh et al. Reference Kordbacheh, Liebman and Harris2020; Albrecht et al. Reference Albrecht, Kleijn, Williams, Tschumi, Blaauw and Bommarco2021; Killewald et al. Reference Killewald, Costamagna, Lawley, Gulden and Gibbs2024). The responses of bees to grazing practices, however, are inconsistent. For example, Hatfield and LeBuhn (Reference Hatfield and LeBuhn2007), Kruess and Tscharntke (Reference Kruess and Tscharntke2002), Sjödin (Reference Sjödin2007), and Vulliamy et al. (Reference Vulliamy, Potts and Willmer2006) found grazing positively affected bee capture rates, whereas Harmon-Threatt and Chin (Reference Harmon-Threatt and Chin2016) and Yoshihara et al. (Reference Yoshihara, Chimeddorj, Buuveibaatar, Lhagvasuren and Takatsuki2008) indicate negative effects, and Kimoto et al. (Reference Kimoto, Debano, Thorp, Taylor, Schmalz and Delcurto2012) found that effects vary based on insect group. Grazing intensity plays a role in vegetation structure, particularly if forbs are composed of unpalatable species (Mayer Reference Mayer2004; Milton and Dean Reference Milton and Dean1990), because grazing allows less-palatable species to persist. Given the varied responses to grazing, analysing bee population responses to local grazing practices is important to better understand this management practice within Manitoba.
If livestock are not allowed to graze, they are often fed hay or other harvested grains. In western Manitoba, nongrazed lands are typically used for hay production, with alfalfa being the main forage crop. Many bees pollinate alfalfa (Stephen Reference Stephen1955), but monoculture crops often result in lower pollinator capture rates and diversity (Kremen et al. Reference Kremen, Williams and Thorp2002). Increasing floral diversity in hay fields may support greater pollinator diversity. Designing and sowing a seed mix with livestock-friendly forbs that also produce resources for pollinators may benefit both producers and bees, but these practices have not been thoroughly tested (but see Buri et al. Reference Buri, Humbert and Arlettaz2014).
The present study had two objectives: (1) to determine differences in bee capture rates and functional traits between grazed sites, enhanced hay fields, and natural areas (used as a control) in western Manitoba, and (2) to determine relationships between local and landscape variables on bee capture rates in the region. We hypothesised that grazed sites may hold an intermediate capture rate of bees compared to hay and natural sites, that each treatment type will host a unique community of bees, and that community structure varies based on the surrounding landscape.
Methods
Site selection
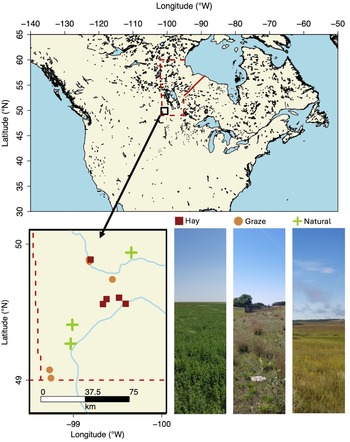
We selected 13 sites within the rangeland agricultural area of Manitoba, Canada (Fig. 1). Of these sites, five were grazed by cattle (graze treatment), five were planted with a pollinator-friendly hay mix designed by the Xerces Society (Portland, Oregon, United States of America, https://xerces.org/; hay treatment; seed mix included in Supplementary material, Table S1), and three were areas that had been unmanaged for at least five years before sampling (natural treatment). We sampled sites at least once per season over three years (2020–2022). In the graze treatment, cattle were typically rotationally grazed with one week on and three weeks off the pastures. Most cattle producers kept roughly 30–50 cow–calf pairs per field (mean field size: 79 ± 4 ha; 196 ± 9.85 acres). Graze sites varied in area but were commonly 1-square-mile (260-ha) sections separated into four, rotationally grazed, paddocks.
Locations of sites that were sampled for bees in Manitoba, Canada, in the summers of 2020, 2021, and 2022. The following treatments were included: graze – locations that are rotationally grazed by cattle; natural – sites that have not been managed for at least five years; and hay – fields that have been planted with an enhanced hay mixture. Images of representative vegetation structure (labelled) for each treatment are included below. Dashed red lines represent the borders of Manitoba. This figure was created using the PBSmapping package in R (R Core Team 2023; Schnute et al. Reference Schnute, Boers, Haigh, Couture-Beil, Chabot and Grandin2024). Sample sizes: graze – n = 5; natural – n = 3; hay – n = 5.

Seed mixes for the hay treatment were planted by the farmers at least one year before sampling. Farmers were instructed to cut the study fields only after the alfalfa had finished blooming and to leave a strip of vegetation along the edges to allow pollinators opportunity to forage on sown plants. However, farmers harvested the entire fields during this study. Farmers generally cut hay fields twice per season, and sampling was conducted before cutting.
Most of the natural areas used in the present study were wildlife management areas that are open to the public (Gerald W. Malaher Wildlife Management Area, Melita, Manitoba, and Broomhill Wildlife Management Area, Broomhill, Manitoba), with the exception of one natural area that is a privately owned 32-ha pasture that has not been grazed or managed for the last decade.
The vegetation at the grazed and natural sites included whatever naturally occurring vegetation could persist under local conditions. The vegetation at the hay sites was terminated, and the seed mix was sown by the farmers in the summer of 2019.
Targeted pollinator netting
Wild bees only were collected during conditions favourable for bee activity (above 20 °C, minimal wind, enough sun to see your shadow, and not actively raining). Abundance of honey bees, Apis mellifera (Hymenoptera: Apidae), was noted, but they were not collected because they are actively managed in North America, and they were not included in the present study’s analysis. Wild bees were collected along six 50-m transects for 10 minutes per transect. To standardise search time between transects, timers were paused while insects were transferred into vials. The bees were separated, based on transect type (random or targeted), transect number (1–3), and host plant. A stratified sampling design was used that included two different types of transects: random and targeted (McFrederick and LeBuhn Reference McFrederick and LeBuhn2006). At each site, three targeted and three random transects were used to capture bees. Net transects were conducted between 12 July and August 10 in 2020, 2021, and 2022. Each site was sampled an average of 1.15 (± 0.06, range 1–2) times each year. Over the three sampling years, a total of 234 transect samples were processed.
Before visiting the fields, 200 random GPS coordinates were selected, and a new sampling location was selected at each visit. Coordinates located in water or in the middle of a herd of cattle were not sampled; instead, the next coordinate on the list was selected. When we arrived at the sampling location, a random number generator was used to select a direction for the transect (0–360), and a compass was used to verify transect direction before sampling. At each site, three random transects were sampled during each visit. Targeted transects (targeted treatment) – whereby transects were placed within high floral abundance areas on each field, preferably where bees were visible – were also sampled in order to capture the highest diversity of pollinators possible at each site. At each site, three targeted transects were sampled during each visit.
Specimen processing
Bees were pinned and identified to species. Taxon concepts were based on taxonomic literature and were referenced against expertly identified specimens. Bees were first identified to genus (Packer et al. Reference Packer, Genaro and Sheffield2007) and then to species using described taxon concepts: Andrenidae (LaBerge Reference LaBerge1967, Reference LaBerge1969, Reference LaBerge1971, Reference LaBerge1973, Reference LaBerge1977, Reference LaBerge1980, Reference LaBerge1986, Reference LaBerge1987, Reference LaBerge1989; Ribble Reference Ribble1967, Reference Ribble1968, Reference Ribble1974; LaBerge and Bouseman Reference LaBerge and Bouseman1970; LaBerge and Ribble Reference LaBerge and Ribble1972, Reference LaBerge and Ribble1975; Bouseman and LaBerge Reference Bouseman and LaBerge1979; LaBerge and Thorp Reference LaBerge and Thorp2005; Shinn Reference Shinn1967), Apidae (LaBerge Reference LaBerge1956a, Reference LaBerge1956b, Reference LaBerge1961; Laverty and Harder Reference Laverty and Harder1988; Droege et al. Reference Droege, Rightmyer, Sheffield and Brady2010; Rehan and Sheffield Reference Rehan and Sheffield2011; Williams et al. Reference Williams, Thorp, Richardson and Colla2014; Droege and Rehan Reference Droege and Rehan2016; Onuferko Reference Onuferko2017, Reference Onuferko2018), Colletidae (Stephen Reference Stephen1954; Snelling Reference Snelling1966, Reference Snelling1968, Reference Snelling1970, Reference Snelling1983), Halictidae (Sandhouse Reference Sandhouse1941; McGinley Reference McGinley1986, Reference McGinley2003; Coelho Reference Coelho2004; Gibbs Reference Gibbs2010, Reference Gibbs2011; Gibbs et al. Reference Gibbs, Packer, Dumesh and Danforth2013), and Megachilidae (Sandhouse Reference Sandhouse1939; Michener Reference Michener1947; Baker Reference Baker1975; Sheffield et al. Reference Sheffield, Ratti, Packer and Griswold2011; Gonzalez and Griswold Reference Gonzalez and Griswold2013; Semmler et al. Reference Semmler, Olynyk, Miller and Gibbs2017).
Species traits
We used Gibbs et al. (Reference Gibbs, Hanuschuk, Miller, Dubois, Martini and Robinson2023) to extract trait information for each of the bee species identified in this study (n = 70). We collected information on the species’ sociality, nesting location, and lecty (Supplementary material, Table S2). One species, Ceratina calcarata (Hymenoptera: Apidae), is subsocial, meaning they provide additional care for young but lack the social structure of eusocial species such as Apis or Bombus (Hymenoptera: Apidae). Because we collected only one specimen of this species, we removed it from the sociality analysis. We combined species listed as a nesting location of “cavity” and “stem” into the “stem-nesting” category for our analysis. All cavity nesters collected were either Megachile or Osmia. We collected only one species, Anthophora terminalis (Hymenoptera: Apidae), that was listed as nesting in wood; we therefore removed this species from the nesting location analysis.
Vegetation and weather data
Vegetation and weather data were collected on the same days as the targeted pollinator netting was undertaken and were used as explanatory variables in analyses. Floral surveys were conducted at each transect. A 1-m × 0.5-m quadrat was placed every 5 m along the transect (n = 11 quadrats per transect), and published figures (Folk Reference Folk1951) were used to visually estimate the percent groundcover of forbs, grasses, and bare ground per quadrat. The cover of each blooming forb species was also visually estimated for each quadrat. Blooming forbs were identified according to Newcomb (Reference Newcomb1989) and Scoggan (Reference Scoggan1957) and were generally identified to species or to genus when species identity was uncertain. Vegetation data were summarised as the mean percent ground cover of forbs (blooming and nonblooming), grasses, and bare ground per quadrat, the average percent ground cover of blooming forbs per quadrat, and the mean blooming species richness per quadrat.
At each sample, local weather data were also collected. Cloud cover (sunny, partly cloudy, or overcast) was visually estimated, and average and maximum wind speeds and ambient air temperature were recorded with a Kestrel 3000 pocket weather meter (Nielsen–Kellerman Co., Philadelphia, Pennsylvania, United States of America).
Landscape data
Both landscape composition and landscape configuration data for each site were extracted using R, version 4.3.1 (R Core Team 2023). Landscape data were extracted from the appropriate annual crop inventory available online from Agriculture and Agri-Food Canada (2020, 2021, 2022). The raster, landscapemetrics, and sampSurf packages in R were used to extract and summarise landscape data from the above data layers (Gove Reference Gove2018; Hesselbarth et al. Reference Hesselbarth, Sciaini, With, Wiegand and Nowosad2019; Hijmans Reference Hijmans2021).
We separated landscape composition data into four categories that Killewald et al. (Reference Killewald, Costamagna, Lawley, Gulden and Gibbs2024) showed had varying effects on insect populations in Manitoba: melittophilous crops (canola, sunflower, alfalfa, etc.), anemophilous crops (wheat, oats, etc.), developed (urban centres, buildings, roads, etc.), and natural landcover types (grasslands, forests, wetlands, etc.). We extracted landscape composition data as the percent of natural, developed, melittophilous, and anemophilous crops at six spatial scales (0.5, 1, 1.5, 2, 2.5, and 3 km) from each site using the lsm_c_ca function from the landscapemetrics package (Hesselbarth et al. Reference Hesselbarth, Sciaini, With, Wiegand and Nowosad2019). We extracted data at multiple spatial scales because insects show varying responses to landscape variables (Karp et al. Reference Karp, Chaplin-Kramer, Meehan, Martin, DeClerck and Grab2018). We extracted landscape configuration data as the landscape Shannon diversity and edge density of landcover types using the lsm_l_shdi and lsm_l_ed functions (Hesselbarth et al. Reference Hesselbarth, Sciaini, With, Wiegand and Nowosad2019), respectively, at each of six spatial scales noted above. We summarised landcover types into major groups (melittophilous crops, anemophilous crops, urban, and natural) for the landscape configuration variables and then used landscape composition and configuration data at the six spatial scales in our models.
Data analysis
Honey bee counts were excluded from all data analysis for this manuscript: data for wild bees only are reported. Distance-based redundancy analysis and permutational analyses of variance were used to determine the compositional differences of bee communities between treatment groups. Ordinations were made using the capscale function in the vegan package (Oksanen et al. Reference Oksanen, Blanchet, Friendly, Kindt, Legendre and McGlinn2019), using the Bray–Curtis dissimilarity measure. Ordinations were then tested with a permutational multivariate analysis of variance using the adonis2 function using false discovery rate–corrected P-values in R (Oksanen et al. Reference Oksanen, Blanchet, Friendly, Kindt, Legendre and McGlinn2019; R Core Team 2023). The number of permutations was set to 999 using the permutations argument in the adonis2 function. Seeds were set before permutational analysis for reproducibility. If variance analysis results were significant, a post hoc test was performed using the pairwise.adonis function (Arbizu Reference Arbizu2017) to identify differences between treatment groups. Because significant results from permutational multivariate analysis of variance can be due to differences in group centroids or group dispersions (Anderson Reference Anderson, Balakrishnan, Colton, Everitt, Piegorsch, Ruggeri and Teugels2017), group dispersions were tested separately with the betadisper and permutest functions from the vegan package and using the TukeyHSD function from the stats package in R (Oksanen et al. Reference Oksanen, Blanchet, Friendly, Kindt, Legendre and McGlinn2019; R Core Team 2023). Unless stated otherwise in the results, no significant differences in dispersions between treatment groups were revealed. The variables driving the ordinations were tested using the envfit function from the vegan package (Oksanen et al. Reference Oksanen, Blanchet, Friendly, Kindt, Legendre and McGlinn2019) and fitted to the plots based on significant effects (P < 0.05).
Generalised linear mixed-effect models from the lme4 package were used to test for differences in bee capture rates between treatment groups (Bates et al. Reference Bates, Maechler, Bolker and Walker2015) using the glmer.nb function. The effects of field size were also compared in separate models. Site was used as a random effect for all models. The P-values for treatment effects were calculated using the Anova function from the car package (Fox and Weisberg Reference Fox and Weisberg2019). The emmeans function from the emmeans package (Lenth Reference Lenth2022) was used to test for differences between pairs of treatment groups.
We tested for local- and landscape-level effects on bee capture rates by adding weather, vegetation, and landscape variables, as described above, and retaining only significant variables in the final model. We built the models in three steps, removing nonsignificant variables at each step. At step 1, we built the base model, which included sampling day of year, latitude and longitude decimal coordinates of sites, time of sample, and the weather variables described above. Retaining significant variables from step 1, at step 2, we added the vegetation variables, and then simplified this model again. We then used models containing significant weather and vegetation variables to test the effects of the landscape at the present study’s six spatial scales.
Insect spatial scale response was tested by including landscape variables of each spatial scale into the model from step 2. The scale with the strongest response (the lowest corrected Akaike information criterion, AICc, score) was then selected, and this model was simplified again by retaining only significant variables. The variables were checked to ensure they were not correlated with each other by removing variables with a variance inflation factor greater than 10. This resulted in the final model, which contained only significant weather, vegetation, and landscape variables.
Results
Insect data
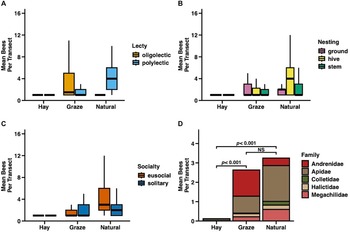
We collected a total of 495 individual wild bees from five families and 70 different species (Supplementary material, Table S2). Apidae were most abundant (n = 223), followed by Andrenidae (n = 159), Megachilidae (n = 65), Halictidae (n = 31), and Colletidae (n = 17). We collected 304 polylectic and 173 oligolectic bees. Fourteen of 17 oligolectic species specialise on various members of the Asteraceae. Sixteen individuals were parasitic species and do not collect pollen for their offspring. Two cleptoparasitic species, Triepeolus obliteratus Graenicher and T. occidentalis (Cresson) (both Hymenoptera: Apidae), likely attack Asteraceae specialists in the genus Melissodes (Hymenoptera: Apidae). We collected more solitary bees (n = 271) than eusocial bees (n = 205).
Insect community
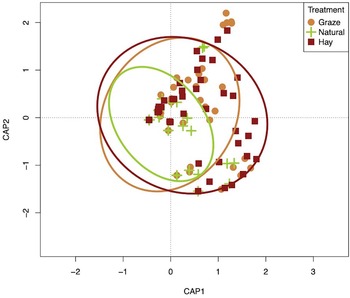
The species composition of sites differed significantly between treatments (PERMANOVA df = 2, F = 3.75, P < 0.001; Fig. 2). A pairwise test showed that each treatment was distinct (P < 0.03). The treatments also had significantly different dispersions from another (Tukey P = 0.001) and therefore had different levels of variation within sites of each group. The significant results from the permutational multivariate analysis of variance highlighted differences between the centroids, the variances in group dispersion of the three treatments, or both. A rarified species accumulation curve (Supplementary material, Fig. S1; rarified to n = 65 samples) indicates that natural sites (52.29 ± 1.84) and grazed sites (35.20 ± 2.60) accumulate species faster than hay sites do (6.92 ± 0.26).
Ordination of a distance-based redundancy analysis with Bray–Curtis dissimilarity of bee species composition at sites from three treatments. Honey bee counts were removed for this analysis. Ellipsis represents 95% confidence intervals around treatment groups. The following treatments were included: graze – locations that are rotationally grazed by cattle; natural – sites that have not been managed for at least five years; and hay – fields that have been planted with an enhanced hay mixture. Sample sizes (site–visits): graze – n = 16; natural – n = 12; hay – n = 11.

Bee capture rates
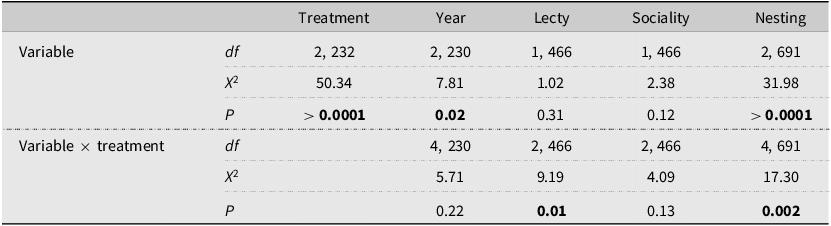
Bee capture rates differed significantly between treatments (Table 1; Fig. 3). We captured fewer bees in hay fields (0.12 ± 0.05) than in either grazed sites (GLMM 2.64 ± 0.53, df = 1, z = 6.51, P < 0.0001) or natural sites (GLMM 3.25 ± 0.48, df = 1, z = 6.79, P < 0.0001), while capture rates of bees in grazed and natural sites were similar. Bee capture rates also differed significantly between years (Table 1), but we observed no interaction between treatment and year. We collected significantly more bees in 2021 (3.02 ± 0.74) than in 2020 (GLMM 1.41 ± 0.32, df = 1, z = 2.45, P = 0.038), but other comparisons showed no difference.
Statistical results of generalised linear mixed effect models of wild bee capture rate data collected at sites of three treatments in Manitoba, Canada, in the summers of 2020, 2021, and 2022. Treatments included hay – fields that were planted with an enhanced hay mixture and were cut for livestock feed; graze – fields that were rotationally grazed by cattle; and natural – locations without any management and were unmanaged for at least five years prior to sampling. Honey bee counts were not included in this analysis. Variables included lecty – oligolectic and polylectic; sociality – solitary and eusocial; and nesting preference – ground (included ground and surface), nest (included nest and cavity), and hive. All models included a negative binomial distribution, with site as a random effect. Chi-squared values and P-values are calculated using a type 3 Wald chi-square test; the model with only treatment (no interaction term) used a type 2 test.

Stacked bar graph showing the average number of bees collected per transect at sites of three treatments – A, B, and C, based on traits, and D, based on family composition. Honey bee counts were removed for this analysis. P-values indicate results from a generalised linear mixed effect model testing the differences in bee abundance between treatments with site as a random effect. Data were collected in Manitoba, Canada, in the summers of 2020, 2021, and 2022, and the plot was created with ggplot in R (Wickham Reference Wickham2016; R Core Team 2023). The following treatments were included: graze – locations that are rotationally grazed by cattle; natural – sites that have not been managed for at least five years; and hay – fields that have been planted with an enhanced hay mixture. Sample sizes: graze – n = 16; natural – n = 12; hay – n = 11.

Lecty
Oligolectic bees were more common at grazed (GLMM 1.39 ± 0.5, df = 1, z = 3.9, P = 0.0009) and natural (GLMM 0.52 ± 0.2, df = 1, z = 3.18, P = 0.018; Table 1) sites than at hay sites (0.02 ± 0.02). Polylectic bees were most common at natural (GLMM 2.5 ± 0.38, df = 1, z = 5.46, P < 0.0001) and grazed (GLMM 1.21 ± 0.2, df = 1, z = 4.64, P < 0.0001) sites than at hay sites (0.11 ± 0.04). Polylectic bees were equally abundant in natural and grazed sites. We collected more polylectic (2.5 ± 0.38) than oligolectic (0.52 ± 0.2) bees in natural sites. Capture rates of polylectic and oligolectic bees were similar within hay and grazed sites.
Sociality
Both eusocial and solitary bees, respectively, were more common in natural sites (GLMM 1.59 ± 0.32, 1.41 ± 0.29, df = 1, z = 5.28, 4.82, P < 0.0001) and grazed sites (GLMM 0.87 ± 0.16, 1.74 ± 0.49, df = 1, z = 4.35, 5.04, P = 0.0002, < 0.0001) than in hay sites (0.09 ± 0.04, 0.03 ± 0.02). We collected equal numbers of eusocial and solitary bees within each of the three site treatments.
Nesting
Capture rates of ground-, hive-, and stem-nesting bee species were each significantly lower in hay sites than in the grazed and natural treatments. Capture rates of stem-nesting species at grazed sites were lower than capture rates of hive- and ground-nesting species. Stem nesters were more common in natural sites (0.72 ± 0.17) than in grazed sites (GLMM 0.18 ± 0.05, df = 1, z = 3.15, P = 0.04). We collected no stem-nesting bees from hay sites. Ground-nesting bees were more common in grazed (GLMM 1.68 ± 0.51, df = 1, z = 4.99, P < 0.0001) and natural sites (GLMM 0.84 ± 0.18, df = 1, z = 4.11, P = 0.001) than in hay sites (0.03 ± 0.02). Hive-nesting bees were more common in grazed (GLMM 0.75 ± 0.0.16, df = 1, z = 4.01, P = 0.002) and natural sites (GLMM 1.63 ± 0.33, df = 1, z = 5.29, P < 0.0001) than in hay sites (0.09 ± 0.04). We collected significantly fewer stem-nesting bees at grazed sites than at either ground-nesting (GLMM df = 1, z = 5.60, P < 0.0001) or hive-nesting bees (GLMM df = 1, z = 3.78, P = 0.005). Collections of ground- and hive-nesting bees at grazed sites were similar. Capture rates among ground-, hive-, and stem-nesting bees from hay and natural sites were similar.
Local and landscape effects on bee capture rates
Bees did not respond significantly to any vegetation variables but were positively associated with percent of developed landcover and negatively associated with percent cover anemophilous (cereal) crops at the largest, 3-km spatial scale. The final landscape model for bee capture rates is given below, where effect size (e) and variance inflation factors (v) are given in parentheses beside model terms. Asterisks show the significance of model terms on bee capture rates, where *P < 0.05, *P < 0.01, ***P < 0.001.
glmer.nb (wild bee capture rate ∼ treatment*** + (1| site) + percent of developed landcover at 3 k (e = 0.32, v = 1.55)* + % of anemophilous crop landcover at 3 k (e = –0.73, v = 1.54)***).
The number of bees collected per transect was positively associated with field size (GLMM 2.54 + 0.005 bees/acre, df = 1, X 2 = 4.31, P = 0.038; Fig. 4). No interaction between field size and treatment was detected.
Scatterplot of the total abundance of bees collected from each transect against field size of sites from three treatments. Honey bee counts were removed for this analysis. Standard error is represented around each trend line by the shaded areas. Data were collected in Manitoba, Canada, in the summers of 2020, 2021, and 2022, and the plot was created with ggplot in R (Wickham Reference Wickham2016; R Core Team 2023). The following treatments were included: graze – locations that are rotationally grazed by cattle; natural – sites that have not been managed for at least five years; and hay – fields that have been planted with an enhanced hay mixture. Sample sizes: graze – n = 16; natural – n = 12; hay – n = 11.

Hay sites contained more forb cover (66.4% ± 2.8) than the grazed sites (GLMM 39.85 ± 1.9, df = 1, t = 3.69, P = 0.007; Table 2) or the natural sites (GLMM 37.35 ± 2.36, df = 1, t = 3.75, P = 0.01) did. Hay sites also contained less floral diversity (H′ = 1.03 ± 0.015) than grazed sites (GLMM 2.38 ± 0.11, df = 1, t = 5.3, P = 0.0008) or natural sites (GLMM 2.33 ± 0.14, df = 1, t = 4.44, P = 0.003) did, with alfalfa (Fabaceae) comprising 99.3% (± 0.91%) of observed forb cover (63% of sown seed mix) at hay sites.
Average (standard error) values of Shannon diversity and percent cover of forbs, grasses, bare ground, blooming Asteraceae, and blooming Fabaceae at sites of three treatments in Manitoba, Canada, in the summers of 2020, 2021, and 2022. Treatments included: hay – fields planted with an enhanced hay mixture and were cut for livestock feed; graze – fields rotationally grazed by cattle; and natural – fields unmanaged during and for at least five years before the present study. Data were collected along six vegetation belt-transects per site that were 50 m long and sampled every 5 m.

Both forb cover and floral Shannon diversity were similar at the grazed sites and the natural sites. Floral community structure differed slightly between site types: we found more blooming Asteraceae at grazed sites (1.77 ± 0.29% blooming ground cover) than at hay sites (GLMM 0.04 ± 0.02, df = 1, t = 3.7, P = 0.006), but hay sites contained more blooming Fabaceae (6.9 ± 0.85) than either the grazed sites (GLMM 0.34 ± 0.08, df = 1, t = 7.1, P = 0.0001) or the natural sites (GLMM 0.72 ± 0.17, df = 1, t = 5.96, P = 0.0004) did. Natural sites contained roughly equal amounts of blooming Asteraceae and Fabaceae across an assortment of floral species, including Euphorbia (Euphorbaceae), Helianthus (Asteraceae), Melilotus (Fabaceae), Rudbeckia (Asteraceae), and Solidago (Asteraceae).
Discussion
We collected significantly fewer bees at hay sites than at natural and grazed sites. However, this trend is not surprising, given that the hay fields contained mostly alfalfa, despite attempts during the present study to increase their floral diversity. Alfalfa is attractive to Bombus (Wood et al. Reference Wood, Gibbs, Graham and Isaacs2019) and Megachile (Pitts-Singer and Cane Reference Pitts-Singer and Cane2011), and it is slightly surprising we did not collect these genera in greater abundances from the hay sites. Besides alfalfa, we identified only one species growing from the sown hay mix: red clover, Trifolium pratense Linnaeus (Fabaceae) (0.047% ± 0% observed, 1% of seed mix). Other plants that we observed were volunteer species that did not originate from the seed mix (n = 6 species), all of which had low abundances (> 0.4% of ground cover). Given the low capture rates of bees at hay sites and the monocrop character of the hay fields (99% alfalfa), we suggest that enhanced hay fields for pollinator conservation include less alfalfa in the seed mix and a greater seeding rate of other species. Reducing the seeding rate of alfalfa may allow other species in the seed mix to establish, creating a more diverse enhancement. A majority of the seed mix were Fabaceae species: if conservation is a priority, low-growing Asteraceae species should also be included in the mix. Many of the oligolectic bee species that we identified were Asteraceae specialists: including flowers from this group may better support these bees.
Farmers were instructed to leave small sections of the crop to provide pollinators with forage during the entire growing season, a practice that Buri et al. (Reference Buri, Humbert and Arlettaz2014) found to be effective at increasing pollinator capture rates over time. In practice, in the present study, however, farmers harvested the entire fields. If pollinator conservation is a priority, then small strips of seeded mix should be left for pollinators, ideally on the edges of fields where pollinators may find overwintering habitat or may spill more easily over between the fields and adjacent landcover types.
Past research has found that cattle grazing effects on bee diversity and capture rates vary, but generally bee populations are inversely related to grazing intensity (Harmon-Threatt and Chin Reference Harmon-Threatt and Chin2016). Kimoto et al. (Reference Kimoto, Debano, Thorp, Taylor, Schmalz and Delcurto2012) found that the response depends on the group of bees studied, with smaller bees, such as sweat bees, being unaffected by grazing, but with capture rates of larger bees and bumble bees being negatively correlated with grazing intensity. Across most of the variables tested in the present study, natural and grazed sites tended to be similar to each other, whereas hay sites differed, suggesting that grazing an area may support a more natural community of bees than haying the same field would. Even though capture rates of bees at grazed and natural sites were statistically similar, oligolectic species were more numerous in grazed sites, and polylectic bees were more abundant in natural sites. Bombus spp. were most common at natural sites and may be driving the slight polylectic bias in our study’s natural sites. Andrenidae, mainly Perdita bruneri Cockerell (n = 85) and P. swenki Crawford (n = 33), were the most common oligolectic species and were commonly collected on gumweed, Grindelia (Asteraceae), found at the grazed sites. In fact, with the exception of Andrena campanulae, A. lupinorum, and Colletes andrewsi, every oligolectic bee species we collected specialises on Asteraceae. Some species that we collected, such as A. campanulae, are rare (the J.B. Wallis/R.E. Roughley Museum of Entomology contains only eight specimens): collecting even one specimen of these species suggests that the grazed sites either support a specialised habitat not found in many other locations or support a habitat not well sampled in Manitoba.
Stem-nesting species, mostly Megachildae, Hylaeus, and Ceratina, were more common at natural sites, presumably because of the increased availability of woody vegetation (trees). Hay sites contained no woody vegetation, and grazed sites contained some small shrubs (mainly Symphoricarpos (Caprifoliacaea)) that cattle avoid. The diversity of woody vegetation was much higher at natural sites, with these sites containing more trees and larger shrub species. Possible increases in nesting substrate at natural sites may drive these trends because most of the vegetation variables tested were similar between natural and grazed sites. Hay sites were characterised by low overall capture rates of bees. The bees collected at hay sites were mainly hive-nesting and polylectic species, such as Bombus (and Apis mellifera, not shown). A species accumulation curve shows that hay sites accumulate species much more slowly than grazed or natural fields do; the hay sites in our study may not be as capable of supporting a diverse community of bees as the other treatments are.
Although the diversity of blooming forbs was similar among treatments, the community structure differed among sites. Grazed sites supported more blooming Asteraceae species, and hay sites were dominated by Fabaceae – almost exclusively alfalfa. It therefore makes sense that Asteraceae specialists would be more abundant within grazed sites, given the abundance of their host. Individual responses varied, but we found more bees in grazed sites than in the hay treatment, indicating that grazed sites may support a greater density of bees than monoculture hay fields do. Both grazed and hay fields are subject to vegetation removal: the cutting of hay fields creates a mass removal of floral resources in a short period of time, whereas grazing is a slower, more gradual removal of resources. Grazing also may selectively remove vegetation, leaving behind unpalatable species (Mayer Reference Mayer2004; Milton and Dean Reference Milton and Dean1990) that may benefit pollinators (for example, Cirsium (Asteraceae)). Although we found bee capture rates at grazed sites to be higher than at hay sites, natural sites had the greatest capture rates. The undisturbed habitat found in the natural sites may support larger populations of bees than managed sites do in our study. Nonetheless, in areas of intensive agriculture where converting land to conservation areas may not be possible, using grazing practices instead of haying fields may support higher abundances of pollinators.
Bee capture rates were not associated with any weather and vegetation variables that we tested with generalised linear mixed-effect models, but the rates did respond to these variables from the ordination plot. Blooming forb richness, grass cover, and wind speed aggregated bee communities into three different directions. These variables may influence bee populations, but the effects are likely weak or the statistical power low, because they were not significant in the generalised linear mixed-effect models. Bees were positively associated with natural landcover at 3 km (the best-fitting spatial scale), a finding that aligns with Kennedy et al.’s (Reference Kennedy, Lonsdorf, Neel, Williams, Ricketts and Winfree2013) results. Bees can spill over between agricultural and natural landcover types (Montero-Castaño et al. Reference Montero-Castaño, Ortiz-Sánchez and Vilà2016), and bees may be using the natural landcover in the present study to supplement foraging. The positive association with natural landcover, combined with the natural treatment having the highest bee capture rates in our study, supports the protection of natural lands for bee conservation. If bee conservation is a priority, landowners should not convert natural lands into agricultural production.
We found a positive association between field size and bee capture rates among the three treatments, with larger fields generally containing a higher density of bees. This finding was present regardless of treatment. It should be noted, however, that hay sites showed a slight negative relationship between bee capture rates and field size, but the hay fields in the present study were all smaller than the grazing and natural fields, and it is unclear if the relationship will hold true for larger hay fields. Larger fields may simply have more areas for cattle to graze, reducing overall grazing intensity at the field level.
Conclusion
Livestock grazing provides an opportunity to cultivate a managed grassland that supports both livestock and insects. We found that grazing practices increased the abundance of blooming Asteraceae and their associated pollinator specialists. Although bee capture rates were statistically similar between grazed and natural sites, oligolectic bees were more abundant within grazed fields and polylectic bees (mainly Bombus) were most abundant within natural sites. Grazing practices may support larger populations of pollinators than hayed monoculture fields do, but natural lands support larger populations of bees overall. Bee capture rates also were positively associated with natural land cover. Based on this, land should be set aside in areas with high agricultural intensity in order to preserve the ecosystem services offered by beneficial insects. If land cannot be set aside for conservation, then grazing lands, instead of haying, would better support pollinators.
Supplementary material
The supplementary material for this article can be found at https://doi.org/10.4039/tce.2026.10047.
Acknowledgements
The authors thank Michael Smith and Sydney Shukla-Bergen for their help with fieldwork and sample processing. They also thank the numerous growers who provided access to their land: without them this project would not have been possible. The authors also acknowledge Stephanie Frischie (Xerces Society) and Dean Brooker (Souris River Watershed District) for their help during this project. Funding was provided by the Western Grains Research Foundation, Organic Science Cluster 3, activity 28, and the Natural Sciences and Engineering Research Council of Canada. Lead author Michael Killewald is also grateful to the Western Grains Research Foundation, the Prairie Improvement Network, and Mary Dueck for selecting him to receive their graduate scholarships: these have greatly enhanced his ability to conduct research and have directly contributed to the completion of this manuscript.




 Open access

