

Introduction
Many abiotic and biotic factors that may affect population growth tend to be more similar in nearby populations. Spatial synchrony (spatial autocorrelation of variation across time) has been documented in the demographics of many taxa including arthropods (Hanski and Woiwod Reference Hanski and Woiwod1993, Sutcliffe et al. Reference Sutcliffe, Thomas and Moss1996), fish (Ranta et al. Reference Ranta, Kaitala, Lindström and Linden1995), birds (Ranta et al. Reference Ranta, Kaitala, Lindström and Linden1995, Koenig Reference Koenig2002), rodents (Ims and Steen Reference Ims and Steen1990, Bjørnstad et al. Reference Bjørnstad, Stenseth and Saitoh1999a) and large mammals (Post and Forchhammer Reference Post and Forchhammer2002, Grenfell et al. Reference Grenfell, Wilson, Finkenstädt, Coulson, Murray, Albon, Pemberton, Clutton-Brock and Crawley1998). A seminal paper by Moran (Reference Moran1953) suggested that spatial synchrony in population growth is influenced by spatial synchrony in environmental factors, such as weather, and that this relationship weakens with distance between populations. Koenig (Reference Koenig2002) argued that the “Moran effect” is the most influential mechanism affecting spatial population dynamics if the spatial synchrony of the environmental factor operates over a large geographic area and behaves like that of the synchronous populations (i.e. spatial synchrony declines with distance at a similar rate). Two recent papers offer support for this notion. Isolated populations of caribou Rangifer tarandus and musk ox Ovibos moschatus on opposite coasts of Greenland exhibited synchronous population growth that correlated with the North Atlantic Oscillation Index and winter temperature (Post and Forchhammer Reference Post and Forchhammer2002); spatial synchrony of Soay sheep Ovis aries populations inhabiting the St. Kilda archipelago, separated by 3.5 km of Atlantic waters, are demonstrated to be strongly influenced by the environmental synchrony of local climate (Grenfell et al. Reference Grenfell, Wilson, Finkenstädt, Coulson, Murray, Albon, Pemberton, Clutton-Brock and Crawley1998, Koenig Reference Koenig2002). However, when spatial synchrony declines over smaller distances, other mechanisms are thought to drive patterns of spatial synchrony such as dispersal (Ranta et al. Reference Ranta, Kaitala, Lindström and Linden1995, Hanski and Woiwod Reference Hanski and Woiwod1993) or trophic interactions with predators (Ims and Steen Reference Ims and Steen1990) or resources (Bjørnstad et al. Reference Bjørnstad, Stenseth and Saitoh1999a).
Each mechanism of spatial population dynamics has implications for metapopulation persistence. When spatial synchrony in population dynamics is driven by the Moran effect, correlated periods of high extinction risk among populations lead to an increased metapopulation extinction risk (Palmqvist and Lundberg Reference Palmqvist and Lundberg1998). When population synchrony is driven by dispersal, the extinction risk of nearby populations is also inflated since there is less chance of a “rescue effect” in bad years (Brown and Kodric-Brown Reference Brown and Kodric-Brown1977). Furthermore, simultaneous extinction events in neighbouring populations may subsequently reduce the rate of effective colonisation (Heino et al. Reference Heino, Kaitala, Ranta and Lindström1997). However, dispersal-driven population synchrony usually acts on a smaller spatial scale than the Moran effect (Ranta et al. Reference Ranta, Kaitala, Lindström and Linden1995), and would therefore be predicted to have a smaller impact on the metapopulation as a whole. Lastly, similar management actions applied to nearby populations to regulate the trophic interactions of predators or prey (e.g. Courchamp et al. Reference Courchamp, Woodroffe and Roemer2003) may serve to enhance spatial correlations in population dynamics and ultimately expose these populations to the same extinction risks as those described above.
Spatial correlations in population dynamics can be desynchronised by mechanisms that correspond to the Moran effect, dispersal, or management. For example, landscape heterogeneity among habitat patches may result in the same climatic event having different impacts on population dynamics (Ringsby et al. 2002). Likewise, density dependent dispersal may influence spatial synchrony if population densities vary (Ranta et al. Reference Ranta, Kaitala, Lindström and Linden1995) and small scale differences in land ownership often lead to differing management actions applied to nearby populations creating spatial variation in important population drivers. A good example of this is in the Channel Islands of California, where the removal of introduced prey of Golden Eagles Aquila chrysaetos on Santa Cruz Island, but not nearby Santa Rosa Island, resulted in slower recovery rates of island foxes Urocyon littoralis on the latter due to higher eagle predation (Schwemm et al. Reference Schwemm, Coonan and Garcelon2010).
The variety of these synchronising and desynchronising mechanisms acting at multiple spatial scales means that for wide-ranging species, patterns of spatially correlated population dynamics, and the underlying mechanisms driving those patterns, may vary across their range. However, previous studies have been limited to determining the presence and mechanisms driving spatial autocorrelations (Hanski and Woiwod Reference Hanski and Woiwod1993, Sutcliffe et al. Reference Sutcliffe, Thomas and Moss1996, Bjørnstad et al. Reference Bjørnstad, Stenseth and Saitoh1999a) without considering how such drivers might vary in their importance and effect across a species’ range. Such oversight can lead to mismanagement of a threatened species when studies identifying patterns and drivers of population synchrony in part of a species’ range are used to guide management in other regions. In this paper, we take advantage of range-wide monitoring and management of the threatened Western Snowy Plover Charadrius nivosus nivosus to demonstrate how the impact of synchronising mechanisms on plover populations varies over large spatial scales.
The range of the Western Snowy Plover (hereafter “plover”) in the United States spans roughly 2,000 km along the Pacific coast of North America. Pacific coast breeding populations are not genetically distinct from inland populations of the Snowy Plover inhabiting continental North America (Funk et al. Reference Funk, Mullins and Haig2007), however since 1993 the coastal segment of the species has been listed as threatened under the U.S. Endangered Species Act owing to significant declines in population size and breeding site occupancy across the Pacific coast range (USFWS 2007). Plover breeding grounds are patchily distributed along the coast and support populations that vary greatly in number, connected by juvenile and adult dispersal (Figure 1). This metapopulation structure, suggests that the long-term persistence of the threatened plover could be influenced by mechanisms that drive spatial synchrony. Every breeding site within the plover’s extensive range has been surveyed annually since 2005 (USFWS 2007), making it an ideal study system with which to examine regional variation in potential synchronising mechanisms such as climate, dispersal, and management. Potential mechanisms synchronising the dynamics of plover populations include: 1) a Moran effect in the form of reduced survival leading to population declines after prolonged periods of cold winter weather (Eberhart-Phillips and Colwell Reference Eberhart-Phillips and Colwell2014); 2) distance-limited dispersal of juveniles and adults among breeding sites (Stenzel et al. Reference Stenzel, Warriner, Warriner, Wilson, Bidstrup and Page1994, Pearson and Colwell Reference Pearson and Colwell2014); and 3) temporally and spatially variable management aimed at reducing predator impacts on productivity.
Distribution map of the Pacific Coast Western Snowy Plover metapopulation, and the delineation of the three latitudinal regions used in this study.
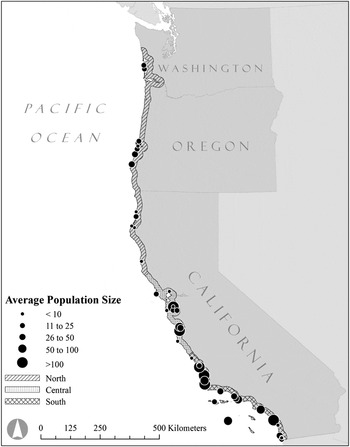
Our objectives were to determine if signals of spatial synchrony in the plover metapopulation are consistent with a Moran effect, dispersal-driven synchrony, and/or correlated predator management. In addition to this, we investigated how patterns of plover population growth dynamics and roles of different drivers of spatial synchrony vary among the northern, central, and southern management regions of the U.S. range. To accomplish these goals, we first evaluated the roles of climate and management in annual population growth over the entire U.S. range of the plover and then separately within each of the three management regions (Figure 1).
Materials and methods
Study system
Breeding Biology: The threatened plover metapopulation of the U.S. occupies habitats within 80 km of the Pacific Ocean coastline from Damon Point, Washington (46°56'29“N, 124° 6'43”W) to the Tijuana Estuary, California (32°32'4“N, 117° 7'25”W; Figure 1). The plover’s range on the Pacific coast extends into Baja California, Mexico; however we limited our analyses to the U.S. due to inadequate data available from breeding populations in Mexico. Breeding habitats are characterised by sandy ocean-fronting beaches, dredge spoil islands, salt pans, and riverine gravel bars. The plover breeds for six months from March, when the first eggs are laid, until September, when the last chicks fledge (Page et al. Reference Page, Stenzel, Warriner, Warriner, Paton and Poole2009). The plover mating system has been described as serial polygamy, because both sexes acquire new mates for the second or third successful breeding attempt over the long breeding season (Warriner et al. Reference Warriner, Warriner, Page and Stenzel1986). Female plovers lay a clutch of three eggs that are incubated for ∼28 days (Warriner et al. Reference Warriner, Warriner, Page and Stenzel1986). Upon hatching, females usually leave males to search for another mate, while males provide parental care of the brood; as a result, males father a maximum of six young in two broods each season (Warriner et al. Reference Warriner, Warriner, Page and Stenzel1986). Northerly populations are partially migratory, with some individuals residing year-round at their breeding site whereas others migrate (Stenzel et al. Reference Stenzel, Warriner, Warriner, Wilson, Bidstrup and Page1994, Colwell et al. Reference Colwell, McAllister, Millet, Transou, Mullin, Nelson, Wilson and LeValley2007). Most juveniles settle within 50 km of their natal site (Stenzel et al. Reference Stenzel, Page, Warriner, Warriner, George, Eyster, Ramer and Neuman2007, Colwell et al. Reference Colwell, McAllister, Millet, Transou, Mullin, Nelson, Wilson and LeValley2007). Adult dispersal is common, with over 50% of adults moving among sites within or between successive breeding seasons (Stenzel et al. Reference Stenzel, Warriner, Warriner, Wilson, Bidstrup and Page1994). The majority of these movements occur at distances less than 200 km (Stenzel et al. Reference Stenzel, Warriner, Warriner, Wilson, Bidstrup and Page1994, Pearson and Colwell Reference Pearson and Colwell2014).
Annual censuses: Since 2005, observers have annually surveyed plovers across all suitable habitat within the U.S. in a coordinated effort to estimate population size. Each year, the range-wide survey occurred over one week (late May–early June) coincident with the peak nesting period (USFWS 2007). Observers surveyed each site once and reported the total number of adults. We analysed population change based on the number of adult plovers tallied during surveys (USFWS unpubl. data; http://www.fws.gov/arcata/es/birds/wsp/plover.html). We collated census data from 2005 to 2012 and divided the Pacific coast into 45 breeding locations that were: 1) geographically distinct (isolated by unsuitable breeding habitat such as rocky headlands or major rivers), and 2) occupied by an average of at least four individuals between 2005 and 2012, or at least seven individuals in any given year (Figure 1). For each of the 45 populations, we calculated the annual rate of change (R) as the difference in log-abundances of consecutive annual survey totals:
 $${R_{t,j}} = \ln \left( {{N_{t + 1,j}} + 1} \right) - {\rm{ln}}({N_{t,j}} + 1)$$
where N t,j is the census count in year t for population j.
Climate: Prolonged periods of cold winter weather have been associated with reduced plover survival and population growth (Eberhart-Phillips and Colwell Reference Eberhart-Phillips and Colwell2014). Although we do not currently know how winter cold reduces survival, likely mechanisms include: 1) an increase in thermoregulatory stress on wintering plovers (Evans Reference Evans1976), and 2) a reduction in invertebrate prey availability (Pienkowski Reference Pienkowski1983). Because these effects, especially prey reduction, increase with the length of protracted cold periods, we created a discrete, event-based index of winter cold (c) based on: 1) the degree to which the daily minimum temperature fell below a predefined threshold (2.6°C), and 2) the number of consecutive days with a minimum temperature below the threshold:
 $$c = (2.6 - {k_1}) + \left[ {2\left( {2.6} \right) - {k_1} - {k_2}} \right] + \ldots [h\left( {2.6} \right) - {k_1} - {k_2} - \ldots {k_h}]$$
where k is the minimum temperature in degrees Celsius on the h th consecutive day of the winter cold event. We used a threshold of 2.6°C because this is the lower 95% confidence interval of the median lethal temperature (LT50) for adult amphipods (superfamily Talitroidae; Tsoi et al. Reference Tsoi, Chiu and Chu2005), which are important prey throughout the Pacific Coast (Hubbard and Dugan Reference Hubbard and Dugan2003, Page et al. Reference Page, Stenzel, Warriner, Warriner, Paton and Poole2009).
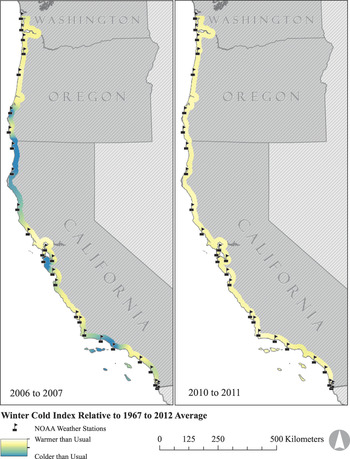
To quantify spatial variation in winter (December to February) cold, we collated 45 years (1967 to 2012) of daily minimum temperature data from 27 weather stations managed by the National Oceanic and Atmospheric Administration (NOAA). These stations encompassed the U.S. range of the plover (Figure 2; National Climatic Data Center, http://www.ncdc.noaa.gov). All weather stations were within 3 km of surveyed plover breeding habitat (median = 1,070 m) and less than 50 m in elevation (median = 7 m). For each weather station we calculated the total winter cold index (C) in a given year as:
 $$C_{t,j} = \sum {c_n } \,$$
Map illustrating latitudinal variation in winter cold indices across the range of the Pacific Coast Snowy Plover metapopulation. The coldest and warmest winters observed during the study period are shown.
where n is the number of winter cold events at weather station j in the winter of year t. To account for locally anomalous winter cold, we standardized C t,j using historical weather data:
 $$Z\left( {{C_{t,j}}} \right) = {{{C_{t,j}} - {\mu _j}} \over {{\sigma _j}}}$$
where μ is the average total winter cold index for weather station j between 1967 and 2012, and σ is the standard deviation in the totalled winter cold index for weather station j between 1967 and 2012.
For each year, we interpolated the standardised winter cold indices of all weather stations across the range of the Pacific Coast metapopulation using the ‘spline with barriers’ tool in ArcGIS (ESRI, Redlands, CA, USA). This operation created a surface raster encompassing the U.S. range of the plover, which illustrated latitudinal variation in winter cold. We interpolated winter cold values for the centre of each plover population using the Extract Multi Values to Points tool in ArcGIS. This procedure produced a standardized total winter cold index for each population for each year between 2005 and 2011.
Predator management: Predator management has been implemented at most plover breeding sites in the form of predator removal and predator exclosures at nests (USFWS 2007). Predator exclosures are cage-like structures that protect eggs from predators, while allowing incubating adult plovers to access eggs. Although exclosures have been shown to increase hatching success, they also compromise the survival of incubating adults (Neuman et al. Reference Neuman, Page, Stenzel, Warriner and Warriner2004, Isaksson et al. Reference Isaksson, Wallander and Larsson2007, Hardy and Colwell Reference Hardy and Colwell2008).
To obtain predator management information specific to each population, we created an online survey (SurveyMonkey, Palo Alto, CA, USA) that we submitted to individuals responsible for plover management in each population. The survey included two questions regarding predator management specific to each year (2005 to 2012) and each population:
-
1. Was lethal or non-lethal (i.e. translocation) removal used to manage predators to benefit snowy plover reproductive success?
-
2. Were predator exclosures used to increase plover hatching success?
To quantify variation in the use of predator management among sites, we did pair-wise comparisons of all sites and calculated the proportion of years for which a given pair had the same annual transistion in predator removal (P) or exclosure (X) regime. This created a management similarity index for every pair of plover sites.
Statistical analyses
To assess regional variation in patterns of metapopulation dynamics, we first analysed the entire metapopulation and then conducted analyses by region (north, central, and south; see Figure 1). We delineated three regions based, in part, on the management units outlined in the species’ recovery plan (USFWS 2007) and a priori reasoning that winter temperature would vary with latitude.
We evaluated the factors driving metapopulation dynamics of snowy plovers on the Pacific coast by investigating: 1) how predator management and winter cold are associated with annual changes in population growth, and 2) the spatial scale and synchrony of these associations. If predator management or winter cold (i.e. Moran effect) was driving spatial synchrony, then we expected these factors would correspond to annual change in population growth and would be spatially autocorrelated with population growth up to similar distances (Moran Reference Moran1953, Ranta et al. Reference Ranta, Kaitala, Lindström and Linden1995, Koenig Reference Koenig2002). To evaluate the role of dispersal driving spatial synchrony of populations, we investigated similarities between published estimates of dispersal distance and the spatial extent of population synchrony.
Annual population growth: We assessed the influence of predator management and winter cold on annual variation in population growth rates using general linear models. The global model had the following structure:
 $$E\left( {{R_{t,j}}} \right) = {\tau _0} + {\tau _1}\left[ {Z\left( {{C_{t,j}}} \right)} \right] + {\tau _2}\left( {{p_{t,j}}} \right) + {\tau _3}\left( {{x_{t,j}}} \right) + {\varepsilon _{t,j}}$$
where E(R t,j ) is the expected value of the growth rate given the parameters for population j in year t, p 1 is the dummy variable representing use of predator removal at population j in year t, x 1 is the dummy variable representing use of predator exclosures, and ε is the unexplained error in the estimated regression. We ranked competing additive subsets of the global model with delta AICc (Burnham and Anderson Reference Burnham and Anderson2002). To further evaluate model fit, we calculated the Pearson product-moment correlation coefficients of each top model generated by AICc model ranking.
Predator Management: We used non-linear models to examine relationships between predator management and spatial synchrony of population growth. Our models used the cross-correlation of population growth rates as a response variable and the distance between populations and index of similarity in predator management as predictors. We calculated cross-correlation coefficients following Bjørnstad et al. (Reference Bjørnstad, Ims and Lambin1999b) as:
 $${\rho _{i,j}} = {{{1 \over 7}\mathop \sum \nolimits_{t = 1}^7 ({R_{t,j}} - {{\bar R}_j})({R_{t,i}} - {{\bar R}_i})} \over {\sqrt {{1 \over 7}\mathop \sum \nolimits_{t = 1}^7 {{({R_{t,j}} - {{\bar R}_j})}^2}} \times \sqrt {{1 \over 7}\mathop \sum \nolimits_{t = 1}^7 {{({R_{t,i}} - {{\bar R}_i})}^2}} }}$$
where ρ is the coefficient of cross-correlation in the growth rates of population i and j over the seven intervals (t) between 2005 and 2012, and $\bar R$
is the average annual growth rate of population i or j during the same interval.
$\bar R$
is the average annual growth rate of population i or j during the same interval.
We hypothesised that populations with similar histories of predator management would be more synchronous. We also hypothesised that a negative power function would describe the decay in spatial synchrony because there is no evidence to suggest that populations should be negatively correlated beyond a certain distance. The global model had the following structure:
 $$E\left( {{\rho _{i,j}}} \right) = {\beta _0}\left( {{D^{ - {\beta _1}}}} \right) + {\beta _2}\left( {{P_{i,j}}} \right) + {\beta _3}\left( {{X_{i,j}}} \right) + {\varepsilon _{t,j}}$$
where D is the euclidean distance in kilometers between populations i and j, P is the similiarity index in predator removal management between populations i and j over the 2005 to 2012 period, likewise X is the similiarity index in predator exclosure management. We used delta AICc to rank competing additive subsets of the global model (Burnham and Anderson Reference Burnham and Anderson2002), while retaining the non-linear parameter. To evaluate the significance of beta coefficients while acknowledging pseudoreplication, we calculated a bootstrap confidence interval by sampling with replacement among populations. We conducted 1,000 iterations and constructed confidence intervals based on percentiles. We used these bootstrapped confidence intervals to detect the presence of uninformative parameters in competitive models (Arnold Reference Arnold2010).
Dispersal and the Moran effect: We used spline correlograms (formulae in Bjørnstad et al. Reference Bjørnstad, Ims and Lambin1999b; ‘ncf’ package in R) to estimate the decay in synchrony over distance for population growth rates and winter cold indices. To assess statistical differences in spatial synchrony from zero, we used a bootstrap algorithim developed by Bjørnstad and Falck (Reference Bjørnstad and Falck2001) to estimate 90% confidence intervals for the spline correlograms of winter cold and population growth. We compared the spline correlograms of population growth and winter cold to evaluate if synchrony was driven by a Moran effect. We estimated the spatial extent of synchrony in winter cold indices and population growth using the distance at which the lower confidence interval of the correlogram intersected zero. We then compared the distance of autocorrelated population growth to autocorrelated winter cold indices and to published estimates of breeding dispersal distances of adult plovers (Stenzel et al. Reference Stenzel, Warriner, Warriner, Wilson, Bidstrup and Page1994, Pearson and Colwell Reference Pearson and Colwell2014). If dispersal was an influential mechanism, we expected that the decay in population spatial synchrony would occur over a shorter distance than that of winter cold and would correspond to the plover’s dispersal distance (Ranta et al. Reference Ranta, Kaitala, Lindström and Linden1995). We conducted all analyses using R version 2.12.0 statistical software (R Development Core Team 2013).
Results
Spatial structure of the metapopulation
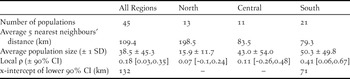
Average size of the 45 populations ranged from 1.8 to 184.3 adults (mean = 38.5, median = 20.8). On average, the southern region held 61% of individuals in the metapopulation; the central and northern regions held 27% and 12%, respectively (Figure 3). Populations in the northern region were more distant from one another (average distance to the nearest five neighbouring populations = 199 km), whereas those in the southern region were closest (average distance to the nearest five neighbouring populations = 79.3 km; Table 1).
Annual variation in breeding window survey counts between 2005 and 2012 across the entire Pacific Coast Snowy Plover metapopulation and the northern, central, and southern regions (see Figure 1 for geographical delineations of regions).

Regional variation in metapopulation structure of Snowy Plovers on the Pacific coast of the US. Local ρ is the average spatial synchrony at zero distance based on the bootstrapped spline correlograms, and the x-intercept represents an estimate of the spatial scale at which synchrony occurs (Note: the spline correlogram confidence intervals of the north and central regions overlapped zero and thus did not have an x-intercept; see Figure 4).
Metapopulation trends: The total estimated number of plovers among the 45 sites varied from 1,535 (2006) to 1,904 (2011), with an average of 1,734 (Figure 3). Between 2006 and 2007, numbers declined by 19%, most of which occurred in the southern region. Between 2007 and 2008, the northern and central regions declined by a combined 18% while the southern region increased by 22% (Figure 3). The average coefficient of variation in population size over the 8-year period was 0.54 and was 0.08 for the entire metapopulation.
Cold winter weather: Between 2005 and 2012, the winter of 2010 was the warmest across the species’ range, whereas the winter of 2006 was the coldest (Figure 2). Across the metapopulation, there was strong evidence supporting spatial synchrony in winter cold indices of weather stations up to 830 km apart (Figure 4a).
Spline correlograms illustrating decay in spatial synchrony of population growth rates (black) and winter cold indices (grey) across the Pacific Coast Snowy Plover metapopulation. The dashed lines represent the bootstrapped 90% confidence interval of the spatial autocorrelation function. There was no evidence supporting a Moran Effect driven by winter cold because the two correlograms do not have a similar spatial autocorrelation function and furthermore, did not have overlapping 90% confidence intervals.

Predator management survey: The management survey had a high response rate (96% of 45 surveys). Managing predators by removal (lethal and non-lethal) was more widespread and consistent across the metapopulation than using exclosures (Figure 5). Predator management in the northern region varied by state, with the two populations in Washington having no management, populations in Oregon having practically consistent management, and northern California having very little (Figure 5). In the central region, predator removal was consistent throughout, but use of exclosures varied. In the southern region, predator management was absent from the Channel Islands. In the north and south parts of the southern region, predator removal was consistent, however the use of exclosures varied (Figure 5).
Distribution map of predator management used between 2005 and 2012 across the Pacific Coast Snowy Plover metapopulation. Black regions of the pie graphs indicate the proportion of years that predator exclosures (left) and predator removal (right) were used to increase plover productivity at each population.

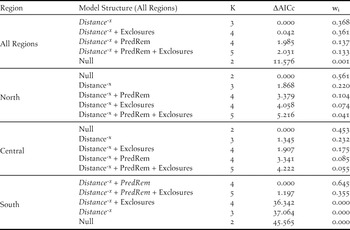
Annual population growth: Both prolonged periods of cold winter weather and predator management were important predictors of annual variation in population growth; however, this trend varied regionally. The top model of the range-wide analysis revealed that winter cold had a negative effect on growth (τ 1 = -0.102, 95% CI [-0.192, -0.012]; Table 2), while the effect of predator management depended on management type. Predator exclosures were negatively correlated with population growth (τ 3 = -0.170, 95% CI [-0.324, -0.008]), whereas predator removal was weakly positively associated (τ 2 = 0.116, 95% CI [-0.043, 0.275]; Table 2). In the north, the top model demonstrated that the primary driver of growth was winter cold (τ 1 = -0.232, 95% CI [-0.414, -0.050]; Table 2). In the southern region, predator management was the primary driver with the top model suggesting a positive effect of removal (τ 2 = 0.183, 95% CI [0.009, 0.358]) and a negative association with exclosures (τ 3 = -0.210, 95% CI [-0.378, -0.041]; Table 2). None of the variables we examined were associated with variation in plover population growth in the central region (Table 2).
Model selection results examining the influence of prolonged cold winter weather (Winter Cold) and two predator management methods, predator exclosures (Exclosures) and predator removal (PredRem) on population growth across the Pacific Coast Snowy Plover metapopulation. The table has models ranked within each region by ΔAICc values corrected for small sample size, and also includes the model weight (wi), and number of parameters (K). The top five models of each regional analysis are listed below. Parameters in italics have coefficients significant at α = 0.05.

1 Pearson product-moment correlation coefficient of the top model was 0.18
2 Pearson product-moment correlation coefficient of the top model was 0.25
3 Pearson product-moment correlation coefficient of the top model was 0.22
Spatial synchrony: At the coast-wide scale, populations in close proximity had more synchronous growth, as indicated by a negative power function of distance (β 1= -0.04, 95% CI [-0.061, -0.02]; Table 3). Models that included similarity in predator management using exclosures or predator removal were also competitive (ΔAICc = 0.042 and 1.985, respectively; Table 3), but these additional beta coefficients were not significant (β 3 = 0.045, 95% CI [-0.02, 0.111], β 2 = 0.045, 95% [CI -0.039, 0.071]; Table 3). At the regional scale, the null models of the northern and central regions out-competed all other models, suggesting that populations within these regions fluctuated independently regardless of proximity or similar predator management (Table 3). In contrast, population synchrony in the southern region was best predicted by distance (β 1= -0.055, 95% CI, [-0.098, -0.012]) and similarity in predator removal (β 3 = 0.357, 95% CI [0.250, 0.464]; Table 2). Across regions, spline correlograms showed positively correlated growth rates for populations within 132 km of each other (Figure 4a, Table 1). Spline correlograms within regions showed that significant spatial synchrony in growth rates occurred only in the southern region (Figure 4b-d, Table 1).
Model selection results examining the relationship between distance and similarity in two predator management methods, predator exclosures (Exclosures) and predator removal (PredRem), on the pairwise synchrony in growth of populations across the Pacific Coast Snowy Plover metapopulation. The table has models ranked within each region by ΔAICc values corrected for small sample size, and also includes the model weight (wi), and number of parameters (K). Parameters in italics have bootstrapped coefficients significant at α = 0.05.
Discussion
Our study suggested that multiple mechanisms can act simultaneously to synchronise and desynchronise metapopulation dynamics, and that the effect of these agents can vary across a species’ range. We observed synchronous population growth in the Pacific coast western snowy plover metapopulation between populations up to 132 km apart; approximating published estimates of plover dispersal distances. We also found that both prolonged winter cold events and predator exclosures were associated with reduced population growth rates, and that predator removal was weakly associated with positive population growth. We found no evidence that spatially autocorrelated winter climatic patterns synchronised population dynamics, however there was weak evidence of synchronised predator management regimes driving spatial synchrony in plover population growth. Environmental drivers and patterns of population spatial synchrony varied across the latitudinal extent of our study. Winter cold events reduced growth in northern populations, whereas predator management positively affected growth in the southern region, and neither environmental nor predator management variables appeared to influence population dynamics in the central region. Population synchrony was only noted among nearby populations in the southern region, with similar predator management strategies serving to enhance synchronisation.
Although we tested for a Moran effect with only one climatic variable (winter cold), the rapid decay of spatial synchrony in population growth was not matched by the slow rate of decay estimated in the spatial synchrony of other climatic variables such as precipitation and different measures of temperature, which typically have high levels of spatial synchrony over vast distances (Koenig Reference Koenig2002). Instead, the rapid decay in population synchrony is intriguing because it falls within 175 km, which is the median breeding dispersal distance of 39 adult plovers documented by Stenzel et al. (Reference Stenzel, Warriner, Warriner, Wilson, Bidstrup and Page1994). At the coast-wide scale, plover populations within 132 km exhibited significantly positive synchrony. In the southern region, synchrony was observed between populations 71 km apart. The difference in these distances likely arises from the difference in the spatial scale of these two study units. In the south, the average distance between neighbouring populations was almost 30 % less than that measured within the entire metapopulation, suggesting that individuals in the south do not have to disperse far to find alternative breeding locations (Stenzel et al. Reference Stenzel, Warriner, Warriner, Wilson, Bidstrup and Page1994, Pearson and Colwell Reference Pearson and Colwell2014).
Both the central and northern regions appear to be subject to desynchronising mechanisms. Populations of the northern region were relatively small and sparse, features which could interact to reduce synchronicity through density-dependent dispersal. Snowy plovers have been described as a semi-colonial species (Page et al. Reference Page, Stenzel, Warriner, Warriner, Paton and Poole2009, Patrick Reference Patrick2013), meaning that the species has a moderate degree of conspecific attraction. Because of this, dispersal rates could be negatively density dependent, such that small populations have higher dispersal rates than larger populations, a characteristic that is known to desynchronise population dynamics (Ims and Andreasson Reference Ims and Andreassen2005).
In addition to the potential desynchronising effect of negative density dependent dispersal, annual variation in the dynamics of small populations is dominated by demographic stochasticity, which by definition has no spatial scaling (Engen et al. Reference Engen, Lande, Sæther and Bregnballe2005). Therefore, any signal of spatial synchrony in the northern region could have been undetectable because of stochastic noise in population growth due to the random death, birth, or movement of a given individual. Central populations had a large variation in size and there was no detectable influence of either local climatic conditions or predator management, thus it is unclear which mechanisms serve to disrupt the synchronising effects of dispersal in this region.
Asynchrony in population dynamics has been documented in a variety of taxa, including arthropods (Sutcliffe et al. Reference Sutcliffe, Thomas and Moss1996) and birds (Ringsby et al. 2002). These trends are thought to be caused by complex interactions between climate and the local environment. For example, an insular metapopulation of House Sparrows Passer domesticus in northern Norway was exposed to homogeneous climatic conditions, yet population dynamics were asynchronous, presumably because of spatial variation in the onset of breeding (Ringsby et al. 2002). Ringsby et al. (2002) concluded that the hatch date of sparrows varied across the islands due to landscape heterogeneity in an unknown environmental factor. For plovers, the timing and length of the plover breeding season varies across the 2,000 km north-south distribution of the metapopulation (Stenzel et al. Reference Stenzel, Warriner, Warriner, Wilson, Bidstrup and Page1994, Colwell et al. Reference Colwell, Millet, Meyer, Hall, Hurley, McAllister, Transou and LeValley2005), and thus could act as a desynchronising agent. Our study took advantage of census counts conducted over a one week period at the presumed peak of nesting. However, due to annual and geographical variation in the environmental conditions required for breeding, the actual peak of nesting is likely to be different in a given year for each population across the entire metapopulation. Therefore, our ability to detect strong signals of spatial synchrony could be weakened by mismatches in the chronology of breeding seasons among populations across the plover metapopulation.
The influence of winter climate on annual population growth was especially apparent in the northern region where anomalous prolonged periods of cold winter weather resulted in negative population growth. This finding demonstrates that the small and isolated populations at the northern limits of the species’ range are likely more vulnerable to stochastic catastrophic events in climate than populations in the core regions of the range further south (Brown and Lomolino Reference Brown and Lomolino1998).
In the southern region, management regimes controlling predation were the most important factors influencing temporal population dynamics, with lethal and non-lethal predator removal having a positive effect on growth, and predator exclosures reducing population growth. This finding may arise from the different effects these two management practices have on plover vital rates. Predator removal leads to an increase in both nest, chick, and adult survival, whereas predator exclosures only increase hatching success and are known to compromise the survival of incubating adults (Neuman et al. Reference Neuman, Page, Stenzel, Warriner and Warriner2004, Hardy and Colwell Reference Hardy and Colwell2008), which is the most sensitive vital rate affecting population growth of plovers (Eberhart-Phillips and Colwell Reference Eberhart-Phillips and Colwell2014), and birds in general (Saether and Bakke Reference Saether and Bakke2000). However, we should not ignore the possibility that exclosures might be most often used in response to extreme cases of predation pressure leading to a potentially spurious correlation between exclosure management and negative population growth. Nonetheless, our finding corroborates the views of others who caution against use of predator exclosures when managing breeding shorebird populations (Killdeer C. vociferus; Johnson and Oring Reference Johnson and Oring2002; Snowy Plover; Neuman et al. Reference Neuman, Page, Stenzel, Warriner and Warriner2004, Hardy and Colwell Reference Hardy and Colwell2008; Lapwing Vanellus vanellus and Redshank Tringa tetanus; Isaksson et al. Reference Isaksson, Wallander and Larsson2007).
It is important to acknowledge that the most competitive models in our study poorly described variation in the growth rate, with all top models having correlation coefficients less than 0.25. The high level of variation observed across all regions of the metapopulation could be due to the inherent stochastic nature of the species. The average coefficient of variation in population growth across all regions of the metapopulation was slightly less than that documented for European populations of the closely related Kentish Plover C. alexandrinus (0.57, Hälterlein and Südbeck Reference Hälterlein and Südbeck1996); and, when compared to 25 other well studied avian metapopulations, Snowy and Kentish Plovers have the highest observed coefficient of variation among populations (Lande et al. Reference Lande, Engen and Sæther2003). Furthermore, our study was an attempt to identify signals in metapopulation dynamics at the range-wide scale using data collected by hundreds of observers, which tends to reduce estimated levels of synchrony (Lande et al. Reference Lande, Engen and Sæther1999) and undoubtedly increases noise in the spatiotemporal data (Paradis et al. Reference Paradis, Baillie, Sutherland and Gregory1999). Nevertheless, it is encouraging that we were able to detect biologically relevant signals.
Our study demonstrated that signals of spatial synchrony at the range-wide scale can be deceiving when there is region-specific heterogeneity in climate, management, and spatial structure. When such heterogeneity occurs, signals of spatial synchrony and asynchrony can be region-specific, which has important implications for metapopulation persistence. To our knowledge, this study is the first of its kind to investigate the role of spatial synchrony in a wide-ranging threatened species. Management meant to enhance population growth in regions where populations fluctuate independently may inadvertently increase localised extinction risk in other regions by synchronising populations and thereby reducing the “rescue effect” (Brown and Kodric-Brown Reference Brown and Kodric-Brown1977). However, the immediate priority for managing threatened or endangered species is simply to promote positive population growth, with long-term persistence as an afterthought. As such, we recommend that conservation biologists and land managers of this and other threatened metapopulations acknowledge region-specific spatially dynamic processes when considering the maintenance of viable populations that have met recovery objectives. We stress that extensive threatened metapopulations would benefit from inter-agency coordination to implement management practices among neighbouring populations best suited for recovery and ultimately persistence.
Acknowledgements
We thank the countless Snowy Plover biologists across the Pacific coast who have contributed to the data used in our study. We especially thank Jim Watkins (USFWS Arcata Office) for his continued support of snowy plover research, and Lynne Stenzel for productive discussions about quantifying the winter cold index. Our project was funded by a research grant from the U.S. Fish and Wildlife Service.


