

1. Introduction
Many pension systems assume that individuals can plan for retirement if they are sufficiently informed (Stock and Wise, Reference Stock and Wise1990; Barr, Reference Barr2002). Yet empirical evidence shows that people often make limited use of available retirement information.Footnote 1 For instance, much of the literature on pension awareness finds that individuals often avoid or postpone collecting the information needed to plan their retirement income (Golman et al., Reference Golman, Hagmann and Loewenstein2017; Debets et al., Reference Debets, Prast, Rossi and van Soest2022). This avoidance has been linked to barriers to seeking retirement information, such as low financial self-efficacy and retirement anxiety (Eberhardt et al., Reference Eberhardt, Brüggen, Post and Hoet2021). To stimulate information search, governments and pension providers have introduced online pension portals, expecting that easier and more convenient access to retirement information will help individuals to become better informed. Many EU member states have recently invested in such portals to increase the transparency of pension entitlements (European Commission: Directorate-General for Employment, Social Affairs and Inclusion & Social Protection Committee (SPC), 2024). Germany, for instance, has only recently launched a national pension portal, while at the European level the European Tracking Service is being developed to give mobile workers access to information about pension rights accrued across countries.
Despite these efforts, little is known about the extent to which such portals are used. This article therefore asks: When and to what extent do individuals spend time on retirement information in online portals? To answer this question, we analyze behavioral data from a random sample of participants in the largest pension fund for government and education employees in the Netherlands. These data capture participants’ actual use of the online portal – whether they log in, which pages they view, and how long they stay online – allowing us to directly observe when and to what extent individuals spend time on retirement information. Unlike self-reports, our behavioral measures avoid problems such as recall bias and other forms of measurement error. Our analyses show that over the observation period (November 1, 2020–December 14, 2021), participants spent an average total of 14 minutes on the online portal. Individuals aged 55–66 spent between 9 and 39 minutes more than the reference group of 40-year-olds, while participants under the age of 55 did not differ statistically from this baseline. Beyond these descriptives, the analyses indicate that participants spend time on retirement information mainly when it becomes directly relevant to their retirement decisions. A Tobit regression discontinuity design (Tobit RDD) analysis demonstrates that individuals affected by a law change that slowed the increase in the state retirement age spent significantly more time on the portal than other participants. These results are robust to the inclusion of control variables such as gender, marital status, income, and accrued pension.
This article makes three contributions. Theoretically, it extends the framework of Stock and Wise (Reference Stock and Wise1990) to the context of online pension portals, showing that individuals face intertemporal trade-offs in the use of retirement information: they postpone spending time on it until retirement decisions become truly actionable. Empirically, we extend the work of Ciani et al. (Reference Ciani, Delavande, Etheridge and Francesconi2023) by examining individual-specific exposure to the 2019 Dutch policy change that slowed the increase in the state pension age, using granular behavioral data from an online pension portal. This allows us to provide a causal interpretation of how participant characteristics – such as age and the associated (un)certainty about retirement eligibility – shape the timing and intensity of time spent on retirement information. We show that those affected by the reform substantially increase the time spent on the portal compared to similar individuals who were not affected. Finally, policy-wise, our findings suggest that while online portals provide a useful baseline resource, individuals spend time on them primarily when retirement decisions become immediately relevant. Policymakers and pension funds should therefore be cautious about investing heavily in ever more sophisticated portals.Footnote 2 Targeted and timely communication may offer greater returns.
The remainder of this paper is organized as follows. Sections 2 and 3 discuss the theoretical underpinnings of the research question. Section 4 describes the institutional setting in the Netherlands. Section 5 presents the data and descriptive statistics. Section 6 reports the Tobit regression results, and Section 7 outlines the Tobit RDD design, analysis, and findings. Section 8 concludes.
2. Theory
To investigate our research question, we base (and adapt) our theoretical framework on the retirement model of Stock and Wise (Reference Stock and Wise1990). In simple terms, the authors conceptualize retirement as an intertemporal decision, where individuals weigh the trade-off between retiring now versus later. Their framework quantifies how changes in pension systems or incentives affect retirement timing. Stock and Wise (Reference Stock and Wise1990) apply this model to US pension plans that incentivize individuals to remain with the firm until retirement age, followed by strong incentives to retire soon after. The key implication is that retirement decisions are forward looking, and sensitive to future changes (such as shifts in pension benefits), where the option of waiting can induce individuals to delay retirement to capture potential future gains. In other words, this theory proposes that people do not retire as soon as working becomes less appealing, because they benchmarked the decision against potential future benefits.
Adapting Stock and Wise’s (Reference Stock and Wise1990) theoretical model of retirement to our setting, we argue that it is not the firm that decides how to incentivize the worker to make a specific choice, but rather that individuals themselves must decide whether to spend time on the pension portal now or postpone doing so. They continually update their understanding of retirement options to determine the optimal moment to invest effort in planning for retirement. This decision involves large, fixed costs (such as search time) and uncertainty about whether the effort is worthwhile. It is therefore a problem of optimal timing, where value lies in waiting for the most advantageous moment to act (Abel et al., Reference Abel, Dixit, Eberly and Pindyck1996). Because people are heterogenous in characteristics (e.g., demographics, income, accrued pension), the optimal timing of these decisions varies across individuals. Following this, the role of the pension fund should be to provide the right information at the right time, rather than assuming that providing information continuously will lead to information upon which people act.
As we detail in our causal identification strategy, this theoretical framework also generates testable predictions about changes in information. If new information becomes available that will change the optimal timing of retirement, people shall wait to invest time looking for substantive information about their retirement until the option becomes available to them.
3. The relevance of investigating information-seeking behavior in a retirement planning context
While theory suggests that individuals adjust their retirement planning in response to information, the empirical evidence on this link is far from conclusive. A common assumption is that providing retirement information will lead to (desired) changes in retirement behavior. A classic example is the provision of annual pension statements, either by mail or online, with the expectation that this will prompt pension holders to actively spend more time with their pension – for example, by seeking additional information, improving their knowledge, adjusting their savings, or reconsidering their retirement age. Yet, findings supporting this assumption are mixed.
Several studies find positive effects. Dolls et al. (Reference Dolls, Doerrenberg, Peichl and Stichnoth2018) exploit a reform in Germany in which annual letters were sent and show increased tax-deductible private retirement savings, without crowding out other savings. Goda et al. (Reference Goda, Manchester and Sojourner2014) find that, in the United States, providing income projections and pension information led to higher contributions. El Mekkaoui and Legendre (Reference El Mekkaoui and Legendre2023) report that, in France, pension statements encouraged additional savings, but only among wealthier individuals.
At the same time, other studies report no effect. Mastrobuoni (Reference Mastrobuoni2011) shows that the US Social Security Statement – a pension statement – did not alter retirement behavior, while in Sweden, the introduction of a pension statement failed to improve pension knowledge (Larsson et al., Reference Larsson, Paulsson and Sundén2011). Debets et al. (Reference Debets, Prast, Rossi and van Soest2022) find at most small improvements in knowledge from annual pension statements.
Beyond pension statements, information campaigns and incentive programs also show mixed outcomes. For example, a communication campaign in Sweden spurred more active portfolio choices, while at the same time this active decision resulted in lower pensions (Cronqvist and Thaler, Reference Cronqvist and Thaler2004). In contrast, interventions with financial incentives yield only small effects on saving behavior (Duflo et al., Reference Duflo, Gale, Liebman, Orszag and Saez2007) and peer effects may play a larger role than direct information provision (Duflo and Saez, Reference Duflo and Saez2003).
Despite these inconclusive results, governments and pension funds have increasingly invested in online portals to increase transparency and strengthen the link between information and retirement behavior. These portals typically provide individuals with personalized overviews of their accrued pension rights and projections of future benefits. Many also include interactive features that allow users to explore the consequences of different choices – such as when to retire – and provide general information about the pension plan. By lowering the costs of accessing and processing information, such portals are designed to increase individuals’ use of pension information. The empirical evidence on online portals is also mixed. Bucher-Koenen et al. (Reference Bucher-Koenen, Hackethal, Kasinger and Laudenbach2022) document that a German pension portal improved pension knowledge and savings. In Denmark, however, Bilde and Linde (Reference Bilde and Linde2014) find no improvements in knowledge or information access after the introduction of a portal, and Kramer et al. (Reference Kramer, Lensink and Plantinga2024) report that an interactive pension portal in the Netherlands had no significant impact on pension preparation.
Taken together, these studies underscore that when and to what extent individuals spend time on information provision in general – and online pension portals in particular – is far from settled.
A plausible explanation is that information engagement is inherently heterogeneous. People differ in when and how actively they seek out retirement information. Consistent with this, Hentzen et al. (Reference Hentzen, Hoffmann and Dolan2024) found that pension fund members increasingly seek information proactively rather than relying on fund communication. This is driven primarily by the uncertainty about the fund’s purpose and demands for greater transparency, which suggests that portal use reflects individual demand as much as fund supply. That is, understanding who engages with information, and under what circumstances, is as important as understanding how pension portals are used and experienced by participants.
Greenberg et al. (Reference Greenberg, Hershfield, Shu and Spiller2023) show that psychological traits – including intertemporal discounting, subjective life expectancy, and perceived benefit ownership – predict intended Social Security claiming age, while Hoffmann and Plotkina (Reference Hoffmann and Plotkina2020) find that individuals engage with retirement planning information primarily when financial security is low and framing aligns with their construal level.
In addition to looking at heterogeneity in members’ characteristics, important work has been done on what information is provided and the beliefs individuals hold in response to it. For instance, Ciani et al. (Reference Ciani, Delavande, Etheridge and Francesconi2023) use Google Trends and survey data to show that older individuals expect to spend more time with retirement planning after a reform, even when costs rise.
While prior research establishes a foundation for understanding member heterogeneity, it remains limited by a reliance on self-reported survey data. Current studies primarily capture how individuals intend to interact with pension information or their attitudes toward it, rather than their actual engagement. This creates a significant ‘intention-behavior’ gap that limits the practical application of their findings. This gap between information availability and action aligns with the behavioral economics literature on present bias and procrastination. Laibson (Reference Laibson1997) shows that hyperbolic discounting leads individuals to overweight immediate costs such as the effort required to engage with pension information relative to future benefits, leading to an intention-action gap. Even when individuals recognize the importance of retirement planning, they may repeatedly defer engagement until the decision becomes immediately pressing.
Our study advances this literature by shifting the focus from subjective self-reports to objective behavioral data. By analyzing granular, time-stamped interactions, we move beyond what individuals say they will do to observe exactly how much time they invest in information search.
This distinction between what information is provided or expected to matter, and whether individuals actually spend time using that information, is crucial. Without insight into the timing and intensity of information use, policy efforts risk missing their target: interventions may provide more or clearer information without addressing whether people spend time on it in the first place. Our study addresses this gap by analyzing behavioral data from an online pension portal to show when and how much time individuals spend on retirement information. We do so in the context of the Dutch pension system, which offers a particularly relevant institutional setting given its structure and recent policy reforms.
4. Institutional setting
The Dutch pension system is often cited as a well-developed and comprehensive system in international comparisons (Mercer, 2024). It consists of three pillars. The first pillar is the statutory public pension scheme (Algemene Ouderdomswet/General Old Age Pensions Act, AOW), which provides a flat-rate benefit to all residents who have lived or worked in the Netherlands between the ages of 15 and the statutory retirement age. This pay-as-you-go scheme is financed primarily through payroll taxes, but also receives a substantial contribution from the general government budget. It offers a basic income that is linked to the minimum wage – around 70 percent of the net minimum wage for singles and 50 percent each for couples (Werken aan Ons Pensioen, n.d.). The statutory retirement age has been gradually raised over the past decade to reflect increases in life expectancy. In 2012, a reform introduced the formal linkage of the retirement age to life expectancy, meaning that each additional year of life expectancy would add one year to the retirement age. However, following the 2019 Pension Agreement that laid the groundwork for the Future of Pension Act (Wet toekomst Pensioenen (WtP)), this linkage was loosened: for each additional year of life expectancy, the statutory retirement age now rises by only eight months, rather than a full year.Footnote 3 As a result, the AOW age will remain at 67 until 2027, after which it will increase more gradually (CBS, 2022). Individuals are informed of their statutory retirement age at least five years in advance to allow for adequate retirement planning.
The second pillar consists of occupational pension schemes, which are quasi-mandatory for most employees due to collective labor agreements negotiated between employers and trade unions (Bovenberg et al., Reference Bovenberg, Mehlkopf and Nijman2015). Participation is effectively compulsory in sectors where the government has declared these agreements universally binding, leading to coverage rates exceeding 90 percent of employees (Pensioenfederatie, n.d.). For individual employees, participation in sectoral pension schemes is mandatory. While the statutory AOW benefit cannot be claimed before the official retirement age, individuals can choose to retire earlier by drawing on their occupational pension, albeit with permanently reduced benefits that reflect the longer payout period and shorter accumulation phase. Importantly, retiring more than five years before the statutory retirement age is generally only feasible either through phased retirement (i.e., a reduction in working hours under collective labor agreements) or by accepting substantial benefit reductions, reflecting deliberate policy mechanisms designed to discourage very early retirement. Participants face a structured set of predefined choices, such as retirement timing and the exchange between old-age and partner/survivor pension, while key elements such as contribution rates and investment policy are largely determined collectively.
While occupational pensions were traditionally structured as defined benefit (DB) plans, indexation of accrued rights was conditional on funding positions rather than guaranteed. Entitlements were typically based on career-average wages. Funding pressures experienced by pension funds, particularly following the financial crisis, have been attributed to a combination of factors, including low interest rates, demographic developments, financial market conditions, contribution (premium) policy, and the extent of interest rate risk hedging. The relative importance of these factors remains subject to debate in the literature. These developments contributed to the introduction of the Future of Pension Act, which replaces DB with a collective defined contribution system.
Providing pension information – such as through online portals – is part of the broader administrative responsibilities of pension funds and is ultimately financed by plan members through contributions. While it is difficult to isolate the costs of information provision specifically, administrative costs of pension funds, which include communication and digital infrastructure, typically amount to roughly €100–€250 per participant per year for larger funds, with substantial variation across funds (AFM, 2021; IG&H, 2025).
The third pillar encompasses individual pension savings and insurance products, which allow individuals – particularly the self-employed and those without access to second-pillar arrangements – to accumulate additional retirement savings under favorable tax conditions (AFM, 2020).
5. Data and descriptive statistics
This study focuses on the retirement planning behavior of active Footnote 4 employees in the Dutch government and education sectors. Specifically, we analyze behavioral data drawn from the online portal usage of a random sample of participants in the largest occupational pension fund serving these sectors. The pension fund manages retirement income, disability benefits, and survivors’ pensions for more than 3 million participants and their dependents, covering approximately 35 percent of the entire working population in the Netherlands. With €459.5 billion of available assets, it is one of the largest pension funds in the world.
The fund’s online portal provides each participant with personal access to their information and records, on a day-to-day basis, how much pension they have accrued. It offers personalized projections of future retirement income and allows participants to explore how different choices – such as retiring early or switching to part-time work – would affect their benefits. In addition, the portal provides general information about the pension plan. Access is secured through a government-approved digital identifier.
Our sample covers portal use between November 1, 2020, and December 14, 2021, and consists of a random sample of 11,043 participants aged 21–66. The data contain time-stamped records of portal visits, including the time spent (in seconds) within the portal.Footnote 5 In 2020 and 2021, the official statutory retirement age was 66 years and 4 months.
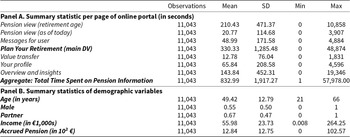
Table 1 (Panel A) reports descriptive statistics for each portal page, as well as for the aggregate measure Time Spent on Pension Information, defined as the total time participants spent across all pages of the portal and across all their visits within the observation period.Footnote 6 On average, participants spend 833 seconds (approximately 14 minutes) on information relevant for retirement planning. Among the different pages, the Plan Your Retirement page stands out, with an average viewing time of about 330 seconds (5 minutes), while the average viewing times for all other pages remain below 210 seconds (3.5 minutes). Because of its prominence and direct relevance for retirement planning, we focus on the Plan Your Retirement page – labeled Time Spent on Retirement Planning Information – as our key dependent variable. This page provides personalized projections of retirement income and allows participants to explore different choices, such as the timing of retirement, whether to use part-time pension, how to adjust the balance between survivor benefits and old-age pension, and how to distribute pension income differently over time (e.g., receiving a higher benefit early and a lower one later, or vice versa).
Descriptive Statistics of Relevant Variables

Table 1 Long description
The table reports summary statistics for time spent on different online pension portal pages (in seconds) and for user demographics, each based on 11,043 observations. Among individual pages, “Plan your retirement” has the highest average time at 330 seconds and also the widest spread, with a maximum of 48,874 seconds. “Pension view (retirement age)” averages 210 seconds, while “Overview and insights” averages 144 seconds. Shorter average visits include “Your profile” at 66 seconds, “Messages for user” at 49 seconds, “Pension view (as of today)” at 21 seconds, and “Value transfer” at 13 seconds. The aggregate total time across pension-information sections averages 833 seconds, ranges from 1 to 57,978 seconds, and has a large standard deviation, indicating highly uneven engagement. Demographics show a mean age of 49 years (range 21 to 66), 55 percent male, and 67 percent with a partner. Mean annual income is about 56 thousand euros with a wide range, and accrued pension averages 12.84 in the table’s stated units, also with substantial dispersion. Many minimum times are zero, so some users did not visit certain pages during the observation window.
Notes (for Panel A): Time per page is recorded in seconds. Pension view (retirement page) shows projected monthly gross income at statutory retirement age. Pension view (as of today) shows accrued rights if work stops today. Messages for user contains personalized messages. Plan Your Retirement allows simulations of (early) retirement options, main dependent variable. Value transfer allows transfer of accrued pension rights from other funds. Your profile shows user, partner, and employer details plus communication preferences. Overview and insights provides projected income/expenses (incl. holiday allowance) and advice. Total Time Spent on Pension Information measures aggregated time (seconds) across all sections.
Notes (for Panel B): Age is an ordinal variable measuring the age of the respondents at the time they interacted with the online pension portal. Male is a dummy variable which is 1 if the respondent is a male. Partner is a dummy variable which is 1 if the respondent has a partner (husband, wife, civil partnership, etc.). Income is a continuous variable measuring the yearly gross income of the respondent. Accrued pension is a continuous variable measuring the pension rights accumulated so far by the respondent.
Table 1 (Panel B) presents additional summary statistics for variables used in the analysis beyond portal use. These include demographic and financial characteristics of participants, such as age, gender, partner status, and accrued pension. Age ranges from 21 to 66, with an average of just under 50 years. Fifty-five percent of participants are male, and 67 percent have a partner. Average gross annual income is about €56.000 per year, while average accrued pension rights amount to nearly €13.000.
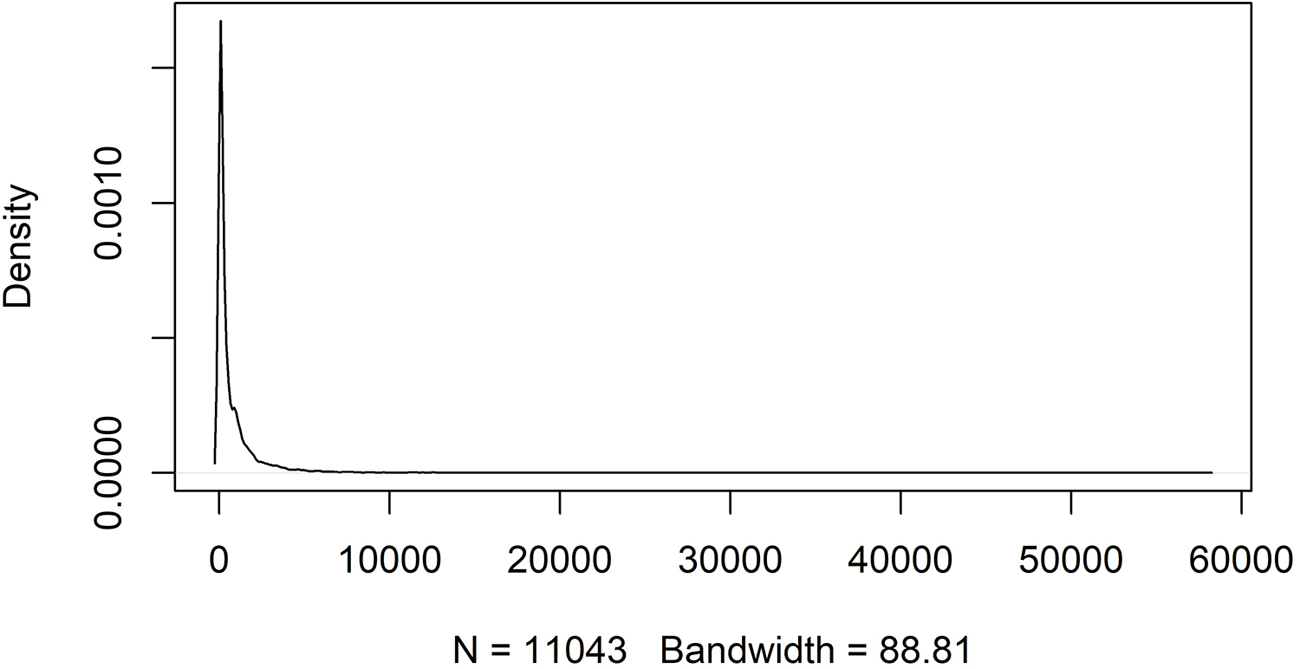
There is substantial heterogeneity in portal use. Figure 1 presents the probability density function of Time Spent on Pension Information. The density function is truncated at zero, and extreme values at the right tail are likely due to participants forgetting to log out (although we cannot establish this with certainty). Differences across age groups will be examined in Figure 2. This pattern aligns with earlier findings in the literature that most individuals make limited use of pension information.
Distribution Dependent Variable: Time Spent on Pension Information.

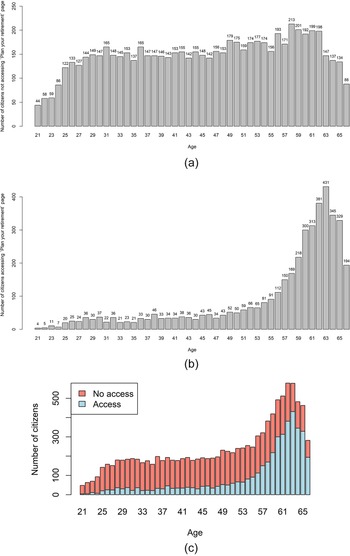
Number of Participants (Not) Spending Time on Retirement Planning Information (Plan your Retirement page).

Figure 2 Long description
The bar graph displays the number of current smokers per 1000 people across different age groups. The x-axis represents age groups ranging from 21 to 65 years, while the y-axis shows the number of smokers per 1000 people, ranging from 0 to 300. The bars are vertical. Key values include: age 21 with 88 smokers, age 23 with 144 smokers, age 25 with 162 smokers, age 27 with 166 smokers, age 29 with 165 smokers, age 31 with 160 smokers, age 33 with 144 smokers, age 35 with 147 smokers, age 37 with 157 smokers, age 39 with 155 smokers, age 41 with 150 smokers, age 43 with 147 smokers, age 45 with 170 smokers, age 47 with 175 smokers, age 49 with 171 smokers, age 51 with 173 smokers, age 53 with 179 smokers, age 55 with 203 smokers, age 57 with 219 smokers, age 59 with 231 smokers, age 61 with 198 smokers, age 63 with 186 smokers and age 65 with 166 smokers. The highest number of smokers is at age 59 with 231 and the lowest is at age 21 with 88. The graph shows an overall increase in the number of smokers as age increases, peaking at age 59, followed by a decline.
Figure 2 (Panel A) shows the number of participants who did not spend any time on the pension portal at all, as a function of age, underscoring the importance of accounting for left-side truncation when analyzing the time that participants spent on the portal. Figure 2 (Panel B) shows the number of participants who spent time on the portal, as a function of age, with clear jumps in time spent around certain ages. This indicates that individuals closer to retirement are more likely to spend time consuming pension information than younger cohorts. While these figures make the point about the age pattern of information access, they do not provide any information regarding the density by which every age group accesses information. Figure 2 (Panel C) shows a histogram of the total number of participants, divided into participants that accessed the portal and participants that did not access the portal. The plot clearly shows an upper trend in the number of individuals accessing information as age progresses. In the next section, we investigate whether these differences across age groups are statistically significant.
In sum, the data reveal substantial heterogeneity in time spent on the portal across age groups, and that a non-negligible share of participants spends no time on the portal at all. Non-use matters, but the depth of behavior – such as time spent, variation by age, and responses to reforms – can only be studied among users. Our analyses therefore focus on Time Spent on Retirement Planning Information (time spent on the Plan Your Retirement page), while accounting for non-users.
6. Age and time spent on retirement planning information
To investigate how age is associated with the Time Spent on Retirement Planning Information, we estimate the following regression equation:
 \begin{equation}{Y_i} = {\beta _0} + {\beta _1}*\left( {Ag{e_i}|Ag{e_i} = 40} \right) + {\beta _2}*{X_i} + {\varepsilon _i},\end{equation}
where  ${Y_i}$ is the Time Spent on Retirement Planning Information, defined as the time in seconds that participant i spends on the Plan Your Retirement page. $Ag{e_i}$ is the age of participant i, and X contains control variables for gender, partner status, job category, income, and accrued pension.
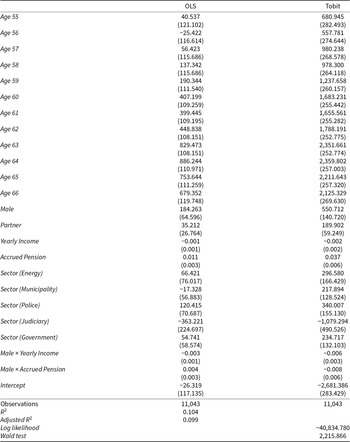
Table 2 presents regression results, with 40-year-old participants serving as the reference group. Age 40 was chosen to allow for a balanced comparison between younger (21–40) and older (40–66) cohorts. In addition, this age group is the most frequent in our sample, ensuring stable estimates, and it represents a meaningful midpoint in the working life cycle, before retirement planning typically becomes more salient. The average Time Spent on Retirement Planning Information among 40-year olds is only 27.6 seconds (SD = 187.3 seconds), less than half a minute. Column (2) reports OLS estimates without accounting for censoring of participants who spent no time on the Plan Your Retirement page, while column (3) reports Tobit estimates, which incorporate these censored observations. The Tobit estimates are coefficients. Although Tobit and OLS coefficients can be interpreted similarly, the main difference is that Tobit estimates the linear effects on the uncensored latent variable rather than on the observed outcome (McDonald and Moffitt, Reference McDonald and Moffitt1980). The differences in coefficients between columns 2 and 3 are driven by large heterogeneity between participants who spent time on the portal and those who do not. Consequently, Tobit is the more appropriate estimator for this sort of data, as it accounts for such differences between groups.
Regression results for Time Spent on Retirement Planning Information (in seconds)
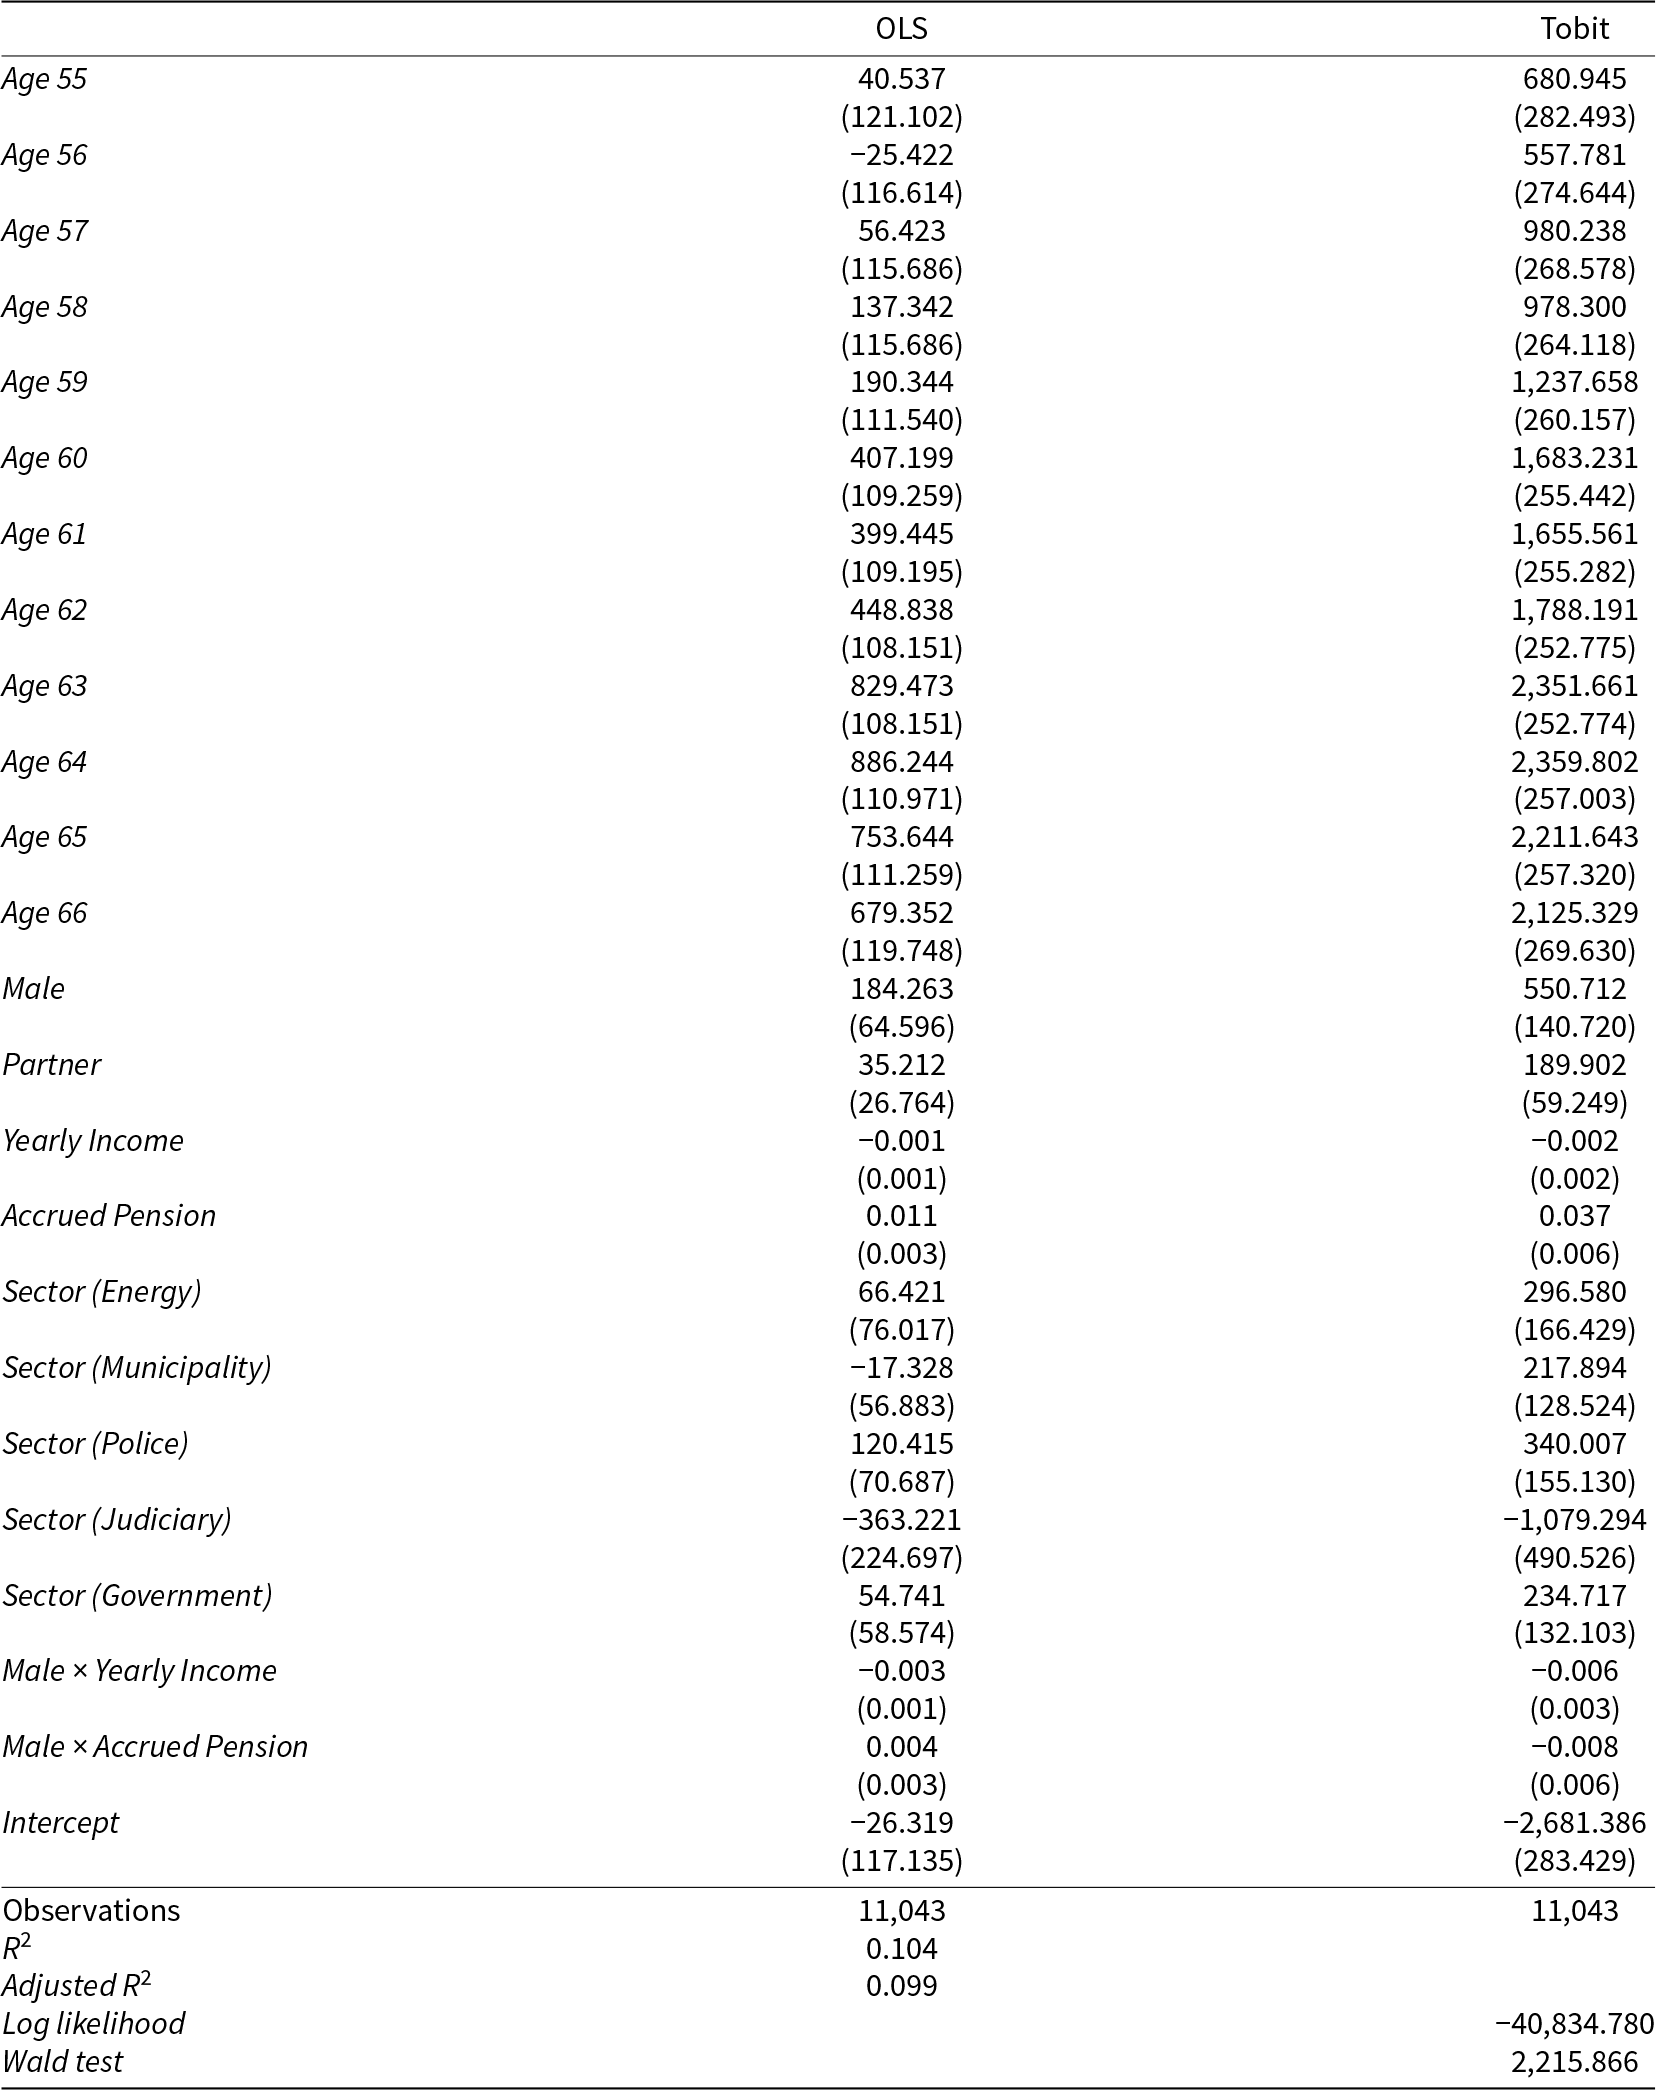
Table 2 Long description
The table reports regression estimates for seconds spent viewing retirement planning information, comparing OLS and Tobit models with age indicators and demographic, financial, and sector controls. Relative to age 40, ages 55 to 58 show small and mostly non-significant OLS differences, while Tobit already shows significant increases for these ages. From age 59 onward, estimated time increases strongly: OLS rises from about 190 seconds at age 59 to about 886 seconds at age 64, then remains high through age 66. Tobit effects are much larger, increasing from about 1,238 seconds at age 59 to about 2,360 seconds at ages 63 to 64, staying above about 2,100 seconds through age 66. Male is associated with more time in both models, and having a partner is significant only in Tobit. Accrued pension is positively associated with time in both models, while yearly income is not significant on its own, but the male-by-income interaction is negative and significant. Several sector indicators are significant mainly in Tobit, including positive effects for energy, municipality, police, and government, and a negative effect for judiciary. Results are based on 11,043 observations; interpret coefficients as conditional associations that depend on the model choice and included controls.
Notes: These OLS and Tobit models include Age dummies regressed over Time Spent on Retirement Planning Information. Controls are Male, annual Income, and Accrued Pension. Partner has also been included as an additional control. The results are the comparison between a baseline year of 40-year-old respondents. Only significant job categories are included. This category has been chosen based on the high number of respondents in that category, ensuring the robustness of the results. Standard errors are in parentheses. Significance levels: ***p < 0.01, **p < 0.05, *p < 0.1.
The results reveal a clear age pattern. Participants aged 55–66 spend significantly more time on Retirement Planning Information than younger cohorts, who do not differ from the 40-year-old baseline. Importantly, activity rises precisely at the point when early retirement becomes feasible, from age 60 onward. The disincentive mechanism for early retirement at ages 60–62 – manifesting as larger reductions in pre-pension benefits when retiring early – suppresses the time spent on Retirement Planning Information. Once this larger reduction ceases to be in effect, and the early retirement penalty ends, the average time spent rises sharply: between ages 62 and 63, time spent increases by 31.5 percent, from 1,788 seconds (29.8 minutes) to 2,352 seconds (39.2 minutes). These results suggest that participants are aware of their early retirement options and devote significant time to the portal when these options become financially most relevant for them.
For the control variables, the results show that male participants and those with a partner spend significantly more time on Retirement Planning Information than female participants and those without a partner. Higher accrued pension is also associated with greater time spent on the page.Footnote 7
A potential concern is whether our results reflect online portal user bias. For example, some participants may be underrepresented if their jobs involve less computer use or if older participants are less digitally skilled. Even though we cannot directly rule out this possibility, we provide two explanations that alleviate this concern. First, job category is included as a control variable to account for the possibility that portal use reflects digital skills rather than genuine interest in retirement planning. On the one hand, participants in certain occupations may appear to spend more time because they take longer to navigate the portal; on the other hand, groups with fewer opportunities to go online may spend less time overall. However, data from Statistics Netherlands (CBS) show that, for the Dutch working population, there are no systematic differences across age groups in the use of digital services. In fact, about 9 in 10 people in the Netherlands use government websites, and the country ranks among the EU’s top in digital skills. Second, the job categories in our sample cover both office- and labor-intensive occupations, reducing the risk that results are driven by computer literacy. Consistent with this, we find no significant differences in the time spent in the portal across job categories. Taken together, these findings reduce concerns that our age-related results are confounded by user bias.
Overall, our results show low levels of Time Spent on Retirement Planning Information at younger ages, but a sharp increase once retirement options become actionable. Participants appear to recognize when pension information is valuable and invest time in the portal at precisely those moments when the information can inform concrete choices.
6.1. Robustness analysis
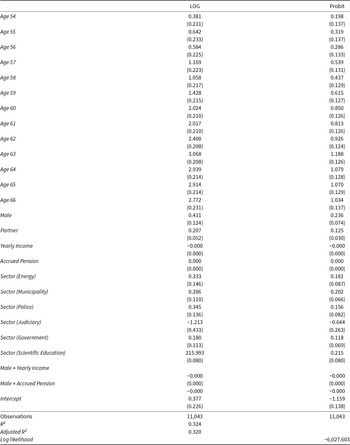
We present several arguments as to the relevance of Tobit as the primary estimator analysis. However, it is also important to confirm that results are robust to different parameterizations of the dependent variable, especially to alleviate concerns regarding the long right tail of the data or regarding the individuals not accessing the portal. To address this concern, Table 3 shows the analysis when we use the same set of independent variables and we parameterize the dependent variable as follows: either in log or by defining the variable dichotomously (i.e., whether the individual checked the portal or not). The latter case is a simplified approximation of what would be the empirical outcomes in the case that the decision not to participate and the decision to actively inform oneself using the online portal are behaviorally different decisions and may not result from the same data generating process.
Robustness analysis for Time Spent on Retirement Planning Information (in seconds)
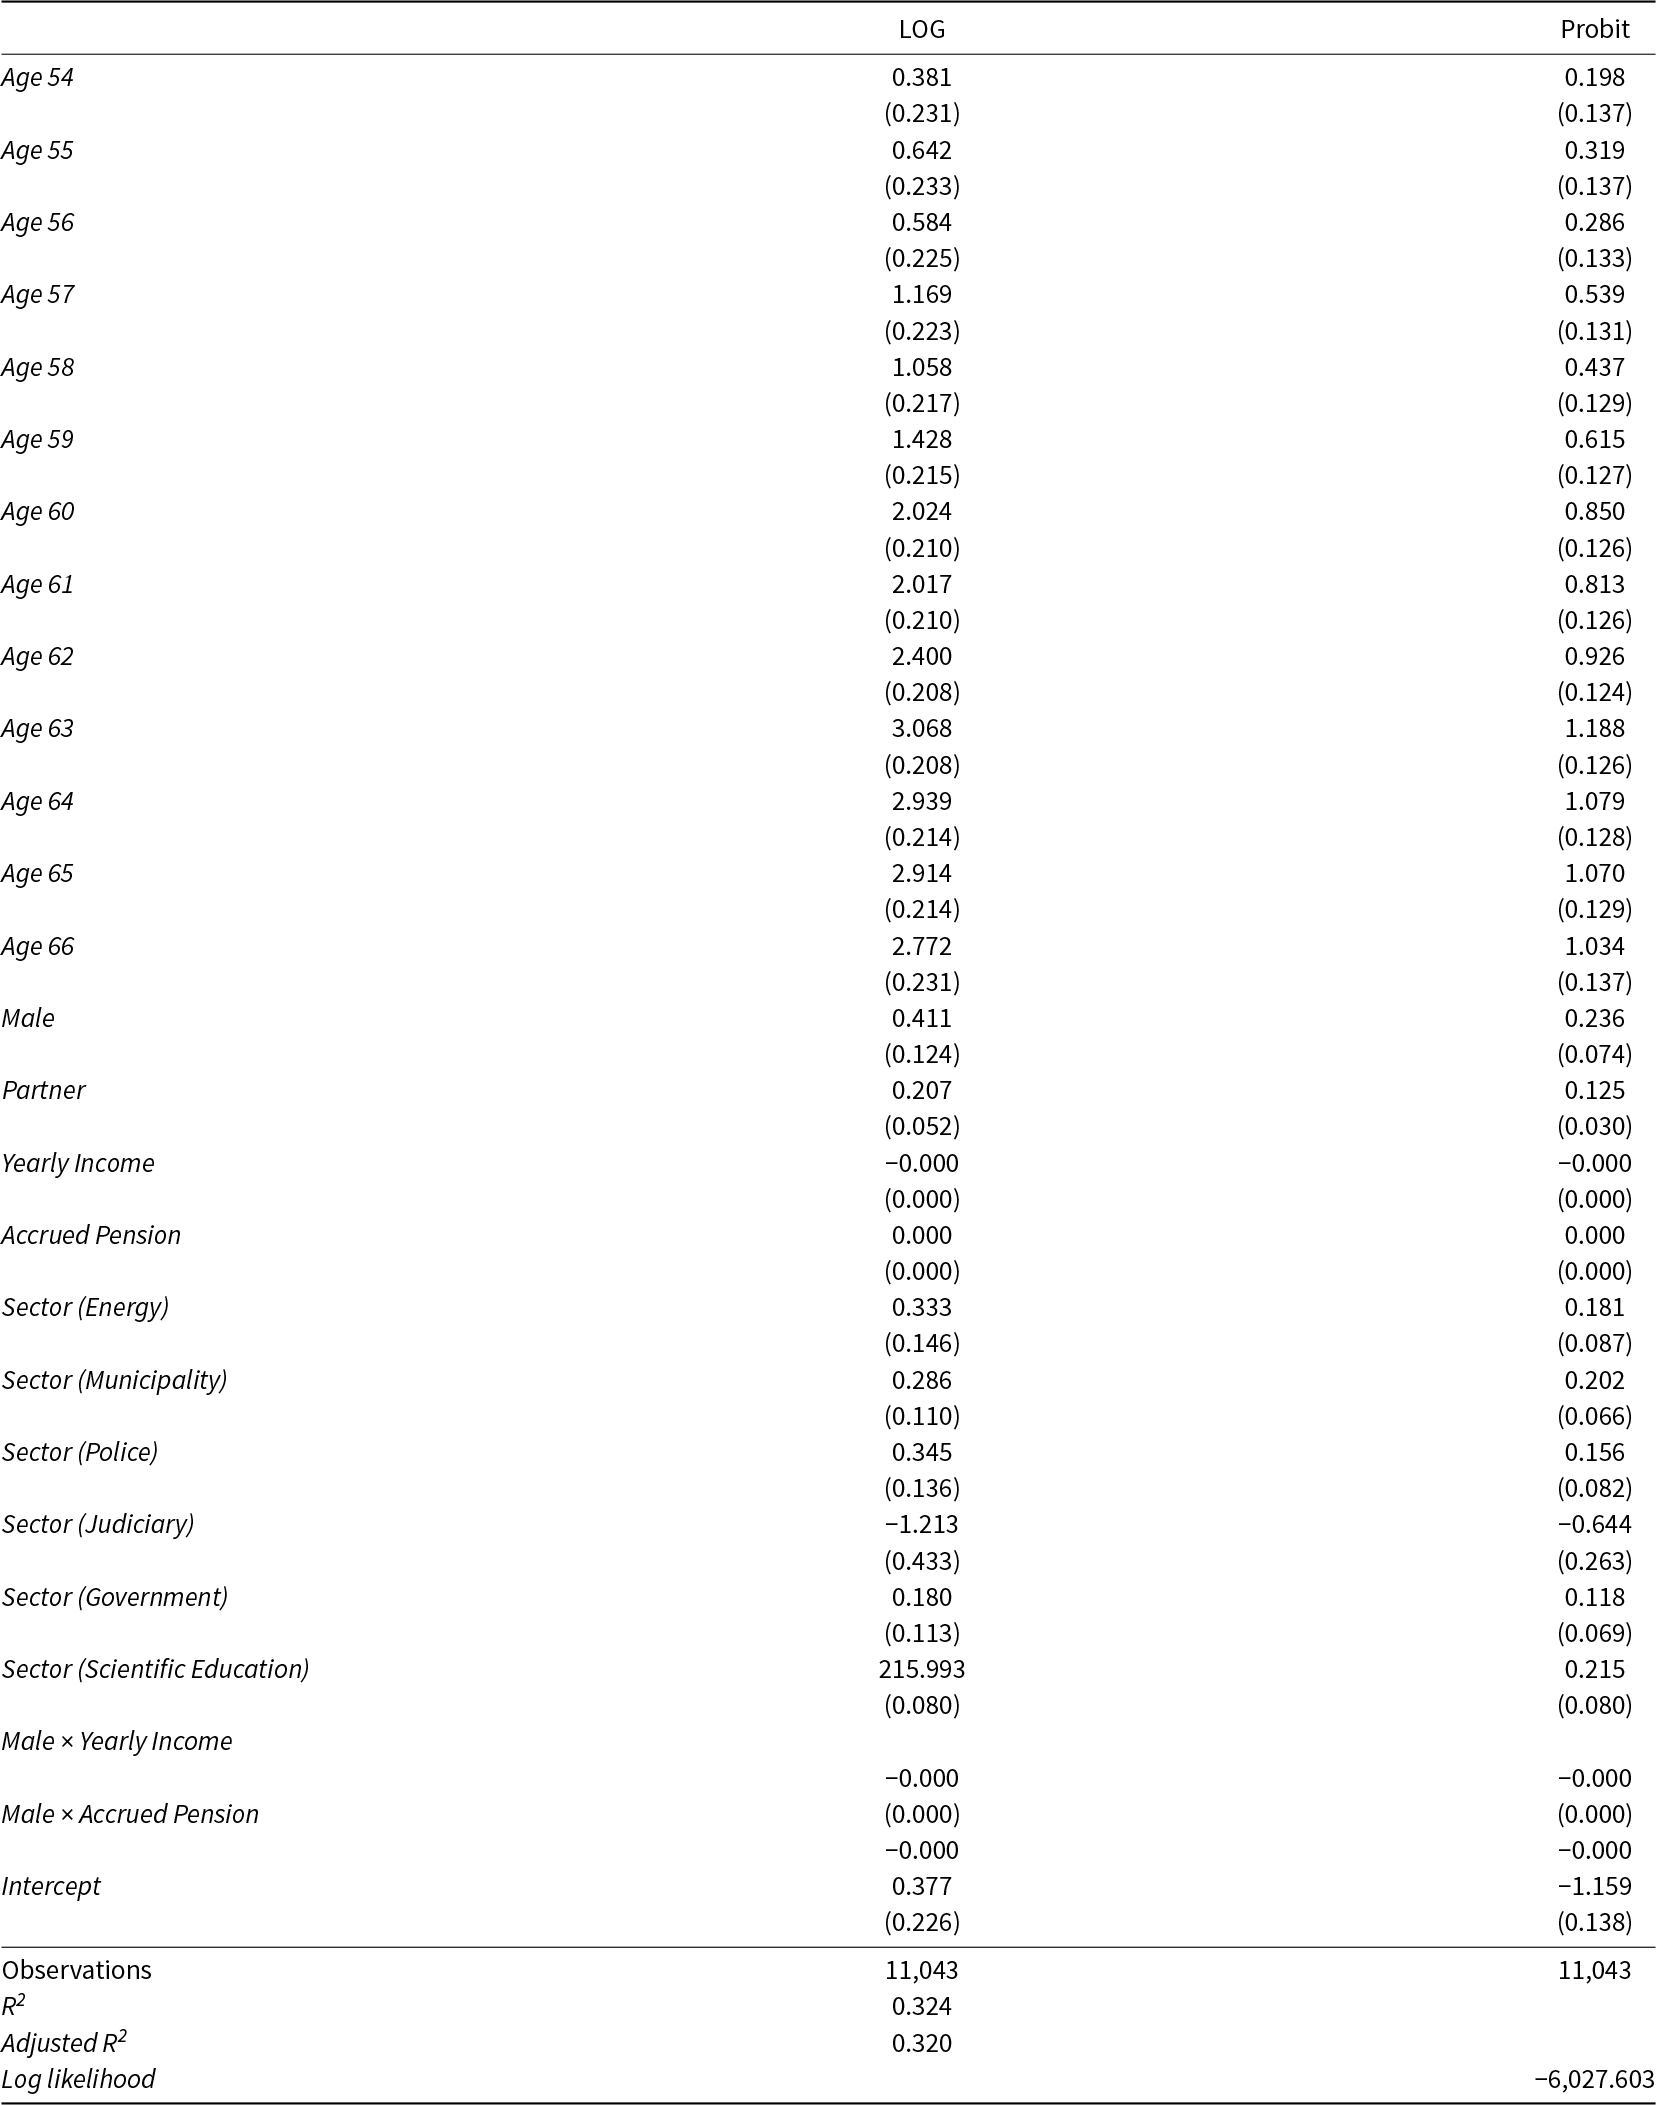
Table 3 Long description
The table reports regression results for time spent viewing retirement-planning information using two approaches: a log-transformed time model and a probit model for whether the information was accessed. Relative to a baseline age group, age effects rise sharply from the mid-50s through the early 60s and are mostly statistically significant in both models. In the log model, coefficients increase from 0.381 at age 54 to a peak of 3.068 at age 63, remaining high through ages 64 to 66. In the probit model, age effects similarly grow from 0.198 at age 54 to 1.188 at age 63, staying above 1.0 for ages 64 to 66. Male and having a partner are positive and statistically significant in both models (male 0.411 log and 0.236 probit; partner 0.207 log and 0.125 probit). Income is slightly negative in the log model and not statistically meaningful in the probit model, while accrued pension is positive and statistically significant in both. Sector indicators vary: energy and police are positive in both models, judiciary is negative in both, and municipality and government are more clearly positive in the probit model than in the log model. Results are based on 11,043 observations and include controls and age dummies; coefficients should be interpreted as associations rather than causal effects, and standard errors are shown in parentheses.
Notes: These LOG and Probit models include Age dummies regressed over Time Spent on Retirement Planning Information. The LOG model takes the logarithm of (1 + Time Spent on Retirement Planning Information). The Probit model is defined as whether the individual accessed Retirement Planning Information or not (0 vs. 1). Controls are Male, annual Income, and Accrued Pension. Partner has also been included as an additional control. The results are the comparison between a baseline year of 40-year-old respondents. Only significant job categories are included. This category has been chosen based on the high number of respondents in that category, ensuring the robustness of the results. Standard errors are in parentheses. Significance levels: ***p < 0.01, **p < 0.05, *p < 0.1.
The robustness results show that even with these parameterizations, our conclusions remain fundamentally unchanged.
7. Causal identification strategy: RDD
7.1. The setting
The descriptive analyses in the previous sections showed that individuals tend to seek pension information more actively when it becomes personally relevant. To better understand the timing, triggers, and heterogeneity of this behavior, we complement these descriptive insights with a causal research design exploiting a natural experiment in the Dutch pension system.
Specifically, we examine whether a change in Dutch pension legislation affected the Time Participants Spent on their Retirement Planning Information. We analyze shifts in online portal usage around a reform of the statutory retirement age using a sharp Tobit RDD, following the methodological framework proposed by Dong (Reference Dong2019). The outcome variable is Time Spent on Retirement Planning Information. The running variable is age, measured in whole years, with the cutoff being determined by the change in the pension law with respect to the retirement age.
7.2. Institutional background to the law change
In 2012, the Netherlands enacted legislation that formally linked the statutory retirement age to life expectancy, with the retirement age increasing by one year for every additional year of life expectancy. This framework was refined over time, including under the 2015 legislation, which introduced a fixed schedule: the retirement age would rise by four months each year, reaching 66 in 2018 and 67 in 2021. After 2021, the expectation was that further increases would follow a steeper trajectory, fully tied to life expectancy on a one-to-one basis. The Pension Agreement of June 5, 2019, fundamentally altered this trajectory. As part of the agreement, the pace of future increases was reduced, so that for every additional year of life expectancy, the retirement age would rise by only eight months instead of a full year. To provide employers with greater certainty, the legislation also froze the retirement age at 67 until 2027. These adjustments aimed to balance the financial sustainability of the system with social concerns, particularly addressing the feasibility of working into older age for individuals in physically demanding jobs, and potentially reshaping individuals’ retirement planning horizons. Crucially, the reform directly affected individuals who were 59 years old at the time of the agreement in mid-2019 (turning 60 in 2020), ensuring that their statutory retirement age would remain fixed at 67 instead of potentially increasing further under the earlier rules.
7.3. Law change and cutoff justification
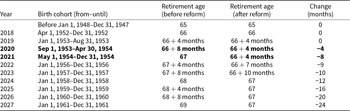
This institutional change creates a natural cutoff for causal identification. Individuals who turned 60 in 2020 were the first cohort assured of retiring at 67 under the new rules (treatment group), while slightly older individuals – already aged 60 or above in 2019 – remained subject to the earlier legal framework with fixed annual increases of four months and the expectation of steeper future adjustments (control group). The transition in statutory retirement ages is summarized in Table 4.
Statutory retirement age before and after the 2019 Pension Agreement
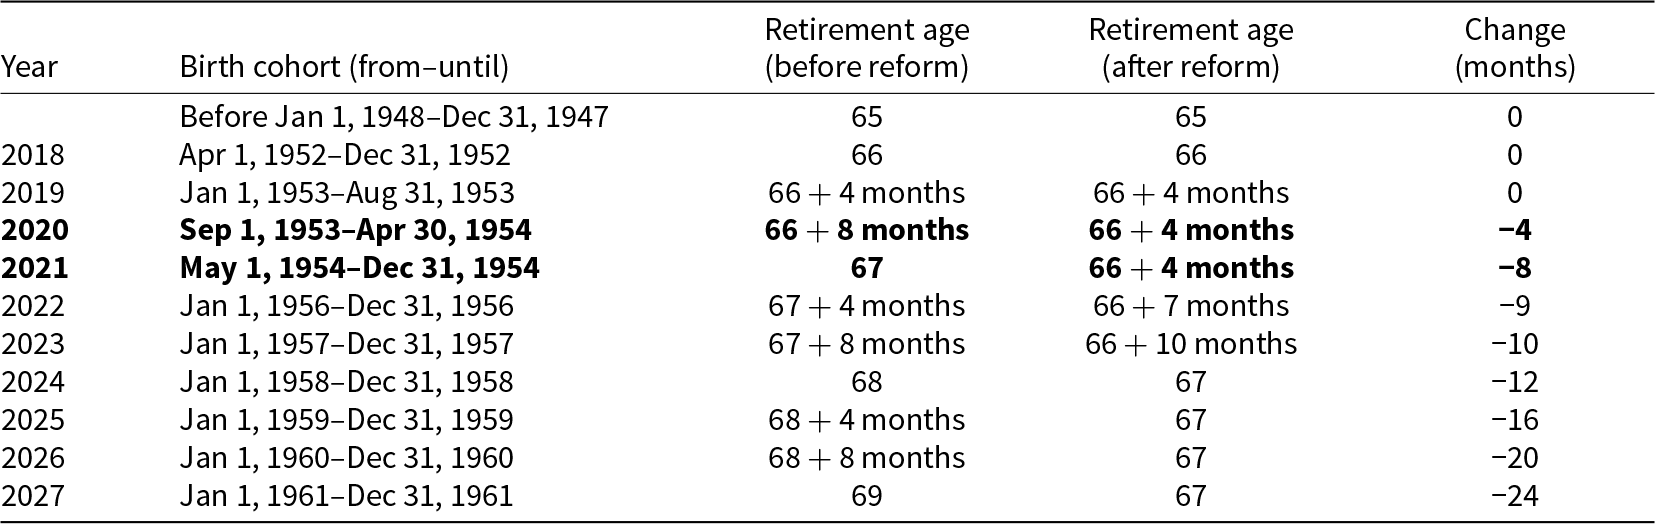
Table 4 Long description
The table lists, by year and birth cohort, the statutory retirement age planned before the 2019 pension reform and the age after the reform, plus the change in months. For 2017 through 2019, the retirement age is unchanged: 65 in 2017, 66 in 2018, and 66 years and 4 months in 2019. Starting in 2020, the reform reduces the age by 4 months, and in 2021 by 8 months. The reductions continue to grow: 9 months in 2022, 10 months in 2023, and 12 months in 2024. Larger cuts follow for later cohorts, with reductions of 16 months in 2025, 20 months in 2026, and 24 months in 2027, when the schedule shifts from 69 before reform to 67 after reform. Overall, the pre-reform schedule rises steadily from 65 to 69 across the years shown, while the post-reform schedule rises more slowly and then holds at 67 from 2024 through 2027. The cohort ranges indicate who is affected each year, and the reform’s impact begins with those reaching pension age in 2020 and later.
Notes: The Pension Agreement was published on June 6, 2019. It affected cohorts reaching pension age in 2020 and 2021 directly, and subsequently adjusted the statutory schedule for later years.
The treatment group consists of individuals who turned 60 in 2020, while the control group includes those just above this age. Because pension eligibility in the Netherlands is defined deterministically by date of birth, individuals who turned 60 in 2020 mark the sharp cutoff for our RDD, which therefore qualifies as a sharp rather than a fuzzy design. To ensure comparability, we restrict the analysis to individuals close to the cutoff, reducing the risk of age-related confounding.
Using this setup, we estimate the true local average treatment effect of the 2019 reform on the time participants spent on retirement planning. As in our descriptive analyses, we adopt a Tobit estimator rather than OLS to account for censoring at zero. By exploiting the discontinuity in treatment assignment created by the reform, this design isolates the causal impact of greater certainty about retirement timing on participants’ use of the pension portal. This allows us to move beyond descriptive patterns and provide causal evidence that institutional changes can shape individuals’ proactive retirement planning behavior. Descriptively, we can see this already by referring to Figure 2 (Panel C). Via the shading bars, we can clearly see that there are discontinuities at focal ages but that the age-60 cross-sectional difference is higher (i.e., increase in the number of participants accessing the portal). The same applies to the age-63 cross-sectional differences.
7.4. Continuity assumption
For a sharp Tobit RDD, the key assumption that needs to be fulfilled is that of continuity: absent the treatment, there would be no expected discontinuity (op cit. Cunningham, Reference Cunningham2021 – Section 6.2.2). Applied to our case, had the law change not occurred, we would not see a discontinuity in online search behavior at age 60. Hence, the continuity assumption rules out any omitted variable bias, as all other unobserved determinants of the dependent variable are continuously related to the running variable X. If a discontinuity were present, it would imply that something other than the treatment caused the jump, indicating that the dependent variable was already under treatment.
As there cannot be data available about the counterfactual, the continuity assumption cannot be tested directly. However, relevant institutional knowledge supports its plausibility. The 2019 Pension Agreement was a major reform of the Dutch pension system, debated for nine years (Anderson, Reference Anderson2019). Given its significance, the involvement of government, social partners, and other stakeholders in the negotiation, and the fact that our analyses focus on an online portal providing employment-related pension services, it is rather unlikely that other contemporaneous factors would confound this design.
7.5. Empirical strategy
We specify the following Tobit RDD:
 \begin{equation}{Y_i} = {b_0} + \tau {D_i} + {\beta _1}(Ag{e_i} - c) + {u_i},\end{equation}
where  ${Y_i}$ depicts Time Spent on Retirement Planning Information by participant i, ${D_i}$ equals 1 when participant i was older or equal to 60, Age states the $Ag{e_i}$ of participant i, and c is the sharp cutoff point, which equals 60. Furthermore, ${\beta _1}$ captures the magnitude of the discontinuity.
Sharp Tobit regression discontinuity

Table 5 Long description
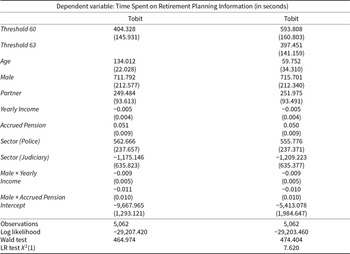
The table reports two Tobit regression models predicting time spent on retirement-planning information, measured in seconds, using age-based thresholds and demographic and job controls. In both models, crossing the age 60 threshold is associated with a large increase in time spent, about 404 seconds in the first model and about 594 seconds in the second, and both effects are statistically reliable. Only the second model includes an additional age 63 threshold, which is also linked to more time spent, about 397 seconds, and is statistically reliable. Age itself is positively related to time spent in both models, with a stronger age slope in the first model (about 134 seconds per year) than in the second (about 60 seconds per year, weaker evidence). Men spend substantially more time than women, roughly 712 to 716 additional seconds, and having a partner is also associated with more time, about 249 to 252 seconds. Yearly income shows a small negative association that is not statistically reliable, while accrued pension is positively associated with time spent, about 0.05 seconds per unit, and is statistically reliable. Compared with the omitted sector, Police is associated with more time (about 556 to 563 seconds) and Judiciary with less time (about 1,175 to 1,209 seconds), both with weaker statistical evidence than the main threshold effects. The interaction between male and yearly income is slightly negative with weak evidence, while the interaction between male and accrued pension is not statistically reliable. Both models use 5,062 observations, and overall model tests indicate the models are jointly statistically reliable; results should be interpreted as associations within a censored-outcome Tobit framework rather than causal effects.
Notes: The second column depicts a Tobit RDD considering a discontinuity at Age 60 only. The third column includes a discontinuity at Age 63, capturing an additional discontinuity at Age 63. Only significant job categories are included. Standard error in parentheses. Significance levels: ***p < 0.01, **p < 0.05, *p < 0.1.
7.6. Regression results
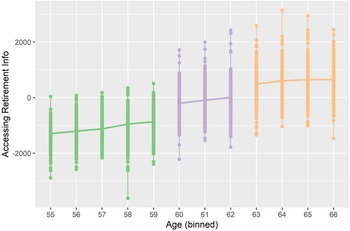
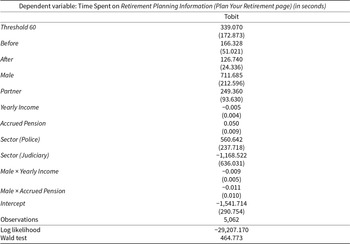
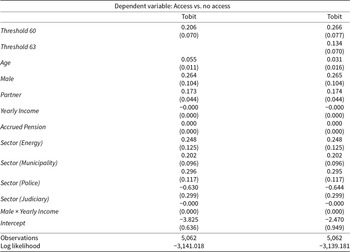
The second column in Table 5 captures a discontinuity at age 60, while the third column adds a second discontinuity at age 63 to account for the early retirement disincentive penalty up to age 62. These two threshold variables are mutually exclusive since both treatments cannot happen simultaneously. The sample for which the Tobit RDD is estimated includes participants aged 55–66. This bandwidth was chosen because age 55 marks the point at which participants start to spend more time on pension portal. During the period in which the early retirement penalty is in place, time spent at the age-60 threshold increases to 594 seconds (about 10 minutes more), whereas when the penalty expires at age 63, an additional increase of 397 seconds is estimated (about an additional 7 minutes more). Figure 3 provides a visual representation of these findings. These findings are also robust against different sample sizes and specifications. Specifically, Table A1 from Appendix A shows that even after adding a time trend before and after the discontinuity, results remain unchanged. Same can be said for Table A2 from Appendix A, where the discontinuities hold even if we dichotomize the dependent variable in access vs. no access time.
Visual representation of discontinuities at the Age 60 and Age 63.

Overall, we consistently find the same pattern: the age group affected by the law change, anticipating an adjusted retirement age, spent significantly more time on the portal than the age group not affected by the reform. This provides causal evidence that individuals actively respond to pension reforms that directly impact them. More specifically, once the (early) retirement option becomes available, participants spend significantly more time on the online portal. By contrast, those not affected by the reform are more likely to disregard easily accessible and personalized information provided through the online portal. One potential explanation of our findings is that individuals affected by a slower increase in the retirement age are precisely those who can postpone the decision of whether to retire or not. As a result, they may perceive a lower need to search for information. That is, individuals may tend to seek information that allows them to delay or avoid making a retirement decision, rather than information that is useful for making a well-informed choice.
7.7. Heterogeneity analysis
Next, we provide causal evidence that individuals affected by a law change spend more time in the online portal. This is particularly relevant for policymakers who wish to understand what (and who) drives this result. Following the literature on heterogeneous effects on RDDs (see, for instance, Card et al., Reference Card, Dobkin and Maestas2004, Reference Card, Dobkin and Maestas2008), we subset the sample based on the control variables that we use throughout the analysis. Out of all the variables that we investigate, gender, marital status, and income show significant differences across groups, while job types and accrued pension amounts show no significant results.
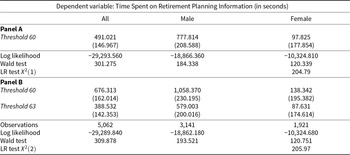
Table 6 shows the regression discontinuity by gender. As can be seen for both discontinuities at age 60 and at age 63, eligible males access the pension portal significantly more than ineligible males. Females do not show such change in behavior. By conducting a likelihood ratio (LR) test comparing models, we also show that differences in accessing time are significant between males and females. This finding is consistent with prior literature documenting gender differences in retirement planning and financial literacy (Lusardi and Mitchell, Reference Lusardi and Mitchell2008).
Sharp Tobit regression discontinuity by gender

Table 6 Long description
The table reports Tobit regression discontinuity estimates for time spent viewing retirement-planning information, measured in seconds, shown for the full sample and separately for men and women. In Panel A, the estimated jump at age 60 is large and statistically significant overall (about 491 seconds) and for men (about 778 seconds), while the estimate for women is much smaller (about 98 seconds) and not statistically significant. Panel B adds a second cutoff at age 63: the age 60 jump remains significant overall (about 676 seconds) and for men (about 1,058 seconds), but is again small and not significant for women (about 138 seconds). At age 63, there is an additional significant increase overall (about 389 seconds) and for men (about 579 seconds), with a small, not significant estimate for women (about 88 seconds). The sample includes 5,062 observations (3,141 men and 1,921 women), and model fit statistics are reported for each group. Overall, the discontinuities are consistently stronger for men than for women, and the reported tests indicate the models and gender differences are statistically meaningful, with standard errors shown in parentheses.
Notes: The second column depicts a Tobit RDD considering a discontinuity at Age 60 only. The third column also includes a discontinuity at Age 63, capturing an additional discontinuity at Age 63. The likelihood ratio test is computed by using the following formula: −2 × (Log likelihood (Male) + Log likelihood (Female)) − Log likelihood (All). Standard error in parentheses. Significance levels: ***p < 0.01, **p < 0.05, *p < 0.1.
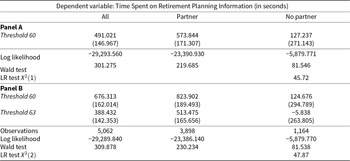
Table 7 shows the results by marital status. Also in this case, eligible individuals who have a partner access the portal significantly more at both discontinuities than ineligible individuals with a partner. In contrast, individuals without a partner show no differences in behavior. As for the above, the LR test shows that differences among individuals having a partner and those who do not are statistically significant. This is consistent with findings from previous literature stating that individuals who are married are also more likely to prepare more for retirement in view of the stability of the household (Lusardi, Reference Lusardi2003).
Sharp Tobit regression discontinuity by marital status
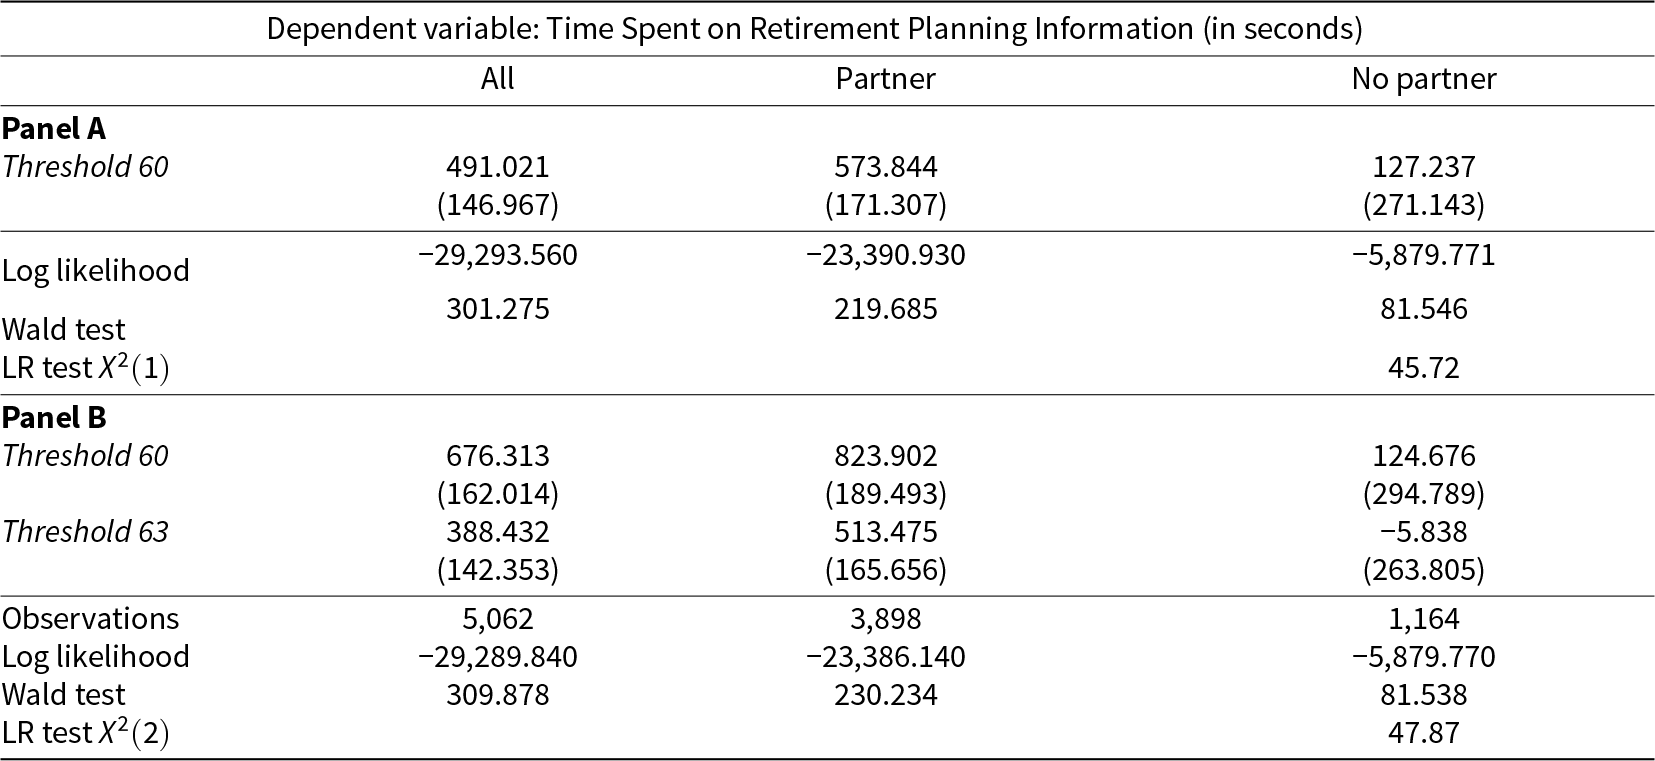
Table 7 Long description
Tobit regression discontinuity results estimate changes in seconds spent viewing retirement-planning information at age thresholds, reported for the full sample and split by marital status. In Panel A, the age 60 threshold is associated with a large, statistically reliable increase for the full sample (about 491 seconds) and for partnered individuals (about 574 seconds), while the estimate for those without a partner is smaller (about 127 seconds) and not statistically reliable. A likelihood-based test indicates the partnered and non-partnered models differ significantly. Panel B adds an additional threshold at age 63: the age 60 jump remains large and statistically reliable for all (about 676 seconds) and for partnered individuals (about 824 seconds), but remains small and not reliable for those without a partner (about 125 seconds). At age 63, there is an additional statistically reliable increase for all (about 388 seconds) and for partnered individuals (about 513 seconds), while the estimate for those without a partner is near zero and not reliable. The sample includes 5,062 observations overall, with 3,898 partnered and 1,164 not partnered. Standard errors are reported in parentheses, so uncertainty is larger for the smaller non-partner group, which may limit precision for that subgroup.
Notes: The second column depicts a Tobit RDD considering a discontinuity at Age 60 only. The third column also includes a discontinuity at Age 63, capturing an additional discontinuity at Age 63. The likelihood ratio test is computed by using the following formula: −2 × (Log likelihood (Partner) + Log likelihood (No Partner)) − Log likelihood (All). Standard error in parentheses. Significance levels: ***p < 0.01, **p < 0.05, *p < 0.1.
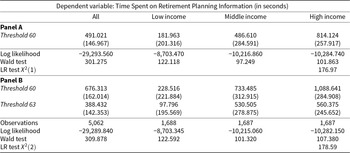
Table 8 shows the results by income groups. To run this analysis, we first divided the Income variable into three equal quantiles. Our results show that at both discontinuities eligible individuals in a high- and middle-income bracket access the portal significantly more than ineligible individuals. Individuals in a low-income bracket show no differences in behavior. The LR test shows that differences across groups are statistically significant. Also, in this case, findings are consistent with the literature connecting income and retirement planning, where it is known that individuals with larger income tend to prepare more for retirement (Lusardi, Reference Lusardi2003).
Sharp Tobit regression discontinuity by income group

Table 8 Long description
The table reports sharp Tobit regression discontinuity estimates for time spent viewing retirement-planning information, measured in seconds, shown for all participants and by income group. In Panel A, the estimated jump at age 60 is about 491 seconds overall and about 814 seconds for the high-income group, while the low-income estimate is about 182 seconds and is not statistically clear; the middle-income estimate is about 487 seconds and is marginally significant. Panel B adds a second cutoff at age 63: the age 60 jump rises to about 676 seconds overall and about 1,089 seconds for high income, remains not statistically clear for low income at about 229 seconds, and is about 733 seconds for middle income. At age 63 in Panel B, there is an additional increase of about 388 seconds overall, about 560 seconds for high income, and about 531 seconds for middle income, while the low-income estimate of about 98 seconds is not statistically clear. Sample sizes in Panel B are 5,062 overall and 1,688 to 1,687 per income group, and model fit statistics are reported for each column. Overall, the discontinuities are consistently largest and most precisely estimated for higher-income participants, so differences by income should be interpreted with attention to the larger uncertainty in the low-income estimates.
Notes: The second column depicts a Tobit RDD considering a discontinuity at Age 60 only. The third column also includes a discontinuity at Age 63, capturing an additional discontinuity at Age 63. The likelihood ratio test is computed by using the following formula: −2 × (Log likelihood (Low Income) + Log likelihood (Middle Income) + Log likelihood (High Income)) − Log likelihood (All). Standard error in parentheses. Significance levels: ***p < 0.01, **p < 0.05, *p < 0.1.
Taken together, these results highlight a persistent challenge in digital information provision. The patterns suggest that pension portals may be more readily utilized by individuals already inclined toward retirement planning, while engagement remains lower among the rest. While high- and middle-income participants show a measurable response to reform-induced information changes, this trend is less evident among low-income participants. Consequently, rather than automatically bridging the planning gap, these digital tools may inadvertently mirror existing socioeconomic asymmetries in retirement readiness.
8. Conclusion
This paper studies time spent on retirement planning information in the online portal of participants of the largest pension fund for employees in the government and education sectors in the Netherlands. Log-in data from the fund’s online portal, which records on a day-to-day basis how long each participant spends on the portal, provide a microscopic view of pension information use across all age categories. We find that the total time participants spent across all pages of the portal within our observation period of 13 months is 833 seconds, approximately 14 minutes. Our findings indicate that individuals devote substantially more time to retirement planning once the option of early retirement becomes available. At the same time, the 2019 pension reform, which froze the statutory retirement age at 67 until 2027, provides causal evidence that greater certainty about retirement timing leads participants to spend more time in the portal. These results suggest that people actively respond to institutional changes that directly affect them, while those not impacted by such reforms are more likely to disregard the personalized information that is readily available. Finally, we also observe that the policy disincentive for early retirement at ages 60–62 – manifesting as larger reductions in pre-pension benefits when retiring early – suppresses this increase in portal use, highlighting how policy instruments can both enable and constrain individuals’ time spent with retirement planning.
Our paper contributes to retirement planning literature by providing empirical evidence on the time participants spend on retirement planning information and by showing under which circumstances, and which types of online information, participants spend the most time on. We show that external environmental changes, such as pension reforms, influence the extent to which individuals seek out pension information. In this way, we extend the work of Ciani et al. (Reference Ciani, Delavande, Etheridge and Francesconi2023) by investigating actual (rather than expected) behavior of individual information exposure (over general exposure) in response to a pension reform. There appears to be a discrepancy between the importance policymakers and pension funds attribute to pension portals and the actual attention that retirement planning information in portals receives from participants. These findings are in line with the growing body of literature identifying discrepancies on how policymakers, pension fund members, and pension funds differ in what information they believe is relevant and how these parties engage with information-seeking behavior (Hentzen et al., Reference Hentzen, Hoffmann and Dolan2024). We argue that this reflects heterogeneity: participants with access to the online portal spend more time on it when a law change slows the increase in retirement age, but primarily among those close to retirement who are required to decide – or can formally request – when to retire. We contribute to the retirement planning literature by showing, using fine-grained behavioral data on actual time spent on pension information, that individuals devote limited attention to retirement planning when retirement decisions lie beyond their direct influence. Our findings are consistent with prior evidence on limited engagement with retirement information. For example, Prast et al. (Reference Prast, Teppa and Smits2012), using survey-based evidence from the Netherlands, document that information provision alone has limited effects on retirement planning behavior. We extend this literature by showing that engagement with retirement information increases selectively when information becomes directly relevant for near-term retirement decisions. Additionally, we extend the theoretical work of Stock and Wise (Reference Stock and Wise1990) to an online pension portal setting. We highlight that individuals face intertemporal trade-offs in their use of retirement information, depending on when the information becomes truly relevant. Specifically, information influences the time spent on retirement planning when it is fundamental to recalculating optimal retirement timing, whereas if the information creates additional uncertainty, individuals delay investing large amounts of time in the portal.
Our findings have implications for pension fund managers and policymakers. For pension fund managers, the results show that individuals differ in their use of the pension portal across age groups, consistent with heterogeneity in how relevant retirement information is at different life stages. An important question for future research is how communication strategies should account for this heterogeneity – for example, whether more tailored approaches improve information use, or whether more standardized communication reduces complexity and supports engagement when individuals are ready to seek information. For policymakers, our findings suggest that the same policy is likely to affect age groups differently. While our results do not speak directly to the optimal design of communication, they are consistent with the broader view that reducing uncertainty about retirement timing is associated with greater use of available planning information.
As in every research, there are limitations in this study. First, there might be additional indicators not observed by us that may explain the heterogeneous time spent across age cohorts. Educational attainment, job characteristics, and health status come to mind as such possibly relevant explanatory variables. Future research may investigate the importance of such variables to improve understanding of the heterogeneity in online portal use for retirement income planning, and, more importantly, whether individuals spending more time on the information portal also make changes to their decisions. We rely on online portal data from one – albeit very large – pension provider for all employees in the government and education sectors in the Netherlands. Participants using this portal may also have built up additional funds for their retirement income elsewhere during their careers. The observation period of 13 months was selected a priori by the data provider. Longer observational periods might therefore shed more light on the longitudinal patterns of time spent in the portal. Future research might also examine broader portals (e.g., mijnpensioenverzicht [‘my pension overview’] in the Netherlands), which project future retirement income across a wider selection of pension providers. Finally, this paper draws to some extent on the uniqueness of the Dutch pension system. Findings may differ in systems where individuals have more choice, for example, in terms of how much to save or how to invest.
Acknowledgements
The authors gratefully acknowledge constructive comments of the participants at the 2024 International Pension Workshop, the 2024 and 2025 NETSPAR Pension Day, the editor, and the anonymous referees.
Appendix A
Sharp Tobit regression discontinuity age 60, with time trends

Table A1 Long description
The table reports a Tobit regression predicting seconds spent on a retirement-planning information page. Reaching the age 60 cutoff is associated with an increase of about 339 seconds, and this effect is statistically significant. Time trends show a positive level before the cutoff of about 166 seconds and a larger positive level after the cutoff of about 127 seconds, with the post-cutoff term strongly significant. Men spend substantially more time, about 712 additional seconds, and having a partner is linked to about 249 additional seconds; both are statistically significant. Yearly income has a small, non-significant association, while accrued pension is positively related, about 0.05 seconds per unit, and is strongly significant. Sector differences appear for police, with about 561 more seconds, and for judiciary, with about 1,169 fewer seconds, both statistically significant at conventional levels. An interaction indicates that the income association is more negative for men, while the interaction between male and accrued pension is not statistically significant. The model uses 5,062 observations and the overall Wald test indicates the set of predictors is jointly significant.
Notes: The second column adds time trends before and after the discontinuity compared to Table 5. Only significant job categories are included. Standard error in parentheses. Significance levels: ***p < 0.01, **p < 0.05, *p < 0.1.
Sharp Tobit regression discontinuity for access vs. no access time

Table A2 Long description
The table reports two Tobit regression discontinuity models predicting the dependent variable “Access vs No Access” using age thresholds and demographic, income, pension, and sector controls. In both models, the age 60 threshold is positive and statistically strong, with estimates about 0.206 and 0.266. Only the second model includes an age 63 threshold, which is positive and weakly significant at about 0.134. Age is positive in both models, larger in the first model at about 0.055 and smaller in the second at about 0.031. Male and having a partner are both positive and statistically significant in both models, around 0.264 to 0.265 for male and about 0.173 to 0.174 for partner. Yearly income is slightly negative and weakly significant, while accrued pension is positive and statistically strong, though both are reported as very small per unit. Compared with the omitted sector group, Energy, Municipality, and Police are positive and significant, while Judiciary is negative and significant. The interaction of male with yearly income is near zero, and it is only weakly significant in the second model. Both models use 5,062 observations and have very similar log likelihood values, indicating the added age 63 threshold changes overall fit only slightly.
Notes: The second column depicts a Tobit RDD considering a discontinuity at Age 60 only. The third column also includes a discontinuity at Age 63, capturing an additional discontinuity at Age 63. Only significant job categories are included. Standard error in parentheses. Significance levels: ***p < 0.01, **p < 0.05, *p < 0.1.

 Open access

