


1. INTRODUCTION
The Greenland ice sheet has been losing mass in recent decades in response to climate warming (AMAP, Reference Dahl-Jensen, Bamber, Bøggild, Buch, Christensen, Dethloff, Fahnestock, Marshall, Rosim, Steffen, Thomas, Truffer, van den Broeke and van der Veen2009). The dynamic mass loss from marine outlet glaciers is responsible for approximately half of the mass loss from the Greenland ice sheet (van den Broeke and others, Reference van den Broeke2009). Marine outlet glaciers in Greenland have been observed to retreat during the last decades (e.g. Box and Decker, Reference Box and Decker2011; Howat and Eddy, Reference Howat and Eddy2011). Moon and Joughin (Reference Moon and Joughin2008) reported an increasing retreat rate of marine terminating glaciers from 1992–2000 to 2000–06. Marine terminating glaciers are found to respond dynamically to retreat at the front by thinning and accelerating, since the flow resistance of the glacier is reduced (e.g. Howat and others, Reference Howat, Joughin and Scambos2007; Moon and Joughin, Reference Moon and Joughin2008). Glacier front position is important in controlling the dynamics of the upstream area (Howat and others, Reference Howat, Joughin, Tulaczyk and Gogineni2005; Luckman and others, Reference Luckman, Murray, de Lange and Hanna2006; Nick and others, Reference Nick, Vieli, Howat and Joughin2009).
The observed retreat of the glacier fronts is thought to be a result of the warming climate (Murray and others, Reference Murray2010; Andresen and others, Reference Andresen2012; Carr and others, Reference Carr, Rachel, Vieli and Stokes2013) and marine terminating glaciers are expected to respond quickly to changes in the regional climate due to dynamic processes (Moon and Joughin, Reference Moon and Joughin2008). However, the sensitivity to changes in different climate parameters, such as air and and sea-ice conditions remains unknown (Moon and Joughin, Reference Moon and Joughin2008). Part of the reason is that, the dynamics of marine terminating glaciers are highly modulated by local parameters, such as bedrock topography (e.g. Howat and others, Reference Howat, Joughin and Scambos2007; Khan and others, Reference Khan2013; Carr and others, Reference Carr, Rachel, Vieli and Stokes2013; Csatho and others, Reference Csatho2014) and changes in fjord circulation close to the glacier front (Straneo and others, Reference Straneo2012; Murray and others, Reference Murray2010). If the glacier front retreats behind a point of stability, it may continue to retreat until reaching a new stable position especially if the glacier is retreating down a reverse sloped bed, since the buoyancy of the glacier front will increase during retreat (Howat and others, Reference Howat, Joughin, Tulaczyk and Gogineni2005, Reference Howat, Joughin, Fahnestock, Smith and Scambos2008). Glacier front retreat could also be due to surging or a combination of climatic and dynamic responses (Jiskoot and others, Reference Jiskoot, Juhlin, St Pierre and Citterio2012).
Sea ice or ice mélange (a mixture of sea and calf ice) in the fjords may affect glacier dynamics by providing a buttressing pressure on the glacier front, which can increase resistive back stress suppress calving (e.g. Alley and others, Reference Alley2008; Howat and others, Reference Howat, Box, Ahn, Herrington and McFadden2010; Walter and others, Reference Walter2012). An early breakup of the sea ice or ice mélange in the spring or a late formation in the fall may result in a prolonged calving season (Amundson and others, Reference Amundson2010; Howat and others, Reference Howat, Box, Ahn, Herrington and McFadden2010; Carr and others, Reference Carr, Rachel, Vieli and Stokes2013; Moon and others, Reference Moon, Joughin and Smith2015).
Warm water at the glacier front, especially at depth, may increase underwater melt, undercutting and enhanced calving (e.g. Benn and others, Reference Benn, Warren and Mottram2007; Rignot and others, Reference Rignot, Koppes and Velicogna2010; Chauché and others, Reference Chauché2014). Warm Atlantic water is found below cold polar water from 200 m depth in Greenland fjords, where it enhances melt at the glacier fronts resulting in undercutting and instabilities (e.g. Straneo and others, Reference Straneo2012; O'Leary and Christoffersen, Reference O'Leary and Christoffersen2013; Chauché and others, Reference Chauché2014). Significant correlation has been found between sea surface temperature (SST) and sea-ice conditions in the waters surrounding Greenland (Howat and others, Reference Howat, Box, Ahn, Herrington and McFadden2010; Carr and others, Reference Carr, Rachel, Vieli and Stokes2013) supporting that, warmer ocean surface temperatures affect glacier termini position by impeding local sea-ice development (prolonging the calving season). SST variability could also affect glacier dynamics by raising local air temperatures and thereby increasing surface melt rates (Chelton and Wentz, Reference Chelton and Wentz2005).
Local air temperatures may affect glacier dynamics through several processes. Rising air temperatures lead to increased surface melt, which can increase calving through hydrofracture (e.g. Weertman, Reference Weertman1973) or by thinning of the glacier front, which increases terminus buoyancy and may result in an acceleration followed by further acceleration, increased longitudinal strain rate and increased calving (e.g. Alley and others, Reference Alley2008; Howat and others, Reference Howat, Joughin, Fahnestock, Smith and Scambos2008). Increased surface melt may warm the surrounding glacier ice through sensible and latent heat gain, resulting in increased deformation rates, since the flow law parameter increases with ice temperature (Phillips and others, Reference Phillips, Rajaram and Steffen2010, Reference Phillips, Rajaram, Colgan, Steffen and Abdalati2013). Where meltwater reaches the glacier bed, flow speed will increase due to hydraulic lubrication resulting in dynamic thinning at least until an effective drainage system develops, but the response of ice motion to seasonal surface melt on interannual timescales is uncertain (e.g. Zwally and others, Reference Zwally2002; Shepherd and others, Reference Shepherd2009; Bartholomew and others, Reference Bartholomew2010). Moon and others (Reference Moon2014) suggested that, differences in response of glaciers to changes in surface melt is related to the amount of meltwater present. Discharge of meltwater into the fjord from the bottom of the glacier forms upwelling plumes at the ice-ocean boundary and forces convection in the fjord at the glacier front. Since relatively warm Atlantic water is present at depth in several Greenland fjords (Straneo and others, Reference Straneo2012), a rise in surface melt and thereby runoff can result in enhanced subsurface melt as water is released at the glacier fronts, driving a turbulent heat exchange (Motyka and others, Reference Motyka, Hunter, Echelmeyer and Connor2003; Xu and others, Reference Xu, Rignot, Menemenlis and Koppes2012; Chauché and others, Reference Chauché2014).
The North Atlantic Oscillation (NAO) negative phase NAO results in warm air temperatures in Greenland and vice versa (Hurrell, Reference Hurrell1995; Hanna and Cappelen, Reference Hanna and Cappelen2003). Negative NAO index is associated with an increase in the temperature of both intermediate and deep water (Sarafanov, Reference Sarafanov2009). The NAO is therefore an important indicator of large-scale climatic conditions in Greenland.
In this study, interannual area change ΔA y at 42 Greenland marine terminating glaciers (Fig. 1) were measured from 1999 to 2013 using optical satellite imagery. To illuminate possible physical processes ΔAy series are compared with SST, SIC, melt season intensity, Northern Hemisphere (NH) temperature, the NAO index, latitude and glacier width. Correlations are calculated for temporally detrended and normalized glacier ensembles to test if there is a population response to climate given recognition that individually glacier sensitivity may be dominated by local properties, such as bedrock topography or surge behaviour. Hypotheses are offered consistent with apparent climate sensitivities.
Map illustrating the position of the measured glaciers. The lines dividing Greenland into four analysed regions are placed at 72° north and 44° west. Upernavik is measured as six seperate glaciers, Ikertivaq is measured as four seperate glaciers.

2. DATA AND METHODS
2.1. Glacier area changes
Area changes were measured by manually digitizing the glacier fronts using optical imagery. Imagery are summarized in Table 1. Yearly area changes were measured since the launch of Landsat 7 in 1999 due to a higher number of available images, until 2013. While the satellites have a 16 d coverage period, fewer ASTER data were available since its footprint is smaller.
Overview of used imagery

Images used to help with banding, clouds etc. are not counted. Color images from Landsat 7 and 8 are Natural Look images from http//eartexplorer.usgs.com and the ASTER imagery are Terra Look images provided by Rapid Ice Sheet Change Observatory from NASA (RISCO, http// www.rapidice.org). Single band images are obtained through RISCO from USGS.
ΔAy was measured as in other recent studies (e.g. Moon and Joughin, Reference Moon and Joughin2008; Box and Decker, Reference Box and Decker2011; Schild and Hamilton, Reference Schild and Hamilton2013), measuring the area of digitized polygons relative to an arbitrary reference line upstream of the calving front line (see Fig. 2). Measuring polygon area instead of changes along a central flow line accounts for uneven front shape changes.
Example of annual Helheim glacier terminus area changes relative to an arbitrary reference line (black). The base image is from Landsat 7, 19 August 2007.

In 2003 the Scan Line Corrector (SLC) on Landsat-7 Enhanced Thematic Mapper Plus (ETM+) failed resulting in bands of missing data in all images. If a selected image has thin bands crossing the glacier front, they are crossed in a straight line. If the bands are broader and especially if they are parallel with the terminus, other images of the glacier within a few weeks are checked to get a better approximation of the front position. Along with the measurements of the area changes the glacier widths were measured once for each glacier in order to estimate effective front position change. When possible the width of the glaciers was measured in a straight line close to the front. If it is not sensible to define glacier width using a straight line, for instance if a measured glacier consists of two fronts, 2–3 straight lines were used to measure the width. A glacier is measured as one if at some point during the measurement period it had one single front or if only a small island breaks the front in two. An average width value was used in cases the glacier width close to the front changed significantly during the measurement period.
In order to achieve an estimate of digitization error, glacier areas were digitized twice for a subset of five of the studied glaciers (Sermilik, Helheim, Daugaard-Jensen, Upernavik E and Steenstrup) in all 14 a (1999–2013). For each yearly measurement, the same satellite image of the glacier was used. The second manual digitization was made at least 3 weeks after the first to make sure nothing specific was remembered from the first interpretation. Measuring the glacier areas twice with some weeks in between yields similar RMSD to that for two different interpreters and can be used to estimate the digitization error (Paul and others, Reference Paul2013). The five uncertainty test glaciers cover a variety of widths, locations and image qualities. The average of the RMSD of all years calculated for each glacier was between 0.07 and 0.23 km2 with an average of 0.13 km2. The RMSD is sensitive to the quality of the images degraded by thin clouds, shadows and striping (Landsat 7). The presence of an ice mélange at the front can also complicate the digitization, especially on foggy images.
In order to measure the area changes accurately, it is important that the images are co-registered. Problems with co-registration are more common when different sensors are used and are corrected by choosing a list of visible stationary tie points on both images and using an ENVI software warp function. This process of correction works very well for a spatially constant shift but a distortion of up to three 15 m pixels must be accepted, consistent with Howat and others (Reference Howat, Box, Ahn, Herrington and McFadden2010). In total 35 images were corrected for a constant shift, 21 ASTER and 14 Landsat. The size of this error is estimated as 0.4 km2 by calculating the error from a constant shift of three 15 m pixels on a glacier with average width (9.1 km).
Recognizing seasonal retreat (e.g. Howat and others (Reference Howat, Box, Ahn, Herrington and McFadden2010)), it is important each year to use images as close to minimum seasonal front position as possible to get a consistent measurement. However, there are some days and sometimes several weeks between two scenes of the same glacier. Schild and Hamilton (Reference Schild and Hamilton2013) measure the front position of five marine terminating Greenland glaciers and find that the timing of the minimum front position of a given glacier can vary up to 2 months from year to year and in a few cases a minimum extent is not well defined. In order to choose the image best representing maximum possible seasonal retreat, the front position of all scenes from 1 July and onward was compared and the image where the front was the furthest back was chosen. For the northernmost glaciers June imagery is checked as well, since they were in general found to reach minimum extent earlier in the season. In most cases, there is an image every 1–2 weeks through most of the melt season, but in some cases fewer images are available. In this study, 1.6% of the used images are from July, 8.6% are from June, 40% are from August, 41.4% are from September, 7.8% are from October and 0.5% are from November. It is estimated that in the case of sufficient imagery the error, due to the image not being from exactly the time of minimum extent, is within 1 km2. If the last scene is recorded early in the melt season compared with the date of minimum front position any subsequent loss will not be measured and the error can potentially be large. Image availability is thus expected to be the dominant error in the area change measurement.
The analysed glaciers are all marine terminating outlet glaciers from the Greenland ice sheet with a width of at least 1 km. We have chosen glaciers distributed surrounding the island (Fig. 1). We make a quadrant division to assess possible regional sensitivities. Four regions were chosen in order to have a reasonable sample size within each region. The boundaries were defined by 72° north and 44° west. This separates the southwestern (SW) and southeastern (SE) glaciers, which are generally located at the head of fjords from the northwestern (NW) and northeastern (NE) glaciers. The Daugaard-Jensen is here grouped with the SE glaciers though it is located much further from the sea than the other SE glaciers since the alternative would be to group it with the NE glaciers, which are all outlets from the East Greenland Ice Stream.
2.2. Climate
Daily SST grids were obtained from February 2000 to December 2013 from the Physical Oceanography Distributed Active Archive Center at the NASA Jet Propulsion Laboratory (http://podaac.jpl.nasa.gov) from NASA's Terra MODIS L3 4.88x km resolution MOD28 product. For each year seasonal average SST grids were generated for the period from July to September excluding cloudy or sea ice covered pixels. Our investigations show that, in general, clouds occur south of 65°N with up to 50% of the days affected along the southern margin of the region. Further north there are fewer days lost due to cloud cover. There are two periods with no data: 7–17 August 2000 and 1–2 July 2001.
Monthly sea-ice concentration (SIC) grids were obtained from the National Snow and Ice Data Center (NSIDC) on a 25 km grid (Comiso, Reference Comiso2000) from passive microwave radiometers operating since 1978. The data are used as a general indicator of the length of the sea-ice season in the oceans surrounding Greenland, since it is not possible to estimate the timing of the breakup of the sea ice in individual fjords due to the resolution of the data. For each year seasonal average SIC grids were calculated for the March–June period. There are no gaps in the dataset for the time period of this study. A 25 km resolution does not allow for information about the presence of sea ice in individual fjords.
Melt season intensity was estimated using positive degree days (PDDs) by summing the daily average temperature of all days, where mean daily temperature is above 0°C. For each year PDD grids for June – September were calculated using 2 m surface air temperatures from the regional climate model HIRHAM5 (Christensen and others, Reference Christensen, Drews, Christensen, Dethloff, Ketelsen, Hebestadt and Rinke2007). Lucas-Picher and others (Reference Lucas-Picher2012) validated HIRHAM5 against observed 2 m temperatures and found a bias within 2°C for summer near surface temperatures.
Average values of NH land air temperature (Jones and others, Reference Jones2012), SST (Kennedy and others, Reference Kennedy, Rayner, Smith, Parker and Saunby2011a, Reference Kennedy, Rayner, Smith, Parker and Saunbyb) and combined surface temperature (Morice and others, Reference Morice, Kennedy, Rayner and Jones2012) were downloaded from the Climate Research Center at University of East Anglia (http://www.cru.uea.ac.uk/cru/data/temperature/).
Monthly values of the NAO index were retrieved from the National Weather Service, NOAA (http://www.cpc.ncep.noaa.gov/products/precip/CWlink/pna/nao.shtml).
In order to investigate the sensitivity of the glaciers to different climate parameters, regional maps of the correlation were calculated for SST, SIC and melt season intensity. The correlation was calculated between the standardized, detrended, average yearly area change of all measured glaciers, ΔAy,av , and the time series of the each climate parameter at all grid cells. The standardized area changes are calculated as:
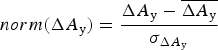 $$norm(\Delta {A_{\rm y}}) = \displaystyle{{\Delta {A_{\rm y}} - \overline {\Delta {A_{\rm y}}}} \over {{\sigma _{\Delta {A_{\rm y}}}}}}$$
where ${\sigma _{\Delta {A_{\rm y}}}}$
is the standard deviation of the yearly area changes of the glacier and
${\sigma _{\Delta {A_{\rm y}}}}$
is the standard deviation of the yearly area changes of the glacier and $\overline {\Delta {A_{\rm y}}} $
is the average of ΔA
y for the glaciers. The area changes are standardized in order to prevent the glaciers with high area changes from dominating ensemble averages. Before correlation both area changes and climate data were temporally de-trended to minimize spurious correlation. At each grid cell the confidence of a non-zero correlation was calculated using a Student's t test. Throughout the study, significance is determined using a Student's t test with a significance limit of 95%.
$\overline {\Delta {A_{\rm y}}} $
is the average of ΔA
y for the glaciers. The area changes are standardized in order to prevent the glaciers with high area changes from dominating ensemble averages. Before correlation both area changes and climate data were temporally de-trended to minimize spurious correlation. At each grid cell the confidence of a non-zero correlation was calculated using a Student's t test. Throughout the study, significance is determined using a Student's t test with a significance limit of 95%.
3. RESULTS
The net area change for the entire survey period for each glacier, ΔA net , summed for all 42 glaciers exceeds −1600 km2 equivalent to an annual rate of −114 km2 a−1. The average individual glacier area change is −2.83 km2. Thirty-five of the glaciers retreated and seven showed no discernible change (ΔA net < 1 km2), while none of the measured glaciers advanced (Table 2). The average effective length change for the 14 a period (area change divided by width) is −3.4 km or −240 m a−1. Petermann had the largest ΔA net for the survey period (−371 km2) and a front retreat of 21 km. The cumulative average area change, ΔA cum,av (red line), together with the cumulative area change of the individual glaciers, ΔA cum (grey lines), appears in Figure 3.
Average cumulative area change (red line) and cumulative area change of the individual glaciers (grey lines).

List of measured glaciers with total area change, average yearly area change and width

A significant negative correlation between glacier width and ΔA net of −0.54 indicates that the wide glaciers generally have a larger area loss. However, no significant correlation was found between effective length change and glacier width suggesting that the correlation is simply due to the glacier being wider, not because wider glaciers retreat more quickly.
A significant correlation of −0.52 was found between ΔA net of each glacier and its latitude indicating that the glaciers further north generally have larger area changes than the southern glaciers. However, the correlation between latitude and net front retreat was insignificant and a significant correlation of 0.51 between glacier width and latitude indicate that the correlation between latitude and ΔA net may be mainly due to the northern glaciers being wider than the southern glaciers. The northern glaciers have an average width of 16.0 km, while the southern glaciers have an average width of 4.5 km.
A significant correlation of −0.66 is found between the average chosen day of minimum retreat found for each glacier and the latitude of the glacier, indicating that the southern glaciers retreat later into the year than the northern glaciers. On average the southern glaciers retreat 14 d later into the year than northern glaciers. Images are normally available for the southern glaciers later in the year than northern glaciers due to the need of sunlight for the visual range imagery, but also for the northern glaciers images were usually available later in the season than the day of the chosen minimum extent image. If the five northernmost glaciers (with limited image availability) are excluded, a significant correlation of −0.40 is found indicating that the correlation is not solely due to the availability of images.
3.1. Within sample correlations
For each glacier the time series of ΔAy is correlated with the average normalized yearly area changes of all the other glaciers, $\Delta {\tilde A_{{\rm y},av}}$
, as well as all the other glaciers in the same region (see Fig. 1). For the comparison with all other glaciers, the correlation is in most cases poor with an average of 0.18 and 13 out of 42 glaciers having a negative correlation with the normalized average. If the correlation is calculated for ΔA
cum
the average correlation is high (0.81). This indicates that most of the glaciers have the same trend during the period.
$\Delta {\tilde A_{{\rm y},av}}$
, as well as all the other glaciers in the same region (see Fig. 1). For the comparison with all other glaciers, the correlation is in most cases poor with an average of 0.18 and 13 out of 42 glaciers having a negative correlation with the normalized average. If the correlation is calculated for ΔA
cum
the average correlation is high (0.81). This indicates that most of the glaciers have the same trend during the period.
The histograms of Figure 4 illustrate the within-population correlation for each of the four regions. There is in general a positive correlations with the average area changes of the other glaciers within the SE region but not for the other regions. The SE glacier with a negative correlation with the rest of the sample is Daugaard-Jensen, which is located deeper in a fjord and further north than the other glaciers in the region and thus may be subject to different oceanic conditions.
Histograms of correlation coefficient between the yearly area change of one glacier and the average normalized area change of the other glaciers in the same region. There is a total of 14 glaciers in the northwest region, three in the northeast region, 15 in the southwest region and 10 in the southeast region.

A correlation of −0.06 is found between the internal correlation of two glaciers and their separation distance. Thus glaciers with close proximity do not have a similar terminus area change variability, consistent with e.g. Khan and others (Reference Khan2013) and Csatho and others (Reference Csatho2014).
3.2. Climate correlations
No significant correlation is found between ΔAy,av and PDD (Fig. 5). For SST a significant negative correlation is found along the SE coast and the southernmost west coast, associating higher SSTs with enhanced glacier front retreat. Areas of significant positive correlation between SIC and ΔAy,av are found along the east and southeast coasts indicating that the presence of sea ice reduces glacier retreat during the melt season.
Maps of correlation with confidence above 95% for the comparison between the normalized average area change of all studied glaciers and the three climate parameters.

Significant correlations between regional (Fig. 1) de-trended average normalized area changes and SST, SIC and PDD are illustrated in Figure 6. A significant negative correlation is found between ΔAy,NW and PDD associating shrinking of the NW glaciers with increased surface melting. No significant correlation with PDD was found for the other regions. For SST, a negative correlation pattern is evident between SST and both ΔAy,SE and ΔAy,SW indicating that the southern glaciers tend to shrink when SST is high. No significant correlation is found for the northern glaciers. Regions of significant positive correlation are found between SIC and ΔAy,SE indicating that the glaciers in this region may be sensitive to the presence of sea ice as well as SST. For the NW glaciers a significant positive correlation is found in Baffin Bay and in the Arctic Ocean north of Greenland at some distance from the coast indicating that the presence of sea ice in those regions may be related to the seasonal retreat of the glacier fronts. No significant SIC sensitivity patterns are found for the NE and SW glaciers.
Maps of correlations with confidence above 95% for the comparison between the normalized average area change of the glaciers from each region and the three climate parameters.

A significant negative correlation is evident between ΔAy,NW and average NH land temperature and between ΔAy,SE and average NH SST, both in summer (July–August) (Table 3). Hence, the NW glaciers tend to retreat when hemispheric temperatures over land are high and the SE glaciers tend to retreat when the hemispheric SSTs are high.
Correlation coefficients and confidence for comparisons of average area change with Northern Hemisphere temperatures

Comparisons are with average of all glaciers when no region is defined.
Lastly the correlation was calculated with the yearly average summer (July–August) and winter (December–February) NAO index (Table 4). A significant positive correlation was found between ΔAy,SW and winter NAO indicating that a negative phase NAO (higher air and ocean temperatures) is associated with enhanced seasonal retreat of the SW glacier fronts and vice versa.
Correlation coefficients and confidence for comparisons of average area change with NAO

Comparisons are with average of all glaciers when no region is defined.
4. DISCUSSION
A complex climate sensitivity signal is evident in correlations between regional average area changes of the glaciers and SST, SIC, PDD or NH temperature.
For the NW glaciers a significant correlation with melt season intensity is evident 6. Since the correlation with SST and SIC close to the coast is weak, it seems unlikely that the correlation is a result of air temperatures affecting these parameters. Our findings indicate a strong negative correlation between melt intensity below 1200 m a.s.l. and area change. We suggest the signal may be due to some combination of melt water reaching the bed (Alley and others, Reference Alley2008), forced convection in the fjord due to the release of meltwater at the bottom of the glacier at the ice/ocean interface leading to increased subsurface melting (Motyka and others, Reference Motyka, Hunter, Echelmeyer and Connor2003), or hydrofracture at the glacier front leading to increased calving rates (Weertman, Reference Weertman1973). There is also some positive correlations with SIC in Baffin Bay and the ocean north of Greenland. The region of significant correlation with SIC is not adjacent to the coast suggesting an indirect influence. One may posit that the correlation with SIC for this region is related to sea ice in those areas affecting the temperature of the air masses reaching the coast with the presence of sea ice leading to colder air masses at the coast or with some other climate factor influencing the glaciers. The NW glaciers may be sensitive to subsurface ocean temperatures as well, since SST may simply not be an appropriate indicator of subsurface temperatures for this region. A significant correlation was found between ΔAy,NW and the NH land air temperature in summer, supporting that the glaciers in this region may be sensitive to air temperature and surface melt.
The asynchronous behaviour of the NW glaciers may be related to the strong correlation with surface melt, since lubrication at the bed and subglacial discharge depend strongly on the drainage system, which depends on local bed topography and ice thickness. Thus subglacial discharge may vary between the glaciers due to local factors and lead to different subsurface melting rates as explained above and asynchronous behaviour. A strong correlation with PDD is found even though the within-sample correlation in the region is very poor, indicating that the average of an ensemble of glaciers may allow a climate sensitivity signal to emerge from a sample of glaciers otherwise strongly modulated by local conditions.
For SE Greenland significant correlation was found between ΔAy,SE and both SIC and SST, while correlation with melt season intensity is weak for this area 6. The time of year of the investigated correlations with SIC and SST are different, indicating that the mechanisms responsible for the correlations may be different. Murray and others (Reference Murray2010) measured front retreat at 15 southeast Greenland glaciers and argue for a connection between SST and front retreat. They suggest a physical process for the retreat, where warm water is coming into contact with the glacier fronts enhancing melt. However, the temperature of the subsurface water is dominant in determining the submarine melt at the front of the marine outlet glaciers (O'Leary and Christoffersen, Reference O'Leary and Christoffersen2013). The correlation with SST for the SE (and SW) glaciers is located where the East Greenland Current (EGC) flows from the north to meet the warm Atlantic water of the Irminger Current (IC) (Murray and others, Reference Murray2010). While we did not find published evidence of a relationship, we hypothesize that the strong correlation with glacier area change in this region may be due to SST being an indicator of the strength of the EGC and thereby the transport of cold water to the area. We further hypothesize that a weakened EGC may result in more warm Atlantic water in the fjords, enhancing melt and undercutting of the glacier front. A connection between SST and deeper ocean temperatures in the region is consistent with Murray and others (Reference Murray2010) reporting that the positive temperature anomaly found at depth in 2003 in Southeast Greenland fjords is part of a pattern of increased SST. A possible effect of SIC could be that the timing of the breakup of the sea ice is a factor promoting the seasonal onset of calving and prolonging the calving season.
ΔAy,SE was found to correlate significantly with the NH summer SST supporting that the glaciers in this region tend to retreat when SST is high. The area changes of the SE glaciers were more synchronous than other regions consistent with Luckman and others (Reference Luckman, Murray, de Lange and Hanna2006); Howat and others (Reference Howat, Joughin, Fahnestock, Smith and Scambos2008); Murray and others (Reference Murray2010). We suspect it is due to a strong oceanic forcing by the EGC and IC.
For the SW glaciers, significant negative correlation is found with SST, while correlations with melt season intensity and SIC are insignificant. We posit that SSTs are connected to submarine melt and the strength of the EGC, but it could also be that the correlation with SSTs is indirect. A significant correlation with the NAO was found for the SW glaciers. It could be due to the influence of the NAO on air temperatures being largest in Southwest Greenland (Box, Reference Box2002; Hanna and Cappelen, Reference Hanna and Cappelen2003). However, the SW glaciers do not seem to be sensitive to air temperatures and thus the correlation with NAO could be a result of a connection between NAO and the temperature of intermediate and deep water (Sarafanov, Reference Sarafanov2009).
The area changes of the SW glaciers are generally asynchronous. We suspect it may be due to large differences in the ability of warm Atlantic water to reach the glacier fronts or to forced convection due to discharge of meltwater into the fjord at a few of the glaciers though on an average there is no strong correlation with PDD.
For the NE glaciers, little correlation is found between area change and either SST, SIC or surface melt. Khan and others (Reference Khan2013) finds some connection between the retreat of the NE glaciers and air temperature and sea ice. However, only three NE glaciers are surveyed in this study and thus the statistical sample may well be too small to represent population behaviour.
5. CONCLUSIONS
In this study, the front area changes at 42 Greenland marine terminating glaciers (Fig. 1) were measured annually from 1999 to 2013 using optical satellite imagery. Thirty-five of the 42 measured glaciers were found to be retreating during the period while seven remained stable. The total area loss for all glaciers exceeded 1600 km2, equivalent with a total rate of area change of 114 km2 a−1. The individual glacier average area change was −2.83 km2 a−1 equivalent with an effective retreat rate of 240 m a−1. Interannual area changes are compared. Few of the glaciers’ interannual variability correlated, supporting that calving rates are strongly modulated by local factors.
For SE glaciers, however, a correlation suggests a regional climate sensitivity. A significant correlation of −0.66 was found between the average day of year of the chosen images and the latitude of the glacier suggesting climate sensitivity on calving, possibly from some combination of surface melting promoting hydrofracture, the destabilizing of sea ice buttressing by melting, if not also the effect from sea ice on fjord circulation from wind stress. Future work should include process studies testing the relative importance of these factors. The average area changes of the SE glaciers, ΔAy,SE , exhibit a significant correlation with both SST and SIC. A significant correlation was found with NH summer SST supporting that the dynamics of the glaciers in SE Greenland tend to retreat when SST is high. The area changes of the NW Greenland glaciers were found to have a strong correlation with inland ice sheet surface melting and Northern Hemispheric air temperatures. For the SW glaciers a significant area change correlation is evident for SST only. A significant correlation was found with the NAO index. Since the area changes of the SW glaciers are not found to be sensitive to surface melt, we suggest that the correlation may be related to NAO affecting the temperatures in the intermediate and deep ocean (Sarafanov, Reference Sarafanov2009). No significant correlations were found between SST, SIC and PDD for the NE glaciers, possibly due to an insufficient sample size and difficulties digitizing glacier fronts in that region.
The dynamics of marine terminating outlet glaciers in Greenland are found to respond interannually to climate even though, in most cases, individual glacier area changes are inconsistent. The sensitivity to different climate parameters is found to depend strongly on glacier location. The significant correlations with climate leads us to suggest that a climate sensitivity of marine terminating glaciers can be found when investigating regional glacier ensembles even though the dynamics of the individual glaciers are dominated by local climate.
ACKNOWLEDGEMENTS
The project was supported by collaboration between The Geological Survey of Denmark and Greenland (GEUS) and University of Copenhagen's Center for Ice and Climate (CIC). This work was supported by European Research Council Advanced Grant No. 246815, Water Under the Ice. We thank Ruth Mottram and Jens H. Christensen at the Danish Meteorological Institute for providing HIRHAM5 data for the calculation of the melt season intensity. We thank two anonymous reviewers for constructive critique.


 Open access

