


1. Introduction
From a market perspective, tea is not just a cultural staple but also a lucrative global commodity. This significance is clearly reflected in Taiwan, where, according to the Ministry of Economic Affairs (2023), tea beverages generated about NT$18.8 billion in production value. This figure positions tea as the leading product in non-alcoholic beverage market (surpassing mineral water, fruit and vegetable juices, and carbonated drinks) and accounts for roughly one-third of that market’s total value. Behind this market success is a robust domestic industry: Taiwan’s tea cultivation spans 12,192 hectares and yields approximately 14,027 metric tons annually (Lin and Su, Reference Lin and Su2023). Given tea’s importance as a key economic crop, understanding what drives its price is crucial for developing policies that support tea growers’ livelihoods. By examining these price determinants, tea producers can craft targeted initiatives to reinforce sustainable farming practices, stabilize incomes, and enhance the competitiveness of local tea producers.
Globally, tea production has grown substantially over the past decade. According to the Food and Agriculture Organization of the United Nations (2022), world tea output reached approximately 6.3 million metric tons in 2020, up from about 4.3 million tons in 2008. The global tea market is correspondingly large, valued at tens of billions of USD annually (with some estimates projecting it to exceed $100 billion by the mid-2020s) (Statista, 2023). Major producer countries, including China, India, Kenya, Sri Lanka, and Vietnam, dominate global supply and export volumes (International Trade Centre, 2021). By contrast, Taiwan is a relatively small tea producer (around 14 thousand tons in 2021, well under 1% of global output) (Lin and Su, Reference Lin and Su2023). Nevertheless, Taiwan occupies a distinct niche in the world tea economy through its premium specialty teas. In particular, Taiwanese high-mountain teas, cultivated in the island’s unique mountainous microclimates, are internationally renowned for their quality. This niche focus on high-quality teas allows Taiwan to exert an influence on premium tea markets that outstrips its volume share.
Nationally, the tea industry constitutes a relatively small but culturally significant segment of Taiwan’s beverage and agricultural sector. For instance, its direct contribution to overall GDP is modest (well below 1%), yet it remains important in certain rural economies. Over the past decade, Taiwan’s annual tea production has hovered around 14–15 thousand metric tons, with a slight declining trend in recent years (e.g., from roughly 15 thousand tons in 2010 to about 14 thousand tons in 2021) (Lin and Su, Reference Lin and Su2023). Export values have correspondingly been stable, on the order of NT$3–4 billion (approximately US$100–130 million) per year (Ministry of Economic Affairs, 2023). These longitudinal trends suggest a mature industry with stable output and trade performance. Regarding market orientation, Taiwanese tea caters to both domestic and international markets. A significant portion of premium tea is exported; for example, about 60–65% of Taiwan’s tea volume was exported in 2021, valued at around US$110 million (International Trade Centre, 2021), while the remaining production supplies domestic consumers and supports a vibrant local tea culture.
Taiwan’s tea cultivation is geographically concentrated across several well-recognized regions. The central highlands, such as Alishan (Chiayi) and Lishan (central Taiwan), are renowned for producing premium high-mountain oolong teas in smaller quantities but with distinctive sensory profiles. Lower-elevation areas in the north (e.g., Pinglin in New Taipei) and parts of the central/southern counties contribute larger volumes across varieties including Baozhong, oolong, and black tea. Importantly, market prices systematically differ by growing environment: teas originating from higher elevations tend to command substantial premiums relative to valley-grown counterparts due to cooler climates, slower leaf growth, and associated quality attributes (Chen, Reference Chen2007; Wang et al., Reference Wang, Liang, Ko and Lin2022b). This regional and altitudinal heterogeneity underpins our empirical design and motivates the inclusion of both region of origin and elevation as key determinants in our further analysis.
The value of tea is significantly shaped by its place of origin, with regional distinctions playing a crucial role in determining market price. Various factors contribute to tea pricing, including natural elements such as climate, soil composition, elevation, and weather conditions, as well as human factors like cultivation techniques, processing methods, and local expertise. To enhance the competitiveness of local tea and support producers, agricultural authorities have introduced certifications for traceable agricultural products and regional trademarks (Tsai and Su, Reference Tsai and Su2013). These initiatives aim to establish clear differentiation among tea varieties based on their unique regional characteristics.
Despite the evident impact of production area on tea quality and market positioning, limited research has systematically examined the direct relationship between production area attributes and tea prices. This gap in the literature highlights the need for a deeper understanding of how production areas, production conditions, and certification factors shape the valuation of tea in the market. This study aims to bridge this gap by explicitly examining the factors that influence tea prices, providing a more holistic understanding of the mechanisms shaping the tea market.
This study utilizes a unique administrative census dataset, the Tea Manufacturing Factory Operation Survey conducted in 2019, which provides comprehensive information on 2,214 individual tea products and 1,340 tea factories. Using this detailed dataset, we address the following questions: 1) What factors drive tea prices? 2) How does production area heterogeneity influence tea price determinants? 3) What role does elevation play in shaping tea prices? To explore these questions, we apply the hedonic price model to analyze the influence of tea production factors and other characteristics on market prices. Our analysis identified several key factors influencing tea prices, including regional origin, type of tea, production conditions, and certifications. Besides, we specifically focus on elevation due to its high-mountainous growth conditions and constrained production quantities (Chen, Reference Chen2007).
The rest of this paper is organized as follows. Section 2 discusses factors that affect price of tea, as well as local tea production areas, types, and certifications. Section 3 details the data sources and econometric approach applied in this study. Section 4 presents the results of the analysis, examining how production area, tea types, production factors, and certifications influence tea prices. Finally, Section 5 concludes the paper by summarizing key findings and suggesting implications for tea farmer and local authority.
2. Literature
2.1. Factors affecting the price of tea and other economic crops
Tea prices can vary widely due to differences in terroir (soil and climate conditions), plant varieties, and complex processing methods that influence quality. Many earlier studies focused on long-term price movements and market efficiency in tea rather than on specific quality-related price determinants. For instance, Dharmasena (Reference Dharmasena2003) compared forecasting models and found that a simple random walk performed as well as more complex approaches for predicting tea prices, suggesting that tea markets might be weak-form efficient. Dang and Lantican (Reference Dang and Lantican2011) examined international tea market integration and noted that current prices are significantly influenced by lagged price movements, indicating strong temporal linkages in price formation. Viknesh (Reference Viknesh2011) similarly applied a Vector Autoregression (VAR) model to forecast Sri Lankan tea auction prices. Krishnarani (Reference Krishnarani2013) explored the role of climatic and regional factors in tea price volatility (e.g., rainfall, drought, pest outbreaks) but obtained mixed results without clearly isolating which factors dominate. While these works improved the understanding of tea price dynamics, they did not identify the intrinsic or extrinsic attributes of tea that drive price differences at a given point in time. This highlights a gap in the literature regarding granular price determinants for tea.
Another strand of research has started examining the intrinsic quality attributes and extrinsic cues that could shape tea prices. Padamali and Fernando (Reference Padamali and Fernando2016) found that consumers are willing to pay a premium for Ceylon tea mainly due to factors signaling quality – such as the quality of fresh leaves, specific manufacturing processes, and certifications of origin. Chiu (Reference Chiu1990) documented that key elements influencing the quality (and thus value) of tea include the cultivar of the tea plant, the elevation at which it is grown, the degree of fermentation, and other processing techniques. In addition to these natural and processing factors, Haq et al. (Reference Haq, Shahbaz and Boz2020) emphasized that production conditions (soil management, use of inputs) and human factors (skilled labor in plucking and processing) affect the costs and output of tea, thereby indirectly influencing its market price.
More recently, researchers have begun using innovative analytical methods to link measurable attributes to tea pricing. For example, Wang et al. (Reference Wang, Feng, Liu, Li, Zhang and Zhang2023) employed near-infrared spectroscopy combined with multivariate analysis to predict the purchase price of a famous green tea (Enshi Yulu), demonstrating that objective quality indicators can have a strong, quantifiable correlation with market price. Likewise, Yang et al. (Reference Yang, Chen, Lin, Zhou and Wang2021) conducted a choice experiment on oolong tea and found that Chinese consumers place significant value on extrinsic quality cues, particularly organic certification labels, which substantially increased consumers’ willingness to pay.
In parallel, there is also a growing body of research applying advanced machine learning (ML) techniques to hedonic pricing models in agricultural markets, aiming to capture more complex attribute–price relationships than traditional linear methods. For instance, Brentari et al. (Reference Brentari, Zuccolotto and Levaggi2011) applied a random forest approach to Italian red wines, revealing that latent sensory and chemical quality factors carried appreciable implicit values in explaining price. Similarly, Niklas and Rinke (Reference Niklas and Rinke2020) showed that a machine-learning-based hedonic model achieved slightly higher explanatory power than a conventional log-linear regression in German wines, highlighting additional determinants such as nuanced alcohol effects across categories. These methodological advances underscore that while our study employs a traditional econometric hedonic framework, we recognize the potential of ML-based approaches to improve predictive accuracy and capture non-linear attribute effects, which represents a promising avenue for future tea research.
One well-established approach to disentangle price determinants is the hedonic pricing model, which explains a product’s price as the sum of implicit values of its attributes. This framework, originating from Lancaster’s consumer theory and formalized by Rosen (Reference Rosen1974), has been widely applied to agricultural and food products to quantify the value of both tangible and intangible quality attributes. Hedonic price analysis has evolved over time, expanding from simple models of a few attributes to more complex specifications incorporating sensory ratings, certifications, and producer characteristics. Wine is perhaps the most extensively studied product using this method. Núñez et al. (Reference Núñez, Martín-Barroso and Velázquez2024) provide a recent systematic review of hedonic price studies in the wine market, highlighting that the methodological choices, such as which attributes are included, how the product market is defined, data sources, and the econometric techniques, can significantly affect a model’s explanatory power. They propose a hierarchical classification of wine attributes: (i) objective attributes (e.g., grape variety, vintage, alcohol content), (ii) quality and reputation signals (e.g., expert scores, appellation status), and (iii) factors related to production and market environment (e.g., brand reputation, winery size, economic conditions). This mirrors the evolution of hedonic models to include not only product-intrinsic traits but also external reputation and market context factors. Empirical findings in the wine literature consistently show that certain attributes command price premiums. For example, wines from renowned regions or with prestigious appellations and higher expert ratings tend to fetch higher prices (Angulo et al., Reference Angulo, Gil, Gracia and Sánchez2000; Carew and Florkowski, Reference Carew and Florkowski2010).
In an emerging wine market context, the relative importance of attributes can differ: Romo-Muñoz et al. (Reference Romo-Muñoz, Monje-Sanhueza, Garrido-Henríquez and Gil2020) examined bottled wine prices in Chile and found that objective quality signals such as national and international quality awards have a greater impact on price than terroir-based attributes like specific region of origin. They suggest this is because Chilean consumers, in a younger market, rely more on visible quality certifications, whereas traditional attributes (e.g., vineyard location or valley designation) showed little or even negative price effect until the market matures. Their study also showed that firm-level business strategies (branding, distribution, etc.) significantly influence prices, underlining that beyond product characteristics, supply-side strategies can shape market values.
To provide conceptual clarity, it is useful to distinguish between intrinsic and extrinsic attributes of tea. This distinction later informs our hedonic framework (see Section 3.2). Intrinsic attributes refer to the inherent qualities or physical characteristics of the tea itself, such as the tea variety (cultivar), the degree of fermentation or oxidation, leaf grade and appearance, aroma profile, and other chemical or sensory properties that arise from the tea’s growing conditions and processing methods. Extrinsic attributes, in contrast, encompass external factors related to how the product is presented or perceived, including the region of origin (for instance, a high-mountain locale versus a lowland area), any certification labels (e.g., organic or geographical indication of origin), brand reputation, and packaging or other marketing information.
Hedonic pricing research on other high-value crops and foods further illustrates how diverse attributes influence prices. In specialty coffee auctions, studies have found that sensory quality scores, origin (country or region), variety of coffee bean, farm size, and even lot rankings are key determinants of price premiums (Donnet et al., Reference Donnet, Weatherspoon and Hoehn2008; Teuber and Herrmann, Reference Teuber and Herrmann2012; Wilson et al., Reference Wilson, Conley, Harris and Lafone2012; Wilson and Wilson, Reference Wilson and Wilson2014). For cacao (and its derivative, chocolate), Bedell and Reed (Reference Bedell and Reed2017) showed that certain flavor attributes (e.g., presence of fruit or nut flavor notes) yield different price premiums, while Villacis et al. (Reference Villacis, Alwang, Barrera and Dominguez2022) demonstrated that bean variety and post-harvest processing characteristics (such as fermentation methods) significantly affect cacao bean prices. Rousseau and Vranken (Reference Rousseau and Vranken2013) specifically examined organic labeling in chocolate and found that an “organic” claim positively influenced consumer choice, reflecting a willingness to pay more for organic chocolate. In the olive oil market, numerous hedonic analyses have identified both product attributes and branding factors that drive prices. Karipidis et al. (Reference Karipidis, Tsakiridou and Tabakis2005) reported that packaging size and label information are important in the Greek olive oil market, with smaller bottles often commanding higher unit prices. Carlucci et al. (Reference Carlucci, De Gennaro, Roselli and Seccia2014), analyzing Italian extra-virgin olive oils sold online, found that the presence of a Protected Designation of Origin (PDO) certification was the most influential quality attribute boosting price premiums. Cabrera et al. (Reference Cabrera, Arriaza and Rodríguez-Entrena2015) observed in the Spanish market that clearly indicating olive variety or a low acidity level on the label, as well as carrying a regional quality seal (such as Andalusia’s quality certification), were associated with significantly higher prices. Conversely, that study and others noted that olive oils sold under private retailer labels or in plastic packaging tend to have lower prices, indicating consumers discount those attributes. Interestingly, Romo-Muñoz et al. (Reference Romo Munoz, Lagos Moya and Gil2015) found that even within the “extra virgin” category, imported olive oils with slightly higher free acidity levels obtained higher prices in Chile – a counterintuitive result possibly because acidity was linked with certain desirable flavor profiles or because imported brands with higher acidity had other prestige factors. These examples demonstrate the broad applicability of hedonic models in revealing how both intrinsic characteristics (like chemical composition, flavor, or variety) and extrinsic indicators (like certifications, brand, and packaging) contribute to price formation across various agro-food products.
In summary, the literature suggests that while tea has a rich array of quality factors, the rigorous quantification of their price impacts is less developed compared to products like wine, coffee, or olive oil. The evolution of hedonic pricing research in those other markets, ranging from basic attribute–price correlations to more nuanced analyses that incorporate reputation and strategy effects, provides a valuable roadmap. Drawing on these insights, our study aims to fill the gap by systematically evaluating how different attributes of tea (from origin and certifications to flavor and chemical indicators) are capitalized into price. By doing so, we not only address the call for deeper analysis of tea price determinants and econometric modeling but also contribute novel evidence to the growing body of hedonic pricing literature in the domain of specialty crops.
2.2. Tea production areas and types in Taiwan
Tea production in Taiwan is characterized by numerous smallholder farmers and many independent producers, resulting in a competitive market with no single entity able to dictate prices (Tea Journey Magazine, 2023). This decentralization means tea farmers typically operate on small plots (often 1–2 ha or less), and large corporate plantations are virtually absent – a situation that prevents monopolistic control of the market (Tea Journey Magazine, 2023). Such a decentralized structure, combined with the diversity of teas produced, effectively supports a market setting in which product attributes are capitalized into price – a key assumption of hedonic pricing models.
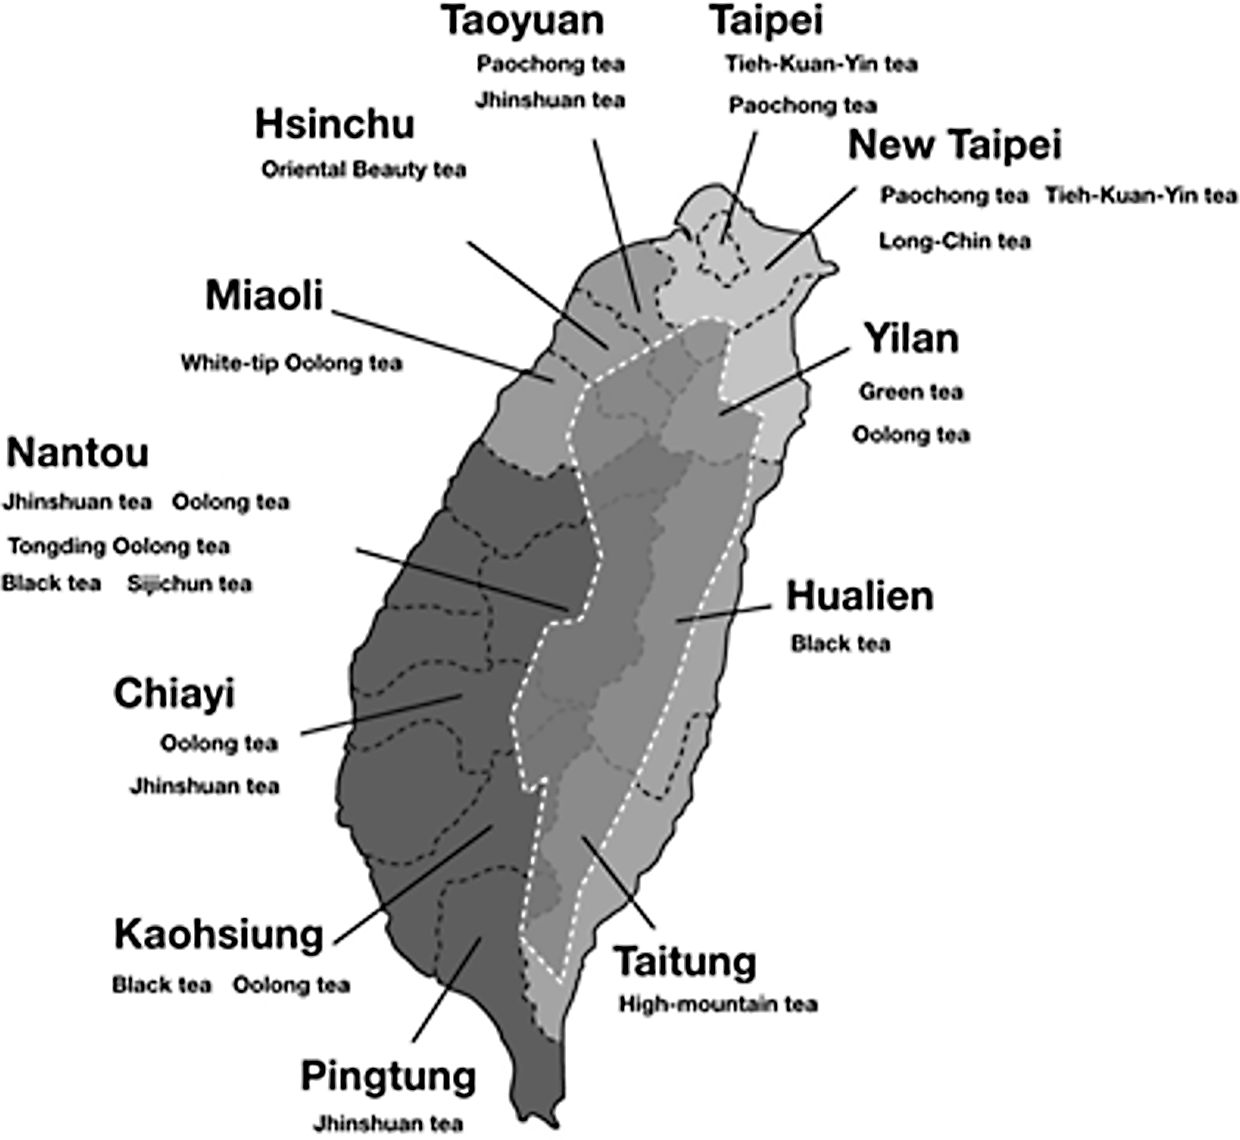
Production areas are among the important factors influencing market prices (Chen, Reference Chen2021; Das, Reference Das2006; Wang et al., Reference Wang, Liang, Ko and Lin2022b). In Taiwan, there are 13 geographical indications for tea production areas established by the Ministry of Agriculture, such as Sun Moon Lake Black Tea, Alishan High-Mountain Tea, and Wenshan Baozhong (Liu, Reference Liu2014). Regions produce tea with variations in a wide variety, as depicted in Figure 1 (Ministry of Agriculture, 2024).
The main types of tea produced in different regions in Taiwan. Source: Minister of Agriculture (2024).

Figure 1 Long description
The map of Taiwan highlights the main types of tea produced in various regions across the island. In Taoyuan, Paochong tea and Jhinshuan tea are produced. Taipei is known for Tieh-Kuan-Yin tea and Paochong tea. New Taipei produces Paochong tea, Tieh-Kuan-Yin tea, and Long-Chin tea. Hsinchu is famous for Oriental Beauty tea. Miaoli produces White-tip Oolong tea. Nantou is known for Jhinshuan tea, Oolong tea, Tongding Oolong tea, Black tea, and Sijichun tea. Yilan produces Green tea and Oolong tea. Hualien is known for Black tea. Chiayi produces Oolong tea and Jhinshuan tea. Kaohsiung produces Black tea and Oolong tea. Taitung is known for High-mountain tea. Pingtung produces Jhinshuan tea.
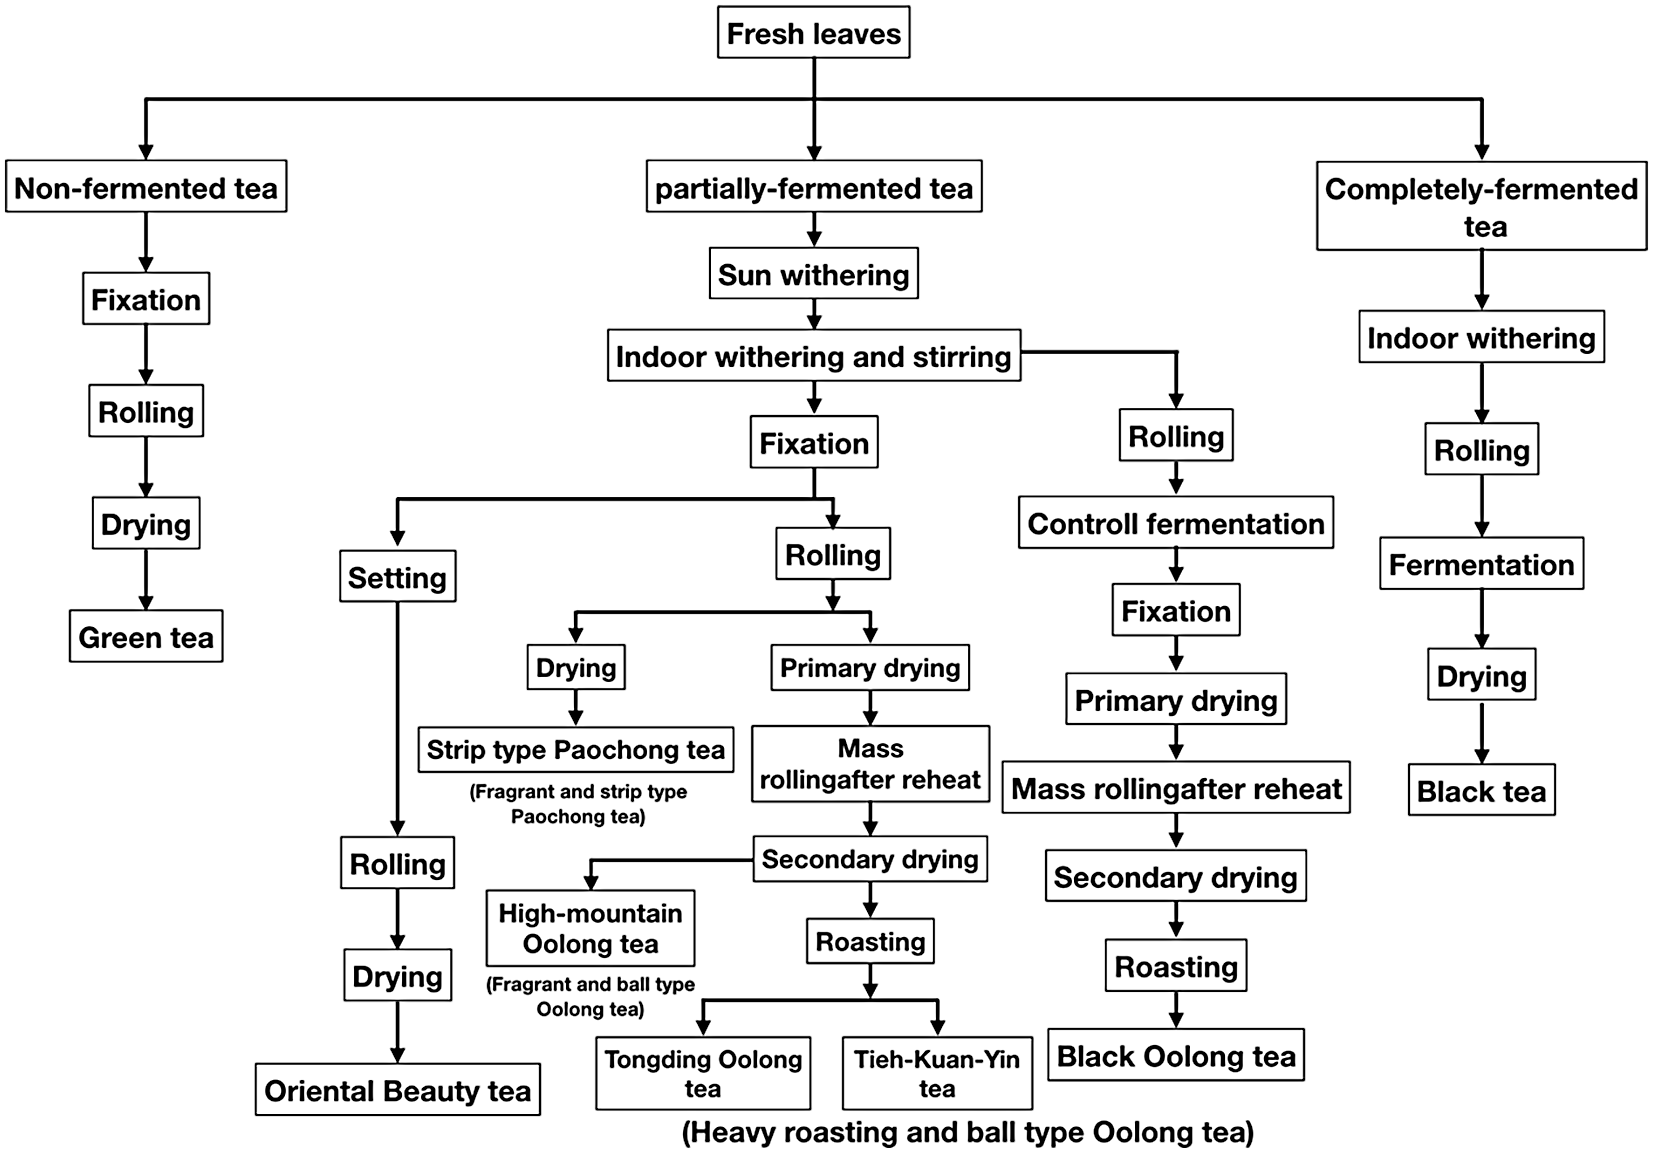
While geographical indication plays a crucial role in tea valuation, the production process is another key factor that influences market prices. Using exactly the same tea leaves, different production process may yield different tea. The production process could be categorized by three types: non-fermented, partially fermented, or fully fermented. Non-fermented tea, like green tea, involves fixation, rolling, and drying to retain fresh flavors. Partially fermented teas, such as oolong, are sun-withered, indoor-withered, and stirred to initiate partial oxidation. Processes like rolling, fixation, drying, and roasting further shape their unique flavor. High-mountain oolong undergoes additional roasting for complexity, while heavier roasts, such as Tiehguanyin, develop bold flavors. Fully fermented teas, like black tea, are processed through controlled fermentation, fixation, rolling, and drying to achieve their rich, robust taste. The detailed production process is as shown in Figure 2 (Ministry of Agriculture, 2023).
The production process of different types of tea. Source: Minister of Agriculture (2023).

Figure 2 Long description
The flowchart illustrates the production process of different types of tea from fresh leaves. The process begins with fresh leaves, which can lead to non-fermented tea, partially-fermented tea, or completely-fermented tea. Non-fermented tea undergoes fixation, rolling, and drying to produce green tea. Partially-fermented tea involves sun withering, indoor withering and stirring, fixation, rolling, and various drying and roasting steps to produce different types of oolong tea. Completely-fermented tea undergoes indoor withering, rolling, controlled fermentation, fixation, and drying to produce black tea. The flowchart details specific steps and processes for each type of tea, including setting, primary drying, secondary drying, and roasting.
2.3. Organic, origin, and traceability certification in Taiwan
Taiwan has implemented three major certification schemes in its tea industry: organic certification, origin certification, and traceability certification. Each scheme is administered by government-authorized bodies and is intended to signal specific quality attributes to consumers. Organic certification denotes that a tea has been produced according to strict organic farming standards. Under Taiwan’s Organic Agriculture Promotion Act (effective 2019), only products that have been inspected and certified by an accredited third-party agency may be labeled and sold as “organic” (Organic Agriculture Promotion Center, 2019). This means the tea is grown without synthetic pesticides, with no chemical fertilizers or genetically modified organisms (GMOs) allowed – only naturally approved inputs are used in cultivation. Obtaining this certification is not a one-time process – farmland must undergo a two- to three-year conversion period to organic management, and even after certification farmers face annual inspections to ensure continued compliance (Organic Agriculture Promotion Center, 2021). Certified organic teas carry the official “Taiwan Organic” mark, indicating compliance with these rigorous standards (Organic Agriculture Promotion Center, 2019). For consumers, the organic label serves as a credibility signal of natural and safe cultivation practices, which can enhance the tea’s appeal. Many consumers are willing to pay a premium for organic products due to perceived health and environmental benefits, so we anticipate organic certification to positively influence tea prices. Indeed, evidence suggests organic tea commands a premium value: Taiwanese farmers are willing to invest more in organic tea cultivation versus conventional farming in expectation of higher returns (Liu et al., Reference Liu, Chiang, Yap and Lin2024), and globally, organic teas have been reported to fetch higher average market prices than non-organic teas in niche markets (Hajra, Reference Hajra2017).
Origin certification in Taiwan refers to the system of certifying and labeling teas from specific renowned producing regions, functioning similarly to geographical indication (GI) protections in other countries. Taiwan’s Council of Agriculture, through the Tea Research and Extension Station and the Agriculture and Food Agency, oversees a Certificate of Origin Label program for premium local teas (Agriculture and Food Agency, 2022a). For a tea to receive an origin label, the producer must prove the tea’s geographic origin and adhere to defined quality standards. Certification units verify that the tea was indeed grown and processed in the claimed locale and often conduct sensory evaluations (taste, aroma, liquor color) to ensure it meets the region’s quality reputation. They also test for safety (e.g., pesticide residues) to uphold the standard (Agriculture and Food Agency, 2022a). Only tea batches that pass these checks can carry the region’s official certification mark. This origin labeling system gives consumers assurance of authenticity. It also implies a certain level of quality tied to the origin’s terroir and traditional craftsmanship.
Traceability certification is the third key scheme, focused on food safety and supply-chain transparency. Taiwan’s traceability program issues the Traceable Agricultural Product (TAP) label to products that are produced under monitored conditions with full record-keeping. To obtain a TAP certification, a tea farmer must implement Taiwan Good Agricultural Practices (TGAP) and maintain detailed logs of all farming and processing activities. A government-approved certification body audits the farm’s records and practices; only if the production process meets the standards is the traceability label granted (Agriculture and Food Agency, 2022b). Each TAP-certified tea is sold with a unique traceability code on its packaging. Consumers can enter this code into an official web portal to instantly retrieve information on that tea’s origin, the farm and farmer, cultivation methods, harvest date, processing steps, and even test results for safety (Agriculture and Food Agency, 2022b). In essence, the traceability certification guarantees that the product is safe and its history is transparent, from leaf to cup.
In summary, these three certifications serve as signals of quality, origin, and safety in the Taiwanese tea market. Including them in our analysis is theoretically grounded in the idea that certified attributes resolve information asymmetries for consumers and create product differentiation. Prior research supports this view: products with certified organic, origin, or safety labels often achieve price premiums because consumers associate these labels with higher quality or lower risk (Erraach et al., Reference Erraach, Jaafer, Radić and Donner2021). We therefore treat organic, origin, and traceability certifications as central explanatory factors in our hedonic price model. By doing so, our study captures how credible certifications contribute to price formation.
3. Data and econometric approach
3.1. Data and variable selection
The data used in this study is from an administrative survey, “Taiwan Tea Manufacturing Factory Operation Survey,” conducted by the Ministry of Agriculture, which investigated tea factories across Taiwan in 2019. The survey includes 2,214 individual tea products made by 1,340 tea factories. The dataset contains various factories’ and teas’ characteristics, such as production area, production process, workforce composition, sales channels, certification status, and geographic coordinates. Additionally, it provides detailed data on production environment such as facilities, labor allocation, particularly the distribution of full-time and part-time employees. Finally, the data also includes several certifications, such as traceability, organic, origin, and export.
Data processing was conducted in two phases. In the first, we removed observations with missing or erroneous values (e.g., invalid coordinates or cases where production volume or price was zero). To resolve inconsistent naming of tea products, we standardized the tea type classifications by grouping similar teas under unified categories. The original dataset contained seven tea categories – black tea, green tea, oolong tea, Baozhong tea, Oriental Beauty, Tieguanyin, and a few labeled Others. For consistency and to ensure adequate sample size per category, we consolidated these into five broader categories. Specifically, Tieguanyin (a subtype of semi-fermented oolong tea) was merged into the oolong category, and the small “Others” category was combined with Oriental Beauty. To ensure consistency, we standardized the naming of tea types by consolidating naming variants under five unified categories. For instance, specific red/black tea varieties (such as Tai-18, Tai-20, Tai-27, Wuhong, Ruby, and Assam) were grouped as ‘black tea.’ Likewise, different local labels including ‘Oolong,’ ‘Dongding Oolong,’ and related subtypes were uniformly categorized as ‘oolong tea. This standardization was applied to all tea categories in the dataset. This standardization ensured consistency across the dataset. Thus, the five tea-type categories used in our study are black tea, green tea, oolong, Baozhong, and Oriental Beauty (the last of which includes Oriental Beauty and other minor specialty teas). In the second phase, we processed the geographical data, specifically the geographic coordinates recorded in the survey. Using ArcGIS, we converted these coordinates into elevation data, thereby incorporating elevation as a continuous variable. After data cleaning, we obtained a final sample of 1,673 observations.
Additionally, following the Ministry of Agriculture tea production region classification (Ministry of Agriculture, 2008), we reclassified the tea production areas to better reflect their geographical environment and growing conditions, which are generally similar within the same county or city. The revised classification includes the Taoyuan/Hsinchu/Miaoli (Taoyuan City, Hsinchu County, Miaoli County), Northern area (Taipei City, New Taipei City, Keelung City, Yilan County), Central area (Taichung City, Changhua County, Nantou County, Yunlin County), Eastern area (Hualien County, Taitung County, outer islands), and Southern area (Chiayi County, Tainan City, Kaohsiung City, Pingtung County).
Production-related factors include land area, facilities, labor, and elevation. Tea production involves a variety of processing machines, which can be categorized into general facilities and specialized facilities based on their function, cost, and operational complexity. While general facilities are essential for standard tea processing and packaging, specialized facilities play a crucial role in refining tea quality, requiring higher capital investment and professional expertise. General facilities in tea production are machines used for basic processing, such as drying and packaging, making them fundamental to most tea factories, such as withering drum, type-B dryer, de-clumping machine, roasting machine, and vacuum packaging machine.
In contrast, specialized facilities are used for high-end tea processing, shaping, and refining, often requiring advanced skills to operate, such as withering trough, rolling machine, bagging machine, lotus machine, compression shaping machine, tofu machine, and type-A Dryer. These machines are critical in producing premium-quality tea. For example, withering trough and rolling machine directly influence tea oxidation and shaping in producing high-end teas with complex aromas and textures.
Labor is distinguished by full-time and part-time positions in factories. Full-time employees are those who work on a regular basis with fixed contracts. In contrast, part-time employees are often hired on a seasonal or temporary basis, particularly during peak harvesting and processing periods. Elevation in our dataset is measured in meters above sea level and varies across different production areas, reflecting the diverse growing conditions of tea plantations.
Certifications play a crucial role in ensuring quality standards and market differentiation. The dataset includes four key certification categories: (1) traceability certification: allows consumers to verify the origin and processing history; (2) origin certification: confirms that the tea is produced in a specific region; (3) organic certification: verifies that tea is grown without synthetic pesticides or chemical fertilizers; (4) export status: indicates whether the tea is produced for domestic consumption or meets regulatory requirements for international trade.
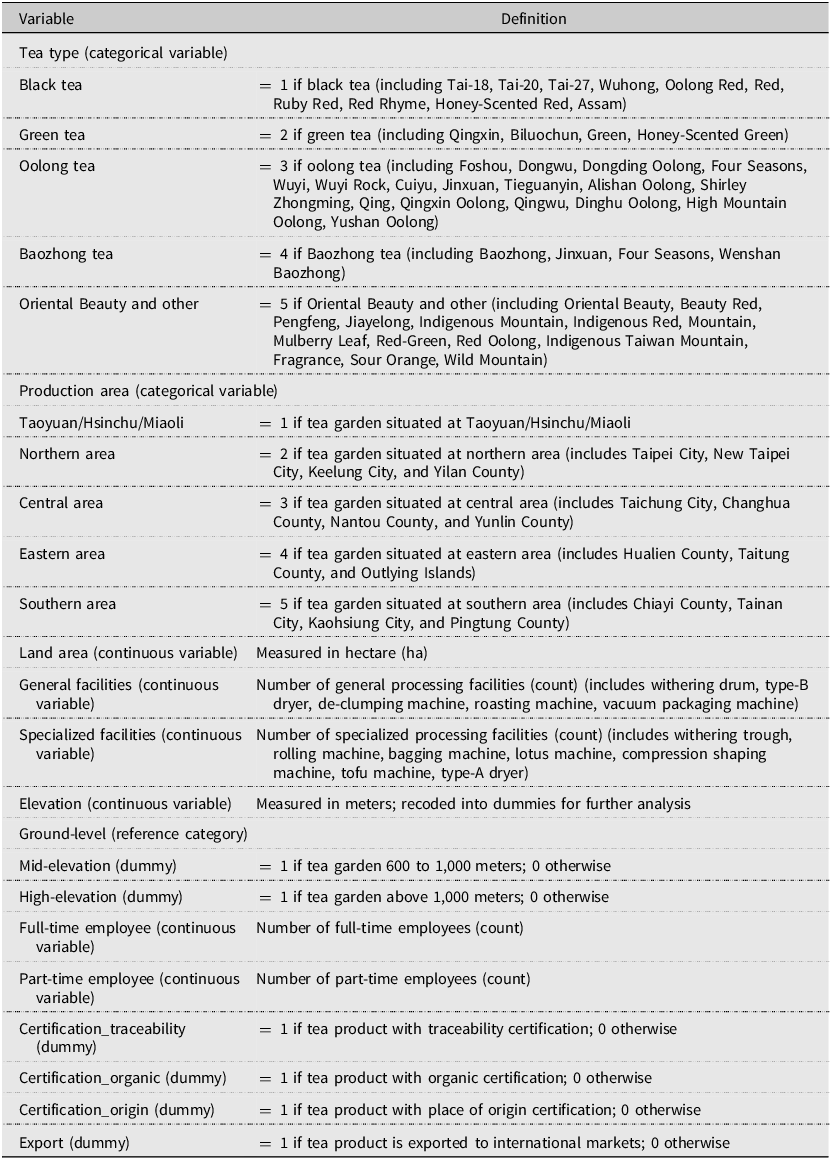
Table 1 provides detailed definitions and descriptive statistics for these selected variables. We have 13 variables, including six categorical and seven continuous variables. The categorical variables include tea type, production area, certification of traceability, certification of organic, certification of origin, and export status. Meanwhile, the continuous variables cover tea price (dependent variable), land area (measured in hectare), number of general facilities, number of specialized facilities, elevation (meters), number of full-time employees, and number of part-time employees. For further analysis, tea gardens are also categorized by elevation: ground-level (below 600 m), mid-elevation (600 to 1,000 m), and high-elevation (above 1,000 m).
Definitions of selected variables

Table 1 Long description
The table defines selected variables for tea gardens, including tea type, production area, and certification status. It categorizes tea types into black, green, oolong, baozhong, and others. Production areas are divided into Taoyuan/Hsinchu/Miaoli, Northern, Central, Eastern, and Southern regions. Continuous variables include land area, general facilities, specialized facilities, elevation, full-time employees, and part-time employees. Elevation is categorized into ground-level, mid-elevation, and high-elevation. Certification variables include traceability, organic, and origin. Export status is also noted.
Although some variables (e.g., elevation) are not directly observable by consumers at point of sale, we include them as proxies for underlying quality and certification signals. This approach is consistent with prior hedonic studies in food markets. For instance, wine studies incorporate expert scores and vineyard terroir variables as quality indicators that consumers rely on via reputation (Núñez et al., Reference Núñez, Martín-Barroso and Velázquez2024). Similarly, olive oil research has treated chemical measures (like acidity level) and production methods (e.g., cold extraction) as quality signals, especially when such information is communicated on labels or through appellation certifications (Cabrera et al., Reference Cabrera, Arriaza and Rodríguez-Entrena2015; Carlucci et al., Reference Carlucci, De Gennaro, Roselli and Seccia2014). They suggest that until consumers gain experience, tangible signals (e.g., certification) drive prices, whereas attributes such as elevation, soil, microclimate only command premiums once they are better understood. In short, even unseen characteristics can influence price when they serve as credible indicators of product quality.
3.2. Econometric approach
We employ the hedonic pricing model (Rosen, Reference Rosen1974) to analyze the determinants of tea prices. Cuevas et al. (Reference Cuevas, Pede, McKinley, Velarde and Demont2016), Dilaver and Dilaver (Reference Dilaver and Dilaver2022), Khanal and Dhoubhadel (Reference Khanal and Dhoubhadel2023), Outreville and Le Fur (Reference Outreville and Le Fur2020) have applied hedonic pricing to assess the value of agricultural products. Moreover, Martinez et al. (Reference Martinez, Boyer and Burdine2021) use hedonic price model and found that feeder cattle with certain desirable attributes earned significant premiums at auction.
In addition, Taiwanese teas exhibit considerable product heterogeneity, varying by cultivar, region (e.g., high-mountain versus lowland), processing method, and grade, which leads to differentiated products catering to diverse consumer preferences (Tea Research and Extension Station, 2022). With no government price controls or monopolistic pricing, prices in this sector largely reflect perceived quality and demand, satisfying the assumptions of a competitive market. Therefore, employing a hedonic pricing model is appropriate, as observed price differences can be interpreted as the implicit valuations of tea attributes under competitive equilibrium.
In this study, we classify the price determinants of tea into intrinsic attributes, extrinsic attributes, production factors, and regional characteristics. Let Pi represent the price of tea, which can be expressed through the following pricing model:
 $${P_i} = f\left( {{Z_i},{T_i},{X_i},{L_i}} \right)$$
where Zi captures the regional characteristics of the tea. Intrinsic attributes (Ti) include tea types, such as black tea, green tea, oolong tea, Baozhong, and Oriental Beauty. Extrinsic attributes (Li) refer to external quality signals, including certifications such as organic certification, traceability, and geographic indication, as well as export orientation. Xi are production factors such as tea plantation area, labor, and specialized facilities. The baseline model for this study is specified as equation (2):
 $$\eqalign {ln(Pric{e_i}) = \; & {\beta _0} + \mathop \sum \limits_{j = 1}^4 {\gamma _j} \times Are{a_{ij}} + \mathop \sum \limits_{k = 1}^4 {\delta _k} \times typ{e_{ik}} + {\boldsymbol {\theta ' X_i}} + {\tau _1}traceabilit{y_i} + {\tau _2}organi{c_i} \cr & + {\tau _3}origi{n_i} + {\tau _4}expor{t_i} + {\varepsilon _i}}$$
where ln(Pricei) is the natural logarithm of the i th tea price; Areaij is the i th tea in the j th production area (Taoyuan/Hsinchu/Miaoli (as reference group), Northern area, Central area, Eastern area and Southern area); typei is the i th tea belonging to the k th type (black tea (as reference group), green tea, oolong tea, Baozhong tea, Oriental Beauty and other),Xi is a vector of variable associated with production factors (land area, general and specialized facilities, elevation, full-time and part-time employee), traceabilityi represents the traceability certification, organici refers to the organic certification, origini denotes the geographic indication certification, exporti represents whether the tea is exported. The error term ϵi follows a normal distribution with a mean of 0 and a standard deviation of 1. γj, δk, θ′, τ 1, τ 2, τ 3, τ 4 are the estimated parameters. These parameters of interest capture the tea price determinants of the four categories.
To further analyze price variations across different regions, we extend the baseline model by segmenting the sample according to production areas. The model is specified as equation (3):
 $$\eqalign {ln(Pric{e_{ij}}) = \; & {\beta _0} + \mathop \sum \limits_{k = 1}^4 {\delta _k} \times typ{e_{ijk}} + {\boldsymbol {\theta '{X_{ij}}}} + {\tau _1}traceabilit{y_{ij}} + {\tau _2}organi{c_{ij}} \cr & + {\tau _3}origi{n_{ij}} + {\tau _4}expor{t_{ij}} + {\varepsilon _{ij}}}$$
We identified elevation as a potentially key determinant of tea prices, prompting further investigation of its impact. We extend the baseline model by introducing two dummy variables to distinguish mid-elevation and high-elevation production regions. The model is specified as equation (4):
 $$\begin{align}ln(Pric{e_i}) =&\;{\beta _0} + {\rho _1} \times midelevatio{n_i} + {\rho _2} \times highelevatio{n_i} + \sum\limits_{j = 1}^4 {{\gamma _j}} \times Are{a_{ij}} + {\boldsymbol {\theta '{x_i}}} \\&+ {\tau _1} \times traceabilit{y_i} + {\tau _2} \times organi{c_i} + {\tau _3} \times origi{n_i} + {\tau _4}expor{t_i} + {\varepsilon _i}\end{align}$$
where ρ 1 and ρ 2 are coefficients of interest, capturing the effect of mid-elevation (600 to 1,000 m) and high-elevation (above 1,000 m) on tea price with ground-level (below 600 m) as the reference. The rest of equation (4) follows the same specification as equation (2). Finally, since previous studies (Hajra, Reference Hajra2017; Liu et al., Reference Liu, Chiang, Yap and Lin2024) have demonstrated that organic certification leads to a price premium, we compare the sub-samples of organic versus non-organic teas.
4. Results
4.1. Descriptive statistics and regional distribution of Taiwanese tea types
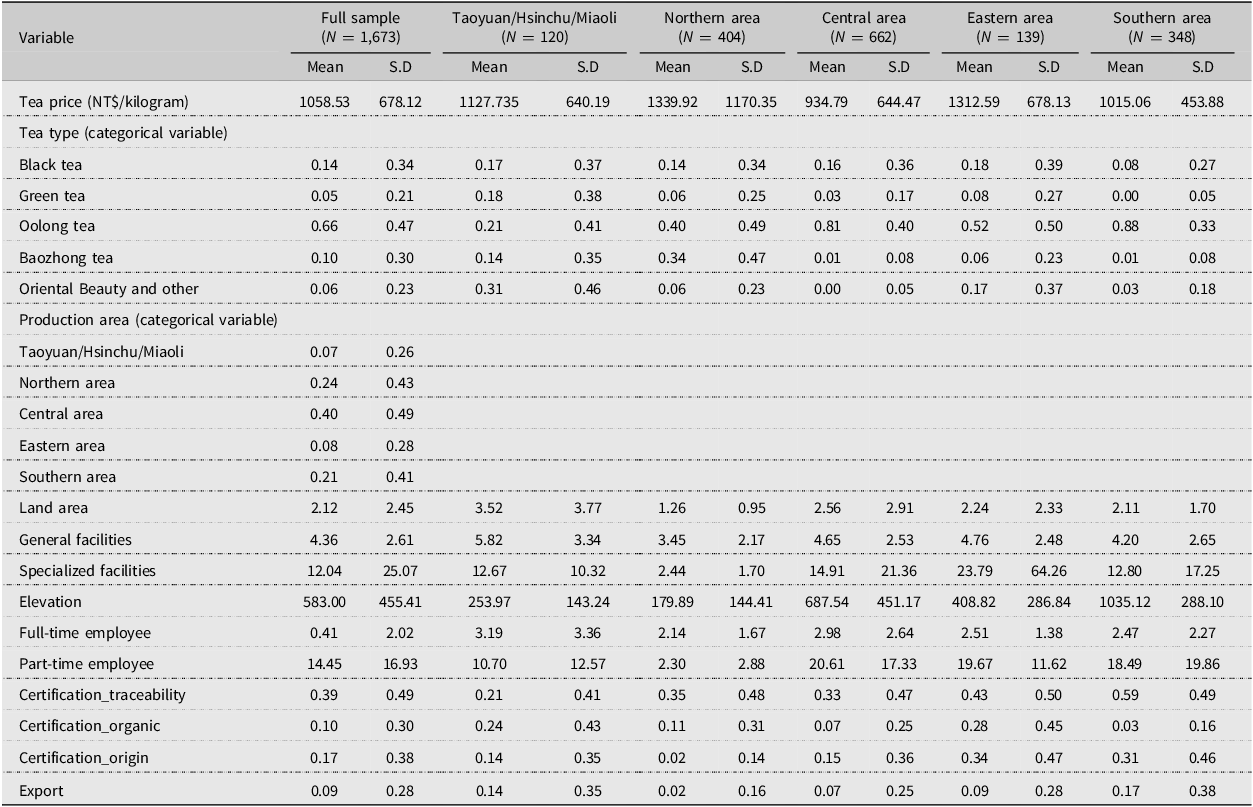
Table 2 provides descriptive statistics for full sample and each production area. Results show that in terms of tea type, oolong tea has the highest proportion, averaging 66%, followed by black tea at 14% and Baozhong tea at 10%. Green tea and Oriental Beauty (including other types) have lower proportions, at 5 and 6%, respectively. For regional distribution, the central area has the highest proportion (40%), followed by the northern area (24%) and the southern area (21%).
Descriptive statistics of selected variables (means of dummy and categorical variables shown as proportions)

Table 2 Long description
The table presents descriptive statistics for a full sample and specific production areas, detailing tea price, tea type proportions, production area distribution, land area, facilities, elevation, employment, certifications, and export data. The tea price varies across regions, with the highest mean price in the Northern area at 1339.92 New Taiwan dollars per kilogram and the lowest in the Southern area at 1015.06 New Taiwan dollars per kilogram. Oolong tea has the highest proportion at 66%, followed by black tea at 14% and Baozhong tea at 10%. Green tea and Oriental Beauty, along with other types, have lower proportions at 5% and 6%, respectively. The central area has the highest production area proportion at 40%, followed by the northern area at 24% and the southern area at 21%. Land area, general facilities, specialized facilities, elevation, full-time and part-time employment, certification traceability, organic certification, origin certification, and export data are also detailed for each region.
In terms of production factors, the average land area is 2.20 ha, with an average of 4.36 general facilities and 12.04 specialized facilities. The average elevation is 583 m. Regarding labor, the average number of full-time employees is 0.41, while part-time employees average 14.45. For certifications, 39% of the sample holds traceability certification, 17% hold origin certification, 10% are organic certification, and 9% export to foreign markets.
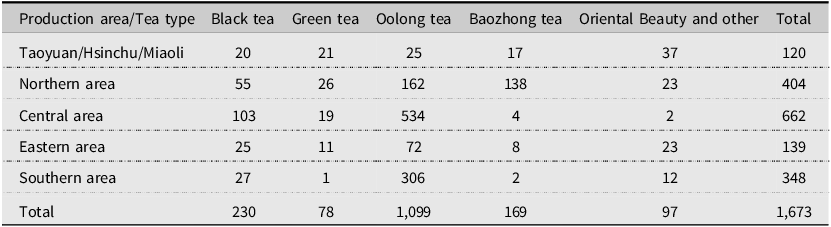
Table 3 shows the distribution of various tea types across production area. Notably, oolong tea is produced in all regions, with a total of 1,099 (65.7%), making it the most prominent type of tea. The majority of northern area is oolong and Baozhong; the Taoyuan/Hsinchu/Miaoli areas are notable for Oriental Beauty and other specialty teas. The central region is a significant production area for both oolong and black tea, while the eastern region, though lower in output, includes a range of tea varieties.
Cross table between tea type and production area

Table 3 Long description
The table presents the distribution of various tea types across different production areas in Taiwan. It includes five production areas: Taoyuan/Hsinchu/Miaoli, Northern area, Central area, Eastern area, and Southern area. The tea types listed are Black tea, Green tea, Oolong tea, Baozhong tea, Oriental Beauty, and other. The table has five rows for the production areas and six columns for the tea types, with a total column summarizing the production for each area. Notably, Oolong tea is produced in all regions, with a total of 1,099, making it the most prominent type of tea. The Northern area is predominantly Oolong and Baozhong tea. The Taoyuan/Hsinchu/Miaoli areas are notable for Oriental Beauty and other specialty teas. The Central region is a significant production area for both Oolong and Black tea. The Eastern region, though lower in output, includes a range of tea varieties.
As shown in Table 3, the distribution of samples across regions and tea types in our dataset is uneven, with certain tea types or regions underrepresented. This imbalance could potentially introduce bias in the aggregated results. To assess whether any single region or tea type was unduly influencing our findings, we performed a supplementary analysis in which we fitted the model separately for each major tea type. Encouragingly, these stratified analyses yielded results consistent with those from the full dataset (data not shown), suggesting that no single group with a larger sample size was disproportionately driving the overall outcomes. Although unequal sample sizes remain a limitation, our findings appear robust across subsamples.
4.2. What factors drive tea prices?
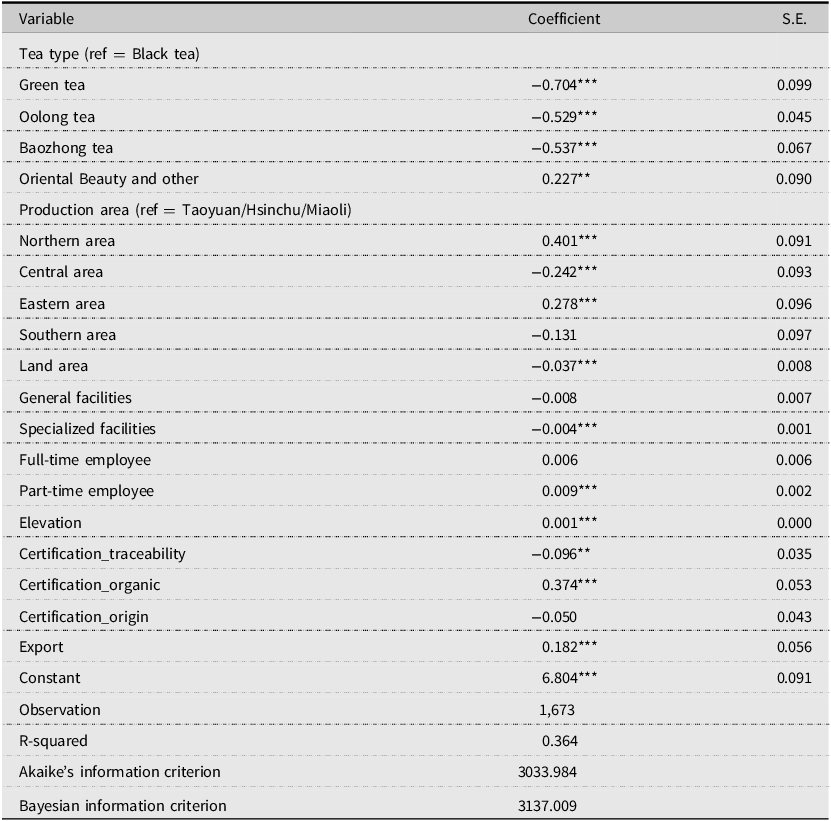
Table 4 presents the baseline model results for tea prices. Since the regression is estimated using a semi-log model (log of price as the dependent variable), all reported coefficients have been converted into percentage changes using the formula (e β−1) × 100% for ease of interpretation. For example, a coefficient of 0.20 corresponds to approximately a 22% increase in price, calculated as (e 0.20−1) × 100%.
Empirical results of production area on tea price (Baseline model)

Table 4 Long description
The table presents the baseline model results for tea prices, using a semi-log model with the log of price as the dependent variable. All reported coefficients have been converted into percentage changes using the formula (e^1) 100% for ease of interpretation. For example, a coefficient of 0.20 corresponds to approximately a 22% increase in price. The table includes variables such as tea type, production area, land area, facilities, employees, elevation, certification, and export. Each variable is listed with its corresponding coefficient and standard error. Notable trends include the negative impact of green tea, oolong tea, and baozhong tea on price compared to black tea, and the positive impact of organic certification and export on price. The table also shows the number of observations, R-squared value, and information criteria for model evaluation.
Note: ***, **, and *denote significance at the 1, 5, and 10% levels, respectively; regression results are estimated with heteroscedasticity-robust standard errors.
First of all, the type of tea significantly affects its price. Compared to black tea, green tea has the largest price discount, indicating that its price is approximately 50% lower. Similarly, oolong and Baozhong exhibit significant price discounts of 41 and 42%, respectively. In contrast, Oriental Beauty and other teas are priced 26% higher than black tea.
On the demand side, differences in consumer preferences also play a role in these price disparities: teas with unique flavor profiles or prestigious reputations, such as Oriental Beauty, tend to attract tea enthusiasts who are willing to pay premium prices, which bolsters their market value, while more common varieties like green tea are widely available and face more price-sensitive demand, limiting their ability to command high premiums (Padamali and Fernando, Reference Padamali and Fernando2016).
On the supply side, the substantial price differences among tea varieties may be attributed to variations in processing methods, labor costs, and the cultivation environment. For example, the production process of black tea is more intricate than that of green tea, particularly due to the oxidation and fermentation processes required to develop its unique flavor and color, which add to the production time and cost (Ministry of Agriculture, 2023). Taiwan’s tea industry also faces seasonal labor shortages (Wu, Reference Wu2015), which exacerbate the challenges of sustaining quality in labor-intensive teas. Oriental Beauty tea exemplifies this issue: it is typically harvested only once a year, making the timing of harvest critical, as tea quality can vary substantially across different picking periods (Xia et al., Reference Xia, Li, Yu, Liu, Nie, Li, Shao, Zhang, Rogers and Yuan2021). Its distinctive flavor is further developed through natural infestation by the tea green leafhopper, which releases special compounds in the leaves. This natural process requires precise control and skilled labor, as both over-infestation and under-infestation can negatively affect tea quality. Therefore, its harvesting remains highly labor-intensive, relying on hand-picking only the buds and young leaves.
Regarding production areas, tea from the Northern and Eastern areas is priced 49 and 32% higher, respectively, compared to Taoyuan/Hsinchu/Miaoli, while the Central area is about 24% lower and the Southern area shows no significant premium. The differences in tea prices could be attributed to regional reputation, geographic cultivation conditions, and associated regulations (Ministry of Agriculture, 2024). For example, the northern tea-producing areas are mountainous, limiting large-scale cultivation. This smaller-scale farming hinders economies of scale, preventing northern tea farmers from lowering unit costs through expanded production (Tiwari et al., Reference Tiwari, Adhikari and Dhungana2017). Furthermore, many tea regions in the north are designated as water conservation zones, where strict land development restrictions emphasize environmentally sustainable practices, thus elevating production costs and ultimately raising tea prices.
In terms of production factors, land area shows a significantly negative effect on tea prices, with each additional hectare reducing tea prices by 4%. The presence of general facilities has an insignificant effect on tea prices, while specialized facilities have a small but statistically significant negative impact. Rather than attributing this pattern to a price-depressing effect of economies of scale, we interpret the specialized-facility coefficient cautiously. Ultra-premium teas such as Oriental Beauty rely on hand-picking and delicate manual steps that are difficult to mechanize without risking quality, so the count of specialized machines does not map linearly to quality premiums. In many factories, specialized equipment primarily serves standardization and is aimed at volume-oriented segments, effects that are plausibly absorbed after controlling for tea type and region. Moreover, our measure captures only the number of facilities, not their type, age, utilization, or operator skill, which can attenuate the estimated relationship. Consistent with this interpretation, the by-region results (Table 5) show negative or insignificant associations between specialized facilities and prices in the North and Central areas. Elevation is also a crucial factor, with additional 100 m, tea prices increase by 11%. From a demand perspective, consumers often perceive teas produced on smaller farms or through traditional methods as higher quality. Many buyers are willing to pay a premium for such artisanal teas, associating small-scale production with superior flavor and uniqueness (Padamali and Fernando, Reference Padamali and Fernando2016; Wang et al., Reference Wang, Liang, Ko and Lin2022b).
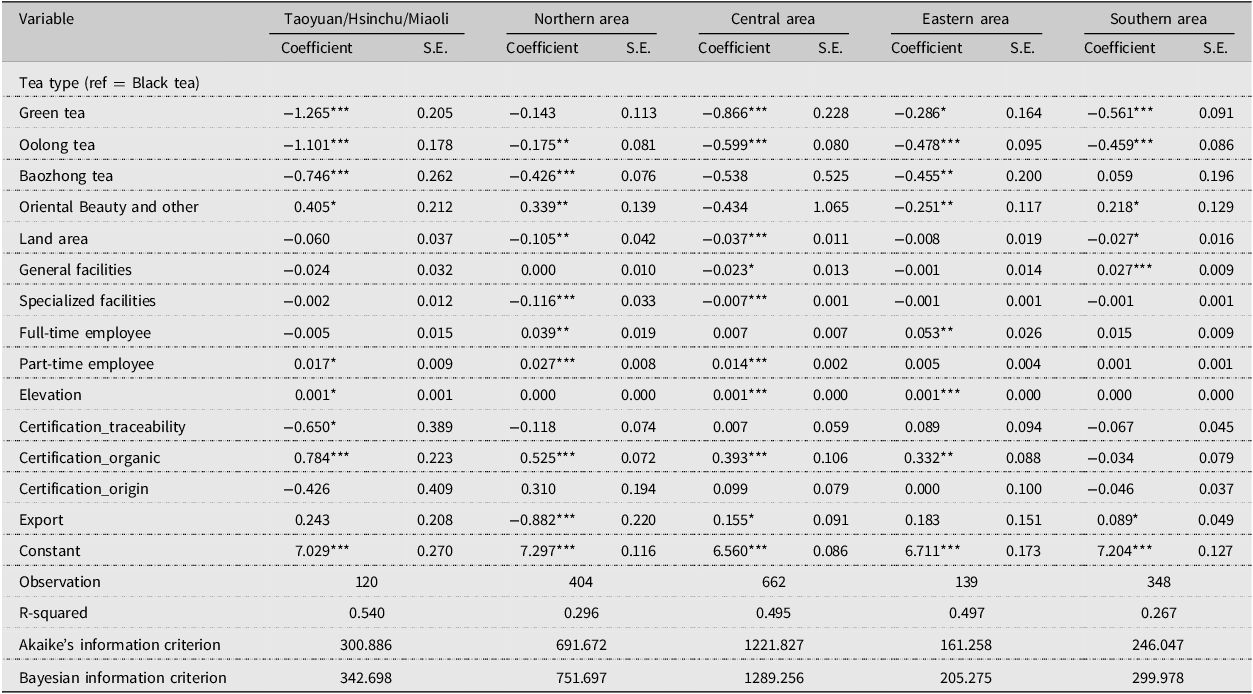
Empirical results of production area on tea price by production area

Table 5 Long description
The table presents empirical results of various factors affecting tea prices across different production areas. It includes coefficients and standard errors for variables such as tea type, land area, facilities, elevation, and certifications. The table is divided into five regions: Taoyuan/Hsinchu/Miaoli, Northern area, Central area, Eastern area, and Southern area. Each region's data is presented in separate columns, showing how different factors influence tea prices. Notable trends include the negative effect of land area and specialized facilities on tea prices, while elevation has a positive impact. The table also highlights regional variations in these effects.
Note: ***, **, and *denote significance at the 1, 5, and 10% levels, respectively; regression results are estimated with heteroscedasticity-robust standard errors.
For certification of tea, organic certification significantly increases price by 45% compared to tea without organic certification, while traceability certification reduces price by 9%, compared to its counterpart. Origin certification does not show a significant effect. Exporting tea leads to a 20% price premium, compared to its counterpart, reinforcing the value of international market access. In line with previous literature (Mishra and Kattel, Reference Mishra and Kattel2021; Wang et al., Reference Wang, Liang, Ko and Lin2022b), organic certification correlates with higher tea prices. However, not all certifications exhibit the same effect. In particular, while organic labeling clearly signals value to consumers, the market response to traceability certification is much weakerFootnote 1. Although traceability certification improves product transparency, allowing consumers to understand the origin and production processes, it does not necessarily increase the price. Consumers may be less familiar with or value traceability certification, particularly in high-end markets that focus on flavor, brand, or geographic indication. Consumers in these markets often prioritize sensory experience, history, or brand reputation over traceability (Carew and Florkowski, Reference Carew and Florkowski2010; Chen, Reference Chen2021; Wang et al., Reference Wang, Liang, Ko and Lin2022b). Additionally, the relatively low cost of obtaining traceability certification does not significantly enhance the product’s value. Small-scale farmers may also favor this certification over more premium certifications such as geographic indication or organic certification, leading to relatively lower tea prices. Recent demand-side evidence on tea indicates that willingness to pay for traceability is modest and concentrated among consumers with higher safety concerns, whereas organic labels more reliably raise willingness to pay when certification is trusted by buyers. These patterns help explain our finding of a strong organic premium but weak or insignificant premiums for traceability and origin labels (Padamali and Fernando, Reference Padamali and Fernando2016; Wang et al., Reference Wang, Liang, Ko and Lin2022b).
Besides, certifications often appear in combinations in practice, raising the concern that their effects could be difficult to disentangle. To address this issue, we evaluated the potential for overlap and found no evidence of harmful multicollinearity in our setting. Moreover, the inclusion of region and tea-type controls absorbs much of the contextual clustering of certifications, and our estimates remain stable under heteroskedasticity-robust inference and alternative specifications.Footnote 2 Consequently, we retain the three certification indicators in the baseline model and interpret their coefficients jointly. Notably, the traceability label does not consistently yield a price premium once organic and origin certifications are considered, which is consistent with the notion that market premiums are primarily attributed to the latter when labels co-occur.
4.3. Heterogeneity in production areas
To further analyze regional differences in tea prices, the sample was segmented by production area as shown in Table 5. The results indicate that tea type has a significant impact on price across regions. Compared to black tea (the reference category), green tea is associated with a significant price discount in all regions except the north. The largest decrease is observed in the Taoyuan/Hsinchu/Miaoli region, where green tea prices are about 72% lower than black tea (converted to percentage changes based on the coefficient of −1.265). This is followed by the central region (approximately 58% lower). The southern (43% lower) and eastern (25% lower) regions also show negative effects for green tea relative to black tea, though these effects are less pronounced. In the northern region, green tea prices are only slightly lower than black tea and the difference is not statistically significant in the robust estimation. Oolong tea prices are significantly lower than black tea in all regions. The most substantial price reduction is again in the Taoyuan/Hsinchu/Miaoli region, with oolong tea about 67% cheaper than black tea. Significant discounts are also evident in the central region (45% lower), eastern region (38% lower), and southern region (37% lower). In the northern region, oolong tea is roughly 16% cheaper than black tea; this effect, while statistically significant, is much smaller in magnitude compared to other regions.
Baozhong tea shows more mixed effects across regions. In the northern region, Baozhong tea commands a significantly lower price than black tea (approximately 35% lower). A similar significant discount is found in Taoyuan/Hsinchu/Miaoli (53% lower) and in the eastern region (36% lower). In contrast, the price difference between Baozhong and black tea is not statistically significant in the central region (despite a negative point estimate) and is also insignificant in the southern region. This indicates that Baozhong tea’s price penalty relative to black tea is pronounced in the north, Taoyuan/Hsinchu/Miaoli, and east, but in the central and southern areas Baozhong tea does not differ much in price from black tea.
The category of “Oriental Beauty and other teas” does not exhibit a consistent pattern and varies markedly by region. In some areas, this category actually commands a price premium over black tea: for instance, in Taoyuan/Hsinchu/Miaoli, Oriental Beauty and other teas are about 50% more expensive than black tea, and in the northern region they are roughly 40% higher in price. The southern region also shows a modest positive premium (around 24% higher than black tea). However, in the eastern region, Oriental Beauty (and other specialty teas) are associated with a significantly lower price (about 22% lower) relative to black tea. In the central region, the effect of this tea category is not significant. These mixed results suggest that the market value of Oriental Beauty and other teas is highly region-specific, potentially reflecting local consumer preferences or the regional reputation of these tea varieties.
Beyond tea type, other factors influence tea prices differently across regions. Land area (farm size) has a negative impact on price in several regions: in the north, central, and southern areas, larger farm size is associated with significantly lower tea prices (perhaps indicating economies of scale or a focus on volume over boutique quality). In the Taoyuan/Hsinchu/Miaoli and eastern regions, farm size has no significant effect on price. The availability of processing facilities also shows region-specific effects. Having more general facilities (e.g., basic processing equipment) correlates with a slight price decrease in the central region (significant negative coefficient), whereas in the southern region general facilities are linked to a significant increase in price. In other regions, general facilities do not significantly affect price. On the other hand, specialized facilities (advanced or specific equipment) are associated with lower prices in the north and central regions (suggesting that producers with more specialized infrastructure in these areas might be lowering prices, possibly to utilize greater capacity), while in the east, south, and Taoyuan/Hsinchu/Miaoli regions, specialized facilities show no significant price effect.
Labor inputs also play a role. The number of full-time employees is positively associated with tea prices in the northern and eastern regions – farms with more full-time workers tend to achieve higher prices in these areas (perhaps due to better management or higher-quality processing). This effect is significant and particularly strong in the east. However, full-time labor has no significant impact on price in Taoyuan/Hsinchu/Miaoli, central, or southern regions. In addition, having more part-time employees contributes to higher prices in the north, Taoyuan/Hsinchu/Miaoli, and especially the central region (where even small additions of part-time labor correspond to a statistically significant price increase). This could indicate that additional labor (even part-time) helps improve harvest or processing quality up to a point. In the eastern and southern regions, part-time labor does not have a significant effect on price. Meanwhile, elevation of the tea farm is an important positive factor in certain areas: higher elevation tea gardens command significantly higher prices in Taoyuan/Hsinchu/Miaoli, central, and eastern regions. This aligns with the premium often associated with high-mountain teas in these regions. In the northern and southern regions, however, elevation differences do not translate into a significant price premium, possibly due to smaller elevation variations or lesser market emphasis on elevation there.
Certification and market outlet variables also exhibit notable regional patterns. Organic certification yields a strong positive effect on price across most regions, confirming that organically produced tea can fetch higher prices. The premium for organic certification is highest in Taoyuan/Hsinchu/Miaoli, where organically certified tea is priced about 119% higher than non-certified tea. Significant organic premiums are also observed in the northern region (69% higher), central region (48% higher), and eastern region (39% higher). In contrast, in the southern region, organic certification does not have a significant impact on price – the coefficient is near zero and not statistically significant, suggesting that southern tea prices do not currently benefit from organic labeling.
Other forms of certification show less consistent benefits. Traceability certification does not confer a clear price premium; in fact, in the Taoyuan/Hsinchu/Miaoli region, having traceability certification is associated with a significantly lower price (approximately a 48% decrease, which is counterintuitive and may indicate an idiosyncratic local market effect or possibly that only larger, lower-priced producers pursue this certification in that region). In all other regions, the traceability label’s effect is statistically insignificant. Similarly, origin certification (geographical indication or place-of-origin labels) has no significant influence on price in any region according to these results. This suggests that, unlike organic certification, simply certifying the origin of the tea does not uniformly translate into higher prices at the farm level.
Finally, the effect of being oriented toward export markets varies by region. In the northern region, producers who export a portion of their tea have significantly lower domestic prices – about 59% lower than non-exporters, all else equal. This substantial negative effect might imply that northern exporters sell their high-end product abroad and/or operate at larger scale with lower prices domestically. In the central and southern regions, by contrast, export orientation is associated with slightly higher prices (approximately + 16% in central and + 9% in southern), although these positive effects are only marginally significant. In the Taoyuan/Hsinchu/Miaoli and eastern regions, exporting does not have a significant impact on price.
In summary, the determinants of tea price show clear regional heterogeneity. Tea type effects (green, oolong, Baozhong, etc.) vary in magnitude across different areas, with green and oolong teas consistently priced lower than black tea especially in central and northern Taiwan’s satellite regions. Oriental Beauty and other specialty teas can either command a premium or suffer a discount depending on the locale. Farm characteristics such as size, labor, and facilities influence prices in some regions but not others, and the premium for high-elevation tea is evident in regions known for mountain teas. Importantly, organic certification stands out as a major positive driver of price in nearly every region except the south, whereas traceability and origin labels do not guarantee higher prices. The negative price association with exporting in the north versus minor positive effects elsewhere further highlights that market structure and focus differ by region.
4.4. The influence of elevation
To further investigate the impact of elevation on tea prices, this study analyzed tea cultivated in ground-level, mid-elevation, and high-elevation environments. In Taiwan, production areas located at elevation above 1,000 m, produce high mountain tea. Similar classifications exist in related Chinese literature, where tea gardens at elevation of 600 to 800 m are considered mid-mountain tea gardens, while those between 1,000 and 1,300 m qualify as high-mountain gardens (Wang et al., Reference Wang, Du, Nie, Zhang, Tan and Li2022a). The cool climate and substantial diurnal temperature variation in high-elevation areas contribute to the unique flavors of tea produced there, generally resulting in higher quality. The rarity of tea produced in these challenging environments, combined with the increased production and transportation costs, contributes to its distinctiveness and high market value, ultimately driving up its price.
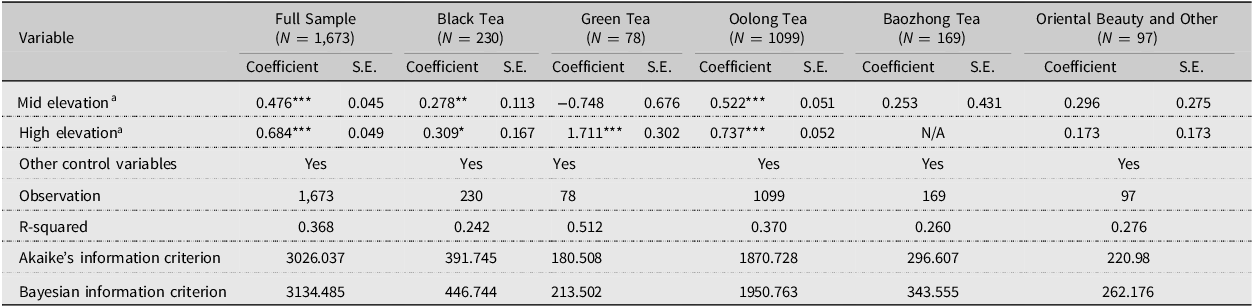
Table 6 shows that elevation significantly influences tea prices. In the full sample, mid-elevation (600 to 1,000 m) and high-elevation (above 1,000 m) teas command price premiums of about 61 and 98%, respectively. By tea type, the impact varies. Black tea shows a smaller elevation effect: mid- and high-elevation black teas are priced roughly 32 and 36% higher, respectively. Green tea is highly sensitive to elevation: high-elevation green tea is about 449% more expensive, whereas mid-elevation has no significant effect. Oolong tea prices rise with elevation: mid-elevation oolong is 68.5% higher, and high-elevation oolong 109% higher, reflecting a preference for high-mountain oolong. For Baozhong tea, mid-elevation has no significant effect and high-elevation data is unavailable. Oriental Beauty and other teas also exhibit no significant elevation-related price differences.
Empirical results by heterogeneity of elevation

Table 6 Long description
The table presents data on how elevation affects tea prices for various tea types. It includes coefficients, standard errors, and observations for full sample and specific tea types: black tea, green tea, oolong tea, Baozhong tea, and Oriental Beauty and Other teas. The table has 10 rows and 12 columns, with headers for variables, coefficients, standard errors, and observations. Key trends show that elevation significantly influences tea prices, with high-elevation teas generally commanding higher price premiums. For the full sample, mid-elevation teas have a 61% price premium, and high-elevation teas have a 98% premium. Black tea shows smaller elevation effects, with mid- and high-elevation teas priced 32% and 36% higher, respectively. Green tea is highly sensitive to elevation, with high-elevation green tea being 449% more expensive. Oolong tea prices rise with elevation, with mid-elevation oolong being 68.5% higher and high-elevation oolong 109% higher. Baozhong tea shows no significant effect for mid-elevation, and high-elevation data is unavailable. Oriental Beauty and Other teas exhibit no significant elevation-related price differences. The table also includes R-squared values, Akaike's information criterion, and Bayesian information criterion for each tea type.
a The reference group for elevation classification is ground-level, corresponding to tea gardens located at elevation under 600 meters; mid-elevation refers to tea gardens between 600 and 1,000 m, and high-elevation refers to tea gardens above 1,000 m.
Note: ***, **, and *denote significance at the 1, 5, and 10% levels, respectively; regression results are estimated with heteroscedasticity-robust standard errors.
4.5. The influence of organic certification on tea prices
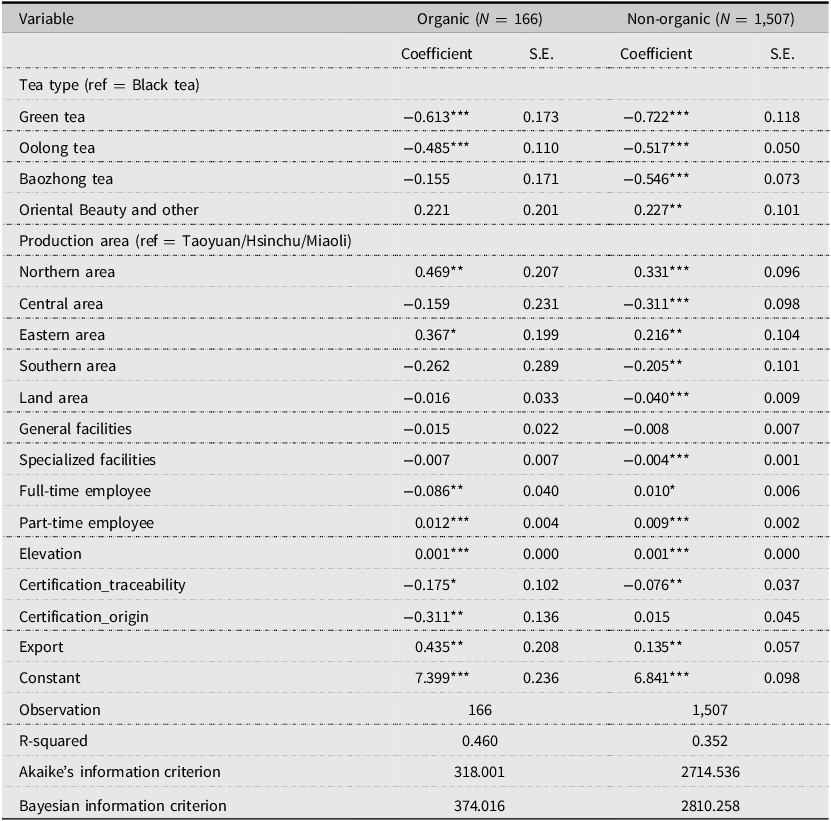
Table 7 compares how various factors affect organic tea prices versus non-organic tea prices, highlighting both differences and similarities between the two categories. In both markets, non-black tea varieties (green, oolong, and Baozhong) are sold at a discount compared to black tea (the reference type). However, these discounts are consistently smaller for organic teas. For example, organic green and oolong teas are roughly 38–46% cheaper than black tea, whereas their non-organic counterparts are about 40–51% cheaper. This suggests that organic versions of green and oolong tea retain slightly more value. Baozhong tea shows an even greater divergence: non-organic Baozhong is significantly cheaper than black tea (around 42% lower), while organic Baozhong’s price is not significantly different from black tea. This implies the organic label helps narrow the price gap for Baozhong. Oriental Beauty tea presents a contrasting pattern: it does not command a premium in the organic segment, whereas conventional Oriental Beauty is priced about 25% higher than black tea. In other words, the organic version of Oriental Beauty does not further elevate its price, while the non-organic version already enjoys a substantial premium in the market.
Empirical results of organic certification

Table 7 Long description
The table presents empirical results of organic certification, comparing how various factors affect organic tea prices versus non-organic tea prices. It includes data for different tea types, production areas, land area, general and specialized facilities, full-time and part-time employees, elevation, certification traceability, certification origin, and export status. The table has 23 rows and 8 columns, with columns labeled as Variable, Organic (N = 166) Coefficient, Organic (N = 166) S.E., Non-organic (N = 1,507) Coefficient, and Non-organic (N = 1,507) S.E. Key trends include discounts for non-black tea varieties in both markets, with smaller discounts for organic teas. For example, organic green and oolong teas are roughly 3846% cheaper than black tea, while non-organic counterparts are about 4051% cheaper. Baozhong tea shows a significant price gap narrowing for organic versions. Oriental Beauty tea does not command a premium in the organic segment but does in the non-organic segment.
Note: ***, **, and *denote significance at the 1, 5, and 10% levels, respectively; regression results are estimated with heteroscedasticity-robust standard errors.
Several certification and market factors also influence organic and non-organic tea prices differently. Traceability certification is associated with slightly lower prices in both categories, with a modest negative impact in organic (−16%*) and a smaller drop in non-organic teas (−7%). This suggests that traceability alone adds limited value in either case. Origin certification shows a negative effect on organic tea prices (around −27%) but no significant effect on non-organic prices, indicating that an origin label might detract from organic tea’s price advantage or is less valued when a tea is organic. Export status yields one of the largest contrasts: organic teas earn a strong price premium when exported (over + 50%), whereas exported non-organic teas see only a modest increase (around + 14%). This highlights that organic certification greatly boosts tea value in international markets. Overall, while many determinants (like tea type and certain certifications) affect both organic and conventional tea prices in a qualitatively similar direction, the magnitude and significance of their impacts differ. Organic teas tend to maintain higher relative prices for certain types and benefit more from export markets, a pattern that aligns with previous studies on organic premiums in tea pricing (Hajra, Reference Hajra2017; Liu et al., Reference Liu, Chiang, Yap and Lin2024).
5. Conclusion
This study offers a comprehensive assessment of the factors driving tea prices in Taiwan using a robust hedonic pricing framework. Leveraging a unique nationwide dataset of tea producers, we find clear evidence that both regional origin and product characteristics significantly influence market prices. Regionally, teas from the northern highland areas command the highest prices, whereas those from central and southern regions generally see lower price levels. In terms of tea variety, black tea commands higher average prices than green, oolong, or Baozhong teas, while specialty varieties like Oriental Beauty fetch the greatest premiums. High-elevation cultivation is a critical enhancer of price, especially for green and oolong teas, reflecting the market’s strong valuation of high-mountain tea quality and scarcity. Among quality and certification factors, organic certification yields a substantial price premium, confirming that consumers are willing to pay more for verified organic practices, whereas traceability certification shows no appreciable price advantage on its own. Additionally, teas destined for export markets attain higher prices.
Collectively, these findings underscore how both intrinsic attributes (such as tea variety and elevation) and credible quality signals (such as certifications) are capitalized into price, in line with hedonic pricing theory and information-asymmetry arguments. Our econometric analysis, including region-specific models and separate examinations of organic versus conventional segments, confirms that our results are robust across different contexts and sub-samples, adding confidence to the conclusions. By systematically quantifying the effects of production area, elevation, and multiple certification schemes on tea prices, this study fills an important gap in the literature. It provides one of the first holistic empirical evaluations of price determinants in Taiwan’s specialty tea sector and contributes novel evidence to the broader agricultural economics literature on geographical and quality differentiation in high-value crops.
The results carry important implications for both industry stakeholders and policymakers. Recognizing the sizable premium associated with high-elevation teas, targeted support for mountain tea cultivation is warranted, and local authorities should help producers capitalize on this advantage. The significant price boost from organic certification, especially for export-bound teas, highlights the value of expanding incentives for organic farming and promoting Taiwanese organic teas in international markets. In contrast, the negligible impact of traceability certification on price suggests that consumers currently undervalue traceability; efforts to raise consumer awareness about the safety and transparency benefits of traceability, or to integrate traceability with other trusted labels, could enhance its market credibility. By aligning these insights with strategic policies and marketing strategies, stakeholders can improve tea farmers’ income prospects and reinforce the competitiveness of Taiwan’s tea industry. These findings reinforce the study’s main conclusions and contributions, confidently demonstrating how targeted improvements in production and certification can translate into tangible economic benefits in the tea market.
Supplementary material
To view supplementary material for this article, please visit https://doi.org/10.1017/aae.2025.10033.
Data availability
The de-identified dataset supporting this study is available from the corresponding author upon reasonable request.
Author contributions
Conceptualization, S.W.; Methodology, S.W.; Formal Analysis, S.W. and Y.T.; Data Curation, S.W.; Writing—Original Draft, S.W.; Writing—Review & Editing, S.W.; Supervision, Y.T.; Funding Acquisition, S.W. and Y.T.
(In the above, S.W. refers to Szu-Yung Wang and Y.T. refers to Yi-Chen Tsai. This follows the CRediT taxonomy format as requested, indicating that Szu-Yung Wang took lead on most tasks, while Yi-Chen Tsai contributed to supervision and funding acquisition, as specified.)
Financial support
This work was supported by the National Science and Technology Council, grant number 113-2813-C-034-018-H.
Competing interests
The authors declare no conflict of interest.


 Open access