


I. INTRODUCTION
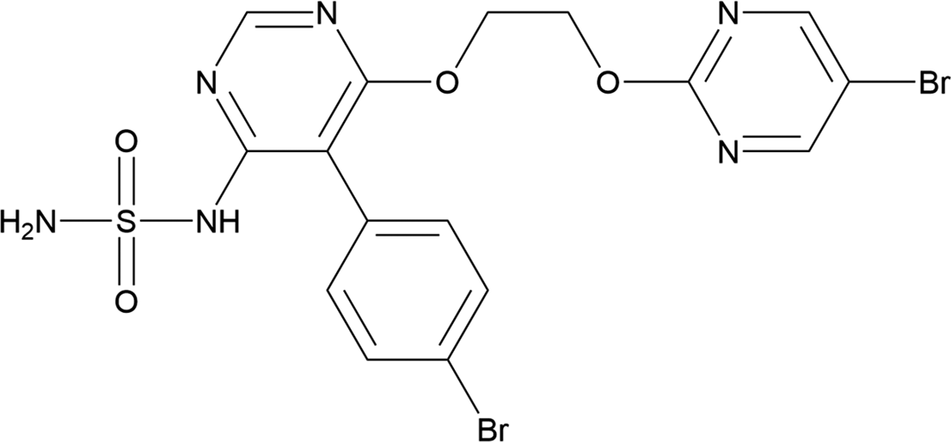
Aprocitentan (sold under the brand name Tryvio™) is used to treat hypertension (high blood pressure). Aprocitentan functions as a receptor antagonist targeting endothelin A and B receptors. The systematic name (CAS Registry Number 1103522-45-7) is 5-(4-bromophenyl)-4-[2-(5-bromopyrimidin-2-yl)oxyethoxy]-6-(sulfamoylamino)pyrimidine. A two-dimensional molecular diagram of aprocitentan is shown in Figure 1.
The two-dimensional structure of aprocitentan.
Aprocitentan and processes for its preparation are claimed in U.S. Patent 8324232 B2 (Bolli et al., Reference Bolli, Boss and Treiber2012; Actelion Pharmaceuticals Ltd.). Crystalline Forms A, C, D, E (acetonitrile solvate), J, K (DMSO solvate), and L (ethanol solvate) are claimed in International Patent Application WO 2018/154101 A1 (Bolli et al., Reference Bolli, Kohler, Schindelholz and Von Raumer2018; Idorsia Pharmaceuticals Ltd.). The U.S. equivalent is US 2020/0002317 A1 (Bolli et al., Reference Bolli, Kohler, Schindelholz and Von Raumer2020; Idorsia Pharmaceuticals Ltd.). A new crystalline form of aprocitentan is claimed in International Patent Application WO 2021/088645 A1 (Chen and Zhu, Reference Chen and Zhu2021; Crystal Pharmaceutical [Suzhou] Co.). Several other crystalline forms of aprocitentan and solvates are claimed in International Patent Application WO 2021/237004 A1 (Bibulić and Matećić, Reference Bibulić and Matećić2021; Teva Pharmaceuticals).
This work was carried out as part of a project (Kaduk et al., Reference Kaduk, Crowder, Zhong, Fawcett and Suchomel2014) to determine the crystal structures of large-volume commercial pharmaceuticals and include high-quality powder diffraction data for them in the Powder Diffraction File (PDF®; Kabekkodu et al., Reference Kabekkodu, Dosen and Blanton2024).
II. EXPERIMENTAL
Aprocitentan was a commercial reagent, purchased from TargetMol (Batch #T7817) and was used as received. The white powder was packed into a 0.5-mm-diameter Kapton capillary and rotated during the measurement at ~2 Hz. The powder pattern was measured at 298(1) K at the Wiggler Low Energy Beamline (Leontowich et al., Reference Leontowich, Gomez, Diaz Moreno, Muir, Spasyuk, King, Reid, Kim and Kycia2021) of the Brockhouse X-Ray Diffraction and Scattering Sector of the Canadian Light Source using a wavelength of 0.819826(2) Å (15.1 keV) from 1.6 to 75.0° 2θ with a step size of 0.0025° and a collection time of 3 minutes. The high-resolution powder diffraction data were collected using eight Dectris Mythen2 X series 1K linear strip detectors. NIST SRM 660b LaB6 was used to calibrate the instrument and refine the monochromatic wavelength used in the experiment.
The pattern was indexed using N-TREOR as incorporated into EXPO2014 (Altomare et al., Reference Altomare, Cuocci, Giacovazzo, Moliterni, Rizzi, Corriero and Falcicchio2013) on a primitive triclinic unit cell with a = 11.74097, b = 10.68446, c = 9.66628 Å, α = 110.461, β = 92.278, γ = 113.498°, V = 1,019.0 Å3, and Z = 2. The space group was assumed to be P-1, which was confirmed by the successful solution and refinement of the structure. A reduced cell search of the Cambridge Structural Database (Groom et al., Reference Groom, Bruno, Lightfoot and Ward2016) yielded one hit, but no structures of aprocitentan or its derivatives.
An aprocitentan molecule was downloaded from PubChem (Kim et al., Reference Kim, Chen, Cheng, Gindulyte, He, He and Li2023) as Conformer3D_COMPOUND_CID_25099191.sdf. It was converted to a *.mol2 file using Mercury (Macrae et al., Reference Macrae, Sovago, Cottrell, Galek, McCabe, Pidcock and Platings2020). The crystal structure was solved using Monte Carlo simulated annealing techniques as implemented in EXPO2014 (Altomare et al., Reference Altomare, Cuocci, Giacovazzo, Moliterni, Rizzi, Corriero and Falcicchio2013). For the structure solution, a pattern with 100,000 counts subtracted from each point was used.
Rietveld refinement was carried out with GSAS-II (Toby and Von Dreele, Reference Toby and Von Dreele2013). Only the 4.0 to 40.0° portion of the pattern was included in the refinements (d min = 1.198 Å). The specimen is highly absorbing in addition to fluorescing, so an absorption model of μR = 0.87 (calculated using the tool on the 11-BM website) was included. All non-H-bond distances and angles were subjected to restraints, based on a Mercury/Mogul Geometry Check (Bruno et al., Reference Bruno, Cole, Kessler, Luo, Motherwell, Purkis and Smith2004; Sykes et al., Reference Sykes, McCabe, Allen, Battle, Bruno and Wood2011). The Mogul average and standard deviation for each quantity were used as the restraint parameters. The three aromatic rings were restrained to be planar. The restraints contributed 3.6% to the overall χ 2. Most of the hydrogen atoms were included in calculated positions, which were recalculated during the refinement using Materials Studio (Dassault Systèmes, 2023). The positions of the H atoms H40 and H41 of the sulfonamide group were refined, subject to bond distance and angle restraints. The two Br atoms were refined anisotropically. The U iso of the other heavy atoms were grouped by chemical similarity. The U iso for the H atoms were fixed at 1.3× the U iso of the heavy atoms to which they are attached. The peak profiles were described using an isotropic microstrain model. The background was modeled using a six-term shifted Chebyshev polynomial, with a peak at 10.92° to model the scattering from the Kapton capillary and any amorphous component.
The final refinement of 132 variables using 14,401 observations and 77 restraints yielded the residual R wp = 0.00934. The exceptionally low R wp results from the high background (from Br fluorescence), which is fitted very well. The largest peak (0.84 Å from N9) and hole (0.59 Å from O7) in the difference Fourier map were 0.45(11) and − 0.44(11) eÅ−3, respectively. The final Rietveld plot is shown in Figure 2. The largest features in the normalized error plot are in the positions and shapes of some of the strong low-angle peaks. These misfits probably indicate subtle changes in the specimen during the measurement. It would be surprising if a molecule that contains two C–Br bonds did not exhibit beam damage.
The Rietveld plot for aprocitentan Form A. The blue crosses represent the observed data points, and the green line is the calculated pattern. The cyan curve is the normalized error plot, and the red line is the background curve. The vertical scale is the logarithm of the counts.

The crystal structure of aprocitentan was optimized (fixed experimental unit cell) with density functional theory techniques using VASP 6.0 (Kresse and Furthmüller, Reference Kresse and Furthmüller1996) through the MedeA graphical interface (Materials Design, 2024). The calculation was carried out on 32 cores of a 144-core (768-GB memory) HPE Superdome Flex 280 Linux server at North Central College. The calculation used the GGA-PBE functional, a plane wave cutoff energy of 400.0 eV, and a k-point spacing of 0.5 Å−1, leading to a 2 × 2 × 2 mesh, and took ~4.7 hours. Single-point density functional calculations (fixed experimental cell) and population analysis were carried out using CRYSTAL23 (Erba et al., Reference Erba, Desmarais, Casassa, Civalleri, Donà, Bush and Searle2023). The basis sets for the H, C, and O atoms in the calculation were those of Gatti et al. (Reference Gatti, Saunders and Roetti1994), and the basis sets for S and Br were those of Peintinger et al. (Reference Peintinger, Vilela Oliveira and Bredow2013). The calculations were run on a 3.5-GHz PC using eight k-points and the B3LYP functional and took ∼2.3 hours.
III. RESULTS AND DISCUSSION
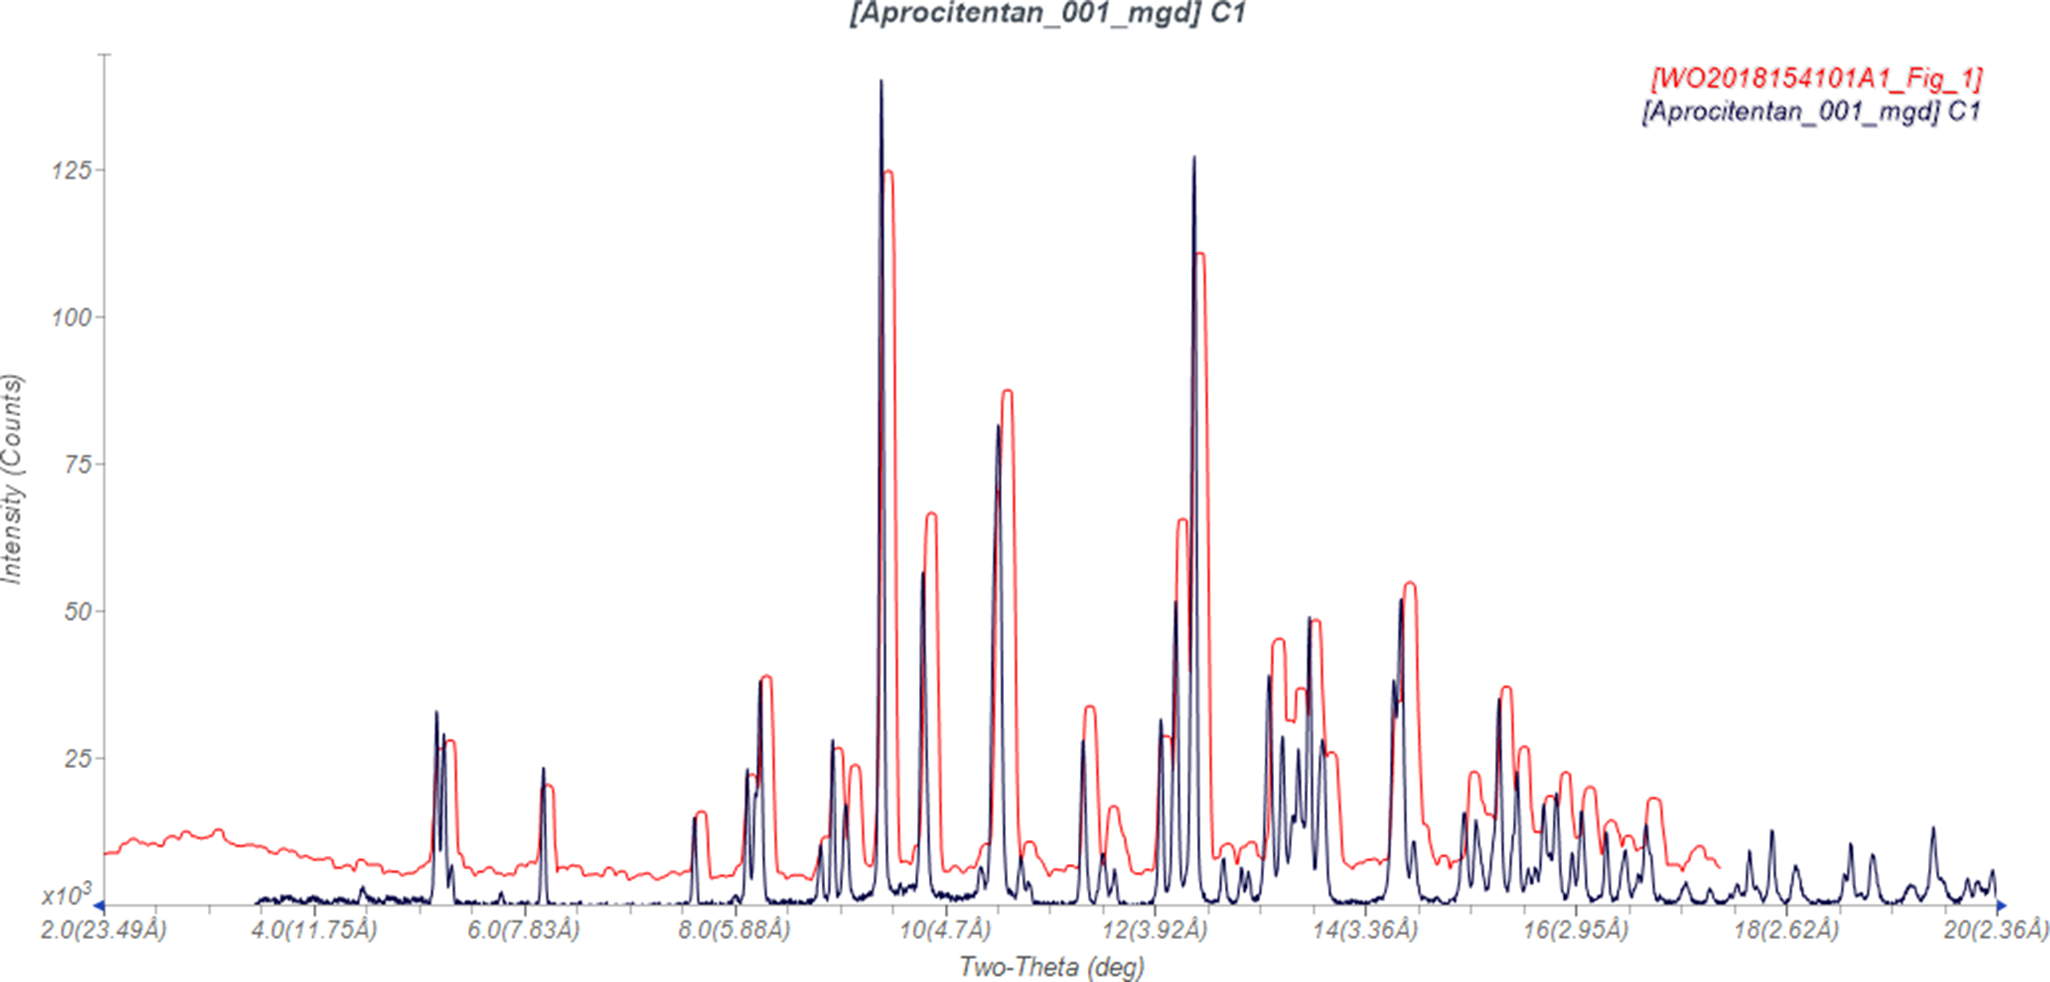
This synchrotron powder pattern of aprocitentan matches the diffraction pattern reported for Form A by Bolli et al. (Reference Bolli, Kohler, Schindelholz and Von Raumer2018) (Figure 3) well enough to conclude that they represent the same material and, thus, that our sample is Form A.
Comparison of the synchrotron pattern from this study of aprocitentan Form A (black) to that reported by Bolli et al. (Reference Bolli, Kohler, Schindelholz and Von Raumer2018) (red). The literature pattern (measured using Cu K α radiation) was digitized using UN-SCAN-IT (Silk Scientific, 2013) and converted to the synchrotron wavelength of 0.819826(2) Å using JADE Pro (MDI, 2024). Image generated using JADE Pro (MDI, 2024).
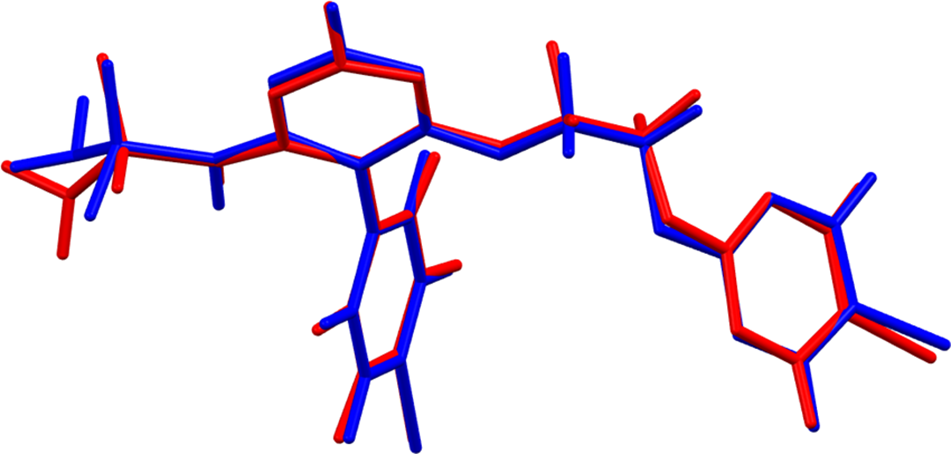
The root-mean-square difference of the non-H atoms in the Rietveld-refined and VASP-optimized structures, calculated using the Mercury CSD-Materials/Search/Crystal Packing Similarity tool, is 0.334 Å (Figure 4). The root-mean-square Cartesian displacement of the non-H atoms in the Rietveld-refined and VASP-optimized structures of the molecule, calculated using the Mercury Calculate/Molecule Overlay tool, is 0.297 Å (Figure 5). The agreements are at the upper end of the normal range for correct structures (van de Streek and Neumann, Reference van de Streek and Neumann2014). The largest difference is 0.823 Å at N11. Excluding this atom, the rms difference is 0.251 Å, and the main difference is in the orientation of the SO2 group; the agreement of the rest of the molecule is much better. The position and orientation of the sulfonamide group differ significantly between the refined and optimized structures. The asymmetric unit is illustrated in Figure 6. We will discuss both structures below.
Comparison of the Rietveld-refined (colored by atom type) and VASP-optimized (light green) structures of aprocitentan Form A using the Mercury CSD-Materials/Search/Crystal Packing Similarity tool. The root-mean-square Cartesian displacement is 0.334 Å. Image generated using Mercury (Macrae et al., Reference Macrae, Sovago, Cottrell, Galek, McCabe, Pidcock and Platings2020).
Comparison of the Rietveld-refined (red) and VASP-optimized (blue) structures of aprocitentan Form A using the Mercury Calculate/Molecule Overlay tool. The root-mean-square Cartesian displacement is 0.297 Å. Image generated using Mercury (Macrae et al., Reference Macrae, Sovago, Cottrell, Galek, McCabe, Pidcock and Platings2020).
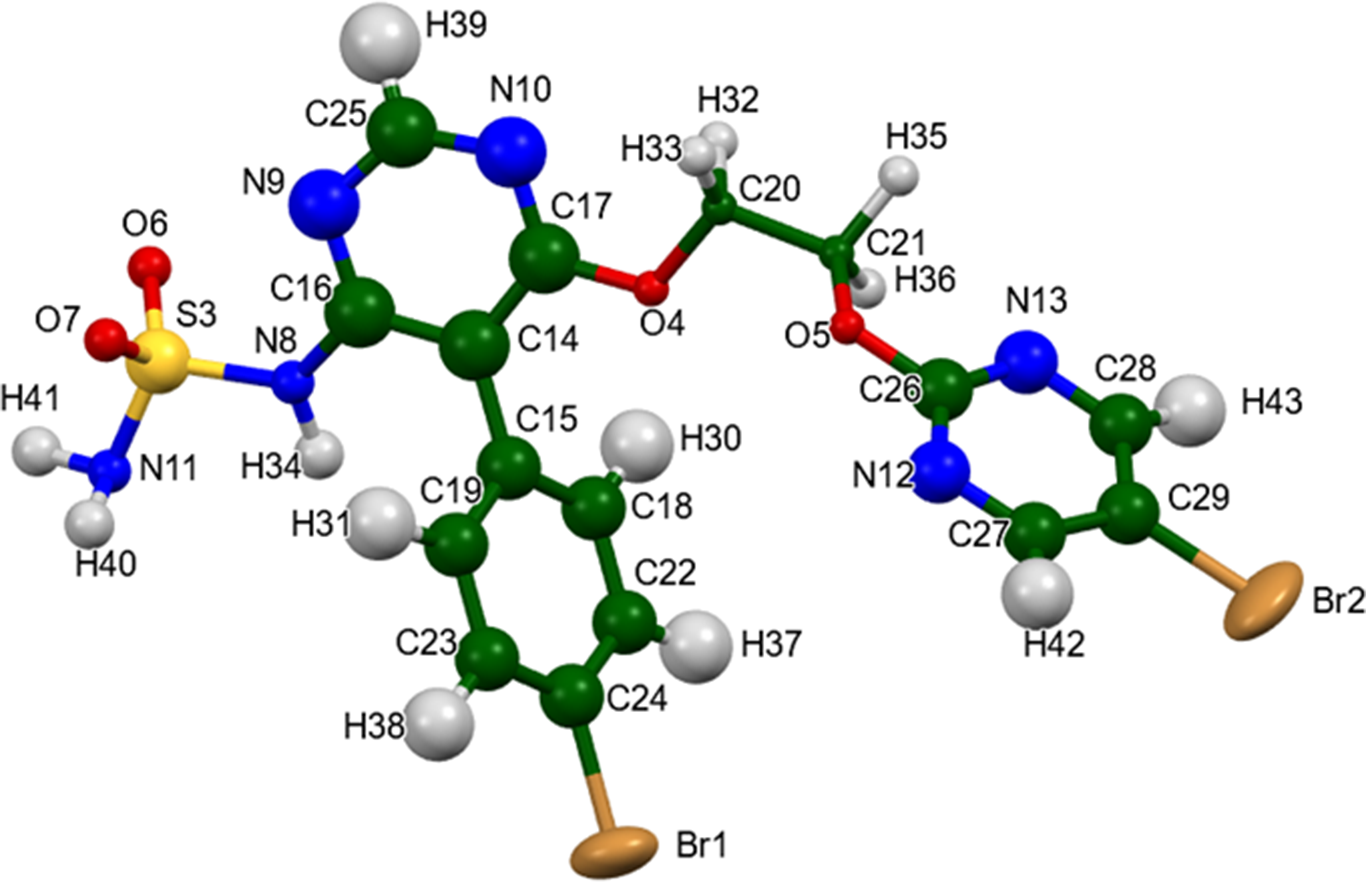
The asymmetric unit of aprocitentan Form A, with the atom numbering. The atoms are represented by 50% probability spheroids/ellipsoids. Image generated using Mercury (Macrae et al., Reference Macrae, Sovago, Cottrell, Galek, McCabe, Pidcock and Platings2020).
All of the bond distances, bond angles, and most of the torsion angles in the refined structure fall within the normal ranges indicated by a Mercury Mogul Geometry check (Macrae et al., Reference Macrae, Sovago, Cottrell, Galek, McCabe, Pidcock and Platings2020). The torsion angles involving rotation about the S3–N8 bond lie slightly outside the gauche/trans distributions of a few similar torsion angles. In the VASP-optimized structure, the S3–N8 bond distance of 1.691 Å (average = 1.628(17) Å; Z-score = 3.7) and the N11–S3–N8 angle of 96.0° (average = 108.9(22)°; Z-score = 5.8) are flagged as unusual. The torsion angles involving rotation about the S3–N8 bond are likewise flagged as unusual. Too-long S–N bonds in the density functional theory (DFT) optimization of sulfonamides have been observed by others (Vibha et al., Reference Vibha, Prachality, Reddy, Ravikantha and Thipperudrappa2023). Even a more sophisticated VASP calculation (0.25 Å−1 k-point spacing, resulting in a 3 × 3 × 3 mesh, and including a DFT + D3 dispersion model) yielded the same geometry. One of us (J.A.K.) has previously encountered molecules for which the DFT-optimized geometry of a sulfonamide group was suspect. With the information currently available to use, we do not know which (if either) of the two structures is correct. Since the purpose of this study is to generate a pattern for PDF®, we report both structures and will let the reader decide which is appropriate.
Quantum chemical geometry optimizations of isolated aprocitentan molecule (DFT/B3LYP/6-31G*/water) using Spartan ‘24 (Wavefunction, Inc., 2023) indicated that the VASP-optimized molecule is lower in energy, but that both converge to a similar local minimum, which is more similar to the refined structure. The global minimum-energy conformation is much more compact (folded on itself), showing that intermolecular interactions are important to determining the solid-state conformation. The refined structure is more chemically reasonable.
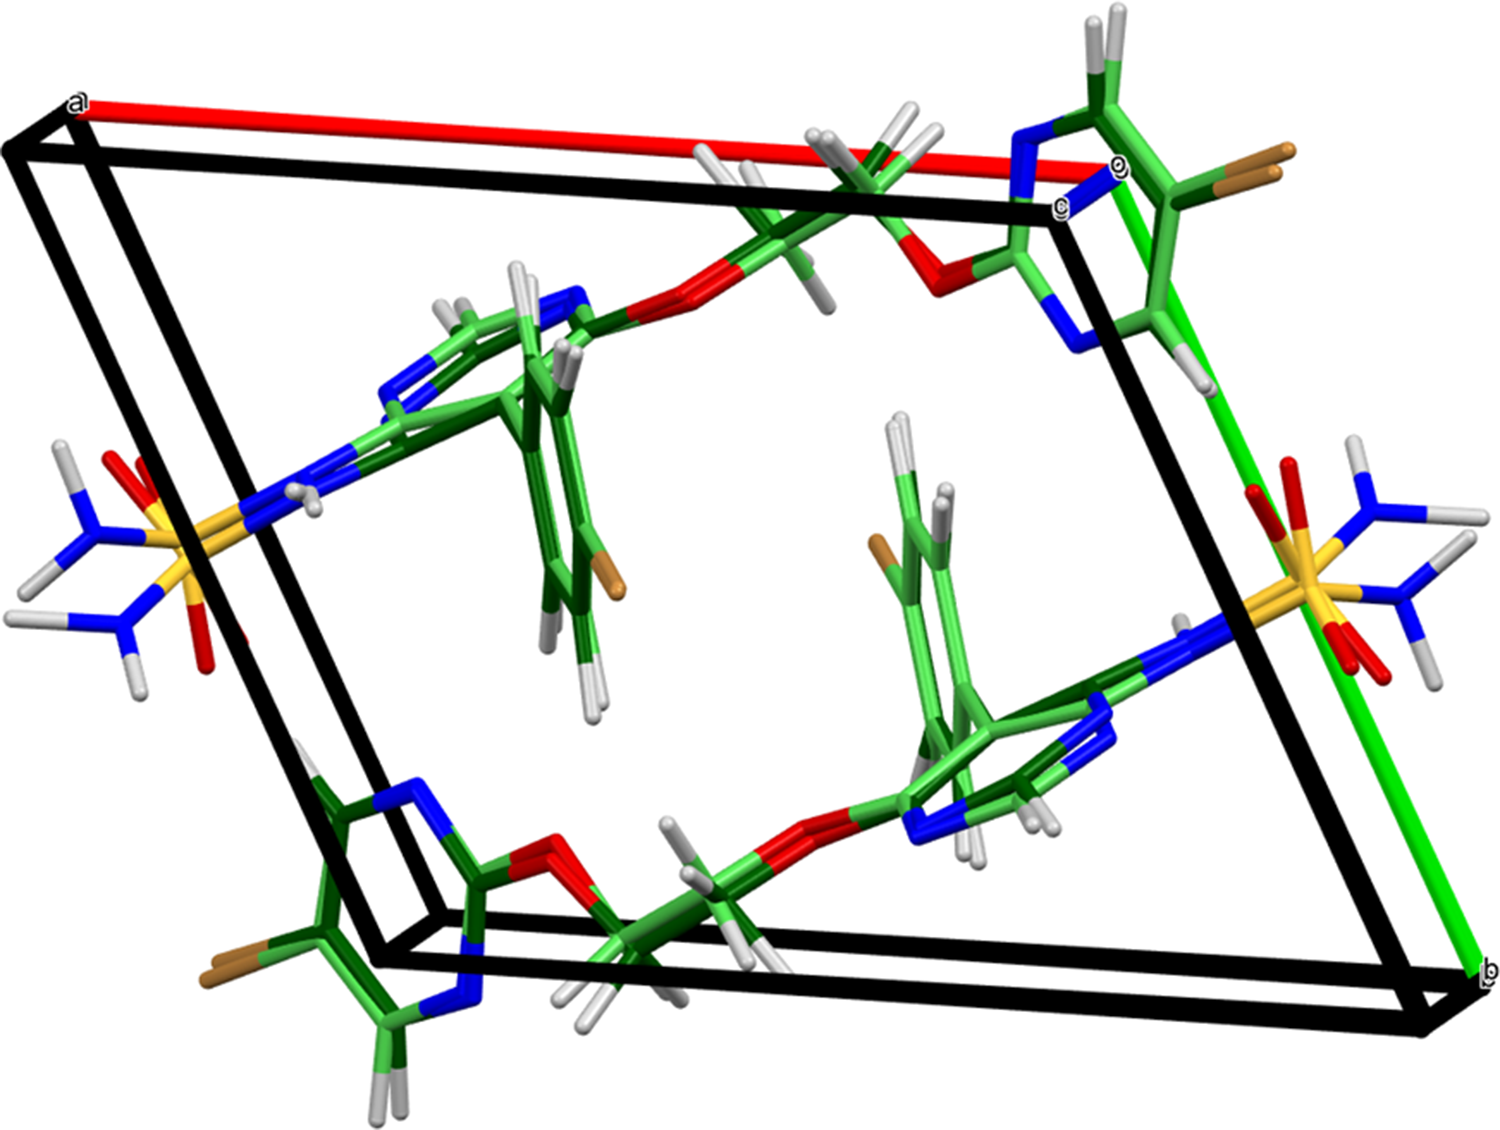
The crystal structure (Figure 7) consists of layers of aprocitentan molecules, approximately along the 1,-7,7 plane. Hydrogen bonds (discussed below) link the molecules within these layers. The mean plane of the bromophenyl ring is approximately 5,-1,1, the mean plane of the bromopyrimidine ring is approximately 2,-1,1, and the mean plane of the pyrimidine ring is approximately -3,5,-1. The Mercury Aromatics Analyser indicates only weak interactions between the bromophenyl rings.
The crystal structure of aprocitentan Form A, viewed down the c-axis. Image generated using Diamond (Crystal Impact, Reference Putz and Brandenburg2023).

Analysis of the contributions to the total crystal energy of the structure using the Forcite module of Materials Studio (Dassault Systèmes, 2023) indicates that the intramolecular energy is dominated by angle distortion terms. The intermolecular energy is dominated by electrostatic attractions, which, in this force field-based analysis, also include hydrogen bonds.
A geometrical analysis of the refined structure indicates only one hydrogen bond (Table I). This N–H···N hydrogen bond links two molecules into a dimer, with a graph set (Etter, Reference Etter1990; Bernstein et al., Reference Bernstein, Davis, Shimoni and Chang1995; Motherwell et al., Reference Motherwell, Shields and Allen2000) R2,2(8). The DFT-optimized structure contains two N–H···N hydrogen bonds (Table II), as well as a small number of non-classical hydrogen bonds.
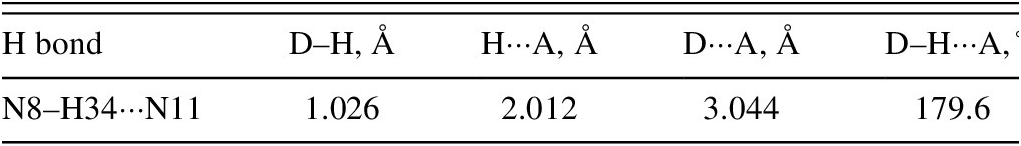
Hydrogen bond in the Rietveld-refined structure of aprocitentan
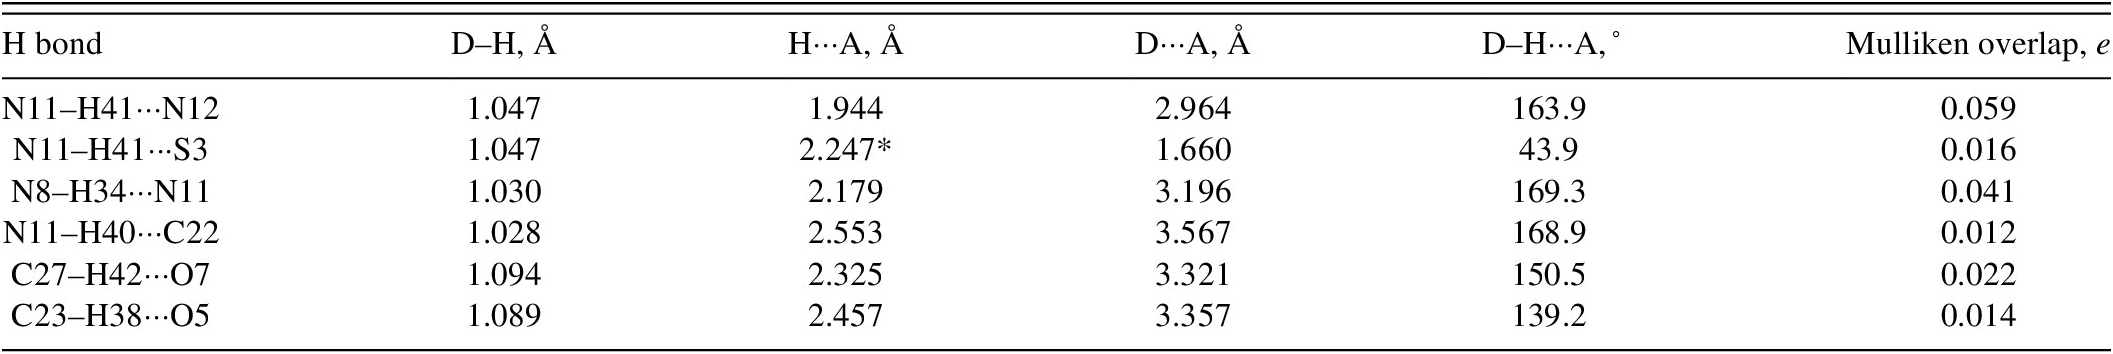
Hydrogen bonds (VASP/CRYSTAL23) in the optimized structure of aprocitentan. * = intramolecular
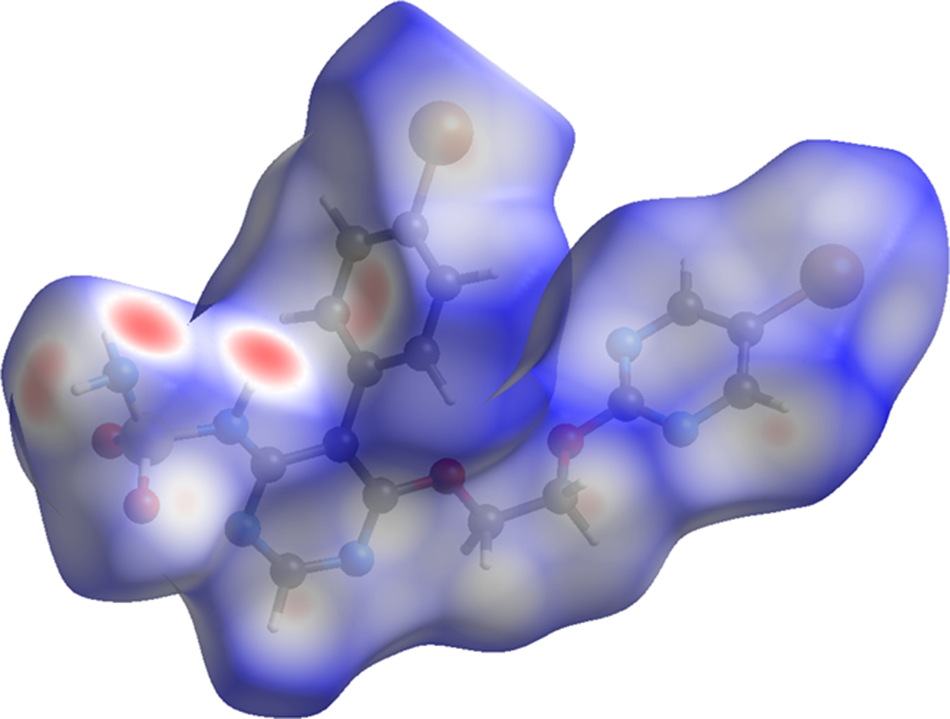
The volume enclosed by the Hirshfeld surface of aprocitentan (Figure 8; Hirshfeld, Reference Hirshfeld1977; Spackman et al., Reference Spackman, Turner, McKinnon, Wolff, Grimwood, Jayatilaka and Spackman2021) is 498.90 Å3, which is 98.06% of half the unit cell volume. The packing density is thus typical. The only significant close contacts (red in Figure 8) involve the hydrogen bonds. The volume/non-hydrogen atom is typical at 17.5 Å3.
The Hirshfeld surface of aprocitentan Form A. Intermolecular contacts longer than the sums of the van der Waals radii are colored blue, and contacts shorter than the sums of the radii are colored red. Contacts equal to the sums of radii are white. Image generated using CrystalExplorer (Spackman et al., Reference Spackman, Turner, McKinnon, Wolff, Grimwood, Jayatilaka and Spackman2021).
The Bravais–Friedel–Donnay–Harker (Bravais, Reference Bravais1866; Friedel, Reference Friedel1907; Donnay and Harker, Reference Donnay and Harker1937) algorithm suggests that we might expect isotropic morphology for aprocitentan. A second-order spherical harmonic model was included in the refinement. The texture index was 1.010(0), indicating that the preferred orientation was insignificant in this rotated capillary specimen.
ACKNOWLEDGEMENTS
We thank Adam Leontowich for his assistance in the data collection. We also thank the ICDD team – Megan Rost, Steve Trimble, and Dave Bohnenberger – for their contribution to research, sample preparation, and in-house XRD data collection and verification.
DATA AVAILABILITY STATEMENT
The powder pattern of aprocitentan from this synchrotron dataset has been submitted to the International Centre for Diffraction Data (ICDD) for inclusion in PDF®. The Crystallographic Information Framework (CIF) files containing the results of the Rietveld refinement (including the raw data) and the DFT geometry optimization were deposited with the ICDD. The data can be requested at pdj@icdd.com.
FUNDING STATEMENT
Part or all of the research described in this paper was performed at the Canadian Light Source, a national research facility of the University of Saskatchewan, which is supported by the Canada Foundation for Innovation (CFI), the Natural Sciences and Engineering Research Council (NSERC), the Canadian Institute of Health Research (CIHR), the Government of Saskatchewan, and the University of Saskatchewan. This work was partially supported by the International Centre for Diffraction Data.
CONFLICTS OF INTEREST
The authors have no conflicts of interests to declare.


 Open access