




Introduction
The rapid population growth accompanied by natural resource degradation, dependence on rainfed agriculture and impact of climate change has constrained food security of developing countries such as Ethiopia (Endalew et al., Reference Endalew, Muche and Tadesse2015; Reynolds et al., Reference Reynolds, Waddington, Anderson, Chew, True and Cullen2015; Mekuria, Reference Mekuria2018). Increased agricultural production in developing countries mainly comes from area expansion and little from technological interventions (Tilman et al., Reference Tilman, Balzer, Hill and Befort2011; Van Loon et al., Reference Van Loon, Hijbeek, ten Berge, DeSy, tenBroeke, Solomon and van Ittersum2019). Small shares of land by farmers due to population pressure and also its degradation limit production and productivity of crops in Ethiopia, which altogether call for designing strategies to maximize productivity per unit of existing cultivated land (Gebreselassie, Reference Gebreselassie2006; Najafi et al., Reference Najafi, Devineni, Khanbilvardi and Kogan2018). Additionally, food production capacity of farm land, change in crop yield and the existing yield gaps need to be evaluated in a holistic approach to provide information for policy makers and farmers to optimize the management system of their farm lands and increase food production by reducing further area expansion (van Wart et al., Reference Van Wart, Kersebaum, Peng, Milnera and Cassmana2013a; Anderson et al., Reference Anderson, Johansen and Siddique2016; Najafi et al., Reference Najafi, Devineni, Khanbilvardi and Kogan2018).
Quantification of crop yield gaps (Y g) provides key information as a basis for identifying production constraints, exploring ways to increase crop productivity and prioritization of intervention areas (Chapagain and Good, Reference Chapagain and Good2015; FAO, 2017; Eash et al., Reference Eash, Fonte, Sonder, Honsdorf, Schmidt, Govaerts and Verhulst2019). Moreover, exploring existing yield gaps together with production constraints is the key for accurate assessment of future food security, land use change and productivity (Van Ittersum et al., Reference Van Ittersum, Cassman, Grassini, Wolf, Tittonell and Hochman2013). In this regard, a number of findings having global, regional and local emphasis have been reported and generated important information using different methodologies for the last few decades (Lobell et al., Reference Lobell, Cassman and Field2009; Van Wart et al., Reference Van Wart, Van Bussel, Wolf, Licker, Grassini, Nelsond, Boogaard, Gerber, Mueller, Claessens, Van Ittersum and Cassman2013b; Anderson et al., Reference Anderson, Johansen and Siddique2016; Beza et al., Reference Beza, Silva, Kooistra and Reidsma2017; Soltani et al., Reference Soltani, Alimagham, Nehbandani, Torabi, Zeinali, Zand, Vadez, Van Loon and Van Ittersum2020).
Benchmarking of potential yield (Y p) from maximum farmer yield, field experiments and crop model simulations are the three common methods to estimate potential yield of crops for employing Y g analysis (Laborte et al., Reference Laborte, de Bie, Smalinga, Moya, Boling and Van Ittersum2012; FAO and DWFI, 2015). There are different limitations when Y p is taken from maximum farmer yield and field experiments (Lobell et al., Reference Lobell, Cassman and Field2009). For instance, for the estimation of Y p from field experiments perfect growth conditions have to be implemented throughout the growing season over a number of years to reflect the effect of climatic variation, which is quite difficult to realize. Similarly, maximum farmers' yield is based on the report of individual farmers, which may be prone to data quality problems. On the contrary, crop simulation models have quite significant importance because models account for the variability of multiple years’ weather conditions and allow interactions among crops, soil, weather, water regime and management to come up with a better estimate of Y p (Van Ittersum et al., Reference Van Ittersum, Cassman, Grassini, Wolf, Tittonell and Hochman2013). Thus crop models provide the most accurate ceiling of Y p for a particular location despite having uncertainties related to parameter estimation or structural functioning (Lobell et al., Reference Lobell, Cassman and Field2009; Soltani and Sinclair, Reference Soltani and Sinclair2012; Eitzinger et al., Reference Eitzinger, Thaler, Schmid, Strauss, Ferrise, Moriondo, Bindi, Palosuo, Rötter, Kersebaum, Olesen, Patil, Aylan, Çaldag and Çaylak2013).
Sorghum (Sorghum bicolar (L.) Moench) is the fifth most important cereal crop next to maize, rice, wheat and barley globally (FAOSTAT, 2017). It is grown in semi-arid tropics including Ethiopia where other crops perform poorly, making it an important climate change resilient and food security crop (Amelework et al., Reference Amelework, Shimelis, Tongoona, Mengistu, Laing and Ayele2016; Hadebe et al., Reference Hadebe, Modi and Mabhaudhi2017a; Smale et al., Reference Smale, Assima, Kergna, Thériault and Weltzien2018; Eggen et al., Reference Eggen, Ozdogan, Zaitchik, Ademe, Foltz and Simane2019). Sorghum is the third widely cultivated cereal crop next to Teff and maize and took third rank on its productivity next to maize and wheat in Ethiopia (CSA, 2016, 2017). South Omo and Segen Area People's Zones are its production belts in Southwest Ethiopia (CSA, 2016, 2017). Most parts of this region are located in hot arid and semi-arid agro-ecological zones with recurrent droughts, which exerts a negative impact on food security of the population (Gebremichael et al., Reference Gebremichael, Quraishi and Mamo2014; Enyew and Hutjis, Reference Enyew and Hutjis2015). Hence, it is essential to deal with the existing production status of crops such as sorghum, which have better adaptation capacity to such environments (Hadebe et al., Reference Hadebe, Modi and Mabhaudhi2017a).
Bottom-up approaches, up scaling site-specific Y p and Y g estimates to regional and national scales according to Global Yield Gap Atlas (www.yieldgap.org) is praiseworthy methodology for the estimation of regional and national Y p and Y g of crops (van Wart et al., Reference Van Wart, Van Bussel, Wolf, Licker, Grassini, Nelsond, Boogaard, Gerber, Mueller, Claessens, Van Ittersum and Cassman2013b; van Bussel et al., Reference Van Bussel, Grassini, Van Wart, Wolf, Claessens, Yang, Boogaar, Groote, Saito, Cassmanb and Van Ittersum2015). Robust, calibrated and evaluated models for Y p and Y g estimates based on in-season time series of crop and soil states and weather data have paramount importance for generating valid information (Rötter et al., Reference Rötter, Palosuo, Kersebaum, Angulo, Bindi, Ewert, Ferrise, Hlavinka, Moriondo, Nendel, Olesen, Pati, Ruge, Taká and Trnka2012; Kassie et al., Reference Kassie, VanIttersum, Hengsdijk, Asseng, Wolf and Rötterd2014; Pradhan et al., Reference Pradhan, Fischer, VanVelthuizen, Reusser and Kropp2015). In this regard, estimates of sorghum water-limited yield (Y w) ranging from 0.9 to 11.1 t/ha and Y g of 4.9 t/ha were done in Ethiopia using a crop model (WOFOST) to generate data for the Global Yield Gap Atlas (Van Bussel et al., Reference Van Bussel, Grassini, Van Wart, Wolf, Claessens, Yang, Boogaar, Groote, Saito, Cassmanb and Van Ittersum2015; www.yieldgap.org). In this study, calibration of the model and simulation of Y w of sorghum were done using soil data generated from ISRIC World Soil information having 30–70% uncertainty that limits the accuracy of model simulation (https://www.isric.org/explore/soilgrids/faq-soilgrids). Furthermore, crop and management data were taken from previous studies and expert judgement, which altogether raise question on input data quality and reduce accuracy of model simulation by introducing additional uncertainty (Bao et al., Reference Bao, Hoogenboom, McClendon and Vellidis2017). In the current study, observed crop and soil data for model calibration and evaluation were taken from field experiment conducted for this purpose in Southwest Ethiopia. Furthermore, the Y w and existing Y g of sorghum in the region were addressed using two crop models (AquaCrop and DSSAT) that use different crop coefficients and simulate crop yield based on different input data requirement (Raes et al., Reference Raes, Steduto, Hsiao and Fereres2018; Hoogenboom et al., Reference Hoogenboom, Porter, Shelia, Boote, Singh, White, Hunt, Ogoshi, Lizaso, Koo, Asseng, Singels, Moreno and Jones2019a). In addition, the current yield gap analysis was linked to identification of the factors responsible for the existing yield gap in order to indicate possible areas of intervention. Hence, this study was carried out with objectives of analysing existing yield gaps and exploring major production constraints of rainfed sorghum production in Southwest Ethiopia.
Materials and methods
Description of study area
The study was conducted in two administrative zones (South Omo and Segen Area People's zones) of Southwest Ethiopia (Fig. 1), which are known for sorghum production in acreage and productivity in the region (CSA, 2016). From the cultivated land in the region, sorghum area coverage ranked second (20%) next to maize (CSA, 2020). South Omo zone has an altitude ranging from 376 to 3500 m a.s.l. and located between 35°97′–36°6′E and 4°43′–6°46′N (BoFED, 2012). Similarly, Segen Area People's zone has an altitude ranging from 501 to 3000 m a.s.l. and located between 37°1′–38°01′E and 5°17′–5°59′N. The region has a mean annual rainfall of 435–1211 mm while annul maximum and minimum temperature ranges from 27.8 to 33.7 and 14.4 to 23.7°C, respectively.
Map of study area. SNNPR, Southern Nations Nationalities and Peoples’ Regional State.

Description of the field experiment
A field experiment was conducted during the main cropping season (February to June) for 2 years (2018 and 2019) to collect crop and soil data for model calibration and evaluation. The experiments were run at two locations, Jinka Agricultural Research Centre having an altitude of 1380 m a.s.l. (hereafter called Jinka) and Kako Farmers Training Centre having elevation of 1196 m a.s.l. found in Benatsemay district (hereafter called Benatsemay), in South Omo zone, Southwest Ethiopia (Fig. 1). Benatsemay and Jinka were selected to represent low land and areas near-mid land conditions where sorghum is commonly produced in the region, respectively. The study involved two improved sorghum cultivars (Melkam and Teshale) that were introduced to the area by Ethiopian Institute of Agricultural research. Both cultivars are adopted by farmers in the region although still many used their local cultivars. Teshale is relatively high yielder, more susceptible to bird attack and have short storage life compared to Melkam. On the contrary, Melkam has short plant height and mature relatively earlier than Teshale (Jinka, unpublished). Four rates (0 50, 100 and 150 kg/ha) of the blended fertilizer consisting of nitrogen, phosphorus, sulphur and boron (NPSB) based on the recommendation by EhtioSIS soil Fertility Map (EthioSIS 2016, unpublished) were considered as the second factor for the field experiment. Higher rates of nutrients were included to determine the best genetic coefficients of the sorghum cultivars used. The treatments were combined in factorial arrangement and laid out in randomized complete block design with three replications.
Models and data requirement
AquaCrop and DSSAT models
A model-based approach was selected for this study from the different methods available for yield gap analysis. Two crop models, CERES-Sorghum model that is embedded in the Decision Support System for Agrotechnology Transfer (DSSAT v. 4.7.5 – a complex model (Jones et al., Reference Jones, Hoogenboom, Porter, Boote, Batchelor, Hunt, Wilkens, Singh, Gijsman and Ritchie2003; Hoogenboom et al., Reference Hoogenboom, Porter, Shelia, Boote, Singh, White, Hunt, Ogoshi, Lizaso, Koo, Asseng, Singels, Moreno and Jones2019a, Reference Hoogenboom, Porter, Boote, Shelia, Wilkens, Singh, White, Asseng, Lizaso, Moreno, Pavan, Ogoshi, Hunt, Tsuji, Jones and Boote2019b)) and AquaCrop (Version 6.1, an intermediate model (Steduto et al., Reference Steduto, Hsiao, Raes and Fereres2009; Raes et al., Reference Raes, Steduto, Hsiao and Fereres2018)) were employed. The two models were selected based on their wide applicability and acceptance for the estimation of potential yield, adaptation option evaluation, impact assessment of climate change and optimization of field managements (Tsegay et al., Reference Tsegay, Raes, Geerts, Vanuytrecht, Abraha, Deckers, Bauer and Gebrehiwot2012, Reference Tsegay, Vanuytrecht, Abrha, Deckers, Gebrehiwot and Raes2015; Kassie et al., Reference Kassie, VanIttersum, Hengsdijk, Asseng, Wolf and Rötterd2014; Lopez et al., Reference Lopez, Erickson, Asseng and Bobeda2017; Adam et al., Reference Adam, Dzotsi, Hoogenboom, Traoré, Porter, Rattunde, Nebie, Leiser, Weltzien and Jones2018).
Differences in input data requirement and simulation processes were the other reasons for selecting the two models, as indicated below. Furthermore, the interest in using the two models was to compare their performance in predicating Y w of sorghum cultivars without considering the essence of a multimodel approach. AquaCrop, developed by the FAO, is a user-friendly and practitioner-oriented model, which maintains an optimal balance between accuracy, robustness and simplicity (Steduto et al., Reference Steduto, Hsiao, Raes and Fereres2009; Raes et al., Reference Raes, Steduto, Hsiao and Fereres2018). It uses only a relatively small number of explicit parameters and mostly intuitive input variables that can be determined by using simple methods, while the calculation procedures are based on basic and often complex biophysical processes to guarantee an accurate simulation of the crop response in the plant–soil system (Raes et al., Reference Raes, Steduto, Hsiao and Fereres2009; Steduto et al., Reference Steduto, Hsiao, Raes and Fereres2009). It simulates biomass and yield production based on the amount of water transpired from green canopy cover under the governing environmental conditions. Aboveground biomass (B) is produced as a function of the daily ratio of crop transpiration Tri (mm) and reference evapotranspiration (ETo) via crop water productivity WP* (g/m2) that is normalized for EToi (mm) and atmospheric CO2 concentration (Steduto et al., Reference Steduto, Hsiao, Raes and Fereres2009; Raes et al., Reference Raes, Steduto, Hsiao and Fereres2018):

where n is the sequential days spanning the period when B is produced.
DSSAT is the most widely used crop model globally, which consists of a collection of independent programmes (crop, weather, soil and water modules) that operate together, with the cropping system model embedded in its heart (Jones et al., Reference Jones, Hoogenboom, Porter, Boote, Batchelor, Hunt, Wilkens, Singh, Gijsman and Ritchie2003). DSSAT simulates growth and development of a crop grown under prescribed or simulated management, soil water, carbon and nitrogen. Phenological development and growth of a crop are specified in DSSAT by cultivar-specific genetic coefficients (Hoogenboom et al., Reference Hoogenboom, Porter, Shelia, Boote, Singh, White, Hunt, Ogoshi, Lizaso, Koo, Asseng, Singels, Moreno and Jones2019a).
Input data sets and observed data for model calibration
AquaCrop uses inputs from climate, crop, soil and management files (Hsiao et al., Reference Hsiao, Heng, Steduto, Rojas-laraB and Fereres2009). The climate data include daily values of minimum and maximum air temperature, rainfall, reference evapotranspiration (ETo), which can be computed from wind speed, relative humidity, sunshine hours and minimum and maximum air temperatures (Raes et al., Reference Raes, Steduto, Hsiao and Fereres2018). Climate data measured by the National Metrology Agency of Ethiopia (NMA) from 2003 to 2019 at two weather stations (Jinka and Keyafer) located near the experimental sites were collected and quality control was checked using the Rclimdex software program (Zhang and Yang, Reference Zhang and Yang2004).
The crop data for AquaCrop include, time of emergence, maximum canopy cover, days to flowering, senescence and maturity that were used to simulate dry aboveground biomass and grain yield. Seasonal canopy cover, dry aboveground biomass and soil water content were the data collected to be used for model calibration and evaluation. Canopy cover was determined using ‘samplepoint’ software by taking digital pictures perpendicular to the experimental plot at a height of 2 m (Booth et al., Reference Booth, Samuel and Berryman2006). Phenology data were collected by field observation when 50% of plants in each experimental unit reached the respective stages. Green canopy cover and aboveground biomass were measured at 10-day interval starting from emergence to maturity. Similarly, the soil inputs included texture, number of horizons in the root zone, initial soil water content, field capacity (FC), permanent wilting point (PWP) and soil nutrient content. The initial soil conditions of experimental sites (Table 1) were determined after excavating a soil profile at each site during planting at a depth of 1.2 m. Apart from the nutrient analysis (used during simulation of DSSAT and not shown here), soil texture, total available water and bulk density were determined at soil laboratories of Hawassa University and Jinka. The soil water retention at PWP, FC and saturation (SAT) were determined using a pedotransfer function based on the textural class of the soil (Saxton and Rawls, Reference Saxton and Rawls2006). Seasonal available soil water content was measured using a gravimetric method at 10-day interval starting from sowing to crop maturity. Additional information on soil texture, organic matter content, electric conductivity, pH and exchangeable potassium was used from the data generated by Kebede et al. (Reference Kebede, Shimbir, Kasa, Abera and Girma2017) for different soil conditions of Jinka.
Soil properties at Benatsemay and Jinka experimental sites, Southwest Ethiopia

BD, bulk density; SAT, soil water retention at saturation; FC, soil water retention at field capacity; PWP, soil water retention at permanent wilting point; TAW, total available water in the root zone of 1.2 m.
The DSSAT model uses soil, crop management and daily meteorological data as input to simulate daily leaf area index (LAI) and vegetation status parameters, biomass production and final yield (Jones et al., Reference Jones, Hoogenboom, Porter, Boote, Batchelor, Hunt, Wilkens, Singh, Gijsman and Ritchie2003; Hoogenboom et al., Reference Hoogenboom, Porter, Shelia, Boote, Singh, White, Hunt, Ogoshi, Lizaso, Koo, Asseng, Singels, Moreno and Jones2019a). The daily meteorological data include solar radiation, rainfall and maximum and minimum air temperatures. The main soil data include soil type, slope and drainage characteristics, and physico-chemical parameters for each soil layer. The crop management data include variety, planting date, plant density and fertilizer application. The entire crop, soil and management data were taken from the field experiment. Solar radiation was estimated from the available sunshine hours using the Angstrom formula (Allen et al., Reference Allen, Pereira, Raes and Smith1998):

where R s is the solar radiation (MJ/m2/day), R a is the extra-terrestrial radiation (MJ/m2/day), n is the actual duration of sunshine (h) and N is the maximum possible sunshine duration (h).
Model calibration and evaluation
Model calibration is an adjustment of system parameters for gaining a good overall agreement between simulated and observed values, so that simulation output would fairly fit the reality (Sannagoudar et al., Reference Sannagoudar, Patil and Rajanna2019). Calibration of both AquaCrop and DSSAT models was done using relevant data (phenology, canopy cover, soil water content, LAI, biomass and yield) from the field experiment conducted in 2018 for the two improved sorghum cultivars (Melkam and Teshale) recommended for the area.
Four coefficients (canopy growth, maximum canopy cover, average canopy decline and water productivity) were manually adjusted until the simulated seasonal green canopy cover, aboveground biomass and soil water content approximated to the observed values during the calibration of AquaCrop. Similarly, during calibration of DSSAT, genetic coefficients that influence phenology, growth and yield were developed by employing a GLUE coefficient estimator (Jones et al., Reference Jones, He, Boote, Wilkens, Porter, Hu, Ahuja and Ma2011) using data from the field experiment of 2018. Cultivar parameters that influence biomass accumulation and grain yield were determined after adjusting the coefficient for phenology (anthesis and maturity dates).
Performance evaluation of the two models was done to test if the output of model simulations reaches an adequate level of agreement with the observed values (Tsegay et al., Reference Tsegay, Raes, Geerts, Vanuytrecht, Abraha, Deckers, Bauer and Gebrehiwot2012). Evaluation of AquaCrop performance was done using independent data sets from field experiment of 2019 involving green canopy cover, soil water content and aboveground biomass without making any changes on the calibrated crop file. Similarly, DSSAT was evaluated using point data from a specific period such as days to anthesis and physiological maturity and time series data of biomass, LAI and soil water content collected from the same field experiment.
Statistical indicators that were used to compare the deviation between observed and simulated values were root mean squared error (RMSE) (Chai and Draxler, Reference Chai and Draxler2014) and index of agreement (d) (Willmott, Reference Willmott1982). The RMSE is a measure of the mean deviation between observed and simulated values that indicate the absolute model uncertainty. It has the same unit as the variable being simulated, and a value closer to zero indicates better model simulation performance:

where Oi and Si are the observed (measured) and simulated values, respectively and N is the number of observations. The index of agreement is a measure of relative error in model estimates that ranges from 0 to 1.0, where 0 and 1 describe complete disagreement and agreement between estimated and observed values, respectively:

where Ō is the mean of observed (measured) values. Additionally percent bias (PBIAS) was used to measure the tendency of simulated data to be smaller or larger than the observed data (Moriasi et al., Reference Moriasi, Arnold, VanLiew, Bingner, Harmel and Veith2007):

Positive values indicate underestimation, negative values indicate overestimation and zero value indicates agreement of averages of simulated and measured values.
Approaches for yield gap and variability analysis
Water-limited yield and yield gaps existing in the region were estimated with the two models using multi-year simulations based on historical weather data. Yield gap analysis can be done by comparing two levels of yield from different yield categories (Lobell et al., Reference Lobell, Cassman and Field2009; Kassie et al., Reference Kassie, VanIttersum, Hengsdijk, Asseng, Wolf and Rötterd2014; FAO and DWFI, 2015) involving potential yield, water-limited yield, attainable yield and average farmers yield (actual yield). Potential yield is the maximum yield of a crop cultivar grown in an environment to which it is adapted with nutrients and water non-limiting and pests, diseases, weeds, lodging and other stresses effectively controlled. Water-limited yield (Y w) is similar to potential yield, except that yield is limited by water supply, and hence influenced by soil type (water holding capacity and rooting depth) and field topography. The former and later are used as the benchmark of productivity to irrigated and rainfed crops, respectively.
Attainable yield is the best yield achieved through skilful use of the available technologies by avoiding the effect of weeds, pests and diseases while water and nutrients limit the yield. Similarly, average farmers yield (Y a) is the yield achieved using the available resources and current practices of the farmers and determined from an area and production data of a crop for a given district and time period. In addition, on farm trial yield data were taken from experiments conducted at Farmers Training Centre of three districts in South Omo (Benatsemay, Nangaton and Dasenech) by researchers from Jinka. The trial was conducted to evaluate adaptation of improved sorghum cultivars using recommended technologies such as spacing (75 by 15 cm2), fertilization (100 kg/ha urea), weed control (three times weeding) and planting date (varied from February to March). Water-limited yield, attainable yield and actual yield were represented with data generated from crop simulation models, farm trials and average farmers’ yield (from Central Statistical Agency (CSA)), respectively. Due to rainfed nature of sorghum production in the country including the study area, Y w was used instead of Y p during yield gap analysis. Accordingly, the following three types of Y g analyses were done: (i) the gap between water-limited and attainable yield, (ii) the gap between water-limited and actual yield and (iii) the gap between attainable and actual yield. Comparison of actual yield from CSA, average yield value at the zone level, with water-limited yield of sorghum from two sites within the zone was the limitation of this study. Hence there was a possibility of over or under estimation of the yield gap to some extent.
Sorghum production constraints
In addition to the field experiment, a survey was conducted in 2019 to identify sorghum production constraints in South Omo and Segen Area People's zones. For this study, four kebeles (the lowest administrative unit in Ethiopia) were selected using multistage sampling techniques. First, South Omo and Segen Area People's zones were selected purposefully owing to their potential of sorghum production in the southern region. Similarly, Benatsemay district from South Omo zone and Konso district from Segen Area People's zone were selected based on the same criteria and two kebeles from each district were picked randomly. Based on the following sample size determination formula (Yamane, Reference Yamane1967), the total sample size of the four identified kebeles was 354:

where n is the sample size and N is the population size (3055) and e is the desired level of precision (0.05). However, due to the scattered settlement of the population and harsh environmental conditions, the total sample size was reduced to 245. By using the list of household heads from each district agricultural office, 245 farm household heads from the four kebeles were sampled randomly using probability proportional to the size of the total households of each kebele. A semi-structured questionnaire was used to gather information on farm history, agronomic practices used by farmers and challenges they faced in relation to reduced productivity of sorghum in the area. Descriptive data analysis was done to summarize responses from the farmers on the factors reducing sorghum yield.
Results
Model calibration and evaluation
The crop parameters adjusted for cultivars Melkam and Teshale during the calibration of AquaCrop were maximum canopy cover, canopy growth coefficient, normalized water productivity and average canopy cover decline. These parameters influence the expansion of green canopy cover, biomass accumulation and yield formation of a given crop. The adjusted values of Teshale and Melkam were 48.6 and 56.4% for maximum canopy cover, 8.29 and 10.26% for canopy growth coefficient, 0.84 and 0.94%/day for average canopy decline and 9.6 and 9.3 g/m2 for normalized water productivity, respectively (Table 2). After calibration, the RMSE values were 6.2 and 6.3% for canopy cover, 0.65 and 0.68 t/ha for dry aboveground biomass of Melkam and Teshale, respectively (Table 3). In addition, the RMSE for soil water content was 8.7 mm (Table 3). Similarly, the values of d and PBIAS ranged from 0.95 to 0.97 and −9.18 to −3.2%, respectively.
Adjusted crop coefficients during calibration of AquaCrop for sorghum cultivars in Southwest Ethiopia

Statistical measures for soil moisture and crop growth after calibration of AquaCrop in 2018
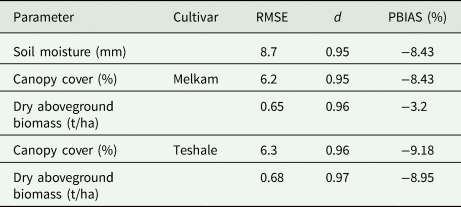
RMSE, root mean squared error; d, index of agreement; PBIAS, percent bias.
The evaluation of AquaCrop using independent observation data of seasonal green canopy cover, aboveground biomass and soil water content from 2019 (Figs 2 and 3) confirmed a good agreement between simulations and observations during the calibration year 2018 (Table 3). Simulation of available soil water content in the root zone showed a deviation of 2.2 mm (Table 4). The average observed canopy covers of 33.4% for Melkam and 30.7% for Teshale were simulated by the model with deviation of 0.9 and 2.4%, respectively (Table 4). Similarly, simulation of aboveground biomass showed a deviation of 0.11 t/ha for Melkam and 0.1 t/ha for Teshale.
Observed and simulated (AquaCrop) canopy cover (a) and aboveground biomass (b) of cvs. Melkam and Teshale, as well as regression between observed and simulated canopy cover (c) and aboveground biomass (d) of cv. Melkam during evaluation of AquaCrop at Jinka. The vertical bars indicate ±standard deviation (n = 3).

Observed and simulated seasonal available soil water content in the root zone (1.2 m) during evaluation of AquaCrop at Jinka. The vertical bars indicate ±standard deviation (n = 3)

Comparison of observed and simulated average seasonal available soil water content, green canopy cover and aboveground biomass of sorghum cultivars in Southwest Ethiopia during evaluation of AquaCrop

SWC, available soil water content in the root zoon. Unit of soil water content was changed from g/g to mm/m as per the requirement of AquaCrop.
The d values were >0.9 for all cases of green canopy cover and dry aboveground biomass except for seasonal soil water content for which d was 0.83 (Figs 2 and 3) during the evaluation of AquaCrop. Similarly, the RMSE were 6.9 and 5.8% for green canopy cover and 0.55 and 0.96 t/ha for dry aboveground biomass of Teshale and Melkam, respectively. In addition, the RMSE for soil water content was 7.6 mm. Furthermore, the slopes of correlation lines between observed and simulated seasonal soil water content and crop parameters were almost parallel and approached to 1 : 1 plot and the statistical measures were adequate to show the accuracy of the model to simulate soil water content, green canopy cover and dry aboveground biomass (Figs 2 and 3).
Table 5 shows the cultivar coefficients adjusted during DSSAT calibration for simulating development and growth of sorghum cultivars. Evaluation of DSSAT using these calibrated cultivar coefficients showed a good agreement between observed and simulated phenology and growth of sorghum cultivars (Table 6). The observed days to anthesis and maturity were 71 and 106 for Melkam and 76 and 114 for Teshale, respectively. Deviations of simulated value for days to anthesis and maturity were 2 and 6 for Melkam and 1 and 3 for Teshale, respectively. Similarly, maximum LAI was simulated with a deviation of 0.17 for Melkam and 0.54 for Teshale. The simulated seasonal top weight, LAI and water available in the root zone showed a good fit with the observed values and the regression lines between simulated and observed values were almost parallel and approached to 1 : 1 plot (Figs 4 and 5).
Observed and simulated top weight (a) and LAI (b) of sorghum cultivars and regression between observed and simulated top weight (c) and LAI (d) of Melkam cultivar at Jinka during evaluation of DSSAT.

Observed and simulated water available in the root zone at Jinka during evaluation of DSSAT. The vertical bars indicate ±standard deviation (n = 3).

Calibrated genetic coefficients of sorghum cultivars used for evaluation of DSSAT model in Southwest Ethiopia

Comparison of observed and simulated phenology and growth of sorghum cultivars in Southwest Ethiopia during evaluation of DSSAT

RMSE, root mean squared error; d, index of agreement; LAI (max), maximum leaf area index measured at the time of heading.
A grain yield of 4.2 t/ha for the cultivar Melkam and 4.7 t/ha for Teshale were obtained from the field experiment of 2019 (Table 7). During model evaluation, grain yields of 5.1 and 5.6 t/ha were achieved from the simulation of AquaCrop for cultivar Melkam and Teshale, respectively (Table 7). Similarly, simulation by DSSAT resulted in a grain yield of 4.6 t/ha for Melkam and 4.9 t/ha for Teshale, which were lower than the values obtained from AquaCrop. There was a good agreement between observed and simulated values of grain yield for both models (Table 7). However, grain yield was simulated with lower deviation using DSSAT (average deviation of 0.3 t/ha) than AquaCrop (average deviation of 0.9 t/ha) compared to the average measured yield of the two cultivars over locations. Also simulated grain yield of both cultivars had lower PBIAS for DSSAT than AquaCrop (Table 7). The maximum PBIAS (−21.4%) was observed for grain yield of Melkam simulated with AquaCrop and the minimum PBIAS (4.3%) was observed for Teshale simulated with DSSAT.
Observed and simulated grain yields of sorghum cultivars and PBIAS (%) for simulation of grain yield during evaluation of AquaCrop and DSSAT in Southwest Ethiopia

PBIAS, percent bias.
Yield levels, variability and gaps
The regional actual yield of sorghum for the period 2003–17 varied from 0.58 to 2.51 t/ha with an average of 1.51 t/ha and coefficient of variation (CV) of 40.3% (Table 8, Fig. 7). Similarly, the mean attainable yield of sorghum for the period 2014–17 was 3.06 t/ha with a CV of 30.8% (Table 8). The Y w of Melkam as simulated with AquaCrop ranged from 4.55 to 5.78 t/ha with an average of 5.14 t/ha at Jinka and from 3.51 to 6.28 t/ha at Benatsemay with a mean value of 5.01 t/ha (Fig. 6). The values with DSSAT were 3.1–6.5 t/ha with a mean of 4.69 t/ha at Jinka and 3.13–7.44 t/ha with a mean of 5.12 t/ha at Benatsemay (Fig. 6). Cultivar Teshale had Y w of 5.15–6.24 t/ha with a mean of 5.49 t/ha and 3.81–6.53 t/ha with a mean of 4.92 t/ha as simulated with AquaCrop and DSSAT, respectively, at Jinka. The Y w of this cultivar ranged from 4.03 to 5.91 t/ha with an average of 5.24 t/ha for AquaCrop and from 3.12 to 7.08 t/ha with an average of 4.83 t/ha for DSSAT at Benatsemay (Fig. 6). Inter-annual variability was also observed from the time series analysis of Y w (Table 8, Fig. 7). Coefficients of variation for Y w averaged for the two cultivars were 4.5% at Jinka and 12.2% at Benatsemay for AquaCrop. Similarly, CV for Y w averaged for two cultivars were 19.3 and 22.3% at Jinka and Benatsemay, respectively, with DSSAT.
Water-limited yield of Melkam (AquaCrop) (a), Melkam (DSSAT) (b), Teshale (AquaCrop) (c) and Teshale (DSSAT) (d) at two locations (Benatsemay and Jinka) in Southwest Ethiopia for the period 2003–17. Boxes indicate the lower and upper quartiles. The solid line within the box is the median. Whiskers indicate the minimum and maximum values and dots outside the whiskers are outliers.

Time series comparison of actual yield with water-limited yield and yield gaps (using DSSAT and AquaCrop) of rainfed sorghum production in Southwest Ethiopia. Actual yield was taken from CSA of Ethiopia for the period from 2003 to 2017. Simulated yield was average of Melkam and Teshale from the two sites (Jinka and Benatsemay) using DSSAT and AquaCrop for the period 2003–17.

Different yield levels of rainfed sorghum production in Southwest Ethiopia

CV, coefficient of variation.
a Actual yield was considered for the period 2003–17 from Central Statistics Agency of Ethiopia. The actual yield and Y w were averaged for the period 2003–17.
b Attainable yield was average of 4 years (2014 to 2017). Simulated water-limited yield was averaged for the two cultivars over locations.
The 90th percentile of Melkam Y w was 5.75 t/ha at both Jinka and Benatsemay using AquaCrop and 6.01 t/ha at Benatsemay and 5.74 t/ha at Jinka using DSSAT (Fig. 6). Similarly, for the cultivar Teshale the values were 5.85 t/ha at Benatsemay and 5.24 t/ha at Jinka using AquaCrop, and 5.72 t/ha at Benatsemay and 5.42 t/ha at Jinka using DSSAT (Fig. 6). Also, higher medians of Y w were recorded for both cultivars at Benatsemay than Jinka with the two crop models except for Melkam using AquaCrop at Jinka (Fig. 6).
The regional yield gaps between actual yield and Y w (mean of the two cultivars) simulated using AquaCrop and DSSAT ranged from 2.39 to 4.69 t/ha and 1.15 to 5.51 t/ha, respectively (Fig. 7). The average Y g between actual yield and Y w, averaged for the two cultivars were 3.62 and 3.44 t/ha at Benatsemay and 3.81 and 3.23 t/ha at Jinka simulated with AquaCrop and DSSAT models, respectively, with an average value of 3.53 t/ha (Table 9). The differences between Y w and attainable yield of sorghum ranged from 1.75 to 2.26 t/ha simulated with AquaCrop and DSSAT (Table 9). Additionally, the regional gap between attainable and actual yield was 1.55 t/ha (Table 9).
Existing yield gaps among actual, attainable and water-limited yield as simulated with AquaCrop and DSSAT for rainfed sorghum in Southwest Ethiopia

a The data represent the average yield gaps for the period 2003–17 except for attainable yield for which yield data was available for the years from 2014 to 2017.
Production constraints of sorghum
The existing yield gaps in Southwest Ethiopia were attributed to different factors as indicated by the survey (Fig. 8). Majority of respondent farmers (98%) considered seasonal rainfall risks as the first major factor for low productivity of sorghum. The survey result was in agreement with the correlation analysis of actual and water-limited yield of sorghum with growing season rainfall variability and patters (Figs 9 and 10). The regional growing season rainfall (averaged for eight weather stations of the region) and the actual regional yield had a correlation coefficient of 0.63 for the period 2003–17. Similarly, the correlation coefficient between growing season rainfall and water-limited yield of Melkam and Teshale simulated with AquaCrop and DSSAT at Benatsemay and Jinka ranged from 0.52 to 0.74. Furthermore, the water-limited yield generally increased with increasing of rainfall and vice versa. Similarly, farmers identified poor soil fertility (86%) as the second factor that limit sorghum productivity in the region. In agreement with farmers’ assessment, field experiment result confirmed that grain yield of sorghum cultivars increased by 77.3 to 83.6% due to the application of 150 kg NPSB/ha as compared to unfertilized plants (Table 10). Additionally, farmers identified a lack of improved varieties (78%) and poor weed management (56%) as other major factors limiting potential yield production of sorghum. Furthermore, disease and pest problem, poor extension services and market access, low purchasing power of input and the absence of weather information (data not shown) contributed to low productivity of sorghum in the region.
Major sorghum production constraints identified by household heads (%) during the survey in 2018, Southwest Ethiopia.

Actual yield v. regional growing season rainfall for the period 2003–17 in Southwest Ethiopia. r is the correlation coefficient.

Growing season rainfall v. simulated water-limited yield of sorghum cultivars: (a) simulation with AquaCrop at Jinka, (b) simulation with AquaCrop at Benatsemay, (c) simulation with DSSAT at Jinka and (d) simulation with DSSAT at Benatsemay, in Southwest Ethiopia. r is the correlation coefficient.

Comparison of grain yield (t/ha) response of sorghum cultivars with and without fertilizer (NPSB) application in southwest Ethiopia

Discussion
Evaluation of models
Evaluation of the two models after calibration showed a good agreement between observed and simulated growth of sorghum. Simulations of seasonal soil water content, green canopy cover and dry aboveground biomass using AquaCrop and phenology, growth and development using DSSAT performed reasonably well. This was supported by an adequate level of statistical measures and a good fit of regression lines. The evaluation results indicated also a good accuracy of the two models to predict grain yield of sorghum under water-limited conditions in Southwest Ethiopia. Previous studies showed that the simulation of sorghum yield in a water-limited environment using these models was promising (Hadebe et al., Reference Hadebe, Modi and Mabhaudhi2017b; Sannagoudar et al., Reference Sannagoudar, Patil and Rajanna2019). Although the two models simulated grain yield reasonably well, AquaCrop relatively overestimated the grain yield as compared to DSSAT. This variation might be attributed to the differences on overall yield simulation process of the two models. AquaCrop simulates yield of crops in response to various degree of soil moisture availability as a function of water consumption where transpiration is first calculated and then translated into biomass through water productivity function. Finally, yield is derived from biomass and harvest index relations (Raes et al., Reference Raes, Steduto, Hsiao and Fereres2009; Steduto et al., Reference Steduto, Hsiao, Raes and Fereres2009). On the contrary, estimation of crop yield in DSSAT is a function of growth rate and duration (Tsuji et al., Reference Tsuji, Hoogenboom and Thornton1998; White et al., Reference White, Alagarswamy, Ottman, Porter, Singh and Hoogenboom2015). Growth rate involves mass accumulation and area expansion that principally depends on amount of photosynthetically active radiation, temperature, nutrient and water availability. Growth duration involves phasic and morphological developments that are principally controlled by temperature. So, involving more number of processes in DSSAT than AquaCrop might have led to estimate yield relatively closer to the measured value.
Additionally, plant growth in DSSAT is governed by conversion of intercepted radiation to biomass during which the LAI is one of the key factors that determine the amount of light interception (Jones et al., Reference Jones, Hoogenboom, Porter, Boote, Batchelor, Hunt, Wilkens, Singh, Gijsman and Ritchie2003). On the contrary, AquaCrop uses canopy cover to determine the amount of water transpired that later reflected on crop yield through its relation with biomass simulation (Steduto et al., Reference Steduto, Hsiao, Raes and Fereres2009). Accuracy of canopy cover estimates using digital image analysis limited by angle of view during aerial image capturing and canopy closure at later stage of crop growth resulting in saturation signal (Fiala et al., Reference Fiala, Garmaan and Gray2006; Raj et al., Reference Raj, Walker, Pingale, Nandan, Naik and Jagarlapudi2021). On the contrary, LAI estimates using a direct method as done in this study gives the most accurate values (Raj et al., Reference Raj, Walker, Pingale, Nandan, Naik and Jagarlapudi2021). Hence, using LAI by DSSAT and canopy cover by AquaCrop as primary engine for capturing resources during the formation of biomass and subsequent yield might be additional reasons for variation in the accuracy of yield estimation between the two models. Furthermore, DSSAT simulates a detailed plant and soil nutrient balance whereas AquaCrop simply evaluates crop response to different soil fertility regimes from poor to non-stress conditions (Jones et al., Reference Jones, Hoogenboom, Porter, Boote, Batchelor, Hunt, Wilkens, Singh, Gijsman and Ritchie2003; Steduto et al., Reference Steduto, Hsiao, Raes and Fereres2009; Raes et al., Reference Raes, Steduto, Hsiao and Fereres2018). Consideration of nutrient balance instead of soil fertility regime is more realistic to see the effect of nutrients on plant growth and yield formation. Moreover, quantifying the effect of solar radiation in addition to water in DSSAT is likely to be an additional advantage in estimating crop yield as close as possible to the measured value.
Yield levels, variability and gaps
During the targeted period, the actual yield of the crop showed an increasing trend. However, such a significant increment on the actual yield was accompanied by high year-to-year variability, which might be attributed to the existing variability of rainfall. This was confirmed by the existing correlation between growing season rainfall and annual actual yield of the region for the period 2003–17. The increase in actual yield could be the result of change in the adoption of improved agronomic measures in the region during the stated period although it is found at its early stage (Shiferaw and Yoseph, Reference Shiferaw and Yoseph2014; Yoseph and Sorsa, Reference Yoseph and Sorsa2014).
Higher inter-annual variability of Melkam and Teshale Y w was observed at Benatsemay than Jinka for both models and this could be attributed to differences in edaphic and climatic conditions of the area. For instance, the soil textural classes of Jinka and Benatsemay were clay loam and sandy loam, respectively. Such soil texture difference has a significant effect on availability of water and crop yield when water is the yield-limiting factor (Silungwe et al., Reference Silungwe, Graef, Bellingrath-kimura, Tumbo, Kahimba and Lana2019). Similarly, the Y w of the crop showed some differences with respect to the same yield level of other regions of Ethiopia where the potential yield of the crop was determined based on field experiment (5.15 t/ha) (Kinfe and Tesfaye, Reference Kinfe and Tesfaye2018) and crop model (2.8–10.2 t/ha) (Van Bussel et al., Reference Van Bussel, Grassini, Van Wart, Wolf, Claessens, Yang, Boogaar, Groote, Saito, Cassmanb and Van Ittersum2015). Divergence of potential yield from field experiment and crop model is expected since under field conditions maintaining all management practices to their best level and controlling all biotic and abiotic factors throughout the growing season are quite difficult. Employing different models could be other source of variation during estimation of Y w. For instance, during estimation of Sorghum Y w in Global Yield Gap Atlas, Van Bussel et al. (Reference Van Bussel, Grassini, Van Wart, Wolf, Claessens, Yang, Boogaar, Groote, Saito, Cassmanb and Van Ittersum2015) used WOFOST, which has a different approach to describe crop growth dynamics as compared to DSSAT and AquaCrop. Additionally, the Y w of crops found to be different across different locations due to variation in growth duration and local weather conditions specially temperature and rainfall which do have significant direct and indirect effects on the crop growth and yield response (Deng et al., Reference Deng, Grassini, Yang, Huang, Cassman and Peng2019).
The attainable yield (3.06 t/ha) of the crop in the study area was lower than the same yield level of other sorghum producing areas of the country such as the 5.71 t/ha in Eastern Hararghe (Abady et al., Reference Abady, Liku and Yadeta2017; Abduselam et al., Reference Abduselam, Tegene, Legese, Tadesse, Biri and Tessema2018) and the 4.41 t/ha in Afar (Dilnesaw et al., Reference Dilnesaw, Gebreegziabher, Hailu, Abdissa, Bedada and Alemaw2018), which could be due to local agro-ecological variation and the extent of harmonious application of agronomic practices (Fujimura et al., Reference Fujimura, Shi, Iwama, Zhang, Gopa and Jitsuyama2010; Mundia et al., Reference Mundia, Secchi, Akamani and Wang2019). Furthermore, the attainable yield was below the water-limited yield by 1.97 t/ha indicating existence of limitations in soil nutrients and water, which reduce sorghum yield performance in the area.
The average regional actual yield was below attainable and water-limited yield by 1.56 and 3.52 t/ha indicating loss of 51 and 70%, respectively. Such yield gaps are common under rainfed and subsistence farming system where crop production is constrained by water, nutrients and other environmental factors (Lobell et al., Reference Lobell, Cassman and Field2009). This Y g indicates the opportunity to enhance sorghum production by reducing the yield-limiting factors in the region. However, it is not possible to completely close the Y g between actual yield and Y w since the average yield of farmers would not reach to the ceiling of potential yield due to two main reasons (Van Ittersum et al., Reference Van Ittersum, Cassman, Grassini, Wolf, Tittonell and Hochman2013; Van Wart et al., Reference Van Wart, Kersebaum, Peng, Milnera and Cassmana2013a). First, there is a diminishing marginal yield benefit from application of additional input as yield approaches to the ceiling, and second, not all farmers in a given region have perfection on soil and crop management. Van Ittersum et al. (Reference Van Ittersum, Cassman, Grassini, Wolf, Tittonell and Hochman2013) asserted that average yield of farmers tend to plateau when they reach 75–80% of Y p or Y w and the exploitable yield gaps could be considered between average farm yield and 80% of Y p or Y w. Hence the exploitable yield gap of rainfed sorghum production in Southwest Ethiopia was 2.5 t/ha.
There was considerable variability on the existing Y g between actual yield and Y w of the crop within the 15 years of the targeted period. This could be attributed to differences in climatic conditions, management practices and adoption of improved technologies. At later years of production, the yield gaps became narrowed compared to the earlier one's mainly because of an increment on average farmers yield due to adoption of improved technologies to some extent. Najafi et al. (Reference Najafi, Devineni, Khanbilvardi and Kogan2018) stated that crop productivity over time would be improved due to changes in technology and economic growth, improvement in input supply, release of new varieties and better agronomic practices. A trade-off exists between number of years considered for Y g analysis and robust estimation of the Y g with respect to environmental differences (Van Ittersum et al., Reference Van Ittersum, Cassman, Grassini, Wolf, Tittonell and Hochman2013; Van Wart et al., Reference Van Wart, Kersebaum, Peng, Milnera and Cassmana2013a). In favourable environments, the most recent 5–7 years are adequate for estimation of average farmers yield and simulation of Y w with relatively low CV. On the contrary, 10–20 years are need to be considered in harsh environments having lower rainfall to compromise capturing adequate yield variability and avoiding the inclusion of climate change impact and adoption of technology. With this regard, the number of years considered in this study to estimate Y g was adequate since it was conducted in rainfall-limited environments of Southwest Ethiopia.
Production constraints of sorghum
Exploring the underlying factors of yield gaps is very important to increase the future food production and closing the existing gaps (Meng et al., Reference Meng, Hou P, Chen, Cui and Zhang2013). A number of factors for existing sorghum Y g in Southwest Ethiopia were identified during the survey from which rainfall variability, poor soil fertility, lack of improved varieties and poor weed managements were the major ones. These production constraints are commonly experienced by other sorghum producing area of Ethiopia (Schneider and Anderson, Reference Schneider and Anderson2010; FAO and DWFI, 2015). Similarly, in sub-Saharan Africa sorghum is considered as poor-man crop and its production has been carried out in marginalized areas with no or low inputs and improved agronomic practices, poor extension services and market linkage (Tonitto and Ricker-Gilbert, Reference Tonitto and Ricker-Gilbert2016).
Even though sorghum is one of most important crops in a harsh environment, the adverse weather conditions particularly rainfall during the growing season penalize farmers yield (Singh et al., Reference Singh, Nedumaran, Traore, Boote, Rattunde, Vara Prasad, Singh, Srinivas and Bantilan2014; Msongaleli et al., Reference Msongaleli, Tumbo, Kihupi and Rwehumbiza2017; Zewdu et al., Reference Zewdu, Hadgu and Nigatu2020). There has been a consistent effort on developing improved varieties in Ethiopia but they do have little adoption by the farmers due to poor extension service, bird attack specially for early maturing varieties, higher post-harvest loss due to pest and lower biomass as compared to the land races (Beshir and Sime, Reference Beshir and Sime2013; Kinfe and Tesfaye, Reference Kinfe and Tesfaye2018). Additionally, economical problem related to lower market prices of grain as compared to other cereals and higher input prices such as chemical fertilizers demotivated farmers to use the improved agronomic practices during sorghum production (Tonitto and Ricker-Gilbert, Reference Tonitto and Ricker-Gilbert2016). Under such situations closing the Y g by achieving 80% of Y w needs a big effort involving supply of improved seeds, chemical fertilizers and pesticides, effective weeds and pest management schemes, adoption of recommended agronomic practices and access to timely weather information (Deng et al., Reference Deng, Grassini, Yang, Huang, Cassman and Peng2019).
Conclusions
Calibration and evaluation results of AquaCrop and DSSAT showed that observed and simulated soil and crop parameters were in good agreement. The yield gaps between actual and water-limited yield simulated using DSSAT and AquaCrop ranged from 1.2 to 5.5 t/ha and 2.4 to 4.7 t/ha, respectively indicating the presence of 3.53 t/ha actual and 2.5 t/ha exploitable yield gaps in the region. Seasonal rainfall variability, poor soil fertility, lack of improved varieties and poor weed managements were the major production constraints of sorghum in Southwest Ethiopia. The existing yield gap could be managed by employing classic agronomic practices and technologies with the participation of different stakeholders. However, these classic agronomic practices and improved technologies would not be realized by subsistence farmers in Southwest Ethiopia particularly and Ethiopia generally unless effective technical and economic support goes to these farmers.
Financial support
The study is an output of a PhD scholarship at the Hawassa University, in the framework of the German–Ethiopian SDG Graduate School ‘Climate Change Effects on Food Security (CLIFOOD)’ between the Food Security Center, University of Hohenheim (Germany) and the Hawassa University (Ethiopia), supported by the DAAD with funds from the Federal Ministry for Economic Cooperation and Development (BMZ).
Conflict of interest
The authors declare that there are no conflicts of interest.


 Open access

