

1. Introduction
Researchers use stylized experimental games to study both pro-social and anti-social behavior. One game that is commonly used to study spiteful actions is the money-burning game (MBG), also known as the joy of destruction game (Zizzo & Oswald, Reference Zizzo and Oswald2001; Abbink & Herrmann, Reference Abbink and Herrmann2011), in which pairs of subjects choose simultaneously whether to burn part of their partner’s endowment at little or no cost to themselves.
Although burning money is clearly an inefficient choice, studies both in the laboratory and in the field have consistently found that a substantial proportion of people make this choice. The share of burners ranges widely from less than 1 in 10 to almost half, depending on many aspects of the implementation (Abbink & Herrmann, Reference Abbink and Herrmann2011; Baillon et al., Reference Baillon, Selim and van Dolder2013; Prediger et al., Reference Prediger, Vollan and Herrmann2014; Karakostas & Zizzo, Reference Karakostas and Zizzo2016; Bauer et al., Reference Bauer, Cahlıková, Chytilová and Želinský2018; Dickinson & Masclet, Reference Dickinson and Masclet2019; El Harbi et al., Reference El Harbi, Grolleau, Sutan and Ben Ticha2020; Zhang et al., Reference Zhang, Brown and Xie2020). The MBG has largely been used to measure the effects of different environmental variables or experimental manipulations on the propensity to harm others (Baillon et al., Reference Baillon, Selim and van Dolder2013; Prediger et al., Reference Prediger, Vollan and Herrmann2014; Basurto et al., Reference Basurto, Blanco, Nenadovic and Vollan2016; Karakostas & Zizzo, Reference Karakostas and Zizzo2016; Jauernig et al., Reference Jauernig, Uhl and Luetge2016; Bauer et al., Reference Bauer, Cahlıková, Chytilová and Želinský2018; Vorlaufer, Reference Vorlaufer2019; Zhang et al., Reference Zhang, Brown and Xie2020) and to detect correlations between destructive choices and other variables, such as sensitivity to social pressure, cognitive reflection, or choices in moral dilemmas (Zizzo & Fleming, Reference Zizzo and Fleming2011; Corgnet et al., Reference Corgnet, Espín and Hernán-González2015; Kebede & Zizzo, Reference Kebede and Zizzo2015; Dickinson & Masclet, Reference Dickinson and Masclet2019; El Harbi et al., Reference El Harbi, Grolleau, Sutan and Ben Ticha2020).
Various explanations of what motivates people to burn other people’s money have been posited. The usual interpretation rests on the assumption that people can gain some pleasure from harming or dominating others (Abbink & Sadrieh, Reference Abbink and Sadrieh2009; Abbink & Herrmann, Reference Abbink and Herrmann2011; Basurto et al., Reference Basurto, Blanco, Nenadovic and Vollan2016). Other factors suggested in the literature include anticipatory negative reciprocity (Abbink & Sadrieh, Reference Abbink and Sadrieh2009) and inequality aversion (Zizzo & Oswald, Reference Zizzo and Oswald2001), both of which are labeled as pre-emptive retaliation in the literature since burning is driven by expectations of burning by the counterpart. In this paper, we offer a within-subject experimental design that enables us to classify participants into three different groups according to their motives: desire for harming or beating, inequality aversion, and reciprocity. This allows us to identify which is the most prevalent motive for money burning. In addition, we examine the relationship between participants’ motives and their empathy as measured by the Interpersonal Reactivity Index (IRI) developed by Davis Reference Davis(1983).
The observed burning behavior can be explained by subjects attaching additional utility to burning. Burning may become the dominant strategy of the game if participants experience pleasure from being nasty to their partner (Abbink & Sadrieh, Reference Abbink and Sadrieh2009). Similarly, individuals might burn money because they are hypercompetitive, i.e., they care about being ahead in the final ranking of monetary payoffs (Basurto et al., Reference Basurto, Blanco, Nenadovic and Vollan2016). Although these are distinct psychological motives, we label individuals with either the desire to harm or beat others as spiteful and we do not distinguish between these two motives in this paper. Spiteful burning can be seen as anti-social since participants who choose to burn due to these motives are willing to harm even if they expect their partners to be peaceful.
Other possible explanations are consistent with a subject choosing not to burn money if their partner does not burn either but preferring to burn if they expect burning from their counterpart. The MBG then turns into a coordination game with two symmetric equilibria. Abbink & Sadrieh Reference Abbink and Sadrieh(2009) call this behavior “pre-emptive retaliation”.Footnote 1 The existence of two symmetric equilibria (mutual max or mutual min outcome) can be explained either by inequality aversion (Fehr & Schmidt, Reference Fehr and Schmidt1999) or by applying the reciprocity model developed by Rabin Reference Rabin(1993) and Dufwenberg & Kirchsteiger Reference Dufwenberg and Kirchsteiger(2004) to MBG. Inequality-averse players care only about the distribution of monetary outcomes. They behave antisocially if their own expected monetary payoff is below partner’s payoff regardless of her/his intentions. On the other hand, reciprocal players react to the expected intentions of the other player. If they expect that their partner will be kind to them, they will treat him kindly as well. If they expect that the other player will harm them, they want to retaliate even when this might be costly.
There is evidence that pre-emptive retaliation may play a role in explaining money-burning behavior. Abbink & Herrmann Reference Abbink and Herrmann(2011) and Ibanez & Saadaoui Reference Ibanez and Saadaoui(2022) show that subjects who expect their partners to burn their money are those who choose the money-burning option. Jauernig & Uhl Reference Jauernig and Uhl(2019) use a self-binding device to demonstrate the presence of pre-emptive retaliatory motives. The participants can commit themselves not to burn their counterpart’s money in their experiment. The fact that participants harmed uncommitted counterparts more frequently than committed ones demonstrates the presence of a pre-emptive retaliatory motive. However, they are interested in neither the prevalence nor the motivation for such behavior, and therefore these cannot be identified by their design. In contrast, our design allows us to measure the share of subjects who consider the MBG to be a coordination game and to sort these subjects based on whether their destructive choices are driven by inequality aversion or pre-emptive reciprocity. This distinction matters. Inequality-averse players may still be considered anti-social since they are willing to use burning to equalize the endowment even though their partner does not have any intention to harm them. On the other hand, we do not consider reciprocal behavior as anti-social since participants with these motivations are not disposed to harm peaceful partners.
This paper contributes to the literature by providing an innovative experimental design that isolates reciprocity from other (potentially) anti-social motives for destructive behavior. We find that reciprocity is a dominant motive for burning among our experimental participants. This may have important implications for the interpretation of the results of the MBG. If burning choices are driven by reciprocity, then it might be problematic to use the MBG to measure the impact of treatment on anti-social preferences. More generally, our results might shed light on the mechanism through which some treatment manipulations trigger destructive behavior in the MBG. Our results might also suggest possible strategies to reduce destructive behavior: If the choice to harm others is a pre-emptive reciprocal decision, then strategies should focus on lowering expectations of harm from the other participants. In contrast, if destruction is driven by anti-social motives, such strategies might be ineffective.
2. Experimental design and procedures
To disentangle the motives behind the burning behavior, we use a within-subject experimental design consisting of three parts:
• Simultaneous decision (SD): Subjects play the standard MBG by Abbink & Herrmann Reference Abbink and Herrmann(2011) in which pairs of players, each endowed with 60 Czech Crowns (CZK)Footnote 2, simultaneously decide whether to burn 30 CZK of their partner’s endowment and pay zero cost for burning. The zero cost of burning ensures that we are able to identify subjects that are even slightly inequality-averse, reciprocal, or spiteful. Zero costs of burning are also used by other studies, such as Zhang & Ortmann Reference Zhang and Ortmann(2016) or Jauernig et al. Reference Jauernig, Uhl and Luetge(2016).Footnote 3 Restricting the choice set to two possible actions (burn half or burn nothing) is common in experimental literature (e.g. Prediger et al., Reference Prediger, Vollan and Herrmann2014; Karakostas & Zizzo, Reference Karakostas and Zizzo2016; Bauer et al., Reference Bauer, Cahlıková, Chytilová and Želinský2018; Vorlaufer, Reference Vorlaufer2019; Zhang et al., Reference Zhang, Brown and Xie2020). After the players have made their choices in the SD, we ask each player to state the probability $\Pi \in [0, 100]\% $ with which they expected their partner to decide to burn. This elicitation is incentivized by the binary scoring rule from Karni Reference Karni(2009), with a reward of 30 CZK. The binary scoring rule works as follows: Suppose that a participant states a probability p that his partner will burn his money. The participant obtains the reward with probability
$(1-p)^2$ if his partner decided not to burn and with probability
$1-(1-p)^2$ if she decided to burn. This rule ensures that participants report their expectations truthfully, regardless of their risk aversion.
$\Pi \in [0, 100]\% $ with which they expected their partner to decide to burn. This elicitation is incentivized by the binary scoring rule from Karni Reference Karni(2009), with a reward of 30 CZK. The binary scoring rule works as follows: Suppose that a participant states a probability p that his partner will burn his money. The participant obtains the reward with probability
$(1-p)^2$ if his partner decided not to burn and with probability
$1-(1-p)^2$ if she decided to burn. This rule ensures that participants report their expectations truthfully, regardless of their risk aversion.• Strategy method: Subjects are given an initial endowment of 60 CZK. They choose whether they want to burn 30 CZK of their partner’s money in two situations: (1) if their partner chose to burn in the SD and (2) if the partner chose not to burn in the SD. The subjects are rematched in different pairs than in SD. In this new pair, both subjects make choices in SM, but then the computer randomly determines one subject whose decision will be implemented. The decision of the counterpart is taken from SD to collect Strategy method (SM) decisions from all players and keep all decisions consequential.
• Partner inactive (PI): Each subject is endowed with only 30 CZK and chooses whether to burn the money allocated to an inactive partner, participating in a different experimental session of this experiment, who is endowed with 60 CZK. This part is similar to the identification of inequality aversion used by Fehr et al. Reference Fehr, Bernhard and Rockenbach(2008).
All three parts are played as one-shot interactions, and subjects only know the instructions for the part they are currently playing, so that they do not anticipate any strategy regarding the following parts. Feedback of all parts is provided at the end of the experiment.
In addition, we control for order effects by varying the sequence of these three parts. To aid the understanding of incentivization in the SM, the SD always precedes the SM, which results in three possible orders: SD-SM-PI, SD-PI-SM, and PI-SD-SM. Moreover, we follow the strategy proposed by Zizzo Reference Zizzo(2010) to mitigate the experimenter demand effect and confront the subjects with money-burning choices only after they have played another full-fledged experiment. To control for the impact of the preceding experiment, subjects play either a cooperative or a competitive game prior to this experiment. Subjects’ payoff equals a sum of the payoffs from two parts of the experiment: the probability-elicitation task and one randomly selected part of the experiment (SD, SM, or PI).
At the end of the session, each subject filled out a post-experimental questionnaire and received their payoff in cash. In addition to standard socio-demographic questions, the questionnaire contained items to score the subject according to the IRI (Davis, Reference Davis1983), which takes a value between 0 and 112, with higher values representing more empathetic personalities. Previous research showed that empathy is related to pro-social and reciprocal behavior in experimental games. Specifically, empathy is positively related to the amount returned in trust games (Gunnthorsdottir et al., Reference Gunnthorsdottir, McCabe and Smith2002; Ben-Ner & Halldorsson, Reference Ben-Ner and Halldorsson2010; Pelligra, Reference Pelligra2011) and the amounts sent in dictator games (Ben-Ner et al., Reference Ben-Ner, Kong and Putterman2004). Following these studies, we use the IRI to see whether our classification of players reflects different levels of empathy.
Similar to Abbink & Herrmann Reference Abbink and Herrmann(2011), we also introduce two between-subject treatments to the SD. While the actions of all players are revealed at the end of the experiment in the open treatment, players in the hidden treatment have a 1/3 chance of earning only 30 CZK regardless of their partner’s decision. This manipulation is used by both Abbink & Sadrieh Reference Abbink and Sadrieh(2009) and Abbink & Herrmann Reference Abbink and Herrmann(2011), who show that subjects tend to burn more if they cannot be observed. In previous studies, researchers used the open (e.g., Prediger et al., Reference Prediger, Vollan and Herrmann2014; Zhang & Ortmann, Reference Zhang and Ortmann2016), the hidden (e.g., Jauernig et al., Reference Jauernig, Uhl and Luetge2016; Almas et al., Reference Almås, Auffhammer, Bold, Bolliger, Dembo, Hsiang, Kitamura, Miguel and Pickmans2019), or both versions of this game (Karakostas & Zizzo, Reference Karakostas and Zizzo2016; El Harbi et al., Reference El Harbi, Grolleau, Sutan and Ben Ticha2020).
The laboratory experiment was conducted in 13 sessions with a total of 300 undergraduate studentsFootnote 4 hired via hroot (Bock et al., Reference Bock, Baetge and Nicklisch2014). Subjects had no experience of similar experiments. Females formed 54% of participants. The age of the subjects varied between 19 and 30 years (mean 21.73 years). A total of 63.3% of subjects were of Czech nationality; the rest were Slovaks. A total of 64% of participants were students of economics or business. The experimental environment was programmed in zTree (Fischbacher, Reference Fischbacher2007). Before participants proceeded to each of the decision screens, the corresponding experimental instructions were read aloud while participants followed using printed copies.
3. Theoretical considerations
This section explains how we use our experimental design to identify nice, spiteful, inequality-averse, and reciprocal types. Spiteful and nice players have dominant strategies in MBG. Spiteful players get some additional utility from harming others or from being above in the payoff ranking. Since burning money affects payoff comparison in all parts of our experiments, both motivations yield the same prediction. Consequently, spiteful individuals consistently choose to burn money in all their decisions throughout the experiment. In contrast, nice players have a positive valuation of other players’ payoffs and abstain from burning money entirely.
Reciprocal and inequality-averse subjects consider the MBG to be a coordination game. We model the behavior of inequality-averse individuals through the Fehr-Schmidt utility function  $U_i=x_i-\alpha \max\{x_j-x_i,0\} - \beta \max \{x_i-x_j,0\}$, where xi is player’s i monetary payoff and α and β are parameters of inequality-aversion. For any positive value of the parameters, α and β the MBG become a coordination game. The behavior of reciprocal types can be formalized by a utility function $U_i=x_i+\theta k_{ij} k_{ji}$ suggested by Battigalli & Dufwenberg Reference Battigalli and Dufwenberg(2022). The utility function contains an interaction between the kij player i’s kindness to j and kji player j’s kindness to i and reciprocity parameter θ that measures the reciprocity. Again, any positive value of the reciprocity parameter ensures that MBG is a coordination game for reciprocal types (see Appendix A for formal details).
Table 1 illustrates how the choices made in the three parts of our design enable us to categorize our subjects into four distinct types. The SM part differentiates between nice, spiteful, and those who MBG to be a coordination game. Nice and spiteful subjects play dominant strategies: the nice never burn and the spiteful always burn. Reciprocal and inequality-averse follow the choices of the other player. The difference between reciprocal and inequality-averse lies in their PI choices. Since inequality-averse players are motivated purely by distributional concerns, they equalize payoffs by burning half of the endowment of their richer partner despite the fact that she is inactive. On the other hand, reciprocal players are driven by the desire to reciprocate their partner’s hostile behavior. They have no reason to burn money belonging to an inactive partner.
Burn action of different types

While the SD part is not essential for distinguishing between the four types, there are several reasons for including this part of the experiment. Firstly, it permits us to estimate the relative frequency of these types among those who opt to burn money in the standard MBG. Secondly, it enables us to test the prediction that reciprocal and inequality-averse types are more inclined to burn when they expect their partner to burn with a high probability Π. Finally, it allows us to detect possible inconsistencies.
The inconsistency check is particularly important because burning decisions are costless in our experiment. The absence of burning costs allows for a more distinct identification of different types. Participants with weak inequality aversion or weak spitefulness do not have to sacrifice their own monetary payoff to reduce inequality or harm the other player, and they reveal their preference even if these motives are relatively weak. However, the drawback of this design is that purely selfish players remain indifferent between burning and not burning. There is a concern that selfish individuals might inadvertently fall into different categories. Given the number of choices each participant makes, purely selfish preferences would primarily manifest as inconsistent choices. This provides us with an ex-post check to assess the validity of this concern.
4. Results
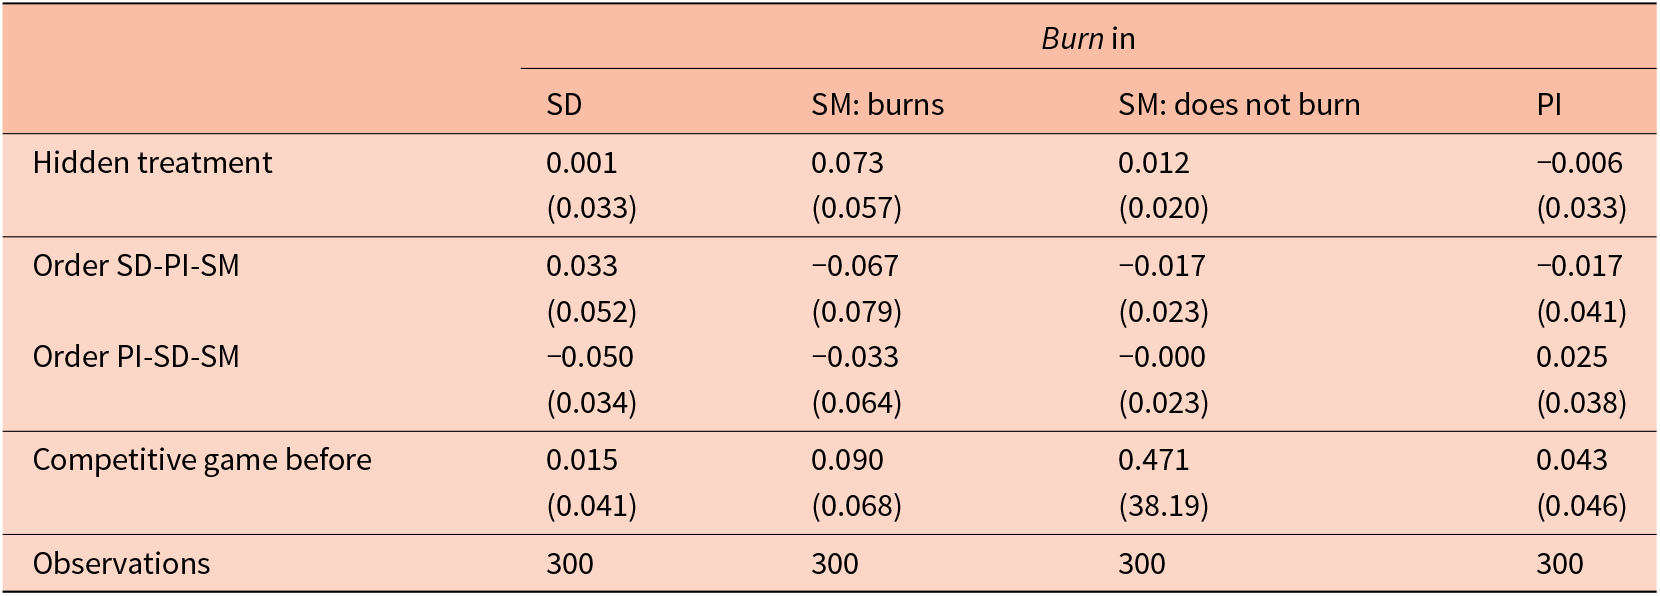
Table 2 presents burning frequencies in the open and the hidden treatments. The p-values in the last column show that burning frequencies in those treatments are not significantly different. Table 6 in Appendix B also shows that participants’ choices are not affected by the type of preceding game, nor by the order of the tasks. Since we observe similar frequencies of burning in all variants of the game, we pool the data in the following analysis.
Share of Burn actions in the open and hidden treatments
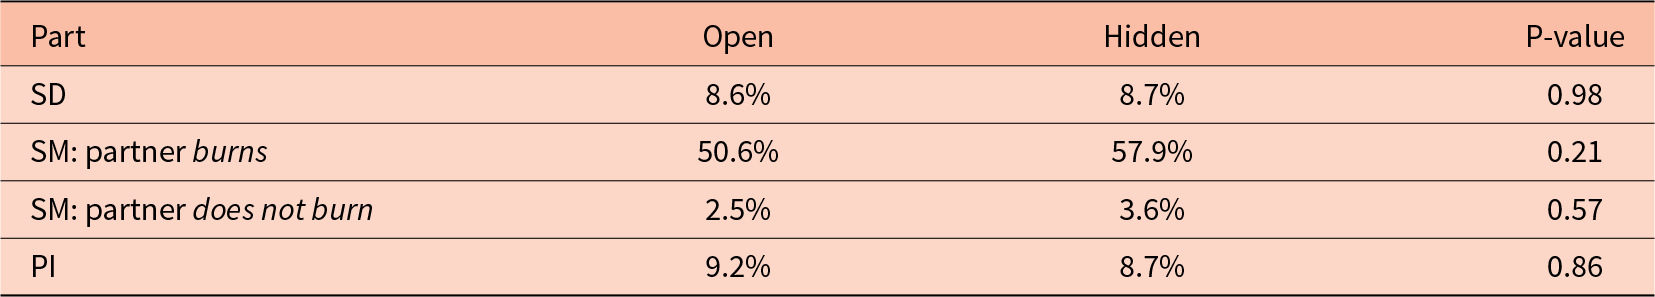
Note: P-value for the hypothesis that frequencies are equal.
The SD part of our experiment is a conceptual replication of the standard MBG. Abbink & Sadrieh Reference Abbink and Sadrieh(2009) and Abbink & Herrmann Reference Abbink and Herrmann(2011) report a significantly higher incidence of burning in the hidden treatment. They argue that the hidden treatment removes other motives such as fear of retaliation or social image concerns and interpret the results as evidence for spitefulness. Interestingly, we fail to replicate the difference between hidden and open treatment. Our experiment is very well-powered.Footnote 5 It has a power of 93% to detect the same effect as in Abbink & Herrmann Reference Abbink and Herrmann(2011) at a 5% significance level. This replication failure is the first suggestive evidence that other motives than spitefulness play a role in our experiment.
Our experimental design allows us to sort our subjects into types. The left panel of Table 3 shows that 45.3% of our 300 subjects are nice and only 1.7% of our subjects are spiteful. A total of 51% of our subjects behave as if the MBG was a coordination game: 6% for distributional reasons and 45% out of reciprocity. Only 2% of our subjects are inconsistent, which suggests that our classification is reasonably exhaustive, and it confirms that indifference between burning and not burning is an exception.Footnote 6 In the entire population, the reciprocal types are significantly more frequent than spiteful and inequality-averse types combined (P-value < 0.001). The results show that only a small minority of participants seem to derive intrinsic utility from harming or beating their partners. Most participants are unwilling to harm a peaceful partner; if they decide to burn, they do so because they expect their partner to burn too. This decision is much more frequently motivated by the desire to punish spiteful intentions of the other player than by inequality aversion. This conclusion is also supported by Table 4, which shows the average marginal effect of strategy method (SM) and partner inactive (PI) on the burning decision, with the SD part serving as the baseline. It confirms that participants strongly react to their partner’s action. In particular, the frequency of money-burning choices increases by 0.45 when the partner burns money as well. The same effect is not observed in the partner inactive (PI) part when participants can merely equalize monetary payoffs by burning.
Relative frequencies of types (in %)
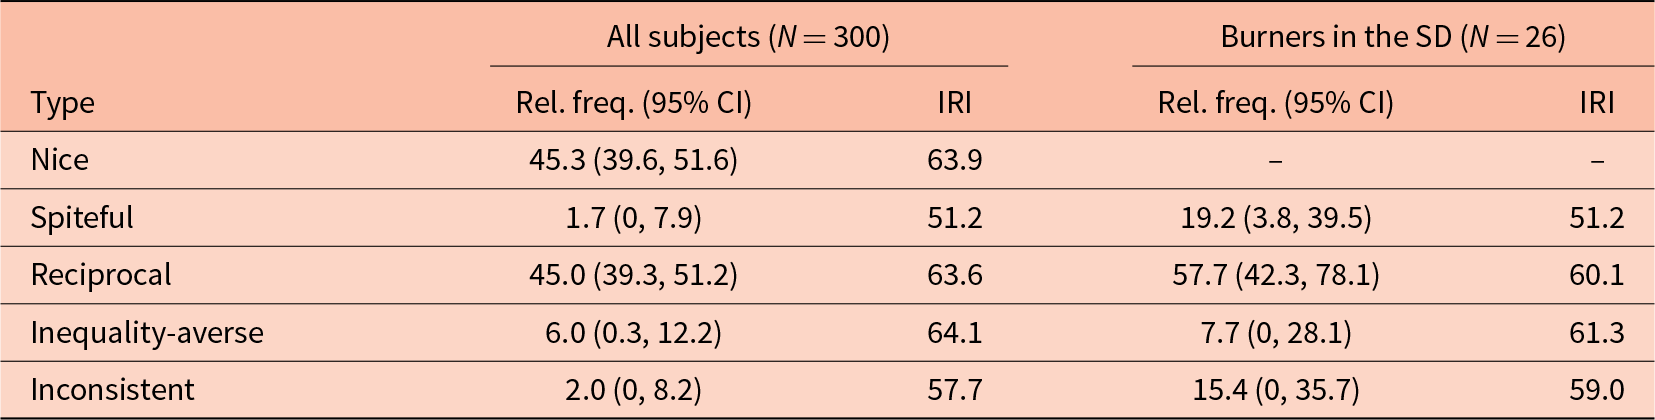
Note: Confidence intervals calculated using the method proposed by Sison & Glaz Reference Sison and Glaz(1995).
Average marginal effects of different experimental parts
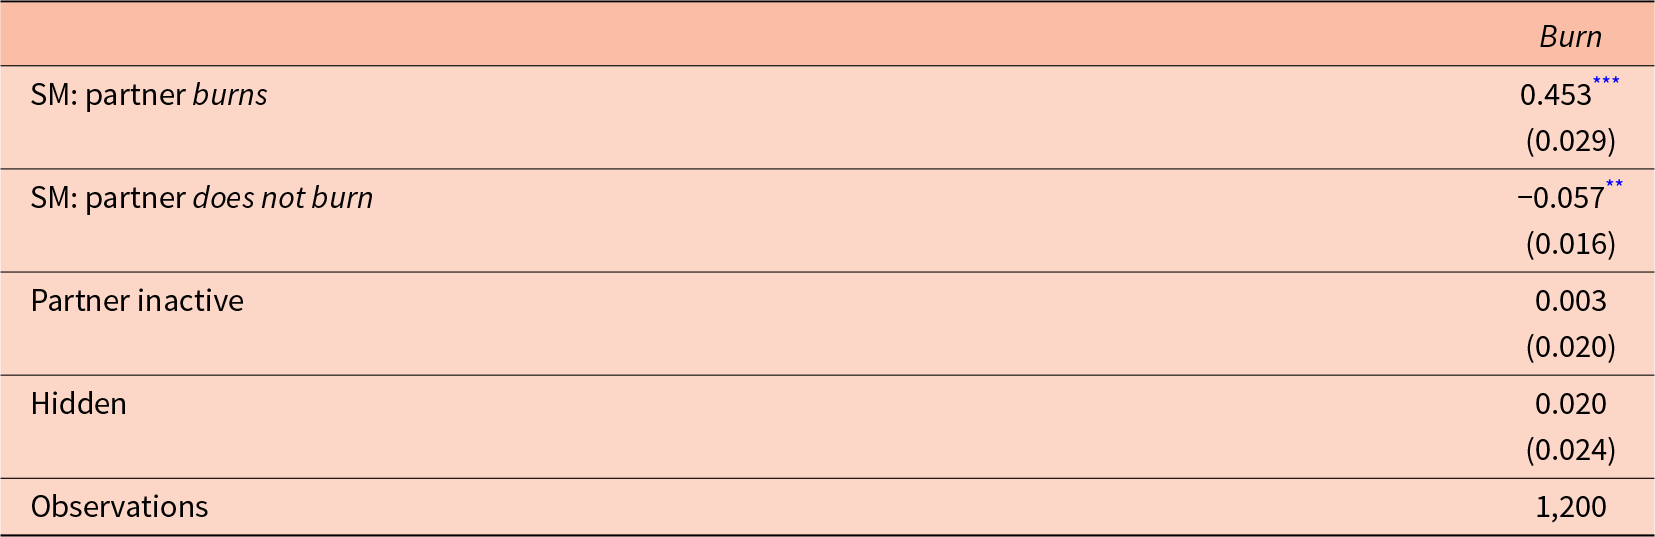
Note: Logit model for all choices with standard errors clustered at the participant level. The parameters of SM and partner inactive show the effect of different experimental parts compared to the SD part. Significance:
** P < 0.01;
*** P < 0.001.
It is also important to know which types of subjects decide to burn money in the standard MBG. The right side of Table 3 reports a similar split into types among those who burned in the SD. The burning rate is 8.6%. Such low frequencies of burning are common in laboratory experiments (Abbink & Herrmann, Reference Abbink and Herrmann2011; Karakostas & Zizzo, Reference Karakostas and Zizzo2016; Dickinson & Masclet, Reference Dickinson and Masclet2019; El Harbi et al., Reference El Harbi, Grolleau, Sutan and Ben Ticha2020; Zhang et al., Reference Zhang, Brown and Xie2020). The table shows that only 19.2% of the burners are spiteful, while 65.4% considers the MBG to be a coordination game, and 57.7% behaves reciprocally. Although only a small number of participants burn in the SD part, we can see that reciprocal types are more frequent than spiteful and inequality-averse types also among burners.
The burning choices made by the reciprocal and inequality-averse subjects (N = 153) should depend on their expectations of their counterpart’s behavior. We therefore test whether the burning choices made by these subjects positively correlate with their expectations of burning. Table 5 reports the average marginal effects of the logit model that explains whether these subjects decide to burn in the SD. A one percentage point increase in expectations increases the chance of burning by 0.5%. This effect remains robust even if we control for IRI and socio-demographic variables, namely, age, gender, field of study, and nationality. This result provides additional evidence that these subjects burn in reaction to a perceived threat of burning from the other side.
Average marginal effects for subjects following partner’s choice in SM

Note: Logit model for choices in SM part. Significance:
+ P < 0.1;
* P < 0.05;
** P < 0.01.
The reciprocal and pro-social behavior is known to be related to empathy (Pelligra, Reference Pelligra2011; Edele et al., Reference Edele, Dziobek and Keller2013). We therefore look at the correlation between the four types we have identified and the subjects’ level of empathy as measured by the IRI. Table 3 shows that while the spiteful players exhibit significantly lower levels of empathy relative to the rest of the population (Mann-Whitney U P-value = 0.02), the IRI values for all other subject types are similar and no other type’s IRI is significantly different from the rest of the population. In other words, when our results classify a subject as spiteful, this captures a particular personality trait, namely, a lower level of empathy. Interestingly, empathy also plays a role among the subjects who perceive MBG as a coordination game. Table 5 shows that those with lower levels of empathy are more likely to burn money if we simultaneously control for expectations. This suggests that the burning decision captures a lower level of empathy when we compare reciprocal or inequality-averse subjects who perceive the same threat of burning from the other partner.
5. Discussion
We find that the majority of subjects who choose to burn in the SD, or in any part of the experiment, perceive the MBG as a coordination game. Among those who prefer to coordinate with their partner, the majority are not motivated by inequality aversion but by a desire to reward their partners’ good behavior and punish their partners’ bad behavior. Decisions to burn among these participants are primarily driven by expectations about partners’ actions. Our results also show that the decision to burn money is closely associated with the player’s level of empathy. Spiteful subjects are less empathetic than others, and reciprocal and inequality-averse subjects with the same expectations about their opponents’ choices are more likely to burn money if they are less empathetic.
Our findings have important implications for the interpretation of the MBG. They suggest that burning choices cannot be straightforwardly interpreted as driven by nastiness or competitiveness in the sense that the subjects obtain some intrinsic utility from beating or harming others. Although the majority of researchers are interested in treatment effects in the MBG, our results caution them against assuming that these treatment effects are solely a product of shifts in participants’ spitefulness. To address this concern, researchers interested in anti-social motives might consider using the one-sided MBG, in which only one player in the pair decides whether to burn money (as, e.g., in Zhang & Ortmann Reference Zhang and Ortmann(2016) or Dickinson & Masclet Reference Dickinson and Masclet(2019)). Alternatively, they could follow our approach and use a strategy method to differentiate between antisocial and reciprocal rationales underpinning decisions to burn money.
Replication material
The replication and supplementary material for the study are available at https://doi.org/10.17605/OSF.IO/PMJFW.
Acknowledgements
This paper benefited from discussions with Lubomír Cingl, Julie Chytilová, and Tommaso Reggiani and audiences at the ESA European Meeting 2019, SABE 2019, and Young Economists Meeting 2019. We would like to thank Jana Zuzaňáková for excellent research assistance.
Funding statement
We gratefully acknowledge financial support from the Czech Science Foundation through Grant GA21-25331S and from the Grant Agency of Masaryk University through Grant MUNI/A/1198/2018.
Competing interests
The authors have no competing interests to declare.
Appendix A
Inequality-averse players
Suppose players with standard inequality-averse utility function
 \begin{equation*}{U_i} = {x_i} - \alpha \max \left\{ {{x_j} - {x_i},0} \right\} - \beta \max\left\{ {{x_i} - {x_j},0} \right\}\end{equation*}
where xi is player’s i monetary payoff and α > β > 0 are inequality-averse parameters. The payoffs (utilities) in our experimental money-burning game are then given by the following table

Payoff comparison shows that for any positive value of parameters α and β the game is a coordination game. In the PI part, the payoffs of the inequality averse player correspond to the Burn column.
Reciprocal players
Suppose players with reciprocity utility functions
 \begin{equation*}{U_i} = {x_i} + \theta {k_{ij}}{k_{ji}}\end{equation*}
where xi is player’s i monetary payoff, kij player i’s kindness to j, kji is the j’s kindness to i, and θ > 0 is the reciprocity parameter. Kindness is defined as a difference between the monetary payoff i believes j gets and a comparison payoff, which is the average of the payoffs that i believes j could get for other choices of i, i.e.
 \begin{equation*}{k_{ij}}\left( {{a_i},p} \right) = {x_j}\left( {{a_i},p} \right) - \frac{1}{n}\mathop \sum \limits_{{a_k}} {x_j}\left( {{a_k},p} \right)\end{equation*}
In our experimental game, if i believes there is probability p that j would choose burn, we get
 \begin{equation*}{k_{ij}}\left( {Burn,p} \right) = 30 - \frac{1}{2}\left( {30 + 60} \right)\end{equation*}
 \begin{equation*}{k_{ij}}\left( {Don't,p} \right) = 60 - \frac{1}{2}\left( {30 + 60} \right)\end{equation*}
 \begin{equation*}{k_{ji}}\left( p \right) = p30 + \left( {1 - p} \right)60 - \frac{1}{2}\left( {30 + 60} \right)\end{equation*}
Given the equilibrium expectations, i.e. players correctly anticipate other player’s action, the payoffs (utilities) are given by the following table

Payoff comparison shows that for any positive value of parameter θ the game is a coordination game. In the PI part, the reciprocal term is zero because the other player has no influence on the monetary payoff.
Appendix B
Average marginal effects of experimental variations

Note: Significance: +p < 0.1; *p < 0.05; **p < 0.01; ***p < 0.001


 Open access