





Introduction
Coarctation of the aorta ranks as the fifth most prevalent congenital heart anomaly. Reference Reller, Strickland, Riehle-Colarusso, Mahle and Correa1,Reference Gibbs2 Coarctation of the aorta leads to elevated blood pressure proximal to the narrowing and reduced perfusion in the distal portion of the aorta, necessitating further treatment. Early diagnosis and timely repair are strongly recommended to mitigate the development of persistent or residual arterial hypertension. Reference O’Sullivan, Derrick and Darnell3 Additionally, long-term data reveal a correlation between systemic hypertension and mortality, particularly concerning the age at which corrective surgery or percutaneous intervention is performed. Reference Chen, Donald, Storry, Halcox, Bonhoeffer and Deanfield4,Reference Vriend and Mulder5
Transcatheter repair of coarctation of the aorta, especially in adult patients, has been the cornerstone of therapy for the past few decades. Reference Redington, Hayes and Ho6 Remarkably, stent implantation significantly reduces or eliminates the pressure gradient in approximately 95% of cases. Reference Zabal, Attie, Rosas, Buendía-Hernández and García-Montes7 Even after successful early repair, patients remain at an elevated risk of developing cardiovascular diseases, with systemic arterial hypertension persisting in up to 30% of cases. Reference Hager, Kanz, Kaemmerer, Schreiber and Hess8 Long-term observational studies indicate that arterial hypertension persists in approximately 41% of patients, even 24 years after the initial repair. Reference Vriend, Montfrans and Romkes9
Despite the effectiveness of the treatment, the presence of hypertension in these patients remains a common and concerning issue. One mechanism implicated in the coarctation of the aorta and the persistence of hypertension, even post-repair, is the activation of the renin-angiotensin-aldosterone system. This phenomenon is also observed in renovascular disease and mid-aortic syndrome. Captopril renal scintigraphy is a test that can identify renovascular conditions and predict treatment response. Reference Taylor, Nally and Aurell10,Reference Fommei, Ghione and Hilson11 Earlier studies demonstrated high sensitivity (87–96%) and specificity (85–95%) of captopril renal scintigraphy in detecting renal artery stenosis and renovascular hypertension. Reference Taylor, Nally and Aurell10,Reference Stratigis, Stylianou and Kyriazis12,Reference Dondi, Fanti and De Fabritiis13 However, more recent evidence highlights significant variability in diagnostic performance, influenced by factors such as patient selection, underlying renal function, and the presence of branch or bilateral arterial lesions. Reference Reusz, Kis, Cseprekál, Szabó and Kis14 Some studies have suggested that a positive renal scintigraphy result may predict improvements in renovascular hypertension following renal artery revascularisation. Reference Dondi, Fanti and De Fabritiis13,Reference Meier, Sumpio, Setaro, Black and Gusberg15 Measuring plasma renin activity with captopril renal scintigraphy can significantly improve the diagnostic accuracy for the early identification and management of renovascular hypertension. Reference Zhao, Shi, Wu, Zhang, Zheng and Wang16
Renal scintigraphy is not conventionally employed as a standard diagnostic tool for assessing patients with coarctation of the aorta who are suspected of having residual hypertension. Moreover, there is debate over the predictive utility of renal scintigraphy for identifying patients who benefit from surgical or transcatheter interventions for coarctation of the aorta. This pilot study was initiated to investigate the relationship between the severity of coarctation of the aorta and renal perfusion. Furthermore, the study aimed to assess the potential of renal scintigraphy as a predictive instrument for predicting clinical outcomes following percutaneous treatment of coarctation of the aorta in a select patient cohort.
Materials and methods
The current study received approval from the Vilnius Regional Biomedical Research Ethics Committee (reference number 2019/5-1113-619). An informed and signed patient consent form was obtained. The authors assume complete responsibility for the study’s design, implementation, all analytical procedures, the drafting and editing of the manuscript, and the final content thereof.
Study population
In this prospective study, we recruited adult patients presenting with either native or residual coarctation of the aorta and concomitant arterial hypertension. Exclusion criteria for participation in the study included complex congenital conditions involving left-sided lesions, such as residual severe aortic valve stenosis or regurgitation, mitral valve disease, or Shone’s syndrome. The research did not include pregnant individuals or those planning to become pregnant during the study. The selected patients underwent a comprehensive assessment, including ambulatory 24-hour blood pressure monitoring, CT, and renal perfusion scans. After their enrolment in the study, all patients underwent cardiac catheterisation, including angiography and measurement of the pressure gradient along the isthmus. Patients who had invasive peak gradients across the isthmus ≥20 mmHg and/or demonstrated a ≥ 50% diameter difference between the isthmus and the descending aorta at the diaphragmatic level (CT scan or angiogram) were selected for percutaneous stent implantation and were included in the Stent group. The Medical therapy group (Medical group) comprised patients with confirmed aortic coarctation who did not meet established guideline-based criteria for stent implantation and therefore required further comprehensive anatomical and haemodynamic evaluation before a definitive treatment decision was made. The Stent subgroup underwent repeat renal perfusion scans after stent implantation to assess the intervention’s outcomes.
Diagnostic workup
Ambulatory 24-hour blood pressure monitoring was performed for all patients, with the cuff positioned on the right arm, as recommended for patients with coarctation. Reference Stout, Daniels and Aboulhosn17
Coarctation of the aorta was defined based on computed tomography angiography scans. As described previously, aortic measurements were obtained from three-dimensional reconstructions using oblique angulations perpendicular to the vessel’s longitudinal axis. Reference Ou, Bonnet and Auriacombe18 The extent of residual stenosis was computed as the ratio of the diameters at the isthmus to the diaphragmatic aorta.
All patients in the study underwent ACE-inhibitor renography with the radiopharmaceutical 99mTc-MAG3. The procedure adhered to the recommendations outlined in the consensus report on ACE inhibitor renography for detecting renovascular hypertension. Reference Taylor, Fletcher and Nally19 Patients treated with percutaneous stent implantation were re-evaluated 3–6 months after the intervention.
A one-day protocol was used. Baseline dynamic imaging was performed after intravenous administration of 90 MBq 99mTc-MAG3. Three hours later, captopril 50 mg was administered orally, and a second acquisition was performed 30 minutes thereafter using approximately 225 MBq of 99mTc-MAG3. To minimise medication carryover effects, ACE inhibitors and diuretics were discontinued three days prior to the study. Patients were instructed to maintain adequate hydration and to empty their bladders before imaging.
Regions of interest were placed over each kidney with background correction and over the abdominal aorta for perfusion assessment. Relative renal function was calculated from tracer uptake. Time to peak (T max), time to half-peak (T½), T max/ T½ ratio, 30-min/T max ratio, and 20-min/3-min ratio were derived from time–activity curves. Reduced renal perfusion after ACE inhibition was defined according to established Tc-99 m MAG3 criteria, including ≥2-minute or ≥40% T max prolongation, ≥0.15 increase in the 30-min/T max ratio, or >10% reduction in relative uptake. Reference Li, Russell, Palmer-Lawrence and Dubovsky20
Percutaneous procedures were conducted as described previously. Reference Bambul Heck, Fayed and Hager21 All procedures were carried out under conscious sedation. In patients with low baseline blood pressure, a continuous intravenous infusion of norepinephrine (0.05–0.1 µg/kg/min) was administered for at least 15 minutes to achieve a stable systolic blood pressure >140 mmHg prior to invasive gradient assessment. This approach was used to avoid underestimation of the trans coarctation gradient under hypotensive conditions. However, pharmacologic blood pressure augmentation may have led to a slight overestimation of the measured gradient; therefore, invasive measurements were interpreted in the context of comprehensive clinical and anatomical assessment and were not used in isolation for treatment decisions. Only patients who displayed an invasively measured peak gradient across the lesion exceeding 20 mmHg and/or exhibited a ≥50% diameter difference between the isthmus and the descending aorta at the diaphragm level were selected for percutaneous stent placement and were screened for the Stent group.
Statistical analysis
Descriptive statistics such as frequency tables and mean (standard deviation) were used to describe qualitative and quantitative data. Initial measurements were compared between patients who received stent implantation and those who did not. The Mann-Whitney U test was used to evaluate parameter differences between stent implantation groups. The Wilcoxon signed-rank test was used to compare parameters before and after stent implantation. A two-tailed p-value less than 0.05 was statistically significant. Statistical analysis was performed using RStudio version 2023.09.1 + 494.
Results
Between 2019 and 2022, 17 patients with either native or residual coarctation of the aorta were enrolled in our study. The mean age at inclusion was 36.4 ± 17.80 years. Of these patients, 12 out of 17 (70.6%) were male. A subset of 6 patients presented with native coarctation of the aorta. All participants with an invasive gradient ≥20 mmHg underwent percutaneous stent implantation (6/17), whereas the remainder (11/17) received only invasive diagnostic evaluations. For the cohort undergoing stent implantation, renal perfusion scans were repeated between 3 and 6 months post-procedure.
Medication usage was recorded for both groups. No significant differences were observed in the use of most medications, except for ACE inhibitors, for which a notably higher percentage was observed in the Stent group (83.3%) compared with the Medical group (36.4%) (p = 0.13). Before measuring invasive gradients, all subjects underwent clinical and ambulatory 24-hour blood pressure monitoring. Comparative analysis between the groups revealed comparable pressure differentials between the right and left arms and between the right arm and lower extremities. During the 24-hour ambulatory blood pressure monitoring, both cohorts demonstrated similar systolic and diastolic blood pressure readings (Supplementary Table S1).
The left ventricular mass index, as measured by echocardiography, showed no significant difference between the groups, with an average value of 88.7 ± 16.45 g/m2 in the study population. Notably, the gradient across the coarctation of the aorta was higher in the Stent group (38.57 ± 16.05 mmHg) compared to the Medical group (26.93 ± 10.97 mmHg), though this difference was not statistically significant (p = 0.11).
The quantitative evaluation of aortic arch dimensions in this study found no differences between the Medical and Stent groups. Specifically, the aortic arch height measured 58.8 ± 8.50 mm in the Medical group, compared to 60.22 ± 14.13 mm in the Stent group, a difference that was not statistically significant (p = 0.96). In contrast, the aortic arch width varied more substantially, with the Medical group averaging 65.42 ± 10.92 mm and the Stent group averaging 78.53 ± 37.81 mm. However, this difference also did not reach statistical significance (p = 0.80). When analysing the aortic arch height-to-width ratio, the Stent group demonstrated a marginally lower average ratio (0.83 ± 0.22) than the Medical group (0.91 ± 0.12) (p = 0.51). The angular measurement of the aortic arch showed no significant difference, with an average of 60.31 ± 8.63 degrees in the Medical group and 63.61 ± 13.95 degrees in the Stent group, yielding a combined mean angle of 61.55 ± 10.62 degrees. These findings suggest a tendency towards a Gothic arch configuration in the Medical group.
Furthermore, the isthmus/descending aorta ratio was lower in the Stent group (0.62 ± 0.21) than in the Medical group (0.75 ± 0.15), with a p = 0.25. A significant difference was observed in the isthmus/aortic arch ratio, being 0.52 ± 0.16 in the Stent group and 0.86 ± 0.21 in the Medical group (p-value < 0.05). The Stent group exhibited a higher residual stenosis rate (37.63%) than the Medical group (28.2%), although this difference was not statistically significant (p-value 0.25).
A notable proportion of patients (11 of 17, 64.7%) required a continuous intravenous norepinephrine infusion for at least 15 minutes to elevate their systolic blood pressure above 140 mmHg during invasive pressure gradient measurement. The pharmacologic elevation of blood pressure was deemed necessary to simulate physiological conditions and to ensure that the haemodynamic measurements accurately reflected the dynamics of real-life circulation. Within this subgroup, 6 (35.29%) patients demonstrated an invasively measured peak gradient across the vascular lesion exceeding 20 mmHg or a diameter reduction of 50% or more at the diaphragmatic level between the isthmus and the descending aorta. These patients subsequently underwent percutaneous stent placement. The mean invasive gradient in the Stent group was significantly higher at 19.67 ± 14.54 mmHg than in the Medical group (5.55 ± 4.32 mmHg; p = 0.03), highlighting the greater haemodynamic challenge that necessitated intervention in the Stent group. No residual gradient after stent implantation (Stent group) was achieved in all patients except for one (patient 2), who still had a residual gradient of 9 mmHg.
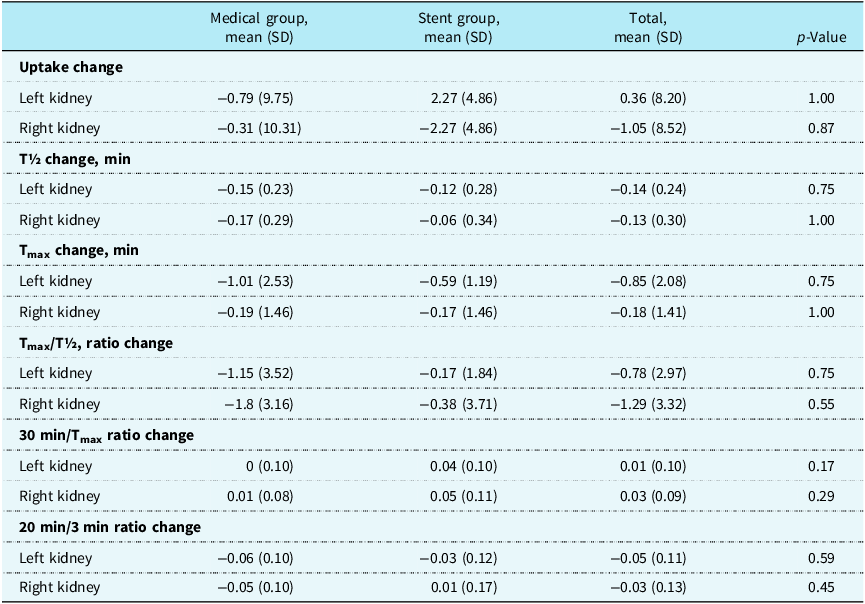
The renal perfusion scans, conducted as an essential comparative measure between the Medical and Stent groups, did not reveal significant differences, as detailed in Supplementary Table S2. The mean T max change did not significantly differ between the groups. In the Medical group, the Tmax change was −1.01 ± 2.53 min. for the left kidney and −0.19 ± 1.46 min. for the right kidney. In the Stent group, these values were −0.59 ± 1.19 min. for the left kidney and −0.17 ± 1.46 min. for the right kidney, with p-values exceeding 0.05. The T½ ratio change showed no significant difference between groups in either kidney. The Medical group recorded values of −0.15 ± 0.23 for the left kidney and −0.17 ± 0.29 for the right kidney. The Stent group had values of −0.12 ± 0.28 for the left kidney and −0.06 ± 0.34 for the right kidney, with p-values > 0.05. Furthermore, the 30 min/T max ratio change in the Medical group was 0 ± 0.1 for the left kidney and 0.01 ± 0.08 for the right kidney. By contrast, the Stent group exhibited a 30 min/T max ratio change of 0.04 ± 0.1 for the left kidney and 0.05 ± 0.11 for the right kidney, with a p-value greater than 0.05, as detailed in Table 1.
Comparison of changes in renal perfusion scan parameters between Medical and Stent groups

Table 1. Long description
The table presents a comparison of renal perfusion scan metrics between Medical and Stent groups, focusing on various parameters such as uptake change, T half change, T max change, T max over T half ratio change, 30 min over T max ratio change, and 20 min over 3 min ratio change for both left and right kidneys. The table consists of 8 rows and 5 columns, with column headers including Medical group mean, Stent group mean, Total mean, and p-Value. Each row represents a different metric, with values provided for both the left and right kidneys. Notable trends include the lack of significant differences in T max change and T ratio change between the groups, as indicated by p-values greater than 0.05. The Medical group shows a T max change of 1.01 2.53 minutes for the left kidney and 0.19 1.46 minutes for the right kidney, while the Stent group shows 0.59 1.19 minutes for the left kidney and 0.17 1.46 minutes for the right kidney. The T ratio change in the Medical group is 0.15 0.23 for the left kidney and 0.17 0.29 for the right kidney, compared to 0.12 0.28 for the left kidney and 0.06 0.34 for the right kidney in the Stent group. The 30 min over T max ratio change is 0 0.1 for the left kidney and 0.01 0.08 for the right kidney in the Medical group, whereas the Stent group shows 0.04 0.1 for the left kidney and 0.05 0.11 for the right kidney. The table highlights the comparative analysis of renal perfusion metrics, emphasizing the lack of significant differences between the two groups.
Stent group analysis
In our study, six patients underwent stent implantation, with repeat renal scintigraphy performed 3–6 months after the procedure. The detailed patient data is presented in Supplementary Table S3.
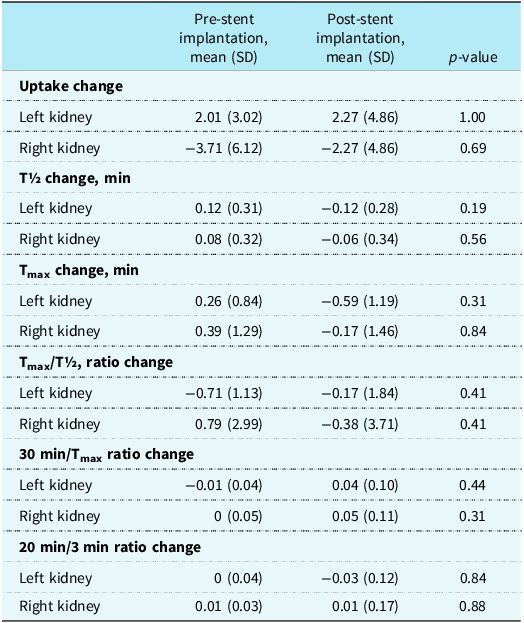
No statistically significant differences were observed between pre-stent and post-stent measurements (Table 2). The mean T max change did not differ significantly between pre-and post-stent measurements, 0.26 ± 0.84 min. and 0.39 ± 1.29 min. for the left and right kidney, respectively, before stent implantation, and −0.59 ± 1.19 min. and −0.17 ± 1.46 min. post-implantation (p-values > 0.05). The change in the T½ change was also comparable between the pre-and post-stent periods in both kidneys. The pre-stent group showed values of 0.12 ± 0.31 for the left kidney and 0.08 ± 0.33 for the right kidney, whereas the post-stent group showed values of 0.12 ± 0.28 for the left kidney and −0.06 ± 0.34 for the right kidney (p-values > 0.05). The 30 min/T max ratio change in the pre-stent was −0.01 ± 0.04 for the left kidney and 0 ± 0.05 for the right kidney. Post-stent, the ratio change was 0.04 ± 0.1 for the left kidney and 0.05 ± 0.11 for the right kidney, with a p-value > 0.05.
Comparison of changes in renal perfusion scan parameters before and after stent implantation

Table 2. Long description
The table presents a comparison of various kidney parameters before and after stent implantation. It includes data on uptake change, T½ change, Tmax change, Tmax/T½ ratio change, 30 min/Tmax ratio change, and 20 min/3 min ratio change for both left and right kidneys. The table has six rows and five columns, with columns for pre-stent mean, post-stent mean, standard deviation, and p-value. Notable parameters include uptake change with values like 2.01 and -3.71 for the left and right kidneys pre-stent, and 2.27 and -2.27 post-stent. T½ change shows values like 0.12 and 0.08 pre-stent, and -0.12 and -0.06 post-stent. Tmax change values are 0.26 and 0.39 pre-stent, and -0.59 and -0.17 post-stent. The p-values indicate no statistically significant differences between pre-stent and post-stent measurements.
The small sample size of the patient group may limit the interpretability of the findings. However, some patients showed improvements, as shown in Figure 1.
Individual changes in renal perfusion scan parameters before and after stent implantation.

Figure 1. Long description
Each line represents a different patient, identified by distinct colors and symbols. The delta Tmax graph shows changes in peak time, the delta T1/2 graph shows changes in half-time, and the ratio graphs show the relationship between before and after stent implantation.
Discussion
In this study, we initially hypothesised that patients with moderate to severe coarctation of the aorta might suffer from renal hypoperfusion, which could contribute to residual arterial hypertension. To investigate this, we performed a prospective analysis on a cohort of patients who presented with native or residual coarctation of the aorta and subsequently developed arterial hypertension following successful surgical and interventional treatment of the coarctation.
Contrary to our initial expectations, our study’s results did not demonstrate a measurable reduction in renal perfusion among patients with moderate-to-severe coarctation of the aorta, even in those with long-standing arterial hypertension. These findings suggest that any association among coarctation severity, residual hypertension, and renal perfusion may be less direct or undetectable with the methods used in this study. While preserved renal perfusion in this setting may reflect adaptive physiological responses, the presence and contribution of such mechanisms cannot be determined from the present dataset. Pharmacologic antihypertensive treatment may contribute to the maintenance of renal perfusion, but this should be considered a plausible explanation rather than a conclusion directly supported by our measurements. Similarly, it is possible that partial blood pressure control is associated with compensatory mechanisms that could help preserve renal blood flow despite proximal obstruction, although this hypothesis requires further investigation and was not directly assessed in this study.
Alternatively, the lack of observed change may reflect the moderate degree of obstruction in most patients or limitations of the assessment method.
Arterial hypertension
Residual hypertension is reported in approximately 30% to 40% of patients post-repair of coarctation of the aorta, as indicated in previous research. Reference de Divitiis, Rubba and Calabrò22 In our study, no significant differences in overall systolic or diastolic blood pressure were observed between patients in the Stent group and those in the Medical group as measured by ambulatory 24-hour blood pressure monitoring. Previous research by Choudhary et al. did not establish a definitive association between hypertension prevalence and residual coarctation of the aorta, suggesting that other factors may exert greater influence. Reference Choudhary, Canniffe, Jackson, Tanous, Walsh and Celermajer23
Renal perfusion scintigraphy is commonly used in the evaluation of renovascular hypertension. In unilateral renal artery stenosis, even moderate narrowing may activate the renin–angiotensin–aldosterone system due to localised hypoperfusion. Renal perfusion scans are beneficial for detecting haemodynamically significant stenosis, typically defined as luminal narrowing exceeding 60%. At this threshold, the reported sensitivity ranges from 48% to 67%, and the specificity is 100%. Reference Sfakianakis, Bourgoignie, Jaffe, Kyriakides, Perez-Stable and Duncan24 In contrast, coarctation of the aorta results in a more global and symmetric reduction in renal perfusion pressure. This difference may influence the degree of renin–angiotensin–aldosterone system activation and the resulting haemodynamic response.
In our cohort, although all patients had at least 30% aortic narrowing, only one patient exhibited a stenosis greater than 60%. The absence of significant changes in renal perfusion parameters may therefore reflect the relatively moderate severity of obstruction. It is also possible that compensatory mechanisms, such as collateral circulation or vascular adaptation, help maintain renal perfusion in these patients; however, these mechanisms were not directly assessed in our study.
In CoA, upper-body hypertension combined with lower-body hypoperfusion creates a complex interplay of compensatory mechanisms, including baroreceptor resetting, vascular remodelling, and increased systemic vascular resistance. These processes may influence renal perfusion dynamics and systemic blood pressure regulation, potentially lowering the likelihood of overt renin–angiotensin–aldosterone system-driven hypertension unless the anatomical obstruction is severe.
Captopril renal scintigraphy is instrumental in revealing the physiological impact of angiotensin II on the autoregulation of glomerular filtration rate, particularly its differential effects on the tone of afferent and efferent arterioles. Reference Mann and Pickering25 In patients with compromised afferent arteriolar function, regulating efferent arteriolar tone becomes crucial for maintaining glomerular filtration. The administration of ACE inhibitors disrupts the angiotensin II-mediated vasoconstriction, potentially leading to a decline in the glomerular filtration rate. Therefore, variations in glomerular filtration rate observed on renal scintigraphy after ACE inhibitor administration can indicate significant renal hypoperfusion. Reference Mann, Pickering and Sos26
Several studies have examined the renin–angiotensin system activity in patients with coarctation of the aorta. Elevated plasma renin activity observed in coarctation patients may provide insights into the aetiology of hypertension associated with renal hypoperfusion. The mechanism begins with a reduction in initial renal blood flow, which triggers an increased renin output from the kidney’s juxtaglomerular apparatus. Renin acts to convert angiotensinogen to angiotensin I, which is subsequently converted to angiotensin II by the angiotensin-converting enzyme primarily found in the lungs. Angiotensin II induces vasoconstriction and stimulates aldosterone hypersecretion, leading to sodium and water retention and, consequently, an expansion of extracellular fluid volume. This increased blood volume enhances renal perfusion, subsequently diminishing the stimulus for further renin secretion. Reference Parker, Farrell, Streeten, Blackman, Sondheimer and Anderson27
The criteria for assessing alterations in renal perfusion include a change in the 30-minute/peak uptake ratio of 0.15 or more and an increase in Tmax of at least 2 minutes or 40% following ACE inhibition. Reference Li, Russell, Palmer-Lawrence and Dubovsky20 Captopril-enhanced renal scintigraphy provides functional insight into the role of angiotensin II in maintaining glomerular filtration. In our study, established criteria for significant perfusion impairment were not met in either the Medical or Stent groups. This finding suggests that clinically relevant renal hypoperfusion may not have been present in most patients; however, it does not exclude more subtle alterations in renal haemodynamics.
Moreover, the absence of a notable improvement in renal perfusion after stent implantation, despite a reduction in the gradient at the coarctation site, should be interpreted with caution. This observation may reflect factors such as chronic adaptation, moderate lesion severity, or methodological limitations, the relatively moderate severity of coarctation, or limitations in the sensitivity of the diagnostic method. This observation may suggest differences compared to patients with renovascular hypertension, who typically present with severe (>90%) stenosis of the renal arteries, a condition less frequently associated with aortic coarctation. The observation that long-standing narrowing of less than 90% may not significantly affect renal flow aligns with other research indicating that many patients with hypertension after coarctation repair do not exhibit residual obstruction. Reference Lee and Allen28 Overall, our findings suggest that factors other than renal hypoperfusion may contribute to residual hypertension in patients with coarctation of the aorta. However, these interpretations remain speculative and require confirmation in future studies.
Conclusion
In patients with coarctation of the aorta, the present pilot study did not demonstrate a clear association between the degree of aortic narrowing and renal perfusion. These preliminary observations suggest that no measurable reduction in renal perfusion was detected in this cohort despite prolonged reductions in aortic flow. Consistent with this, percutaneous interventions, such as stent implantation, did not yield pronounced short-term changes in blood pressure among patients with arterial hypertension within the constraints of the current dataset. Given the limited sample size and the lack of robust statistical evidence, these findings should be interpreted as exploratory. The generalisability and robustness of our findings are thus subject to validation by future studies with larger sample sizes. Further research will be essential to better characterise the relationship among aortic coarctation, renal perfusion, and hypertension management.
Limitations
It is important to acknowledge the limitations of our study for the appropriate interpretation of the results. First, this was a single-centre, non-randomised study, which may limit the generalizability of the findings to broader patient populations. Second, the relatively small sample size constrained our ability to detect statistically significant differences in key outcomes, such as the impact of stent implantation on renal perfusion.
Although we were unable to include plasma renin activity measurements in our study protocol, we do not believe this omission undermines the clinical relevance of our findings. However, such data could have provided additional insights and supportive information regarding the pathophysiology of hypertension in this population.
Most patients underwent renal duplex ultrasonography, which did not reveal significant renal artery stenoses. However, as this examination was not performed uniformly across the entire cohort, the findings were excluded from the final analysis. This inconsistency is acknowledged as a limitation.
Another limitation is the broad age range of the study population (18 to 69 years), which may introduce variability in vascular and renal physiology. While a more homogeneous age group might have strengthened the internal validity of the findings, we intended to reflect an all-comer population representative of real-world clinical practice.
Supplementary material
The supplementary material for this article can be found at https://doi.org/10.1017/S1047951126113663.
Acknowledgements
None.
Financial support
This research received no specific grant from any funding agency, commercial or not-for-profit sectors.
Competing interests
None.


 Open access

