


Introduction
Ice sheets constitute a system that may be sensitive to certain external forcings. The same is true for the set of differential equations that describe the thermomechanically coupled dynamics of ice sheets. It is thus not surprising that different numerical ice-sheet models yield different results for the same experimental set-up. This is partly because the numerical models can differ in many aspects, such as discretization methods (finite-difference method, finite- volume method, etc.) or the derivation routes from the governing equations to the actual equations represented in the numerical models. However, even if these aspects are the same, different results can be yielded by different handling of numerical operations and numbers, due to the finite accuracy of computing machines.
Numerical ice-sheet model experiments sometimes exhibit strange features in the solutions that are unexpected under the imposed conditions. Reference Payne and BaldwinPayne and others (2000), using numerical ice-sheet models of regular quadratic grids, showed that the radial symmetry implied in the experimental design can break down with the formation of distinct spokes of cold ice under certain circumstances. Reference Saito, Abe-Ouchi and BlatterSaito and others (2006, Reference Saito, Abe-Ouchi and Blatter2007) demonstrated that the errors due to poor representation of radial symmetry with a regular quadratic grid lead to the simulated spokes and the breaking of symmetry These errors originate in the limited accuracy with which computers represent numbers, which is inevitable in principle.
However, even when mirror symmetry is implied in the experimental design, which is expected to be represented by numerical models with a quadratic grid, asymmetric solutions sometimes emerge in the simulation. The ISMIP- HEINO (Ice-Sheet Model Intercomparison Project-Heinrich Event INtercOmparison) experiments (Reference Greve, Takahama and CalovGreve and others, 2006; Reference CalovCalov and others, 2010) simulate an ice sheet with a mirror symmetry with respect to the center line of the ice-stream region. In the HEINO simulations, seven of the nine models exhibit oscillatory surges with periods of 5000 to 20 000 years for a broad range of climate and sliding parameters; however, there are differences in their amplitudes and recurrence times. Depending on the details of the model runs, almost all of the models that exhibited oscillations also showed some deviations from mirror symmetry imposed by the boundary conditions.
Three possible reasons for deviations in symmetry were listed, but not discussed in detail, by Reference CalovCalov and others (2010): real bugs in the coding; asymmetrical discretization numerical schemes; and the limited accuracy of computers, i.e. small asymmetries triggered by the limited accuracy of numerical operations by computers grow to macroscopic size, as discussed below. In addition, Reference HindmarshHindmarsh (2011) pointed out a fourth possibility, which may be termed the small amplitude instability of thermoviscous flow. Reference Soucek and MartinecSoucek and Martinec (2011) discussed a fifth possibility, that the extreme sensitivity of basal sliding activation to temperature variations causes random behavior in the results, which breaks symmetry in the long-term model behavior, due to rounding errors of the order of machine precision in such a chaotic dynamical system. None of these studies have discussed in detail how such breaking of symmetry influences the simulation.
A phenomenon called 'loss of trailing digits' often occurs in numerical computations with finite accuracy. Suppose the decimal precision is 2, for example. Then, the arithmetic sum of three summands 10, 0.5 and 0.5 depends on the order of operation: either (10 + 0.5) + 0.5 → 10 + 0.5 → 10; or 10 + (0.5 + 0.5) → 10 + 1 → 11. In the former case, the digit after the decimal point is lost. Although the number of significant digits is much greater than in this example for practical cases, it demonstrates that numerical operations by a computing machine with finite accuracy can, in principle, have slightly different representations of the answer, depending on the order of numerical operations performed by the computer, which are perfectly commutative and associative in an analytic formulation. This small difference may be negligible in many numerical solutions; however, it may accumulate to orders of magnitude - enough to be 'visible' in the simulation for highly sensitive systems, such as the ice-sheet/ice-stream system in the ISMIP-HEINO experiments - and is a possible reason for the breaking of symmetry. This problem is well known to numerical modelers in other fields, but Reference CalovCalov and others (2010) were the first to draw attention to it in the context of numerical ice-sheet models. Prior to that paper, Reference Greve, Takahama and CalovGreve and others (2006) described the asymmetric result only briefly. Reference Payne and BaldwinPayne and others (2000) also included some results showing the breaking of 'mirror' symmetry (e.g. their Fig. 11), which is not, however, explicitly mentioned in the paper because the focus was instead on the breaking of 'radial' symmetry.
Here I present a numerical method to prevent such unexpected symmetry-breaking in the solutions. To be precise, the method guarantees the identical representation of numbers by computers when the corresponding analytic formulation is identical, by careful handling of the order in which numerical additions are carried out, which is hereinafter referred to as 'arithmetic symmetry'. The loss of trailing digits is inevitable in numerical computing; however, this method guarantees that symmetry in the computed field (thickness and temperature) at one time-step is maintained at the next time-step during the time integration, if all the boundary conditions are also symmetric when the symmetry can be fully represented by numerical models with a quadratic grid, such as mirror symmetry in the ISMIP-HEINO configuration. In addition, the method is not an artificial method forcing an asymmetric result into a symmetric field by using, for example, additional terms or smoothing.
This paper re-examines the HEINO experiments with a numerical ice-sheet model using a 'symmetric scheme' and, for comparison and discussion, an 'intentionally asymmetric scheme' that is identical in all other aspects. In the next section, the ice-sheet model used in this study and the applied implementation of arithmetic symmetries are described. In the following sections, model results for symmetric and 'normal' asymmetric schemes show the extent to which asymmetries may influence the solution of the equations, and the conclusions concerning symmetric and asymmetric schemes are discussed. It is demonstrated that small differences triggered by a different order of arithmetic operations may accumulate sufficiently to invalidate the results for highly sensitive systems, such as the ice- sheet/ice-stream system in the ISMIP-HEINO experiments. To some extent, the findings of this study also question the possibilities proposed above for symmetry-breaking, as they suggest a method to avoid symmetry-breaking in the HEINO simulations, simply by using proper numerical computations.
Model Description
The numerical model, IcIES (Ice sheet model for Integrated Earth system Studies; Saito and Reference Abe-Ouchi, Segawa and SaitoAbe-Ouchi, 2004), used in this paper is a time-dependent, three-dimensional (3-D) thermomechanically coupled ice-sheet model in the shallow-ice approximation (SIA; see, e.g., Reference Ritz, Rommelaere and DumasRitz and others, 2001; Reference Abe-Ouchi, Segawa and SaitoAbe-Ouchi and others, 2007). It computes the evolution of ice thickness, bedrock elevation and ice temperature under a prescribed scenario of climate forcing in terms of the surface mass balance and the surface temperature.
Shallow-ice approximation models are based on the following two equations to solve the time-derivative of the thickness (H) and temperature (T) distributions:


where b and S are the ice base and surface elevations, respectively, MB is the net surface/basal mass-balance term, 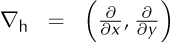 is the horizontal divergence operator,
 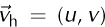 is the horizontal velocity vector,
  is the 3-D velocity vector, ki, pt and Cp are, respectively, the thermal conductivity, density and heat capacity of the ice, $ is the strain-heating term and L is the latent heat capacity of ice. Equation (1) is derived from the vertical integration of the continuity equation under the assumption of an incompressible fluid, while Eqn (2) is derived from energy conservation.
In IcIES, the governing equation (Eqn (1)) is finally written in matrix from for the ice thickness using matrix M and its elements, Mi,j

where Mo are the matrix elements to multiply variables at (i, j), and Mn, Ms, Me and Mw are the matrix elements to multiply corresponding variables at its neighboring gridpoints. Equation (3) holds for all gridpoints, except for those with constant thickness where only the Mo terms are nonzero,

Equations (3) and (4) form a linear system of equations.
All summation operations used in IcIES can be categorized into five patterns:


where  is a field variable depending on the spatial position, l is an arbitrarily spatial index and the coefficients, αk, depend on the index (i.e. α
k = α
k(l)), χ, Y and
is a field variable depending on the spatial position, l is an arbitrarily spatial index and the coefficients, αk, depend on the index (i.e. α
k = α
k(l)), χ, Y and  are scalar field variables, which are components of a vector field variable, and C is a position-independent constant. For example, the linear interpolation operation from gridpoint (i,j) to the gridpoint (i + 1/2, j + 1/2) corresponds to the pattern of Eqn (8), the finite-difference operation at staggered gridpoints corresponds to that of Eqn (7), the matrix operations of thickness, Eqn (3), correspond to that of Eqn (9), and the 3-D temperature advection term in Eqn (2) corresponds to Eqn (6). Computation of all the coefficients, αk, in Eqns (5-9) can also be categorized into one of the five patterns.
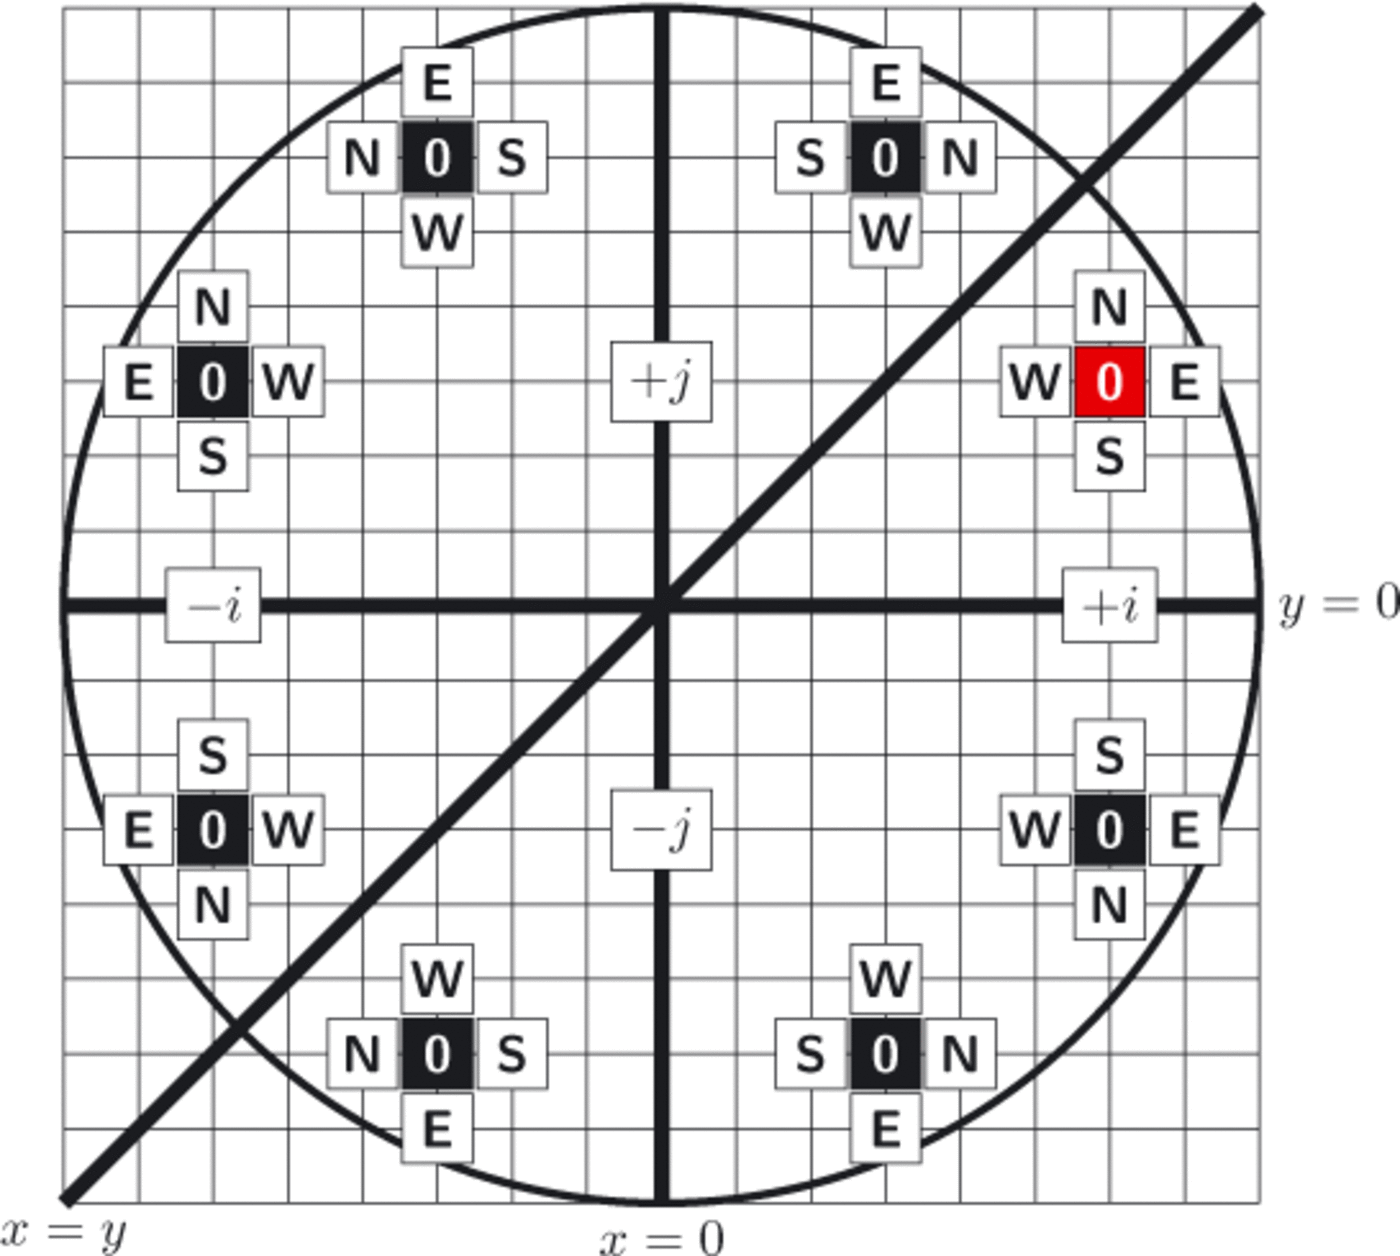
If the model domain satisfies three axial symmetries with respect to x = 0, y = 0 and x = y, then an equation at any gridpoint must be equivalent to the equations at seven equivalent symmetric gridpoints, except for the center grid (zero equivalent gridpoints) and for the grids on the axis and the diagonal lines (three equivalent gridpoints). Figure 1 is a schematic diagram of the three symmetries and an example of symmetric gridpoints. All gridpoints labeled 0 (in red or black boxes) must hold identical equations under the given symmetry. An equation at the reference gridpoint, (+i, +j) (the red box), of the pattern of Eqn (9) is accompanied by the variables at its four adjacent gridpoints, marked as N, E, W and S in the figure, whose respective coefficients in the operation correspond to α13, α11, α12, and α14 in Eqn (9).
Schematic diagram illustrating the symmetric gridpoints if the domain is symmetric with respect to x= 0, y= 0 and x= y. Fine square grids in the background correspond to example model grids. All eight cells with the same label (E, N, S, W or 0) must be identical under this configuration. Example gridpoints are (+i,+j) and its corresponding symmetric points.
Usually, the accumulation order of Eqn (9) in numerical additions is performed in a prescribed order, such as from left to right,

At one of the symmetric gridpoints, such as (—j, —i), Eqn (9) yields

which is analytically identical to Eqn (i0) at the reference gridpoint, (+i, +j). However, the identity is not guaranteed in a finite-precision numerical computation, due to the difference of the order of accumulation, even if all the coefficients, a, and the field variables, χ, are identical. It is possible to have eight different answers for each of the symmetric gridpoints due to the loss of trailing digits, because the accumulation order differs among them.
This problem can be avoided by special treatment of the arithmetic order. The method presented here is based on one assumption: if an operation is the sum of two terms, then these two terms are interchangeable, i.e. the relation a + b = b + a is always true in floating-point arithmetic. It is possible, however, to have different answers between the two operations if some optimization method is applied in the compiler. Whether such a situation occurs depends upon the computing environment (compiler and/or computers) used to perform the numerical experiment. If asymmetric results still occur after introducing symmetric schemes to all the equations in the numerical model, the optimization level needs to be tuned in compiling processes in order to work the scheme effectively. For example, the GNU Fortran compiler may require the option -ffloat-store at the compiling stage to prohibit storage of floating-point variables in registers, as this may maintain more precision than these are supposed to have, and as a consequence two numbers before and after the operator are represented with different precision.
To guarantee identical results at all eight symmetric gridpoints, the operation order must be explicitly redesigned as:

which is again analytically identical to the asymmetric operation, Eqn (10), but numerically different. This formulation ensures that errors caused by the loss of trailing digits are now identical at all eight symmetric gridpoints, even with finite- precision numerical computation, if all of the coefficients, a, and the field variables, X, are identical. In other words, arithmetic symmetry with respect to x, y and the diagonal direction is preserved in Eqn (12).
Equation (12) is the unique method to establish symmetry for the pattern in Eqn (9), which relates one gridpoint to only four neighbors. If one gridpoint relates to two or more gridpoints in one or more of the four directions, then there are several distinct possibilities to preserve the symmetry.
Corresponding methods can be applied for the other operation patterns (e.g. Eqns (6) and (8)). The following equations show an asymmetric and the corresponding symmetric operation order of the pattern in Eqn (6),


and Eqn (8),


where the first and second equations are examples of asymmetric and symmetric operations, respectively.
Using this algorithm, if all the field variables and coefficients and all boundary conditions are symmetric to the last digit at one time-step, and all the numerical operations are symmetric, symmetric solutions can be maintained throughout the simulation.
The categorization above (Eqns 5-9) is sufficient for a typical numerical ice-sheet model of SIA which adopts second-order central difference schemes (e.g. for thickness evolution) and the first-order forward difference (e.g. for temperature advection); however, this is not so for other types of models generally. Numerical models using higher- order finite-difference schemes, which include SIA models (e.g. Reference Saito, Abe-Ouchi and BlatterSaito and others, 2007) as well as ‘higher-order’ numerical ice-sheet models (e.g. Reference Colinge and RappazColinge and Rappaz, 1999; Reference PattynPattyn, 2003), require two or more gridpoints relating to one gridpoint, so more patterns are necessary. In addition, numerical models using other discretization techniques, such as the finite-element method, need a different categorization. However, the method to preserve arithmetic symmetries in the present paper can be extended to other such model types by careful design of the operation orders to guarantee an identical result over equivalent gridpoints or elements.
Experiments
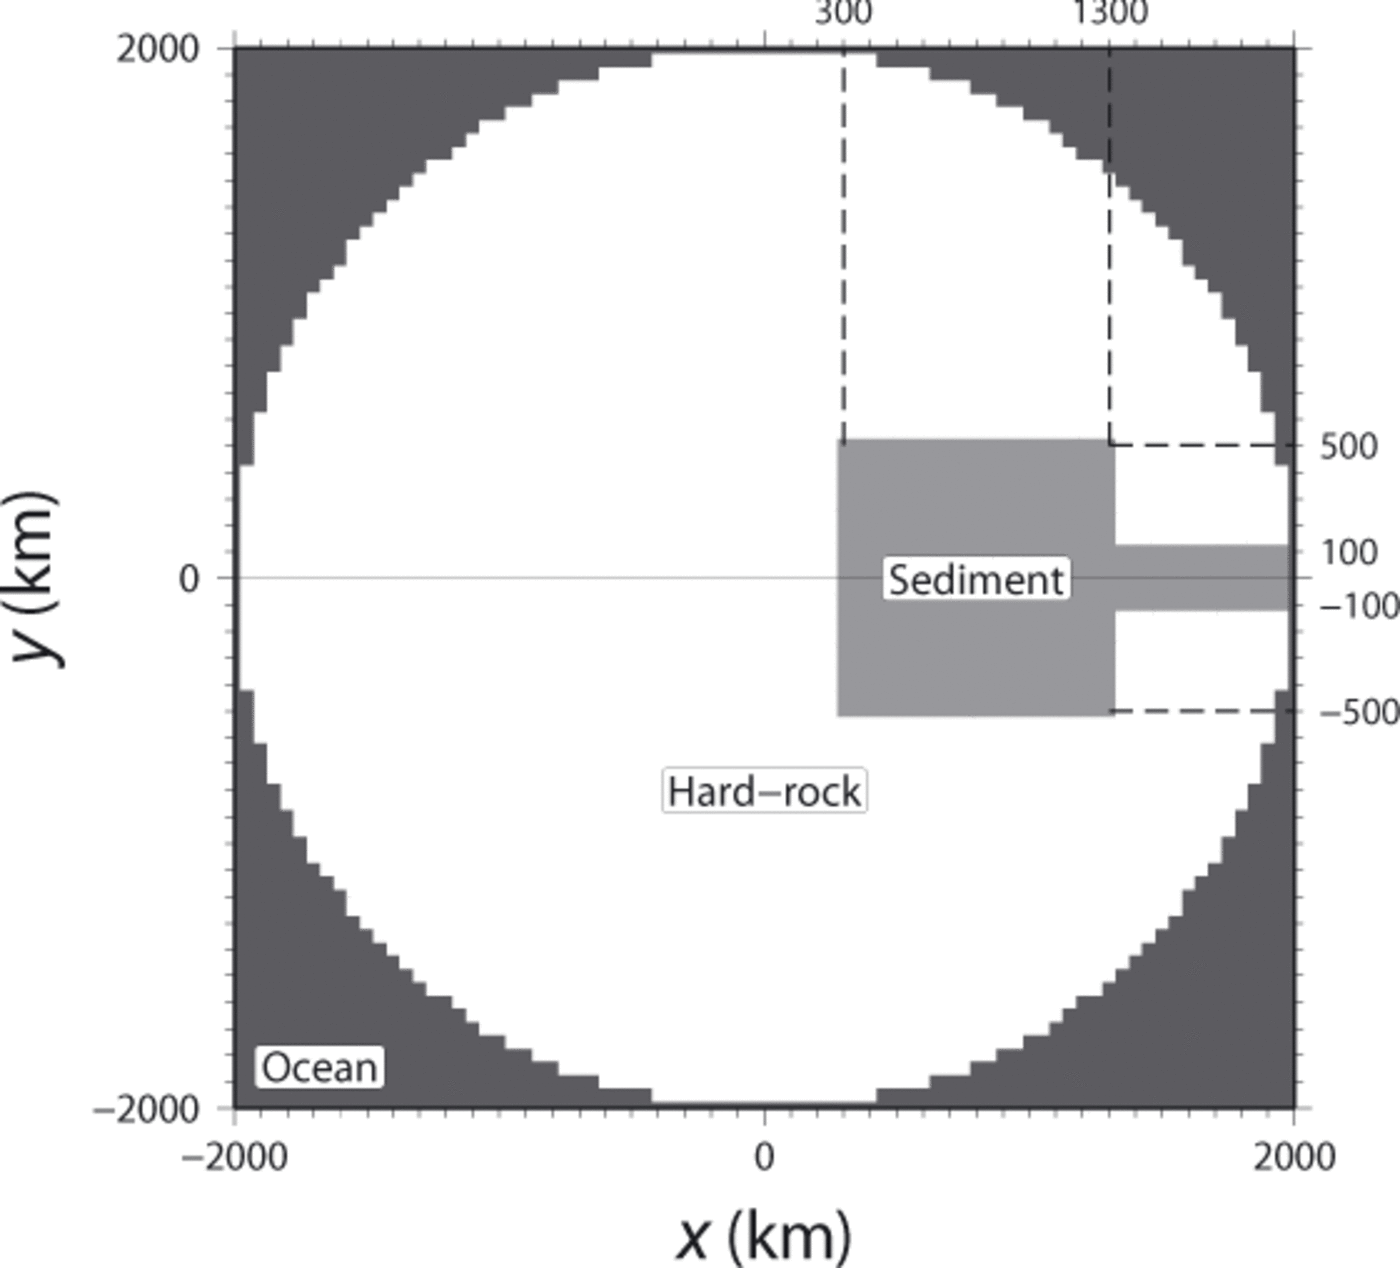
Most of the experiments presented in this study follow the original ISMIP-HEINO set-up (Reference CalovCalov and others, 2010). Figure 2 shows the model domain, which is a horizontal square with a 4000 km side length and has an ice sheet in a circular area of 2000km radius. A soft sediment area is surrounded by hard-rock areas. The bedrock topography is set to be flat and constant throughout the simulation.
Model domain of experiments in ISMIP HEINO. Two types of land area are distinguished: hard rock (white) and sediment (light gray). The domain is symmetric with respect to the x-axis (y = 0).
The surface mass balance, M B, and the surface temperature, T s, are functions of the distance to the center, d:


where M min = 0.15 m a-1, M max = 0.3ma-1, R = 2000 km is the radius, Mf is a factor used for sensitivity experiments, T min = 233.15 K and S T = 2.5 × 10⁻⁹Kkm-3 is the horizontal gradient. Basal sliding is assumed to occur only when the basal ice is at pressure-melting point, and different formulations of formulations of this sliding are adopted for sediment and hard-rock areas,

where T b is the temperature at the ice base, C R = 105 a-1 is the sliding parameter over hard rock and C S = 500a-1 is the sliding parameter over soft sediment in the standard configuration.
All experiments presented by Reference CalovCalov and others (2010) are re-examined; their domain and boundary conditions are symmetric with respect to the y = 0 line. An additional experiment (NH) is performed over a model domain with three symmetries with respect to x = 0, y = 0 and x = y, in which all gridpoints are assumed to be sediment, to demonstrate preservation of symmetry with respect to two more lines than the HEINO set-up. Three representative experiments, ST, T1 and NH, which are summarized in Table 1, are performed in the present paper.
Experiment configuration in ISMIP HEINO. The coefficients Mf, Tmin and Cg are the factors for accumulation, minimum surface temperature and sliding parameter over soft sediment, respectively (Eqns (17-19)). Experiment names follow the ISMIP-HEINO set-up (Reference CalovCalov and others, 2010)

The experiments are performed with four different numerical schemes, with suffix 0, 1, 2 or 3 added to the experiment name (e.g. ST-0). Scheme 0 contains arithmetic symmetry operations only, and scheme 1 applies an arithmetic asymmetry operation on the computation of the matrix coefficients of the thickness evolution. Scheme 2 applies an arithmetic asymmetry operation on the matrix- vector multiplication used in the matrix solver, i.e. it applies Eqn (10) on matrix-vector multiplications and similar operations on the transpose multiplication at every iteration step in the biconjugate gradient method to integrate thickness at the next time-step. During one time-step of thickness integration, only one asymmetric operation is performed in scheme 1, while several asymmetric operations, depending on the solution criteria, are performed in scheme2. Scheme 3 is the combination of schemes 1 and 2.
To evaluate the degree of asymmetry in the solutions, the score of field variable is introduced. A local score,  , for a given gridpoint, l, is defined as

And a global score for the entire domin as

L
dup(l) is a group of corresponding symmetric gridpoints with respect to gridpoint l (including l itself). For example, when l corresponds to the gridpoint of index (+i, +j) (the red box in Fig. 1), L
dup(l) is the group of all eight gridpoints labeled 0. L
uniq is a group of all the unique horizontal gridpoints taking into account the domain symmetries. In the case of Figure 1, for example, Luniq is the group of all gridpoints that satisfy both y ≥ 0 and x ≥ y. N(l) is the number of symmetric gridpoints (or the size of L
dup), which is 1 at the center gridpoint, 4 on the axis and the diagonal line and 8 elsewhere.  is a reference value of at gridpoint l,

The average is adopted for the reference value, so the score, r, can be regarded as an analogue to the maximum ‘standard deviation’ normalized by the maximum ‘average’ over the whole domain.
The floating-point representation of the computer system on which IclES is executed is the widely used IEEE754 format of 64 bits, where the values of mantissa, sign and exponent bits are 52, 1 and 11, respectively. In this format, the precision is given by 15 decimal digits, so a difference of ~10—15 of the mantissa can be detected by the score. If the absolute (numerical) symmetries are satisfied over the model domain, the score becomes 0. Table 2 shows example snapshots of simulated thicknesses at eight corresponding gridpoints obtained by an experiment with the symmetric scheme 0 and the asymmetric scheme 3. In this case, the field variable, F, is thickness, H, l in Eqn (20) corresponds to the index for (300,100), N(l) = 8 and F 0(l) corresponds to the average of the value at eight gridpoints. As shown in Table 2, all values of the symmetric model are identical to the final digits, so the local score of this gridpoint, Γ H (l), becomes truly zero. If the local scores are zero over the whole of the domain, then the global score is also zero. The asymmetric model, however, shows eight different results in the four last digits, deviating from each other by the order of 10—10, so Γ H (l) ~10—10. According to Eqn (21), the global score is the maximum of the local score normalized by the maximum of the reference (~103), so the global score in this case is ~10—13.
Snapshots of simulated thicknesses at 200 ka in experiments NH-0 and NH-3. Thicknesses at the gridpoint (+300,+100) as well as the seven corresponding symmetric gridpoints are shown. Thirteen digits are shown after the decimal points, and different digits are shown in bold
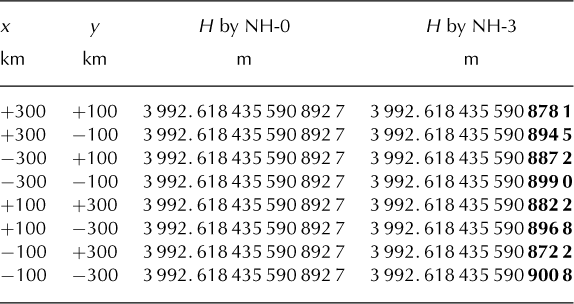
Figure 3 shows the time series of the global score obtained from the NH, T1 and ST experiments, together with the average thickness over the sediment area, H SD. The global score of experiment NH-0 is zero throughout the simulation and is thus not shown. The scores of the other three experiments are zero at the beginning of the simulation, but soon grow to ~10—14, where they stay for the rest of the run. The deviation is so small that differences in the time series of averaged thicknesses are barely visible.
Time series of the global score, ΓH, and average ice thicknesses over the sediment area, HSD, simulated for the NH (upper), T1 (middle) and ST (lower) experiments. The scores of NH-0, T1-0 and ST-0 are confirmed to be zero throughout the simulation (not shown). Simulated average thicknesses of experiments NH and T1 are not distinguishable.

Figure 3 also shows the time series obtained from experiment T1, which do not show significant symmetry-breaking. The scores of the three asymmetric schemes reach at most 10—10, but do not grow further. Therefore, the time series of the ice thicknesses are almost the same as in the symmetric model.
Results of experiment ST, however, show significant symmetry-breaking (Fig. 3). The scores of the three asymmetric schemes are almost the same throughout the simulation. The score is ~10—14 during the first 55 ka, then jumps to 10—7 and decreases again to 10—13 by 120 ka. It then jumps to 10—3 and finally stabilizes around 10—1. This results in a difference of up to 10% in the thickness solutions. After the score reaches 10—1, the difference in the average thickness from the four experiments becomes visible in Figure 3, and the oscillations show different phases and amplitudes.
Figure 4 focuses on the ST runs of Figure 3 during the last 100ka. Although the details are different across the time series simulated by the three variations of the numerical ice-sheet model with asymmetric schemes 1, 2 and 3, the amplitudes of the ice thickness over the sediment area show oscillations with significantly smaller amplitudes and different phases than those of the symmetric model (scheme 0).
Time series of the global score, ΓH, (top panel) and time series of average ice thicknesses over the sediment area, HSD, (lower four panels) of the ST experiment for the last 100 ka. Dark- and light-gray lines correspond to the time series of average ice thicknesses over the two symmetric halves of the sediment area (y ≥0 and y ≤0, respectively).
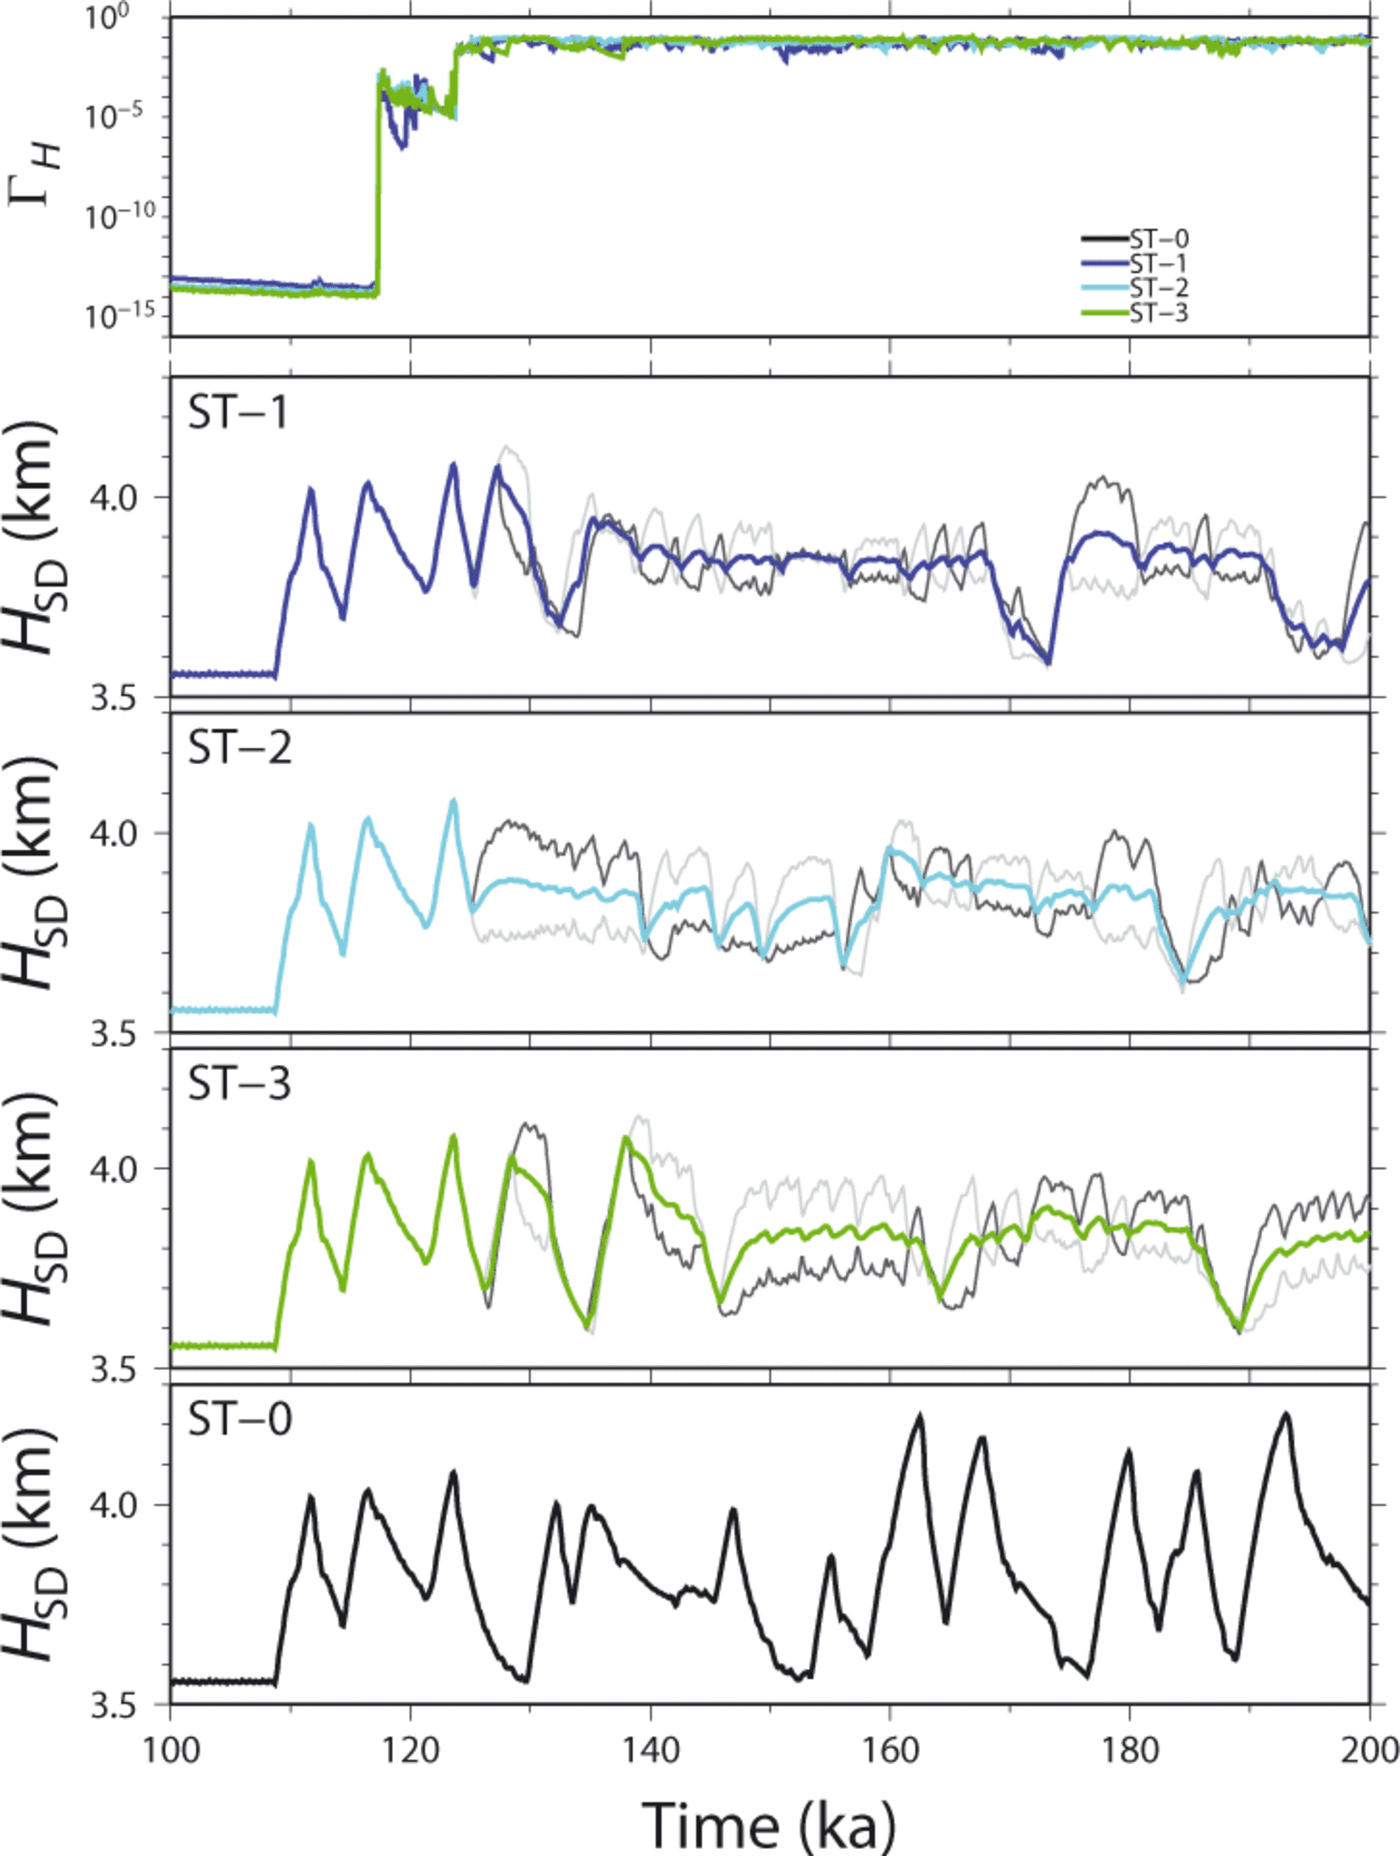
Figure 4 also shows the variations of thickness averaged over the y ≥ 0 and y ≥ 0 areas separately, plotted with light- and dark-gray lines, respectively. Some periods show relatively high-frequency oscillations (~1 ka cycles) but with opposite phases over the two areas, which cancel the amplitude of the total average. Other periods show oscillations over one side, with comparable periodicities to ST-0 (<3 ka), while no oscillation occurs over the other side, which leads to half the amplitude if the oscillations are averaged over the whole sediment region. Thus, while some oscillations still occur regionally, breaking of symmetries can significantly affect the total behavior of the ice sheet, with different patterns on either side.
Significant differences in the simulated oscillations between the two areas can be explained by the local feedback mechanism proposed by Reference Payne and DongelmansPayne and Dongelmans (1997) and Reference Payne and BaldwinPayne and Baldwin (2000) to develop spoke patterns. During a long-term simulation, the basal temperature may reach the pressure-melting point at one gridpoint but not at its symmetrical gridpoint at the same time. At the former gridpoint, basal sliding starts along with enhanced strain heating, which further enhances ice velocity, while the ice velocity at the latter is kept lower due to freezing of basal ice. Thus, the contrast between the two areas is further enhanced through thermodynamical feedback. In addition, interaction between the two areas may further help to enhance the contrast, in which the warmer and faster region influences the colder and slower region by increasing the advection of cold ice. These feedback mechanisms are thought to sometimes induce the opposite phases over the two areas and sometimes result in a large amplitude on one side while it remains small on the other side. This hypothesis requires further study and is left for future research.
Figure 5 shows snapshots of the basal temperature distribution simulated by ST-0 and ST-3 at the time when the score becomes largest in ST-3 (166.9 ka). An asymmetric pattern is visible in the ST-3 result. There is a narrow pressuremelting zone over the y ≥ 0 area, which is accompanied by fast stream-like flow, while no melting occurs over the y ≤ 0 area, which is accompanied by gradual recovery of the ice thickness (Fig. 4). These different patterns reduce the amplitude of the variations of the total thickness, as explained above.
Snapshots of basal temperature relative to pressure-melting point simulated by experiments ST-0 (left) and ST-3 (right) at the time when the global score, ΓH, is the maximum in experiment ST-3. Shaded areas indicate that the base is at the pressure-melting point. Contour interval is 2 K.

Discussion And Conclusions
A series of ISMIP-HEINO experiments with the IclES numerical ice-sheet model have been used to demonstrate the extent to which numerical computations with floatingpoint numbers of finite accuracy may accumulate small numerical errors into large errors in computed ice-sheet/ ice-stream evolution. One reason for this error enhancement is the order in which additions of more than three numbers are carried out. It is worth emphasizing that the numerical method to preserve mirror symmetry in the present paper does not resolve the loss-of-trailing-digit problem, and so numerical errors can still arise and propagate, but equally over symmetric regions, which is beyond the scope of the present paper. It can be concluded, however, that the small perturbation triggered by arithmetic asymmetry in numerical models may accumulate sufficiently to invalidate the simulation.
The asymmetries that have emerged in several numerical ice-sheet models in the ISMIP-HEINO experiments are not acceptable numerical inaccuracies. They also influence the numerically simulated pattern and periodicity of the ice- sheet/ice-stream oscillations to such an extent as to make the results questionable. It is thus certainly preferable to use symmetric numerical schemes that maintain the symmetries throughout the long-term evolution of ice-sheet model runs.
Besides the ISMIP-HEINO experiments, some experiments proposed by Reference Payne and BaldwinPayne and others (2000) were re-examined (A, F and H) using the same four variations of IcIES. None of these, however, show ‘visible’ differences in the simulated results, and the formation of ‘spokes’ as reported by Reference Payne and BaldwinPayne and others (2000) is not affected. It is not surprising that the symmetry scheme in the present paper does not preserve the radial symmetry imposed by the configuration of Reference Payne and BaldwinPayne and others (2000). The numerical scheme presented by Reference Saito, Abe-Ouchi and BlatterSaito and others (2007) may help to preserve the radial symmetry to some extent, and inclusion of higher-order stress components may also help (Reference Saito, Abe-Ouchi and BlatterSaito and others, 2006). This subject is beyond the scope of the present paper.
External program libraries may have advantages in computational efficiency and ease of implementation in model code. Some numerical ice-sheet models adopt such libraries, but the matrix-vector multiplication requires careful construction in terms of arithmetic symmetries, which means that both the matrix storage system and the numerical operations in the external library must be known. Such libraries may be difficult (or even impossible) to change or check in order to adjust the numerical symmetries.
There are several algorithms that cannot be recommended, or that require special care, in order to preserve numerical symmetry. The numerical scheme used in the present paper is a biconjugate gradient method with a Jacobi preconditioner (diagonal matrix). This preconditioner is so simple that no special care is needed in the operations related to the preconditioned matrix; it is thus easy to maintain symmetries. One may adopt SOR (successive overrelaxation) as a preconditioner, which may be more efficient than a Jacobi preconditioner. However, the Gauss-Seidel method in SOR is inherently asymmetric because the lower triangular components and the strictly upper triangular component (LU) of the matrix are separated into the left- and right-hand side of the equations. One way to avoid these asymmetries is to apply the Jacobi method in the iteration of SOR. For the same reason, even a direct matrix solver such as LU decomposition is not recommended in terms of numerical symmetries. These numerical algorithms can be found in standard textbooks of matrix computations (e.g. Reference Golub and Van LoanGolub and Van Loan, 1996).
The thermomechanically coupled ice-sheet dynamics constitute an ill-conditioned numerical problem (Reference HindmarshHindmarsh, 2006, Reference Hindmarsh2009, Reference Hindmarsh2011), and the inherent oscillations due to the evolving basal conditions in the ISMIP-HEINO experiments seem to further enhance this ill-conditioning. It is also possible that the ill-conditioning leads to lack of uniqueness in the solution, where some solutions are unstable and/or asymmetric, and all possible solutions appear and disappear throughout a long-term simulation. In addition, the highly symmetric HEINO model set-up increases the visibility of potentially asymmetric model results. It is therefore difficult to judge whether the numerical asymmetries presented here also influence results of numerical ice-sheet models computing ice-sheet dynamics with realistic, and thus highly asymmetric, topography and other boundary conditions. It is also possible that the modeled surging behavior is the result of the highly idealized experimental set-up and that numerical models (at least under SIA) cannot reproduce the mechanism responsible for the Heinrich events. Therefore, improvements in numerical ice-sheet models, such as including higher-order stress terms or increasing the horizontal resolution, may help to preserve the expected symmetry in the simulation. Despite this, it is still preferable to avoid as many numerical pitfalls as possible, in particular by using the arithmetic symmetry algorithms introduced in this paper.
Acknowledgements
I thank Ayako Abe-Ouchi, Heinz Blatter, Marco Picasso and Kengo Nakajima for valuable suggestions that helped to improve the manuscript substantially. I also thank the reviewers, Jesse Johnson and Felix Ng, for valuable comments. Reinhard Calov and Ralf Greve managed the ISMIP-HEINO exercises. This work was supported by KAKENHI 21740349.



