

Introduction
This study assesses the Lower Carboniferous Dinantian microbial platform carbonates in the Dutch subsurface. In most parts of the Netherlands the Dinantian rock formations are relatively under-explored and a petroleum system is not proven. Only limited well control exists and most of the wells are clustered around the margins of the Carboniferous basin (Kombrink, Reference Kombrink2008; Van Hulten & Poty, Reference Van Hulten and Poty2008). Additionally, seismic coverage is poor because most seismic data were acquired and processed with a focus on the younger, shallower formations that are known to host significant amounts of hydrocarbon accumulations (Van Hulten & Poty, Reference Van Hulten and Poty2008).
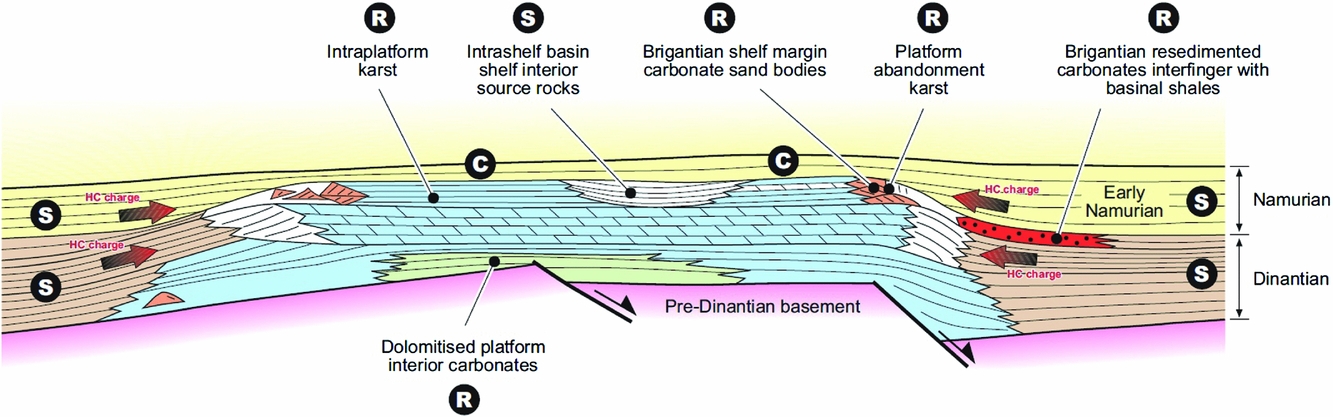
During the Dinantian (Fig. 1) the deposition of platform carbonates and deep marine shales and chert layers in areas of low clastic input predominated in NW Europe. Areas in the vicinity of clastic sources were characterised by shallow- and deep-water deltaic and turbidite deposits (Van Hulten & Poty, Reference Van Hulten and Poty2008). Many of the major Late Palaeozoic basins in other parts of the world are characterised by similar depositional sequences. The structural setting during the Early Carboniferous steered the Dinantian sediment deposition (Fig. 2) in which the highs were preferential sites of carbonate-platform growth. The lineaments of these highs followed the old Caledonian sutures. The flanks of the London–Brabant Massif also constituted such highs. It is thought that Namurian organic-rich basinal shales onlapping the Dinantian carbonate platforms and/or the platform-intercalated Dinantian shales could have provided hydrocarbon charge to the Dinantian limestones (Figs 3 and 4; TOTAL, 2007; Van Hulten & Poty, Reference Van Hulten and Poty2008).
Carboniferous System global series and stage subdivision with global subdivisions and substage subdivisions in Western Europe. Belgian substage names shown for Tournaisian, and British substage names for Visean. Dashed lines separating Middle and Upper Pennsylvanian Series (Moscovian and Kasimovian Stages) reflect range of correlation uncertainty of the boundary. Dashed lines in regional columns reflect uncertainty of correlation with global stages. Modified from Heckel & Clayton (Reference Heckel and Clayton2006).

European map of Dinantian palaeogeography. Study area marked by yellow box. From Van Hulten (Reference Van Hulten2012).

Schematic section showing the components of the inferred Dinantian petroleum system. R: reservoir rock; S: seal rock; C: organic carbon. From TOTAL (2007).
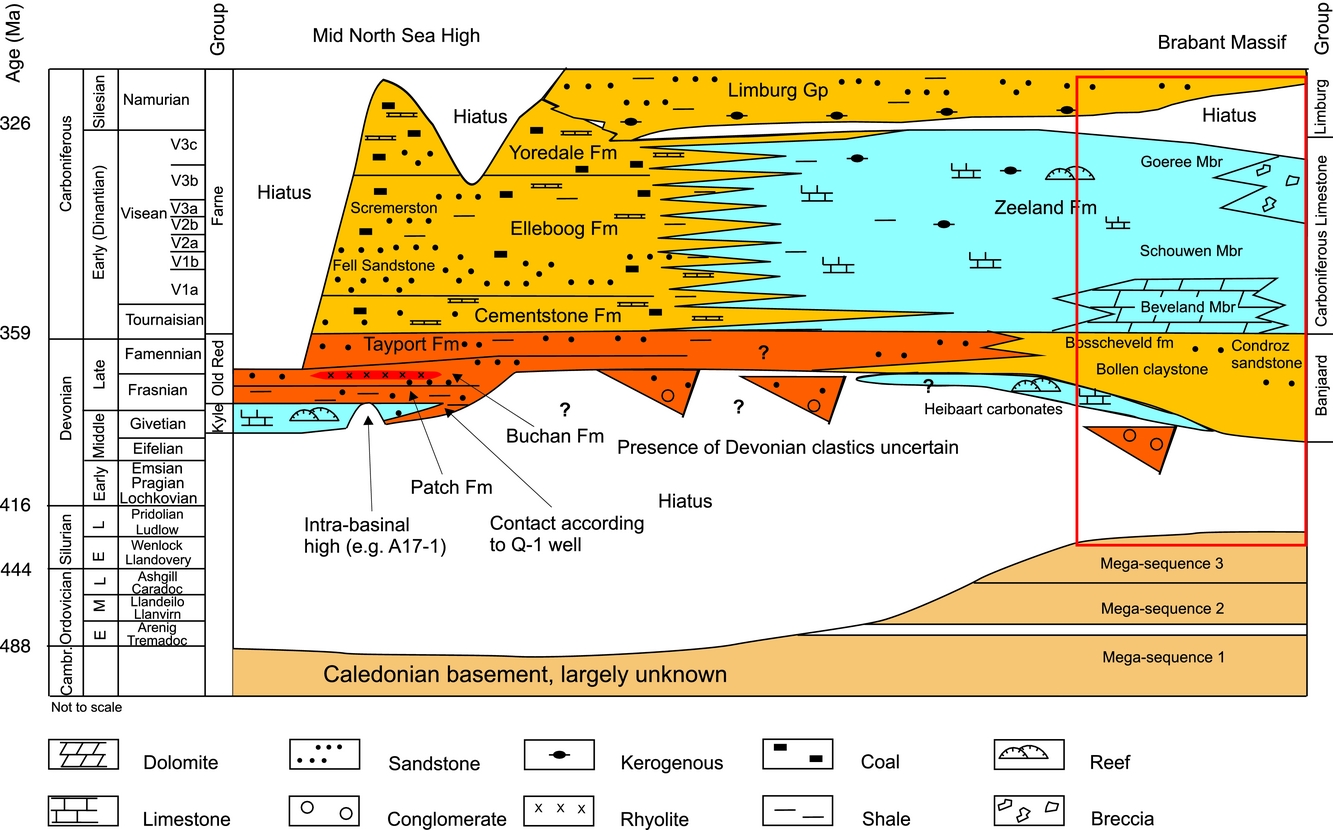
Schematic distribution of the Pre-Silesian rocks in the Dutch subsurface. Rectangle marks the stratigraphy encountered in the study area. From Geluk et al. (Reference Geluk, Dusar, de Vos, Wong, Batjes and de Jager2007).
A recent re-evaluation of the Dinantian petroleum system on the northern flank of the London–Brabant Massif showed a cluster of leads in the Dinantian carbonates straddling the UK–NL median line (Jaarsma et al., Reference Jaarsma, Brolsma, Hoetz and Lutgert2013). Small amounts of oil have been produced from the Dinantian limestones, onshore England (TOTAL, 2007), while oil shows were recorded in well 53/12-2 in the UK offshore (Cameron, Reference Cameron, Knox and Cordey1993). Despite the lack of proven economic hydrocarbon occurrences in the southern North Sea, the Dinantian carbonates are still considered potential hydrocarbon prospects (Cameron & Ziegler, Reference Cameron, Ziegler, Ziegler, Turner and Daines1997; Van Hulten & Poty, Reference Van Hulten and Poty2008; Jaarsma et al., Reference Jaarsma, Brolsma, Hoetz and Lutgert2013).
The drilling of geothermal well CAL-GT-01 near Venlo (Fig. 5) in the Dutch southern onshore in 2012 revealed the presence of Dinantian carbonates with better than expected reservoir properties (Jaarsma et al., Reference Jaarsma, Brolsma, Hoetz and Lutgert2013). Based on the analysis of drill cuttings, these increased reservoir properties can probably be attributed to hydrothermal karstification (Poty, Reference Poty2014) due to the flow of fluids with temperatures higher than the ambient matrix temperature, so-called hypogene karst processes following Klimchouk (Reference Klimchouk, Klimchouk, Palmer, Waele, Auler and Audra2017). In several wells and in seismic data along the London–Brabant Massif, evidence for major karst features (intra- and top platform) was also found (Jaarsma et al., Reference Jaarsma, Brolsma, Hoetz and Lutgert2013). In Belgium, Dinantian carbonates with good reservoir properties are known from the underground gas storage (UGS) facility near Loenhout and the Merksplas–Beerse geothermal doublet (Fig. 5). All sites utilise a karstified Dinantian reservoir with porosities up to 20% and two Darcy permeabilities (Vandenberghe et al., Reference Vandenberghe, Dusar, Laga and Bouckaert2000; Jaarsma et al., Reference Jaarsma, Brolsma, Hoetz and Lutgert2013). The occurrence of locally improved reservoir properties contrasts with the notion of the generally tight character of the Dinantian carbonates in the Dutch subsurface.
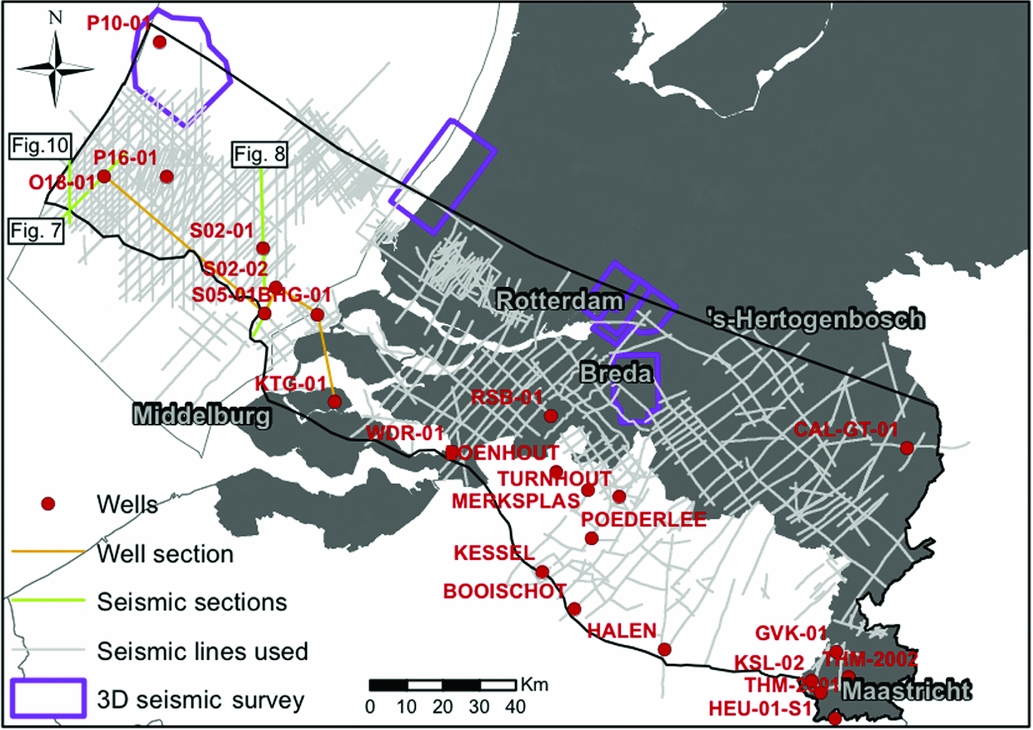
Map view of seismic and well data used and location of data shown in subsequent figures.
This study focuses on increasing the knowledge of the distribution of Dinantian reservoir properties related to palaeogeography, depositional setting, diagenesis (mineralisation, dolomitisation), karstification and fracturing. It aims to summarise the reservoir potential, for hydrocarbon and geothermal purposes, of the Dinantian succession in the area north of the London–Brabant Massif in relation to its palaeogeographical setting both during and after deposition. A model for the regional distribution and development of the Dinantian carbonates was obtained that integrates core observations, well correlation, seismic interpretation and a comparison with analogues to evaluate the facies variations and karstification of the Dinantian carbonates. This model should serve the exploration for hydrocarbons and research into the potential of ultra-deep geothermal in the Dinantian carbonates.
Early Carboniferous (Dinantian) sedimentological development of NW Europe
The Northwest European Carboniferous Basin (NWECB; Fig. 2) developed in the Devonian and Carboniferous in response to lithospheric stretching and Late Carboniferous flexural subsidence (Kombrink et al., Reference Kombrink, Leever, van Wees, van Bergen, David and Wong2008a,Reference Kombrink, van Os, van der Zwan and Wongb) between the southern margin of the Old Red Continent to the north and the Variscan orogeny to the south, which more or less agrees with the southern margin of the Rhenohercynian Zone (Ziegler, Reference Ziegler1990a,Reference Ziegler, Blundell and Gibbsb; Oncken et al., Reference Oncken, von Winterfeld and Dittmar1999; Burgess & Gayer, Reference Burgess and Gayer2000; Narkiewicz, Reference Narkiewicz2007). The basin consisted of a series of WNW-trending half-grabens in the southern North Sea, in which a thick pile of Devonian and Lower Carboniferous sediments was deposited sourced from the Mid German Crystalline High in the south and the Old Red Continent in the north (Fig. 4). According to Fraser & Gawthorpe (Reference Fraser, Gawthorpe, Hardman and Brooks1990), N–S extension led to the formation of the E–W-trending British Graben, whereas the NW-trending structures were reactivated. The origin of the extension is either related to back-arc extension in the Rheno-hercynian Basin situated to the southeast of the Netherlands (e.g. Ziegler, Reference Ziegler, Blundell and Gibbs1990b) or escape tectonics (Coward, Reference Coward and Parker1993).
The resulting horst-and-graben tectonic style steered the occurrence of isolated carbonate build-ups on intra-basinal highs. In the UK, these highs agree with the distribution of post-Caledonian granite batholiths (Fig. 2), while the extension was accommodated along Caledonian structural weakness zones. This extensional style extends into the UK and Dutch offshore area (Bless et al., Reference Bless, Bouckaert, Paproth, Kaasschieter and Reijers1983; Kombrink, Reference Kombrink2008; Van Hulten & Poty, Reference Van Hulten and Poty2008). The northern part of the NWECB received abundant siliciclastic input from the Caledonian mountains in the north and west.
Throughout the Dinantian period the London–Brabant Massif played a vital role as a relatively stable high at the southern border of the Carboniferous Basin (Fig. 2; Kombrink et al., Reference Kombrink, Besly, Collinson, Den Hartog Jager, Drozdzewski, Dusar, Hoth, Pagnier, Stemmerik, Waksmundzka and Wrede2010). Due to tectonic activity, the high underwent uplift, fracturing, emersion, and karstification at several moments during the Dinantian. This resulted in a configuration with carbonate build-ups developing on the footwall block, while hanging-wall blocks were filled by deeper water slope deposits (Fig. 3; Fraser & Gawthorpe, Reference Fraser, Gawthorpe, Hardman and Brooks1990; Bridges et al., Reference Bridges, Gutteridge, Pickard, Monty, Bosence, Bridges and Pratt1995; TOTAL, 2007). These downthrown blocks adjacent to carbonate-dominated highs were often intervening low areas, where more basinal fine-grained siliciclastic sediments, such as the Bowland Shale, were deposited. Van Hulten (Reference Van Hulten2012) proposed that a large area of the present North Sea area north of the Netherlands was a (black) shale basin during the Dinantian, based on magnetotelluric data. However, there are no well data to support this view.
The carbonate deposits of the Early Carboniferous are not dominated by framework-builders, since this type of carbonate-producing organism became extinct during the late Devonian ‘Kellwasser’ event (Buggisch, Reference Buggisch1991; Aretz & Chevalier, Reference Aretz, Chevalier, Álvaro, Aretz, Boulvain, Munnecke and Vachard2007). The main types of carbonate build-ups are microbial mud-mounds (Bridges et al., Reference Bridges, Gutteridge, Pickard, Monty, Bosence, Bridges and Pratt1995), the product of an M-factory type of carbonate deposition (Schlager, Reference Schlager2005). The depositional environment changed during the Dinantian in response to the main tectonic basin-forming phases and variations in sea level, which is reflected by the different types of carbonate mud-mounds that developed through time (Bridges et al., Reference Bridges, Gutteridge, Pickard, Monty, Bosence, Bridges and Pratt1995).
The first basin-forming period documented in the UK is the Tournaisian (Late Devonian to Late Courceyan stage; Fig. 1), during which fluvial-deltaic deposits were derived from the basin margins. Initial carbonate deposition started in the Tournaisian to Tournaisian–Visean (Chadian stage; Fig. 1) and was characterised by alternations of fluvial, marginal marine and nearshore siliciclastics with carbonates. The deeper basin was characterised by a carbonate ramp where Waulsortian mounds could develop (Bridges et al., Reference Bridges, Gutteridge, Pickard, Monty, Bosence, Bridges and Pratt1995; TOTAL, 2007). During the Early Visean (Late Chadian to Late Holkerian stages; Fig. 1) the carbonate depositional environment evolved from a carbonate ramp that developed on the exposed basement blocks to a progradational rimmed carbonate shelf (Aretz & Chevalier, Reference Aretz, Chevalier, Álvaro, Aretz, Boulvain, Munnecke and Vachard2007; Kombrink, Reference Kombrink2008). During the later Dinantian (Late Asbian to Early Brigantian stages; Fig. 1) the distinction between the carbonate shelf and basin areas became more pronounced. The rimmed carbonate platforms that developed on the shelf areas formed a clear topographic contrast with the basins (Muchez et al., Reference Muchez, Viaene, Bouckaert, Conil, Dusar, Poty, Soille and Vandenberghe1990). In these basins deep marine conditions prevailed with deposition of calciturbidites and siliciclastic mudstones (TOTAL, 2007). Near the edges of the carbonate platforms, which became steeper during the Visean, coarse breccias and boulder beds were deposited. In many locations the Brigantian deposits are missing and the related unconformity is widespread and associated with karst features (Gallagher & Somerville, Reference Gallagher and Somerville2003; TOTAL, 2007). Platforms on intra-basinal highs drowned, halting carbonate deposition before the end of the Visean (Waters et al., Reference Waters, Waters, Barclay and Davies2009; Van Hulten, Reference Van Hulten2012; Hoornveld, Reference Hoornveld2013).
The Dutch Dinantian carbonates are grouped in the Zeeland Formation, which is subdivided into the Beveland, Schouwen and Goeree Members (Van Adrichem Boogaert & Kouwe, Reference Van Adrichem Boogaert and Kouwe1993) (Fig. 4). Carbonate development remained restricted to emergent highs. The time-equivalent deposits to the Zeeland Formation in the Dutch northern offshore, the Farne Group, can be subdivided into the Cementstone, Elleboog and Yoredale Formations (Fig. 4). They comprise an assemblage of alternating claystones and sandstones with minor development of coal layers and variable amounts of intercalated carbonate beds deposited within paralic to shallow marine environments (Geluk et al., Reference Geluk, Dusar, de Vos, Wong, Batjes and de Jager2007). The transition between the carbonate and siliciclastic facies types cannot be positioned accurately due to a lack of data. This zone probably migrated southward with time. A full description of all stratigraphic units of the Early Carboniferous period can be found in the ‘Stratigraphic Nomenclature of the Netherlands’ (Van Adrichem Boogaert & Kouwe, Reference Van Adrichem Boogaert and Kouwe1993) and ’Chapter 5: Carboniferous and Devonian of the Southern North Sea’ from the ‘Lithostratigraphic Nomenclator of the UK North Sea’ (Cameron, Reference Cameron, Knox and Cordey1993).
For the Netherlands, a two-stage model was proposed for the development of the Dinantian carbonates on the northern flank of the London–Brabant Massif based on a series of wells drilled in the 1980s, which include Brouwershavensegat (BHG-01), offshore well S05-01 and Kortgene (KTG-01) (NAM, 1982). This depositional model only describes the development of the Lower Carboniferous carbonates on the northern margin of the London–Brabant Massif that constituted the southern boundary of the Northwest European Carboniferous Basin. This area was mostly influenced by subsidence caused by loading of the Variscan foreland (Kombrink, Reference Kombrink2008).
The first stage spans the Tournaisian to Early Visean and is characterised by a cyclic development in which massive dolomite and nodular anhydrite were deposited in a lagoonal setting with a large supratidal flat area. The model proposed a grainstone barrier or island complex to separate the vast low-relief peritidal setting from the slope area that was characterised by carbonate mud-mounds and Waulsortian reef development below wave base. Further basinwards an extensive shale basin is proposed (NAM, 1982).
The second (transgressive) stage spans the Middle and Late Visean periods and is characterised by a landward shift of facies patterns. The extent of the exposed supratidal flat is reduced while the exposed London–Brabant Massif is progressively onlapped. A proper carbonate platform developed with a grainstone barrier at the platform margin that aggraded up to sea level, protecting a broad intertidal lagoon. This protective barrier also slightly retrograded, allowing carbonate mud-mounds situated on the slopes below wave base to develop over areas previously occupied by shallower facies. The slope angles steepened, and at the deeper parts of the slope and within the basin characteristic ‘Culm/Kulm’ shales (Kombrink, Reference Kombrink2008; Aretz, Reference Aretz, Denayer and Aretz2016) were deposited.
For the northern part of the Netherlands, Kombrink (Reference Kombrink2008) presented the first seismic images through three Dinantian flat-topped carbonate build-ups with well-developed slopes. The mapped platform in offshore block M09 is still undrilled. The onshore wells Luttelgeest (LTG-01) and Uithuizermeeden (UHM-2) penetrated the Dinantian carbonates and showed a stratigraphy comparable to that known from Belgium (Abbink et al., Reference Abbink, Devuyst, Grötsch, Hance, Van Hoof, Kombrink and Van Ojik2009; Van Hulten & Poty, Reference Van Hulten and Poty2009). The well-to-well correlation of Van Hulten (Reference Van Hulten2012) showed, however, that the upper part of the Visean stratigraphy was missing in LTG-01, while neither well encountered the Tournaisian section commonly present in wells to the south (the study area). Depositional cycles recognised in the thick carbonate successions could be regionally correlated to those known from Belgium (Van Hulten, Reference Van Hulten2012). Sparked by these findings, Hoornveld (Reference Hoornveld2013) re-evaluated the Dinantian carbonates in the northern part of the Netherlands and identified four individual Visean carbonate build-ups: the Uithuizermeeden, Fryslân, Luttelgeest and Muntendam platforms.
Well data analysis
Well logs covering the entire Dinantian interval are scarce. Five wells with sufficient well log data were correlated using gamma-ray, sonic, lithologic and biostratigraphic logs (see Fig. 6). These wells, O18-01, S05-01, S02-02, BHG-01 and KTG-01 (Figs 5 and 7), were drilled for hydrocarbon exploration in the late 1970s to early ’90s. The cored intervals were examined and compared to previous core descriptions, thin section descriptions, carbonate depositional models and literature publicly available on the Dutch Oil and Gas Portal (nlog.nl) or in the NAM core repository. The description of the carbonate cores was made using the carbonate classification scheme of Dunham (Reference Dunham and Ham1962), while the porosity of the carbonate sediments was described using the porosity classification system of Choquette & Pray (Reference Choquette and Pray1970). The geothermal well CAL-GT-01, drilled in 2012, was included in this comparison, using the analysis of well cuttings (Poty, Reference Poty2014). Composite logs of wells from the Belgian Campine Basin that reached the Dinantian limestones or the Lower Namurian strata were also studied (Fig. 5). These were not incorporated in the well correlation panel, mainly because of the lack of well data.
Well correlation panel through wells O18-01, S2-02, S05-01, BHG-01 and KTG-01 (see Fig. 5 for locations), flattened on top Dinantian. Gamma-ray, sonic, lithology and biostratigraphy logs are shown.

Selection of core photographs depicting characteristic lithofacies encountered. All photographs include a scale in cm. (A) Lithofacies D1; brecciated carbonate filled with vein cement, found in well O18-01 (2635.3 m). (B) Lithofacies D2; silicified coarse bioclastic grainstone containing abundant (cm-sized) crinoidal and thick shell debris, found in core S05-01 (1565.0 m). (C) Lithofacies D2; top of core S05-01 (1190.0 m), clean grainstone, containing abundant bioclastic debris. (D) Lithofacies D3; coarse carbonate breccia in core BHG-01 (2181.5 m); note stylolitic surface at contact between boulders. (E) Lithofacies D3; intensely mineralised carbonate breccia in core BHG-01 (2177.0 m), containing abundant pyrite and some siliciclastic shale clasts. (F) Lithofacies D1; mineral aggregates filling cavernous porosity relict of brecciation in well KTG-01 (984.5 m).

Core description
O18-01
Description
Three cores were taken in O18-01. The succession in cores #6 to #4 shows dolomitised mud-to wackstones (Fig. 7A) with some mouldic porosity at the base, to microbial mudstones with reworked and lithified bioclasts at the top (Swennen & Muchez, Reference Swennen and Muchez1991). The carbonates contain some diagenetic chert; stylolites occur throughout but are especially abundant at the top (1604–1600 m) where oil-stained cavities are also present (Table S1, in supplementary material available online at https://doi.org/10.1017/njg2017.33). All depths are in measured depth (MD).
Interpretation
The sediments present in the core were deposited in an open marine environment, probably during the Early Visean (Table S1; Swennen & Muchez, Reference Swennen and Muchez1991). The carbonates originally consisted of rhythmic alternations of mud- to wackestones and grain- to packstones, probably deposited below and near wave base on a low-relief shelf area during the Tournaisian and Early Visean (Courceyan to Chadian), and were subsequently partly dissolved and dolomitised. A similar succession was found in the lower section of the S02-02 well (Fig. 7A). Swennen & Muchez (Reference Swennen and Muchez1991) propose an Early Visean or Late Visean period of emergence, which agrees with regionally recognised sea-level lowstands (Waters & Davies, Reference Waters, Davies, Brenchley and Rawson2006) and corresponds to the timing of development of massive dolomites in the Early Dinantian in the Campine Basin (Muchez & Viaene, Reference Muchez, Viaene, Purser, Tucker and Zenger1994).
The middle part of the succession contains bioturbated bioclastic wacke- to packstones and clay-rich layers characteristic of slow sedimentation prevailing in an open marine environment below wave base during the Chadian to Holkerian stages of the Middle Visean (Swennen & Muchez, Reference Swennen and Muchez1991).
The top part of the succession shows ‘reefal’ limestone deposited before the Visean to Namurian emergence. The litho- to bioclastic character and high angle of deposition suggests that these sediments were deposited on the flank/slope of a carbonate build-up (Swennen & Muchez, Reference Swennen and Muchez1991) during the late Asbian. The presence of hydrocarbon traces indicates that charging occurred during or after the development of the fracture porosity. A similar, somewhat higher-energetic, facies developed in the top of well S02-02. Similar, time-equivalent build-ups are known from Derbyshire platform and Campine Basin on the flank of the London–Brabant Massif (Swennen & Muchez, Reference Swennen and Muchez1991). The clay-rich intervals present show some silicification related to compaction (Swennen & Muchez, Reference Swennen and Muchez1991). The sedimentary facies encountered in this core corresponds to that of an M-type carbonate factory, wherein bacterially induced precipitation of carbonate and seawater diagenesis are the dominant build-up forming processes (Schlager, Reference Schlager2005; Della Porta et al., Reference Della Porta, Kenter and Harris2008, Reference Della Porta, Merino-Tomé, Kenter, Verwer, Verwer, Playton and Harris2013).
S02-02
Description
Five cores were taken in S02-02; the descriptions partly rely on Dronkers et al. (Reference Dronkers, Graves and Standing1984) and Cambridge Carbonates (2002). The base of the sequence (core #5) consists of dark-grey to black mudstones, alternating with pack- and wackestones rich in oncoids (1–5 mm) and some centimetre-sized bioclasts. Horizontal stylolites are present. Around 2629 m an exposure surface was found on top of an ooid-rich grainstone bed. The top of the core shows abundant, up to centimetre-sized, shell fragments, and coated grains, high-angle calcite veins, horizontal stylolites and microstylolites are common. Core #4 is very similar and contains dominantly black wackestones, with occasional lithoclasts; the whole core is heavily brecciated. Core #3 is not described due to the small amount of material preserved.
The succeeding sequence (core #2) shows grey pack- to grainstones with abundant bioclasts, e.g. millimetre-sized crinoids and shells, fine-grained limestone intraclasts, and ferroan minerals. Millimetre-sized isolated mouldic to fenestral porosity has developed, but pore connectivity is poor. The core continues with (at 1891.3 m) decimetre-sized clasts, bounded by algal mudstone and peloidal floatstone. Algal boundstone with centimetre- to decimetre-sized clasts filled by fine-grained carbonate mud tops this part of the core. The contacts between the individual carbonate clasts show distinct compaction features. The very top of the cored interval (core #1) contains resedimented carbonate rocks, very similar to the sediments found in core #2.
Interpretation
The carbonate sediments in this well show a deepening upwards trend (Table S1). The base of the sequence contains nearshore deposits such as restricted marine dolomites. These are overlain by semi-restricted lagoonal wackestones and packstones with coated grains and bored shells, deposited in shallow subtidal to intertidal environments (Cambridge Carbonates, 2002) where sediment accumulation was probably slow. Temporary exposure led to development of pedogenic structures. These deposits are considered to be of Tournaisian to Early Visean (Chadian) age by their lithological resemblance to the lower part of KTG-01 and BHG-01 wells (Cambridge Carbonates, 2002). The grainstones, overlying these lagoonal sediments, indicate higher-energy deposits that represent an open marine platform margin setting. Seaward of this platform margin open marine shelf packstones were deposited. On the deeper parts of the shelf slope, microbial mud-mounds developed that alternate with redeposited carbonate debris derived from the platform margin or slope build-up facies. This sequence is very similar to sedimentation patterns known from the Lower Carboniferous carbonates from the Caspian region as described by Kenter et al. (Reference Kenter, Harris and Della Porta2005). The lithified carbonate components are of Late Visean age (Brigantian), a little younger than the reefal build-up structures encountered at the top of well O18-01 (Cambridge Carbonates, 2002).
S05-01
Description
Seven cores were taken in the carbonate interval in the S05-01 well. Core #7 contains dark-grey to black bioclastic, bioturbated limestones with thick bivalves, which are locally slightly dolomitised. Horizontal stylolites and mouldic porosity are present at 1906 m. Core #6 contains large bioclastic beds with a fining-up trend from centimetre-sized peloids to ‘micritic’ carbonate mud (at 1781 m). Horizontal stylolites and filled vertical fractures occur sporadically. Black shales with tiny (mm-size) shells are present at some levels (1800 and 1788 m) and correspond to small gamma-ray peaks. The interval is strongly bioturbated. The subsequent core #5 shows dark grey crinoidal, bioturbated wacke- and packstones with thick bivalves (1–2 cm) and rare coral and bryozoan fragments. In core #4, light-to dark-brown oncoid–peloid grainstones with thick-walled shell fragments (up to 5 cm) occur that at times are replaced by cryptocrystalline silica (chert) (Fig. 7C). The grainstones occasionally contain crinoids (2–3 cm) and lithoclasts. Higher up in core #3 and #2, the grainstones are beige-coloured with ‘clean’ cement and contain large shells, fine crinoidal debris and peloids. The layers show regular stylolitic surfaces. The topmost 50 m of core #1 contains cream-coloured to brown bioclastic wackestones and grainstones with abundant crinoids, calcite-filled fractures and fine shell debris (Fig. 7D). At several levels (1332, 1224 m) abundant high-angle fractures are present.
Interpretation
The cored sections in well S05-01 represent a shallowing-upward sequence from a deep-water, fine-grained siliciclastic basin with slope processes to a shallow-water, high-energy carbonate environment (Table S1). The siliciclastic–carbonate transition was not cored, but shows a spiky gamma-ray signal (Fig. 6), possibly indicative of an interfingering of shale and carbonate facies. The cyclic alternation of bioclastic grainstones grading into mudstones is similar to those observed in well KTG-01, and interpreted as sea-level variations inducing shifts between shallow marine subtidal, to lagoonal and tidal mudflat deposit environments. These are overlain by open marine wackestones, which towards the top alternate with lighter-coloured grainstones, interpreted as lagoonal and high-energetic barrier facies, respectively. Significant compaction took place as is represented by abundant bedding-parallel horizontal stylolites. The increasing abundance of clean grainstones (Fig. 7D) at the very top of the cored sections indicates the presence of a carbonate shoal. In the light of observations in other wells, the absence of significant karst surfaces and pedogenic structures in this interval is remarkable.
BHG-01
Description
Two cores were taken in the carbonates in this well that were described by the Rijks Geologische Dienst (RGD, 1978). The sediment in core #2 consists of dark grey limestone; highly compacted grains and microstylolites are common. Most bioclastic grains are diagenetically altered and recrystallised. The pack- and grainstones at the base of the core (2387 m) are heavily fractured; brecciated parts of limestone are floating in a calcite vein filling. Fracture cavities are not completely cemented, some relict porosity remains, while mineralisations of galena (PbS) are also present within the veins. Core #1 also contains heavily brecciated carbonates with fractures and both horizontal and high-angle (~40°) stylolites (Fig. 7E). The carbonates contain crinoids and bryozoans as well as large intraclasts and lithoclastic material (Fig. 7F). Cavernous porosity is infilled by barite, pyrite, galena and dolomite–quartz precipitates. Local concentrations of bitumen were observed in the cavities and fractures (RGD, 1978). Towards the top of the core the amount of fine-grained siliciclastics increases.
Interpretation
The lower core is heavily fractured and veined, and shows multiple signs of dissolution and recrystallisation. Although the sediment resembles a fine grainstone, the dissolution hampers interpretation of the original sedimentary structures. Despite its dark colour, NAM (1982) originally interpreted this section as a high-energy grainstone barrier (Table S1). An Early Visean (Chadian) age is obtained from the foraminiferal assemblage. Dolomites with a plausible Tournaisian age are present below this core interval, but were not cored (RGD, 1978). The cored interval strongly resembles the lower part of well O18-01 containing dark wacke- and packstones, heavily influenced by compaction and solution processes, therefore a similar origin is proposed: deposition took place on a shallow, low-relief carbonate ramp below or near wave base.
The upper core is heavily fractured, brecciated and contains numerous veins and mineralisations at various levels. Stylolites have developed both horizontally and at a moderate angle (~40°). The latter type is possibly developed along sites of contrasting lithologies, and could represent sedimentary bedding (Fig. 7E). NAM (1982) interpreted these deposits as reefal mud build-ups and lower slope sediments. The sediments resemble the boulder-beds and bioclastic alternations found in the upper cores of well S02-02; a similar Late Visean (Asbian) age was assigned to this facies (RGD, 1978). This was a period of high-amplitude cyclic glacioeustatic sea-level variations, which favoured reworking of carbonates. Similar, time-equivalent stylolitised ‘welded’ microbial carbonate breccias are observed in the fractured slope sediments of the Caspian region (Kenter et al., Reference Kenter, Harris and Della Porta2005; Harris et al., Reference Harris, Garber and Clark2008).
The RGD (1978) interpreted the mineralised carbonate breccias (Fig. 7F) as post-diagenetic karst features, formed during a Late Visean to Early Namurian erosional period, stating they resembled the Windy Knoll carbonates of Derbyshire (UK), where Carboniferous limestones containing economic calcite, galena, fluorite and barite mineralisations are exposed (Ford & King, Reference Ford and King1965). The presence of bitumen in the strongly mineralised carbonates of well BHG-01 indicate that porosity creation and charging of hydrocarbons occurred in the right order and provides another similarity to the carbonates of Windy Knoll, in which fluid inclusion analyses indicated that the hydrocarbons were co-genetic with a hydrothermal mineralising brine (Moser et al., Reference Moser, Rankin and Milledge1992). We interpret the mineralised carbonates of well BHG-01 as post-diagenetic hypogene karstification phase sensu Klimchouk (Reference Klimchouk, Klimchouk, Palmer, Waele, Auler and Audra2017), which concentrated in the lithified, redeposited microbial slope sediments of Late Visean age.
KTG-01
Description
A single core of c. 50 m was taken in the KTG-01 well. The Rijks Geologische Dienst report (RGD, 1983) was used as reference. Core #4 (1900.0–1891.5 m) contains dark-grey to black layers of laminated clay and siltstone. Generally, the siltstone layers are lighter-coloured and have slight erosional bases. Deformed flaser beds are recognised in some intervals. Calcite veins intersect the whole core. Core #3 (1735.0–1720.3 m) comprises dark-grey siltstone with abundant calcite veins and small cavities that are partially filled with minerals (geodes). Overall the sedimentary bedding is poorly developed and the sediment is clearly disturbed at some levels. Core #2 (1365.1–1351.0 m) shows a well-laminated succession of grey to dark-grey siltstones with occasional disturbed bedding. The sediments show reworking of partly lithified sediments and small slump structures. The uppermost core #1 (995.6–946.90 m) spans c. 50 m and mainly consists of dolomite. The grade of dolomitisation varies throughout the sequence, and the full spectrum from pure limestone to 100% dolomite is present. However, in the largest part of cores dolomitisation developed slightly to moderately well. At the base of this interval, bioclastic packstones with shell debris alternate with silty beds. Some strongly compacted laminated algal limestones with infilled fenestral pores are also present. In certain levels, fractures and cm-wide vein cements are common (Fig. 7B). In addition, exposure surfaces (at 993.3 and 974.0 m) are preserved; cauliflower structures (990.6 m), stylolites and centimetre-sized vugs (at 987.5 m) are also present. A strongly karstified zone (985–975 m) is present, characterised by cavernous porosity infilled with pink carbonate precipitates, glauconite sands and rubble of Cretaceous age (NAM, 1982). The top sequence shows grainstones with large shells overlain by dolomites, ‘chickenwire’ anhydrites and a calcrete soil at 951.7 m. The very top of the core (94.0 m) consists of shallow marine carbonates with algal lamination and shell-rich levels. Silicified levels are present throughout.
Interpretation
The carbonate sequence in the KTG-01 well is thin compared to the other wells. The carbonates have been assigned an Early Visean age based on foraminifera occurrences (RGD, 1983). Tournaisian carbonates seem to be missing, although a Tournaisian age has been assigned to the nearshore siliciclastics that underlie the carbonates (RGD, 1983). The entire sequence consists of a cyclic development of restricted shallow marine to supratidal deposits (Table S1). Many internal erosional boundaries, pedogenic and karstified levels are present, suggesting that long periods of exposure were frequent. This also suggests that the preserved sequence is highly condensed. Occasionally, siliciclastic input alternated with the limestone and dolomite sediments. Overall, the sequence represents a tidal mudflat to restricted lagoon environment where bioclastic grainstones and algal laminated packstones accumulated. Based on the diminishing number of exposure surfaces, a slight deepening of the mudflat is inferred towards the top of the cored sequence, although periodic exposure still occurred. Cretaceous deposits not only unconformably overlie the Dinantian carbonates, as can be discerned in seismic data, but also penetrate the sequence as infill of cavernous karst structures. Therefore an underground karst system must have been active before and/or during the Cretaceous deposition; some of the karst structures might have been present since a Late Dinantian – Early Namurian episode of regression (Schroot et al., Reference Schroot, Van Bergen, Abbink, David, Van Eijs and Veld2006) because vein cements partly fill the cavities (NAM, 1982). Meteoric or mixing zone karst is most likely, since after reflooding of the system marine Cretaceous sediments infilled the cavernous porosity system.
CAL-GT-01
Description and interpretation of cuttings samples
This well encountered ~750 m of Dinantian carbonates, underlain by Devonian quartzite and dolomite. The well encountered a large karst feature between 1737 and 1758 m depth, resulting in total losses of drilling fluids. No core was taken in this well. Sample description and microscopic analysis were reported in two unpublished documents, PanTerra (2012) and Poty (Reference Poty2014).
The presence of fossiliferous grainstone and packstone cuttings in the sample above the karst zone indicates deposition in shallow water, possibly still in situ or reworked after deposition. Chert is present and probably derived from silicified carbonate, possibly related to bioturbated layers. The carbonates are mostly tight, except for some intercrystalline porosity in partly dolomitised carbonate and dissolution porosity in chert, which is attributed to the chertification, not the karstification. SEM analysis indicates the presence of some microporosity (PanTerra, 2012).
Severe diagenesis below the karst zone hampered microfacies interpretation, and very little biostratigraphic dating could be performed. The upper section of the Dinantian carbonates (between 1605 and 1980 m) could be attributed to the Middle and Late Visean, and the lower section (between 1980 and 2350 m) to the Early Visean and the Tournaisian. The recognised microfacies is mainly grainstone and wackestone, suggesting a platform or ramp setting for the entire section, but not a reef. This suggests that the (present-day) high could be due to block faulting (Poty, Reference Poty2014).
The entire section below the karst shows high diagenesis, with the Visean section silicified and the supposedly Tournaisian-age section dolomitised and de-dolomitised. The quartz veins, sparry calcite and (de-)dolomite suggest that diagenesis is related to hydrothermal waters rich in silica and in calcium sulphate (the latter causing de-dolomitisation) (Poty, Reference Poty2014). Geochemical analysis could not be executed due to the too small sample size.
Seismic interpretation
Seismic interpretation was performed on public 2D seismic lines covering a large part of the southern Dutch subsurface, as well as part of the Campine Basin in northern Belgium (Fig. 5). The seismic dataset includes data with large differences in quality and often lacking information on the seismic processing, which complicates the interpretation. A number of 2D lines had been digitised from paper sections, which sometimes improved the data quality and, more importantly, facilitated digital interpretation and manipulation. A limited number of wells within the study area penetrated the entire Dinantian sequence and hence only few seismic-to-well ties could be made for the entire interval.
The seismic interpretation of the Campine Basin was guided by the general structure and lithostratigraphy of the Dinantian as they were described for specific areas (Langenaeker, Reference Langenaeker2000; Laenen, Reference Laenen2003). Additional well data and well logs of many Belgian wells were used to provide well control on the position of the Dinantian surface.
Dinantian reflectors
The seismic interpretation mainly focused on identifying the top and base Dinantian reflectors. Only where resolution permitted were the intra-Dinantian reflectors ‘Top Beveland Mb’ and ‘Base Goeree Mb’ horizons mapped, indicating the boundaries between the three different members of the Zeeland Formation sensu Van Adrichem Boogaert & Kouwe (Reference Van Adrichem Boogaert and Kouwe1993). In addition, the Top Epen Fm (top Namurian) and Base Cretaceous were often interpreted to aid in understanding the overall subsurface structure.
All seismic data used are zero-phased, negative polarity. The downward transition between Namurian shales and the Top Dinantian is represented as a hard kick and appears as a trough (blue reflector in our study) in the seismic data (Fig. 8). The base Dinantian reflector corresponds to a peak (red reflector in our study), which is explained by the downward transition from the Dinantian carbonates to the underlying clastic formations. In general the top of the Dinantian sequence can be relatively easily identified as it shows distinct onlap geometries of the overlying strata. The identification of the base Dinantian reflector, however, is more difficult because it is fairly chaotic in nature and the boundary at the base of the Dinantian carbonates and the underlying ‘basement’ is therefore diffuse.
SSW–NNE seismic section through well O18-01, situated in the southwestern offshore at the northern edge of the London–Brabant Massif (see Fig. 5 for location). Vertical scale in two-way time (TWT). This section illustrates the presence of a clear horizontal step in the depth of the Top Dinantian horizon, bounded by a steeper slope. Note the onlap of Dinantian strata onto the Devonian substratum and Caledonian basement. Subdivision into the Beveland, Schouwen and Goeree members is according to subdivision described in text. High-amplitude downlapping reflectors are indicative of prograding Upper Dinantian deposits. This seismic character dies out against the platform structure in the left part of the section. High-amplitude chaotic reflectors, indicative of karst, occur in the Dinantian carbonates. The highest amplitudes are associated with zones where the carbonates are truncated by the overlying Cretaceous sequence. Several chaotic reflection patterns with lower amplitudes are seen in the carbonates underlying the Silesian succession.

Towards the London–Brabant Massif the reflectors tend to shallow (Fig. 9). The depth map of the Top Dinantian horizon shows a gradual deepening of the Dinantian towards the northeast (Fig. 10). The two-way time (TWT) contour lines are approximately WNW–ESE aligned, i.e. parallel to the massif. The Base Dinantian depth map (Fig. 10) reveals a roughly similar orientation to that of the Top Dinantian, with the highest dip-gradient approximately perpendicular to the outline of the massif. The depth of the Base Dinantian is usually a few hundred milliseconds below the Top Dinantian. The Dinantian is shallowest in the southeast of the study area, the Belgian Campine Basin and towards Limburg, and the dip-gradient of the sequence is much lower, as shown by the broader spacing of the contour lines. Towards the Roer Valley Graben, the Base Dinantian horizon could not be interpreted due to its large depth (i.e. not recorded in seismic data) and structural complexity.
S–N seismic section through well S02-01, situated in the southern offshore at the northern edge of the London–Brabant Massif (see Fig. 5 for location). Vertical scale in two-way-time (TWT). An important extensional fault below the well demarcates a half-graben basin that affected the thickness and distribution of the identified Dinantian units. The wedge shape of both the Devonian and Dinantian sequences suggests the fault was active throughout Devonian and early Carboniferous times. Drag fold structures along the same fault in the Namurian and Westphalian sequences suggest later Carboniferous activity as well. Two small, stacked clinoforms overlying the top Dinantian may correspond to early Namurian clastic deposition along a fault-bounded edge of the London–Brabant Massif.

Maps showing the elevation time of the interpreted top and base Dinantian horizons (top and bottom left, respectively) and the isochore thickness, both in ms. The depth classes are selected such that they approximate the actual depth (in m) to a fair degree, i.e. the depth classes in TWT are representative for actual depth classes. Note that in the centre of the Roer Valley Graben the top and base of the Dinantian cannot be interpreted in seismic data and are left blank. Fault lines (in red) represent those faults present that penetrate the top of the Dinantian; these include deep-seated syn-sedimentary faults as well as much younger ones.

In areas where quality and coverage of seismic data were best, two intra-Dinantian reflectors were interpreted dividing the carbonates into three sections that roughly correspond to the different members of the Zeeland Formation, i.e. the Beveland, Schouwen and Goeree members (Van Adrichem Boogaert & Kouwe, Reference Van Adrichem Boogaert and Kouwe1993). This subdivision was prominent in the Dutch offshore on the shelf area near the London–Brabant Massif (Figs 8 and 9). The acoustic properties of these members, which are all tight carbonates, show little variation, resulting in seismic reflectors at the transitions, that are often not very pronounced. Differences in seismic quality between different surveys also hinder a consistent interpretation. In addition, karstification also significantly influenced the seismic signature of the carbonate rocks.
Stratal patterns
In the study area, the Dinantian carbonates onlap older Palaeozoic rocks: Devonian siliciclastics or the Caledonian metamorphic basement (Figs 8, 9). Seismic expression of the basement is generally very poor, with mostly ‘noise’ and imaged multiples of overlying formations. The basement shallows towards the SE, i.e. where the lower Palaeozoic rocks in the core of the London–Brabant Massif are exposed (Verniers et al., Reference Verniers, Pharaoh, Adré, Debacker, de Vos, Everaerts, Herbosch, Samuelsson, Sintubin, Vecoli, Winchester, Pharaoh and Verniers2002). Differentiation between the Devonian siliciclastics, penetrated in wells O18-01 and S02-02, and the ‘proper’ Lower Palaeozoic basement is difficult in seismic data as both are dominantly fine-grained siliciclastics. Towards the NE the basement deepens rapidly to over 3000 ms TWT below the present-day surface.
The Dinantian reflectors progressively onlap the north-dipping basement rocks, which is interpreted as an episodic landward migration of marine deposits (coastal onlap) during a transgressive supersequence similar to that of the Tengiz field, Kazakhstan (Weber et al., Reference Weber, Francis, Harris, Clark, Ahr, Harris, Morgan and Somerville2003). In some locations the onlap seems to be defined by faults. Thickness anomalies in the Dinantian infill representing sub-basins that reside in the basement suggest the presence of a palaeo-relief made up by small extensional (half-graben) basins that are related to long-lived faults that have been active since at least the Devonian (Muchez et al., Reference Muchez, Viaene, Wolf and Bouckaert1987). The presence of extensional basins where continental to marine sediments were deposited was described for the northern margin of the London–Brabant Massif (Van Adrichem Boogaert & Kouwe, Reference Van Adrichem Boogaert and Kouwe1993; Laenen, Reference Laenen2003), while such deposits are absent elsewhere. The faults and sub-basins cause remarkable thickness differences in the Dinantian carbonates as shown in the isochron map for the entire Zeeland Formation (Fig. 10). Thicknesses vary from 30 ms near the London–Brabant Massif to over 700 ms in the NW part of the study area and near well RSB-01. The carbonates pinch out towards the palaeo-coastline in the southwest, which progressively onlapped the palaeo-high of the London–Brabant Massif. Since carbonate deposition is restricted by sea level, more carbonates could accumulate in the deeper parts of the basin. Initial thickness differences were enhanced by subsequent uplift of the massif, which led to erosion of the carbonate deposits, as demonstrated in well KTG-01.
In contrast to a general thickness increase to the north, the Dinantian sequence near the Halen well, towards the southern boundary of the Campine Basin, also showed a thick package in a half-graben structure (Muchez et al., Reference Muchez, Viaene, Wolf and Bouckaert1987). These authors also divided the Campine Basin into an eastern and western part based on well observations. The Booischot, Kessel, Poederlee, Merksplas-Beerse and Heibaart wells are located in the western part. Halen is located in the eastern Campine Basin, where the Lower Dinantian deposits attain a notable thickness (Muchez et al., Reference Muchez, Viaene, Wolf and Bouckaert1987). Seismic lines near Halen show a tilted base Dinantian while the top is near horizontal, suggesting active faulting during the early phase of carbonate deposition. This confirms tectonic basin formation since at least the Early Dinantian.
Erosion surfaces
The most important surface identified in seismic is the erosional truncation of the Carboniferous strata below Cretaceous Chalk deposits (Figs 8 and 9). This erosional surface can be traced along the entire northern margin of the London–Brabant Massif, and is easily recognised as an angular unconformity below the Cretaceous strata, which have a very characteristic seismic signal (Van der Molen, Reference Van der Molen2004). The Base Cretaceous unconformity is widely known as a regional hiatus; in the study area Upper Cretaceous chalk deposits generally overlie Pre-Permian strata. This sedimentary hiatus spans a significant amount of geologic time; the London–Brabant Massif was exposed for long periods between the Carboniferous and Cretaceous (Coward et al., Reference Coward, Dewey, Hempton, Holroyd, Evans, Graham, Armour and Bathust2003). However, this does not imply that sediments from intermediate time periods were never present in the study area.
In the areas where the Dinantian carbonates are not truncated by the Base Cretaceous unconformity the top Dinantian is overlain by Silesian clastics. These generally show an onlapping relationship with the carbonates. The Visean–Namurian transition is characterised by a change from carbonate to clastic deposition, and in some locations a sedimentary hiatus is known to be present (Harings, Reference Harings2014). In the basinal areas the Dinantian carbonates seem more or less conformably overlain by early Namurian sediments, but on topographically higher areas a sedimentary hiatus occurs that can reach into the Westphalian (RGD, 1991). Thus, despite this locally comprehensive hiatus, seismic data of these basinal areas do not present obvious indications for a regionally important erosional surface. However, well data suggest Late Carboniferous erosional periods occurring along the fringes of the London–Brabant Massif.
No major intra-Dinantian erosion surfaces have been recognised in seismic sections. However, smaller hiatuses, below seismic resolution, might be present in the Dinantian limestones, especially within the shallower basin margin facies. Some of the studied wells (e.g. O18-01 and S05-01) showed losses at intervals of the Dinantian carbonate section, suggesting the presence of karst zones related to hiatuses. Peaks in the log data support this interpretation. Only one regional regression is known from the Early Dinantian, probably positioned at the boundary between the lower Dinantian dolomite-dominated sequence and the overlying middle to upper Dinantian (Visean) shelf carbonate sequence (Langenaeker, Reference Langenaeker2000). The boundary between these lithologies is mapped as the ‘Top Beveland’ Horizon.
Geometries of Dinantian carbonates
A recurrent geometry of the top-Dinantian horizons at places where carbonates are not truncated by the Base Cretaceous Unconformity is one that resembles a staircase; i.e. a series of at least two to four more-or-less horizontal plateaus occurring at different depths (in time), which are bounded by much steeper slopes, which may or may not be associated with faults (Figs 8 and 9). These structures are chiefly located near the margin of the London–Brabant Massif (also close to the UK border) where the Dinantian is at relatively shallow depth. The occurrence of different horizontal plateaus bounded by steeper slopes goes hand in hand with the occurrence of basinward-thickening, aggradational to slightly progradational carbonate build-ups. The platform boundaries are occasionally associated with faults that do not accommodate a large throw and rarely cut through the Dinantian sequence into the underlying basement. The frequent presence of such faults at the platform–slope transitions suggests faulting might have played an important role in determining the location of these sedimentary facies transitions at the platform margin.
These separate build-ups are interpreted to have developed during a locally fault-controlled deepening of the sedimentary environment. The carbonate platforms developed a back-stepping morphology occupying progressively more inshore and up-shelf levels during transgressions when the rate at which accommodation space is created exceeds the rate of platform growth and sediment supply (cf. Blanchon, Reference Blanchon and Hopley2011).
As such, the overall backstepping nature of the Dinantian carbonates relates to a combination of eustatic sea-level fluctuations and basin subsidence during the Late Visean. Backstepping has been observed in various foredeep basin settings (Drzewiecki & Simó, Reference Drzewiecki and Simó2002; Blanchon, Reference Blanchon and Hopley2011) and microbial carbonates (Whalen et al., Reference Whalen, Day, Eberli and Homewood2002). This phenomenon has also been recognised in other Dinantian carbonate systems around the globe (Weber et al., Reference Weber, Francis, Harris, Clark, Ahr, Harris, Morgan and Somerville2003; Harris et al., Reference Harris, Garber and Clark2008; Kombrink, Reference Kombrink2008). In the Dutch subsurface Jaarsma et al. (Reference Jaarsma, Brolsma, Hoetz and Lutgert2013) found indications for reef-edge rims in regional seismic lines.
Basinwards of the platforms, the internal structure of the Dinantian Goeree Member shows a downlapping geometry. The Upper Dinantian deposits downlap on a (strong) internal reflector of the Zeeland Formation overlying the more transparent facies (Figs 8 and 9). The internal downlapping reflectors are interpreted as progradational sedimentary sequences containing dominantly reworked carbonate material. This suggests that downslope transport of the sediments towards the north occurred. Progradational sequences of carbonate slope material are a common feature of M-factory carbonates, in which slope progradation occurs independent of sea level by shedding of carbonate slope debris (Kenter et al., Reference Kenter, Harris and Della Porta2005; Della Porta et al., Reference Della Porta, Kenter and Harris2008). Initiation of slope progradation could be related to a coastal backstepping event. Global cyclic sea-level variations and tectonic movements near the London–Brabant Massif during the Late Dinantian probably enhanced mass wasting of carbonate slope material. At some locations seismics show a fanning dip, where sediments seem to have accumulated in small half-grabens bounded by extensional faults; these also indicate a northward transport of slope debris. Further basinwards, at the toe of slope, finer carbonate debris and basinal siliciclastics probably are dominant, in analogy with the sedimentation patterns found in the UK basins (Waters et al., Reference Waters, Waters, Barclay and Davies2009).
Well and core data have shown that clastic sediments overlie the Dinantian carbonates. These overlying strata have an onlapping relationship with the Dinantian carbonates. This is best illustrated near the platform-like structures, at the steeper slopes between the platform steps. This geometry suggests the presence of a palaeo-relief in the Dinantian carbonates during the deposition of the overlying strata. The carbonates themselves show karstic features, implying a renewed transgression following a regressive event which exposed the shallow-water carbonates after deposition. Further basinwards, away from the platforms, sedimentation could have been continuous, with basin sediments deposited over the Dinantian carbonates. The combined observations of a sedimentary hiatus, the stratal onlap patterns, observations of karstic development and presence of deltaic clastics on top of the Dinantian carbonates correspond to a well-known regional unconformity between the Dinantian carbonates and overlying Silesian clastics (Vandenberghe et al., Reference Vandenberghe, Dusar, Laga and Bouckaert2000; Schroot et al., Reference Schroot, Van Bergen, Abbink, David, Van Eijs and Veld2006; Harings, Reference Harings2014). This also suggests that the unconformity is more widespread than previously proposed. In some wells the Namurian deposits are missing, and Westphalian strata directly overlie the Dinantian carbonates (Cameron, Reference Cameron, Knox and Cordey1993). The shallow Westphalian clastics in well O18-01 contain reworked Devonian sediments; erosional material derived from the London–Brabant Massif (RGD, 1991). This indicates that the hiatus described here might be complex and might include more than one erosion event.
Just north of well S02-01 (Fig. 9) two, stacked clinoform sets overlie the top Dinantian. These geometries are atypical for the draping Namurian sequence and are tentatively interpreted as Namurian low-stand clastic wedges that were deposited before renewed onlap of the London–Brabant Massif by Namurian marine shales. In the absence of well data, this notion cannot be supported; however, similar deposits have been described for the UK. Contemporaneous with northern-sourced fluvio-deltaic systems of the Namurian Millstone Grit Group that fed the Central Pennine Basin, the emergent Wales–Brabant High sourced small northward-flowing fluvio-deltaic systems in Early Namurian times (Waters & Davies, Reference Waters, Davies, Brenchley and Rawson2006).
Faults
Numerous faults dissect the Dinantian carbonates that can be related to several phases of tectonic disturbance. These faults are approximately trending NW–SE, i.e. paralleling the London–Brabant Massif, although the poor quality of the seismic data does not always allow determining the exact relationship between the different faults systems
Most faults accommodate a relatively small (vertical) throw and affect the Dinantian carbonates as well as the overlying Silesian deposits. These intra-Carboniferous faults often detach on the pre-Carboniferous basement and may be associated with the collapse of the carbonate platform, both during deposition and later reactivation. In addition to the many small-scale faults, several faults with larger offsets are present that often originate in the lower Palaeozoic (Figs 8 and 9). On a regional scale, the larger faults divide the sequence into discrete fault blocks that, combined, arrange the different segments into a predominant NE-dipping geometry.
Syn-depositional faulting
An early phase of basin deformation occurred before or during the Dinantian, as indicated by the presence of several ‘pockets’ recognised in the basement, i.e. grabens that were filled during the early Dinantian and covered by intra-Dinantian reflectors (Fig. 11). Often fault structures are only local; however, the basement faults dividing individual fault blocks can significantly influence the thickness of the Dinantian sequence. A large extensional fault near well S02-01 has a half-graben geometry and accommodates significant throw (Fig. 9). It displaces the ‘Base Dinantian’ horizon in the hanging wall block by roughly 300 ms TWT along a NW–SE oriented fault. The Dinantian deposits show a pronounced thickness change, while offset of the ‘Top Dinantian’ horizon seems relatively minor. The reflectors in the Devonian sequence below the ‘Base Dinantian’ show a wedge shape, indicating the fault might already have been active during Devonian times. Devonian extensional movements along the northern margin of the London–Brabant Massif were frequently reported (e.g. Muchez & Langenaeker, Reference Muchez, Langenaeker, Frostick and Steel1993; Geluk et al., Reference Geluk, Dusar, de Vos, Wong, Batjes and de Jager2007; Vandenberghe et al., Reference Vandenberghe, De Craen and Beerten2014).
S–N seismic section offshore block O18-01. Vertical scale in TWT. Here, the top of the Dinantian sequence is relatively shallow (~1 s TWT) and overlain directly by Cretaceous or Upper Carboniferous sediments. Seismic reflectors display a few concave arcs. Where these arcs coincide with the top Dinantian carbonates (green horizon) a sinkhole is interpreted, which has been filled in with younger material. A gentle sag in the Upper Carboniferous reflectors above the structure may indicate collapse of strata overlying the sinkhole. The arcs may also be positioned below the top Dinantian reflector, which suggests the presence of cavities in the carbonates. The internal reflection suggests infill or collapse of these cavities. These phenomena are similar to those observed in Ordovician carbonate reservoirs in West China which are shown in the inset (modified after Yang et al., Reference Yang, Xue, Pan, Chen, Yang, Tong and Zhao2010).

Additional evidence for syn-sedimentary faulting during deposition of the Dinantian carbonates is shown by the northward increase in thickness of the sequence across the onshore faults (Fig. 10). The carbonate strata wedge out towards the basin in the northeast. It thus appears that the most important fault structures are either of Dinantian origin or inherited from the Caledonian orogeny. Distinct periods of extensional movement occurred along these faults, evidenced by thickness changes. The onshore Hoogstraaten Fault (Vandenberghe, Reference Vandenberghe1984) was also described as a long-lived Caledonian extension fault that defined the northern boundary of carbonate deposition during the Dinantian (Muchez et al., Reference Muchez, Viaene, Wolf and Bouckaert1987; Vandenberghe et al., Reference Vandenberghe, Dusar, Laga and Bouckaert1988; Muchez & Langenaeker, Reference Muchez, Langenaeker, Frostick and Steel1993; Langenaeker, Reference Langenaeker2000). The occurrence of several extensional phases during the Dinantian period was also recognised in the UK, with the occurrence of distinct fault-blocks (TOTAL, 2007).
Post-depositional faulting
Several instances of post-Dinantian tectonic disturbance have been recognised; however, these are not observable on the seismic lines shown herein. There are several faults, which significantly deform the Dinantian. Böker et al. (Reference Böker, Dijksman and van den Graaff2012) described two sets of fault orientations. The larger faults often cut into the basement below and divide the sequence into discrete fault-blocks. These can be traced up to the Cretaceous unconformity, occasionally offsetting even the chalk and younger reflectors, indicating that these faults are very long-lived and have probably been reactivated many times.
Many smaller faults seem to have only limited effect on the Dinantian sediments; often little to no offset is visible in the seismic data used, while offsets in the overlying high-reflective Westphalian strata are more evident (Doornenbal & Stevenson, Reference Doornenbal and Stevenson2010). These faults generally do not propagate above the Cretaceous unconformity; their deformation appears mostly restricted to the Silesian strata. These are interpreted as parasitic synthetic–antithetic couples and compaction-related faults that formed in the well-layered Westphalian strata above the massive and rigid Dinantian carbonate fault blocks. Some of these faults detach onto the Dinantian or are related to distinct changes in Dinantian platform geometry.
Karstification
Although karstification is generally hard to identify, some structures that resemble karst phenomena have been recognised in the study area, especially where Cretaceous deposits directly overlie the Dinantian rocks. Anomalously high-amplitude and rather chaotic reflectors are present just below the Base Cretaceous unconformity (Fig. 8). This suggests, together with the observation of a Cretaceous infill of cavernous karst structures in KTG-01, a period of karstification prior to and contemporaneous with Cretaceous deposition. Potentially, this period could have covered more than 100 Myr, assuming that in North Belgium the exhumation of the Dinantian carbonates occurred by the end of the Palaeozoic (Vandenberghe et al., Reference Vandenberghe, De Craen and Beerten2014). In addition, bowl-shaped depressions can be distinguished in the top Dinantian seismic reflectors (Fig. 11) in the offshore blocks near the UK–NL median line, but also in some seismic sections towards the Dutch onshore. Here, the Dinantian carbonates are directly overlain by onlapping Namurian sediments (Figs 9 and 11). In the Campine Basin this hiatus is linked to the Sudetic uplift (Graulich, Reference Graulich1962) and covers ~1 million years, which provides sufficient time for the development of a post-Dinantian meteoric karst system. Vandenberghe et al. (Reference Vandenberghe, Poggiagliolmi and Watt1986) reported on veins in karstic voids in the Dinantian sequence that are related to this karstification phase. These observations suggest that major karstification occurred during at least two periods.
Facies model
Introduction
Because of the small number of wells that have penetrated the Dinantian sequence in the subsurface of the Netherlands a comparison will be made with analogues that could provide additional insights into the different facies types present in the Dinantian carbonates. The Dinantian carbonates developed on a continuous shelf fringing the exhumed London–Brabant Massif, stretching from Ireland into Belgium and Germany. Outcrops in Belgium, Germany and the UK (Kombrink, Reference Kombrink2008) show Visean carbonates that are situated at the southern margin of the London–Brabant Massif. The Upper Visean in this region is differently developed and partly obscured by Variscan nappe emplacement. The best outcrop analogues are found onshore UK, especially the carbonates on the northern margin of the persistent London–Brabant high, e.g. the St. George's Platform and its transition into the Craven basin (Leeder, Reference Leeder1976).
A lithofacies description and interpretation, and reservoir properties of the Dinantian carbonates encountered in wells, are summarised in Table S1. The characteristics of the accompanying seismic facies are shown in Figures 12 and 13 respectively. The various facies types recognised roughly correspond to the Dinantian development observed in the UK (Waters et al., Reference Waters, Waters, Barclay and Davies2009). The Dinantian carbonate development onshore UK shows many similarities to that found in the study area. Both successions are located on the northern flank of the London–Brabant Massif, a continuous high, and constitute an overall transgressive sequence. The development in the study area agrees with the description given by Bridges et al. (Reference Bridges, Gutteridge, Pickard, Monty, Bosence, Bridges and Pratt1995), which includes a carbonate ramp, rimmed platform and carbonate shelf, respectively.
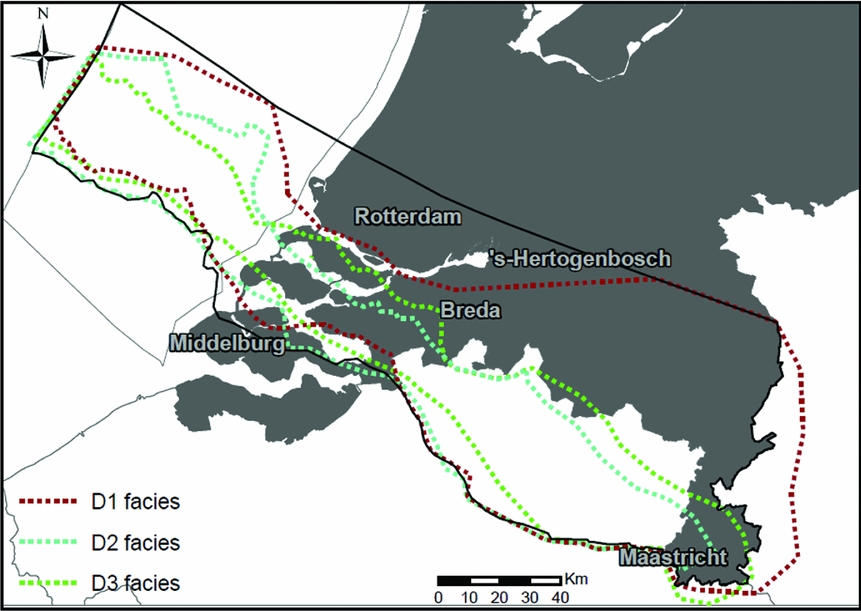
Facies distribution map of the Dinantian in the entire study area. The D1, D2 and D3 facies types are broadly equivalent to respectively the Beveland, Schouwen and Goeree Members of the ‘Stratigraphic nomenclature of the Netherlands’ (Van Adrichem Boogaert & Kouwe Reference Van Adrichem Boogaert and Kouwe1993). The D1 facies was recognised in well CAL-GT-01 (see Fig. 5 for location), but its continuation throughout the Roer Valley Graben is uncertain.
Main depositional, lithofacies, log and seismic characteristics of depositional units D1–D3 recognised in the study area.

Comparison with analogues
Lower Carboniferous carbonates
The earliest Carboniferous deposits, the D1 facies type (Table S1; Figs 12 and 14), encountered in the study area, are of Early Dinantian age (Tournaisian and Chadian stages), which is broadly equivalent to the Beveland Members (Van Adrichem Boogaert & Kouwe Reference Van Adrichem Boogaert and Kouwe1993). Deposits belonging to this facies type have been encountered in wells BHG-01, KTG-01, O18-01, S02-02 and S05-01.
Upper Dinantian limestones outcropping in the Peak District, on the Derbyshire high, show fringing carbonate platforms (Strank, Reference Strank, Adams, Miller and Wright1987; Waters et al., Reference Waters, Waters, Barclay and Davies2009). These platforms continue towards the East Midlands Shelf and further to the east on the Hewett Shelf of the southern North Sea. In the study area low-gradient carbonate ramp deposits developed in a very broad, shallow marine basin setting. Within this basin, several sub-basins existed, bounded by extensional faults. Cyclic, eustatic sea-level variations had a profound effect on the type of sediments deposited as a result of the low topographic basin gradient; small changes resulted in large shifts of the sedimentary environment, up to several kilometres. Sedimentation in restricted shallow marine carbonate environments alternated with periods of emergence and subaerial exposure resulting in the formation of pedogenic surfaces, karstic levels and evaporite deposition. Continued subsidence led to a gradual landward onlap of these deposits onto the London–Brabant Massif. These sedimentary conditions prevailed until well into the Chadian. The early Carboniferous carbonate deposition in the UK shows basal continental to peritidal deposits of early Visean ages, whose development already started in the Devonian. In North Wales the Visean limestone deposits progressively onlap the underlying rocks during the Visean (Waters et al., Reference Waters, Waters, Barclay and Davies2009).
Platform development on basin highs
The Holme high is located on the northern margin of the London–Brabant Massif, on which the Chadian to Brigantian carbonates developed as distinct shallow-water carbonate platform successions (Evans & Kirby, Reference Evans and Kirby1999), which may be up to 1250 m thick. The base shows 120 m of dolomite, while the top is overlain by mudstones of the Namurian Bowland Shale Formation (Waters et al., Reference Waters, Waters, Barclay and Davies2009). In the study area the D2 and D3 facies type (Table S1; Figs 12–14) are the time-equivalent deposits as known from the Holme high. The D2 deposits are of Middle Dinantian age (Chadian through Holkerian stages) while the latest D3 deposits are of Late Dinantian age (Asbian and Brigantian stages). The D2 and D3 facies types are broadly equivalent to, respectively, the Schouwen and Goeree Members as defined in the ‘Stratigraphic nomenclature of the Netherlands’ (Van Adrichem Boogaert & Kouwe Reference Van Adrichem Boogaert and Kouwe1993). Facies type 2 deposits have been encountered in wells BHG-01, KTG-01, O18-01, S02-02 and S05-01, while type 3 deposits were encountered in wells BHG-01, O18-01 and S02-02.
Facies model of the D1, D2 and D3 Dinantian carbonate facies types occurring north of the London–Brabant Massif (not to scale). It shows the evolution from a carbonate ramp to carbonate shoal (D1) and to a broad carbonate shelf during sea-level rise (D2), followed by the drowning of the shelf (D3). Sediment descriptions of colours and symbols used provided in figure. Note the difference in scales of separate facies models. Quadrant in D2 shows extent of D3 facies type model.

In the study area the D2 facies that developed during the Chadian, Arundian and Holkerian stages (middle Dinantian) showed sedimentation characterised by the evolution from a carbonate ramp to a rimmed shelf environment (Fig. 14). Increased subsidence in the basin led to the formation of a broad intertidal carbonate shelf. Retreat of the coastline provided the opportunity for extensive shoal complexes to build out to sea level. The increased topographic gradient allowed more distinct and narrower facies belts to develop through time. The extent of the supratidal deposits was significantly reduced while grainstone barriers protecting the lagoons were of increasing importance at the boundary of the shallow marine carbonate shelf in the southwest and the deeper marine basin to the northeast. In North Wales the Visean limestones of Chadian to Brigantian age developed as shallow marine ramp and platform carbonates that reach nearly 1 km thickness. At several locations the carbonate sequence developed on Silurian basement rocks of the London–Brabant Massif (Waters et al., Reference Waters, Waters, Barclay and Davies2009). Development started during a transgression when peritidal and shallow lagoonal sediments formed in a carbonate ramp setting. Holkerian to Asbian lithologies are predominantly pale packstones and grainstones that contain significant amounts of shelly material and ooids; high-energy carbonates developed on a carbonate shoal with a protective barrier (Waters et al., Reference Waters, Waters, Barclay and Davies2009).
Repeated subaerial exposure during the late Asbian stage led to the formation of calcretes and karstic dissolution features (Waters et al., Reference Waters, Waters, Barclay and Davies2009). Similar sedimentation patterns occur in the study area, which are discussed in the next paragraph. On the basinal side of the protective barrier a continuous complex of knoll reefs developed during the late Asbian. This facies basically formed the slopes of the carbonate platforms, bordering a deeper basin in which debris was resedimented (Waters et al., Reference Waters, Waters, Barclay and Davies2009). Brigantian (Upper Dinantian / Upper Visean) deposits reflect sea-level variations in a deepening carbonate shelf environment with alternations of limestones and mudstones. This sequence is overlain by series of mixed carbonate and siliciclastic shallow-marine deposits in which karstic surfaces frequently occur. Siliciclastic channels and karstic caverns are also common, and are interpreted to result from cyclic sea-level variations in combination with an increased input of erosional material from the exposed London–Brabant Massif.
The northern margin of the London–Brabant Massif was subject to considerable subsidence during the Late Dinantian, leading to a further landward shift of the facies belts and an increase of the overall topographic gradient. Large parts of the carbonate shelf drowned and carbonate mud-mounds developed over areas that previously were occupied by carbonate shoals. The overall subsidence of the region was accompanied by the formation of normal faults, which caused the formation of a staircase submarine landscape with a significant slope environment (Fig. 14). As for the UK part of the London–Brabant Massif, sedimentation along the slopes consisted of boulder beds and carbonate breccias deposited proximal to the platform transition and bioclastic calciturbidites in the distal parts of these slopes. Significant amounts of siliciclastic mud were deposited during periods of low carbonate input. These mass-flow deposits were incorporated in the carbonate mud-mounds and algal encrustrations of Asbian and Brigantian age. Deposits belonging to this facies type have been encountered in wells Brouwerhavensegat-01, O18-01 and S02-02.
Summary
As discussed above, the differences in depositional style reflect changing palaeogeographic conditions in the Carboniferous basin, and the facies model with the D1, D2 and D3 facies types fully reflects these changes (Fig. 14). The model describes the continuous subsidence in the Carboniferous foredeep basin that during the Dinantian period was primarily instigated by the northward-propagating Variscan deformation front. The initial development of shallow marine to supratidal deposits that were subsequently dolomitised is also recognised in the Netherlands and Belgium (Langenaeker, Reference Langenaeker2000). The shallow-marine to peritidal deposits drowned in the deepest parts, while in the shallower areas they were covered by a carbonate ramp, grading from shallow marine to exposed in the south to a mid- and deep ramp setting towards the north. These deposits gradually onlap the exposed basement and continental siliciclastics, while the ramp evolved into a broad intertidal lagoonal shelf where periodic shoaling sequences prograde towards the north. On the shoal a protective oolitic to bioclastic grainstone barrier separated the carbonate shoal from the deeper basin. The slope area contains a well-developed complex of knoll reefs and carbonate mud-mounds. During periods of tectonic subsidence the carbonate ramps and platforms were segmented. Coarse carbonate breccias and other slope debris characterise the downthrown blocks. Finally the carbonate platforms drown; however, the onset of basinal facies is highly diachronous while the timing of carbonate platform drowning varied. Consequently, ages for the characteristic basinal facies range from Chadian to Yeadonian.
Reservoir quality and karst
The Dinantian carbonates drilled in the Netherlands show large variations in reservoir quality (Fig. 15). In the studied cores of five wells it is mostly poor, with low average porosities and permeabilities. Measurements on cores are summarised in Table S1. Porosity is less than a few per cent, often as a result of occlusion by cementation and mineralisation, but streaks with higher porosity, over 20%, are also present. Permeability is mostly very low, with a maximum of around 1 mD. Some streaks with increased permeability occur with values of up to a few mD. Some other wells drilling the Dinantian carbonates in the Netherlands encountered (severe) losses during drilling of this section, e.g. wells O18-01, S05-01, LTG-01 and UHM-02. Sonic and gamma-ray logs and the porosity derived from petrophysical evaluations often show spikes at many levels. Figure 16 shows a well correlation panel with four wells to illustrate the heterogeneity in reservoir properties (EBN, 2014).
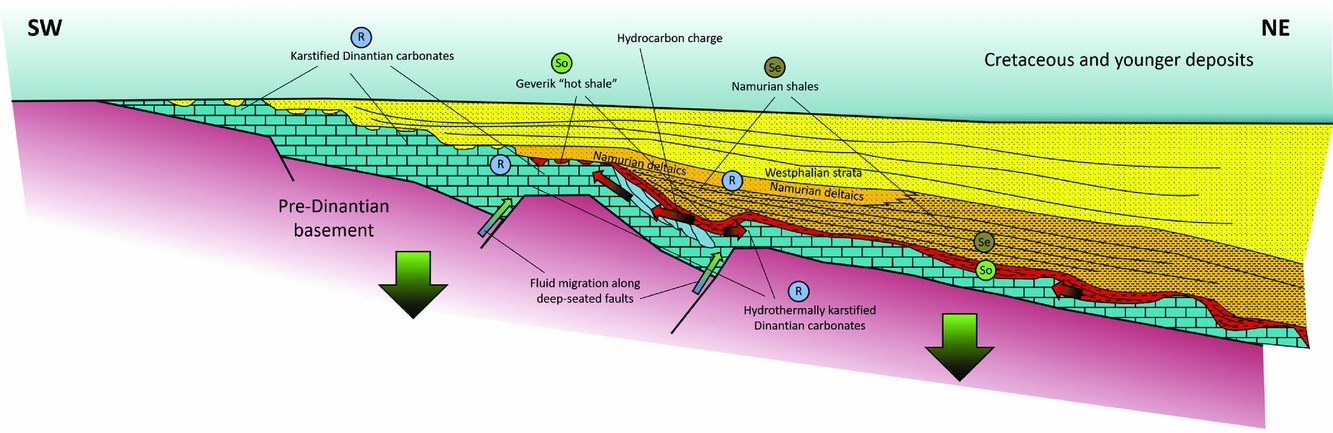
Cartoon representing the main components of a possible Dinantian carbonate petroleum system on the northern flank of the London–Brabant Massif. R = reservoir, So = source rock, Se = seal.
Well correlation panel through wells O18-01, S02-02, S05-01 and UHM-02, flattened on top Dinantian carbonates (see Fig. 5 for locations of the wells O18-01, S02-02 and S05-01; well UHM-02 is located in the northeastern Dutch onshore). Sonic and gamma-ray logs are shown in the left pane of each well, in red and black respectively; log porosity is shown in light blue in the right panel. Green dots indicate porosities measured from cores.
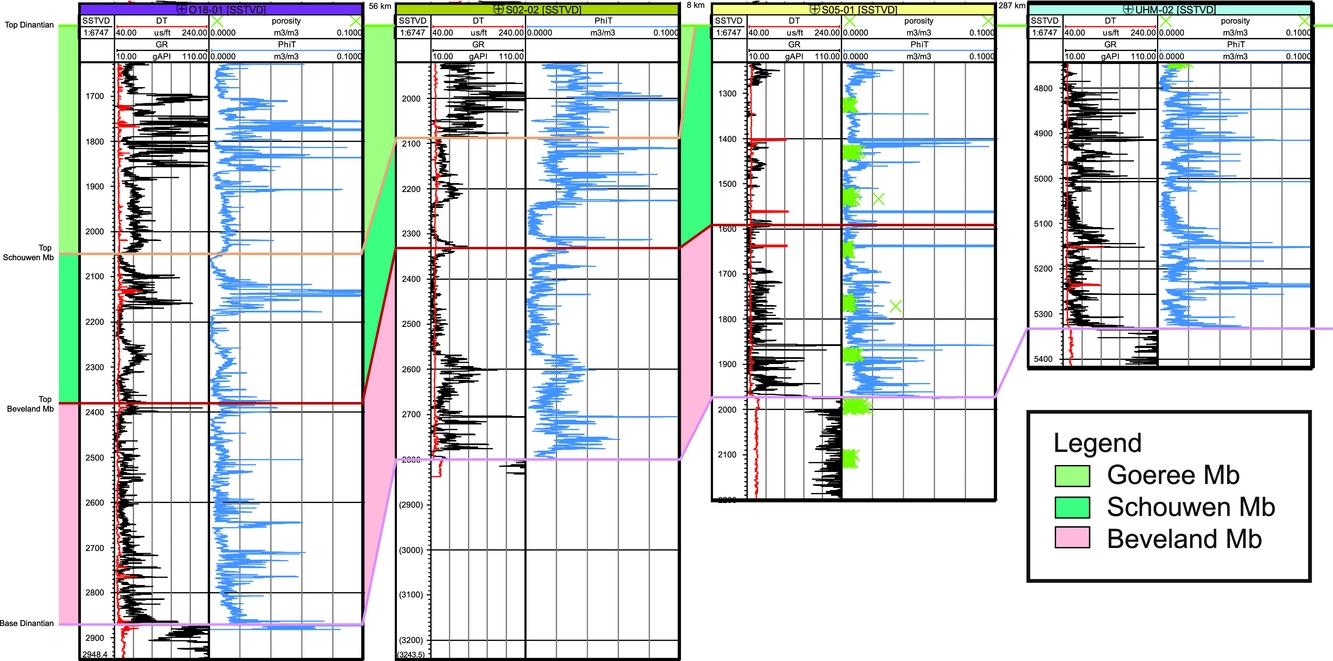
The primary reservoir quality of the Dinantian carbonates is not prominent as shown in other Dinantian carbonate build-ups (Gutteridge, Reference Gutteridge2002; Van Hulten & Poty, Reference Van Hulten and Poty2009; Van Hulten, Reference Van Hulten2012). It has been suggested that reservoir quality might be better in the slope facies of the northern isolated platforms (Van Hulten, Reference Van Hulten2012; Hoornveld, Reference Hoornveld2013) in analogue with the Dinantian carbonate build-ups from the Caspian Sea (Weber et al., Reference Weber, Francis, Harris, Clark, Ahr, Harris, Morgan and Somerville2003; Kenter et al., Reference Kenter, Harris and Della Porta2005, Harris et al., Reference Harris, Garber and Clark2008). However, the slope facies encountered in this study does not show significantly better reservoir properties. The development of secondary porosity is considered the most important factor in determining the prospectivity of the Dinantian carbonate play (Wintershall Noordzee, 2006; TOTAL 2007; Böker et al., Reference Böker, Dijksman and van den Graaff2012). Next to fracturing, karstification is recognised as another important process that may increase the reservoir potential of carbonates (Fig. 15).
On the northern flank of the London–Brabant Massif a widely known occurrence of a karst-enhanced Dinantian carbonate reservoir has been identified, e.g. the underground gas storage (UGS) facility near Loenhout, Belgium (Jaarsma et al., Reference Jaarsma, Brolsma, Hoetz and Lutgert2013). This structure occurs in the Campine Basin, and cross-cutting high angle veins that were widened by karstic dissolution created porosity. This process ultimately produced cavernous porosity (Vandenberghe et al., Reference Vandenberghe, Dusar, Laga and Bouckaert2000; Amantini, Reference Amantini2009). The karstic dissolution phase has been related to a regression at the end of the Visean period leading to regional exposure (Vandenberghe, Reference Vandenberghe1984; Dreesen et al., Reference Dreesen, Bouckaert, Dusar, Soille and Vandenberghe1987; Schroot et al., Reference Schroot, Van Bergen, Abbink, David, Van Eijs and Veld2006) and subsequent karst development at the top of the Visean limestone in the exposed areas. The Merskplas–Beerse geothermal well positioned in these deposits shows porosities of up to 20% (Vandenberghe et al., Reference Vandenberghe, Dusar, Laga and Bouckaert2000). A comparable karstic Dinantian limestone reservoir was encountered in geothermal well CAL-GT-01 drilled on the Maasbommel–Krefeld high near Venlo (Netherlands), which encountered heavily karstified sediments including metre-scale cavities (Böker et al., Reference Böker, Dijksman and van den Graaff2012; Jaarsma et al., Reference Jaarsma, Brolsma, Hoetz and Lutgert2013). Furthermore, the entire Dinantian sequence encountered in this well is strongly influenced by diagenetic changes. The Upper Visean limestones were strongly silicified (~90%) and the Lower Dinantian section was also strongly altered. It is likely that the sediments were subjected to dedolomitisation possibly involving fluids rich in calcium sulphates (Poty, Reference Poty2014). The occurrence of quartz and calcite veins strongly suggests that these alterations were caused by hydrothermal fluid circulation (Fig. 15), possibly associated with the emplacement of minerals (Poty, Reference Poty2014). The seismic lines near the well show that the well is drilled near a fault zone, which may have facilitated the hydrothermal karstification.
Below the Cretaceous unconformity in the Dutch province of Limburg, extensively silicified Dinantian limestones and lead–zinc mineralisations have been described in karstified limestones (Bless et al., Reference Bless, Boonen, Bouckaert, Brauckmann, Conil, Dusar, Felder, Felder, Goekdag, Kockel, Laloux, Langguth, Van Der Meer Mohr, Meesen, Op Het Veld, Paproth, Pietzner, Plum, Poty, Scherp, Schulz, Streel, Thorez, Van Rooijen, Vanguestaine, Vieslet, Wiersma, Winkler-Prins and Wolf1981; Friedrich et al., Reference Friedrich, Bless, Vogtmann and Wiechowski1987). Sphalerite, wurtzite, pyrite and galena, and similar mineralisations are widespread in the silicified carbonates of Dinantian age near Aachen (Germany), Vesdre (Belgium) and Ireland (Friedrich et al., Reference Friedrich, Bless, Vogtmann and Wiechowski1987). The emplacement of these ores followed a post-Variscan period of meteoric leaching and silicification of the limestones (Friedrich et al., Reference Friedrich, Bless, Vogtmann and Wiechowski1987). Similar mineral emplacement occurrences in the Dinantian limestones are known from the UK and relate to hydrocarbon generation (Ford & King, Reference Ford and King1965; Moser et al., Reference Moser, Rankin and Milledge1992). Precipitation of these minerals likely took place during a period of mixing between saline brines ascending from basement rocks and meteoric waters infiltrating along the Caledonian fault systems (Friedrich et al., Reference Friedrich, Bless, Vogtmann and Wiechowski1987).
The occurrence of karst-related features in outcrops, losses during drilling in various wells (Jaarsma et al., Reference Jaarsma, Brolsma, Hoetz and Lutgert2013), petrophysical well data and observations in cored intervals agree with structures observed in the seismic profiles (Fig. 11; Böker et al., Reference Böker, Dijksman and van den Graaff2012; Jaarsma et al., Reference Jaarsma, Brolsma, Hoetz and Lutgert2013) that resemble collapse structures seen in well-known karst reservoirs in China and Vietnam (Fig. 11; Wang & Al-Aasm, Reference Wang and Al-Aasm2002; Fyhn et al., Reference Fyhn, Boldreel and Nielsen2009; Yang et al., Reference Yang, Xue, Pan, Chen, Yang, Tong and Zhao2010). Similar karst-related collapse structures have been identified in the Campine Basin (Dreesen et al., Reference Dreesen, Bouckaert, Dusar, Soille and Vandenberghe1987). The features suggest that several phases of subaerial exposure and associated karstification, either by eustatic sea-level changes or due to tectonic uplift, affected the Carboniferous sediments (Dreesen et al., Reference Dreesen, Bouckaert, Dusar, Soille and Vandenberghe1987 and references therein; Kombrink, Reference Kombrink2008; Doornenbal & Stevenson, Reference Doornenbal and Stevenson2010, p. 99; Hoornveld, Reference Hoornveld2013, p. 70).
In the Namurian, the karstified limestone landscape was reflooded and subsequently covered and infilled by Namurian clastics (Schroot et al., Reference Schroot, Van Bergen, Abbink, David, Van Eijs and Veld2006). The Turnhout well (Fig. 5) shows an irregular karstic Dinantian limestone top draped by early Namurian clastics (Vandenberghe et al., Reference Vandenberghe, Dusar, Laga and Bouckaert2000). This well is located on the Loenhout build-up, which is a carbonate shoal that developed on an uplifted basement structure (Langenaeker, Reference Langenaeker2000). Later phases of deep karstification were enhanced by continued fluid circulation along fault zones; typical hypogene karst processes as discussed by Klimchouk (Reference Klimchouk, Klimchouk, Palmer, Waele, Auler and Audra2017). These fluids may have had temperatures of up to 200°C as shown by fluid inclusion analysis of vein calcites (Muchez et al., Reference Muchez, Viaene, Keppens, Marshall and Vandenberghe1991). Assuming that no deeper burial for the top Dinantian occurred in the area in later Meso- and Cenozoic times (Van Keer et al., Reference Van Keer, Ondrak, Muchez, Bayer, Dusar and Viaene1998), its maximum burial depth can be based on the estimated thickness of the Namurian and Westphalian sequence in the Campine area, which is approximately 3500 m (Langenaeker, Reference Langenaeker2000). The 200°C formation temperature for the vein carbonates is in reasonable agreement with this estimated maximum burial depth of 3500 m assuming a high Late Carboniferous heatflow of 84 mW m−2 (Langenaeker, Reference Langenaeker2000) and a thermal conductivity of 1.6 W m−1 °C−1 for the Westphalian–Namurian section (cf. Dijkshoorn and Clauser, Reference Dijkshoorn and Clauser2013). This temperature can thus be considered a rather normal burial temperature and the interpretation, as hydrothermal system cannot be confirmed. Later uplift and emersion of karst levels further enhanced the reservoir properties by dissolution (Poty, Reference Poty1997; Vandenberghe et al., Reference Vandenberghe, Dusar, Laga and Bouckaert2000; Amantini, Reference Amantini2009).
The new facies model (Figs 14 and 15) shows that the Dinantian carbonates form a continuous body on the northern flank of the London–Brabant Massif, south of the Roer Valley Graben. The carbonates often show low porosities and low permeabilities, but cross-cutting, high-angle fracture systems created some secondary porosity (Vandenberghe et al., Reference Vandenberghe, Dusar, Laga and Bouckaert2000). In addition, the Upper Dinantian sediments were subjected to extensive karst processes creating cavernous karst systems with up to metre-scale cavities. Smaller karst features may be cemented by carbonate cements but at times are also infilled by Namurian shales (Amantini, Reference Amantini2009). Source rocks may be the basal Namurian hot shales, known as the Geverik Member (Schroot et al., Reference Schroot, Van Bergen, Abbink, David, Van Eijs and Veld2006) and the Dinantian basinal shales (equivalent to the Bowland Shales). The elements of this petroleum play are illustrated in Figure 15. The risk of absence of quality source and seals, however, is largest in areas of late generation, while in areas of early generation the risk of destroyed traps and over-matured source rocks is the most prominent. The new facies model and the insights on reservoir developments from this study are equally relevant to studies of the potential of (ultra-deep) geothermal projects in Dinantian carbonates since these geothermal projects require good reservoir properties to be successful.
Conclusions
The study showed the presence of three carbonate facies types in a study area in the southern fringe of the Northwest European Carboniferous Basin (NWECB). Carbonate sedimentation started with a Tournaisian low-gradient carbonate ramp system (facies D1) that was succeeded by a succession in which the carbonate ramp system evolved to a rimmed shelf setting (facies D2) in the Chadian–Holkerian stages. During the Late Dinantian phase (Asbian–Brigantian) subsidence of the northern margin of the London–Brabant Massif resulted in a landward shift of the shallow-marine facies belts. The formation of normal faults during this time interval resulted in a ‘staircase’-shaped shallow-water platform–slope–basin profile. This process was associated with large-scale resedimentation processes (facies D3).
Several phases of karstification improved the reservoir properties of the Dinantian carbonates on the northern margin of the London–Brabant Massif. A period of regional exhumation at the end of the Dinantian seems to be associated with porosity-enhancing meteoric karstification. The most intense alterations seem to be present as a deep leached horizon below the Cretaceous unconformity. This resulted in large-scale dissolution processes and hence locally very high porosities. In addition, clear evidence for hydrothermal fluid migration is found. These fluids interacted with the Dinantian limestones and resulted in locally enhanced reservoir properties, while at other places mineralisation processes occluded the porosity present in the fault zones that functioned as conduits for the brines. The timing of these phases of hydrothermal fluid circulations is poorly understood. It has been proposed that these events occur on a regional scale, but this study shows that they operate on a local scale. These findings are relevant for studies of hydrocarbon prospectivity and studies of the geothermal potential of the Dinantian carbonate system in the southern Netherlands and northern Belgium.
Acknowledgements
The Nederlandse Aardolie Maatschappij (NAM) is thanked for the use of its facilities to study core material. The Flemish Institute for Technological Research (VITO) is thanked for access to the Belgian Campine Basin seismic survey. Technical and supporting staff at TNO in Utrecht are acknowledged for the stimulating work environment; we especially would like to thank Geert-Jan Vis, Maryke den Dulk, Nora Witmans, Mart Zijp, Geert de Bruin, Hans Doornenbal and Jenny Hettelaar. Koos de Jong (VU University Amsterdam) is thanked for editing some of the figures. Jan Schneider is acknowledged for the petrophysical evaluation of Dinantian carbonates in Dutch wells. We highly appreciate the thorough and constructive comments of reviewers Henk Kombrink and Noël Vandenberghe.
Supplementary material
To view supplementary material for this article (Table S1), please visit https://doi.org/10.1017/njg.2017.33


