


Introduction
The pre-operative evaluation of parotid gland masses aims to distinguish between benign and malignant lesions, predict histological subtypes when possible and guide surgical planning. Fine-needle aspiration cytology (FNAC) is considered the first-line diagnostic tool owing to its low cost and favourable safety profile, whereas magnetic resonance imaging (MRI) provides superior anatomical delineation and may offer qualitative clues suggestive of malignancy. Previous studies have reported comparable diagnostic accuracy for FNAC and MRI in predicting malignancy and have demonstrated that combining these modalities alters the balance of sensitivity and specificity depending on the applied decision rule.Reference Paris, Facon, Pascal, Chrestian, Moulin and Zanaret1–Reference Perkins, Toll and Reece13
In this study, we retrospectively analysed 42 cases with available pre-operative FNAC and MRI reports, subsequently confirmed by histopathology, to quantify FNAC–histopathology agreement and test whether qualitative MRI features add value for malignancy and subtype discrimination.
Methods
Patient selection
Between 2020 and 2021, we reviewed neck MRI reports stored in the radiology archive of our institution. Patients whose reports explicitly mentioned a “parotid mass” were identified and included in the study cohort. Individuals who did not undergo surgery at our hospital, or who lacked either FNAC results or post-operative histopathological confirmation, were excluded from the analysis.
All procedures in the study were performed on human participants in accordance with national research committee standards and ethical guidelines for the 1964 Helsinki Declaration and later amendments. The local non-invasive investigation ethics committee approved this study (date: 23.03.2021, number: 271). Diagnosis methods were performed according to the approved guidelines. All patients gave written informed consent. A pathologist performed histopathological evaluation according to international guidelines.
Data collection
A board-certified radiologist with seven years of experience performed and interpreted the MRI examinations and conducted the FNAC procedures. An otorhinolaryngologist with eight years of clinical experience performed all surgical interventions. For each parotid lesion, the long- and short-axis diameters, signal characteristics and contrast enhancement patterns were systematically recorded. In addition, FNAC results and post-operative histopathological diagnoses were documented for comparative analysis.
Technique
All MRI examinations were performed on a 1.5 T scanner (Siemens Symphony A Tim, Erlangen, Germany) using a dedicated neck coil. Patients were positioned supine with the head in a neutral position and instructed to avoid swallowing or movement during image acquisition.
The neck MRI protocol included the following sequences: sagittal T2-weighted turbo spin-echo (TSE) (slice thickness = 6 mm), coronal T2-weighted short tau inversion recovery (STIR) (6 mm), axial T2-weighted TSE Dixon (in-phase, fat-only, water-only; 6 mm), axial diffusion-weighted imaging (DWI) (b = 50 and 800 s/mm2; 6 mm) and both pre- and post-contrast T1-weighted TSE Dixon (in-phase, fat-only, water-only; 6 mm). Post-contrast T1-weighted TSE Dixon coronal images (6 mm) were also obtained. A gadolinium-based contrast agent was administered intravenously at a dose of 0.1 mmol/kg body weight, followed by a 20 mL saline flush.
DWI was routinely acquired (b = 50 and 800 s/mm2); however, quantitative apparent diffusion coefficient (ADC) measurements were not included in the analysis, as the study focused on qualitative MRI features reported in routine clinical practice.
Statistical analysis
Concordance between FNAC and histopathology was assessed using Cohen’s kappa coefficient, both for multicategory and binary (benign–malignant) classifications. In addition, chi-square tests of independence were used to evaluate association between FNAC categories and final histopathology. MRI variables included signal characteristics, contrast enhancement and cystic-like appearance. For statistical analysis, categorical variables were compared using Fisher’s exact test, and continuous variables with appropriate non-parametric tests. Predictors of malignancy were evaluated using Firth logistic regression. Two-sided p values less than 0.05 were considered statistically significant.
All analyses were performed using Python v3.11 (Python Software Foundation, Wilmington, DE, USA) with the libraries pandas, scipy, statsmodels, scikit-learn and matplotlib.
Results
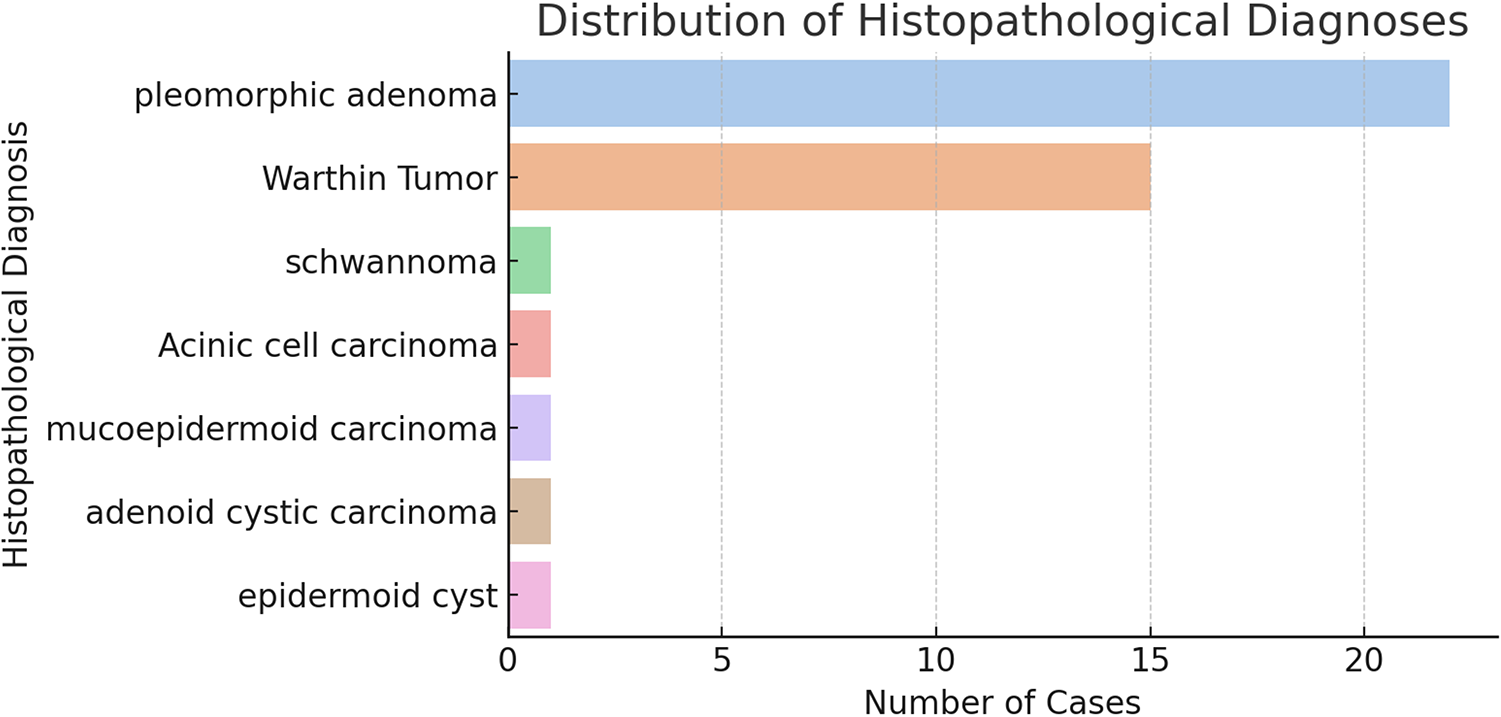
The study included 42 patients with parotid gland tumours (23 women, 19 men). The overall mean age was 45.5 ± 16.1 years (range, 11–69). The mean age was 44.3 ± 17.0 years among women and 46.9 ± 15.3 years among men. Definitive post-operative histopathology established seven distinct tumour types. The most frequent lesions were pleomorphic adenoma (PA; n = 22, 52.4 per cent) and Warthin tumour (WT; n = 15, 35.7 per cent). Other diagnoses comprised schwannoma (n = 1), acinic cell carcinoma (n = 1), high-grade mucoepidermoid carcinoma (n = 1), adenoid cystic carcinoma (n = 1) and epidermoid cyst (n = 1) (Fig. 1).
Histogram of histopathological diagnoses among 42 resected parotid tumors. Pleomorphic adenoma (n = 22, 52.4%) and Warthin tumor (n = 15, 35.7%) accounted for the vast majority of cases; schwannoma, acinic cell carcinoma, high-grade mucoepidermoid carcinoma, adenoid cystic carcinoma, and epidermoid cyst were uncommon (each n = 1, 2.4%).

Figure 1 Long description
The bar graph displays the distribution of histopathological diagnoses among parotid tumors. The x-axis is labeled 'Number of Cases' and the y-axis is labeled 'Histopathological Diagnoses'. The graph includes the following diagnoses: pleomorphic adenoma with 22 cases, Warthin tumor with 15 cases, schwannoma with 1 case, acinic cell carcinoma with 1 case, mucoepidermoid carcinoma with 1 case, adenoid cystic carcinoma with 1 case and epidermoid cyst with 1 case. Pleomorphic adenoma and Warthin tumor are the most prevalent diagnoses.
In the PA–WT subgroup, 37 patients were analysed (PA, n = 22; WT, n = 15). The WT group was older (median age, 58.0 [26–68] years) than the PA group (48.5 [11–69] years), but the difference was not statistically significant (p = 0.080; Mann–Whitney U-test). Sex distribution also did not differ between groups (men: 45.5 per cent in PA vs. 40.0 per cent in WT; p > 0.99; Fisher’s exact test) (Table 1).
Age comparison and gender distribution between pleomorphic adenoma and Warthin tumour

Table 1 Long description
The table compares age and gender distribution between pleomorphic adenoma and Warthin tumour. Pleomorphic adenoma has a median age of 48.5 years, ranging from 11 to 69 years, whereas Warthin tumour has a median age of 58 years, ranging from 26 to 68 years, with a p-value of 0.080 indicating no significant age difference. Gender distribution shows 10 males and 12 females for pleomorphic adenoma, and 6 males and 9 females for Warthin tumour, with a p-value greater than 0.99, suggesting no significant gender difference between the two tumour types.
* Mann-Whitney U test.
** Fisher’s exact test.
Agreement between FNAC and definitive post-operative histopathology across multi-category diagnoses was poor (κ = 0.082), whereas dichotomising diagnoses as benign versus malignant yielded substantial agreement (κ = 0.636; 95 per cent CI, 0.41–0.83; p < 0.01). Complementary chi-squared analyses were consistent with these findings — non-significant association in the full multicategory table but a significant association was observed after collapsing categories to benign versus malignant (Fig. 2; Table 2). These findings suggest that FNAC is more reliable in distinguishing between benign and malignant lesions than in providing specific histological subtypes.
Confusion-matrix heatmap of FNAC categories versus postoperative histopathology for 42 parotid tumors. Concordant classifications appear along the diagonal, with the highest agreement observed for pleomorphic adenoma and Warthin tumor. Color intensity reflects cell counts.

Figure 2 Long description
A heatmap illustrating the agreement between Fine Needle Aspiration Cytology (FNAC) and postoperative histopathology for parotid tumors. The x-axis represents postoperative histopathology categories: acinic cell carcinoma, mucoepidermoid carcinoma, pleomorphic adenoma, squamous cell carcinoma and Warthin tumor. The y-axis lists FNAC categories: benign cytology, consistent with acinic cell carcinoma, consistent with pleomorphic adenoma, consistent with Warthin tumor, cystic component mass, mature adipose tissue, non-diagnostic cytology, suspicious for malignancy and suspicious lymphoid cells. Concordant classifications appear along the diagonal, with the highest agreement observed for pleomorphic adenoma and Warthin tumor. Color intensity reflects cell counts, with darker shades indicating higher counts.
Agreement between FNAC and post-operative histopathology

Table 2 Long description
The table compares the agreement between fine-needle aspiration cytology (FNAC) and post-operative histopathology using Cohen’s kappa. In the binary analysis, which categorizes results as benign or malignant, there is substantial agreement with a kappa of 0.636 and a 95% confidence interval ranging from 0.41 to 0.83, indicating a statistically significant result (p<0.01). In contrast, the multicategory analysis, which includes a full diagnosis list, shows only slight agreement with a kappa of 0.082 and a non-significant p-value greater than 0.05. Sparse cell counts in the multicategory analysis limit the estimation of the confidence interval, suggesting caution in interpreting these results.
† 95% CI not estimable due to sparse cell counts in the multicategory table.
* Chi-square test assessed association between FNAC category and final histopathology (complementary to κ, which measures agreement). Given sparse cell counts in the multicategory table, χReference Inohara, Akahani, Yamamoto, Hattori, Tomiyama and Tomita2 was interpreted cautiously.
CI = confidence interval; FNAC = fine-needle aspiration cytology.
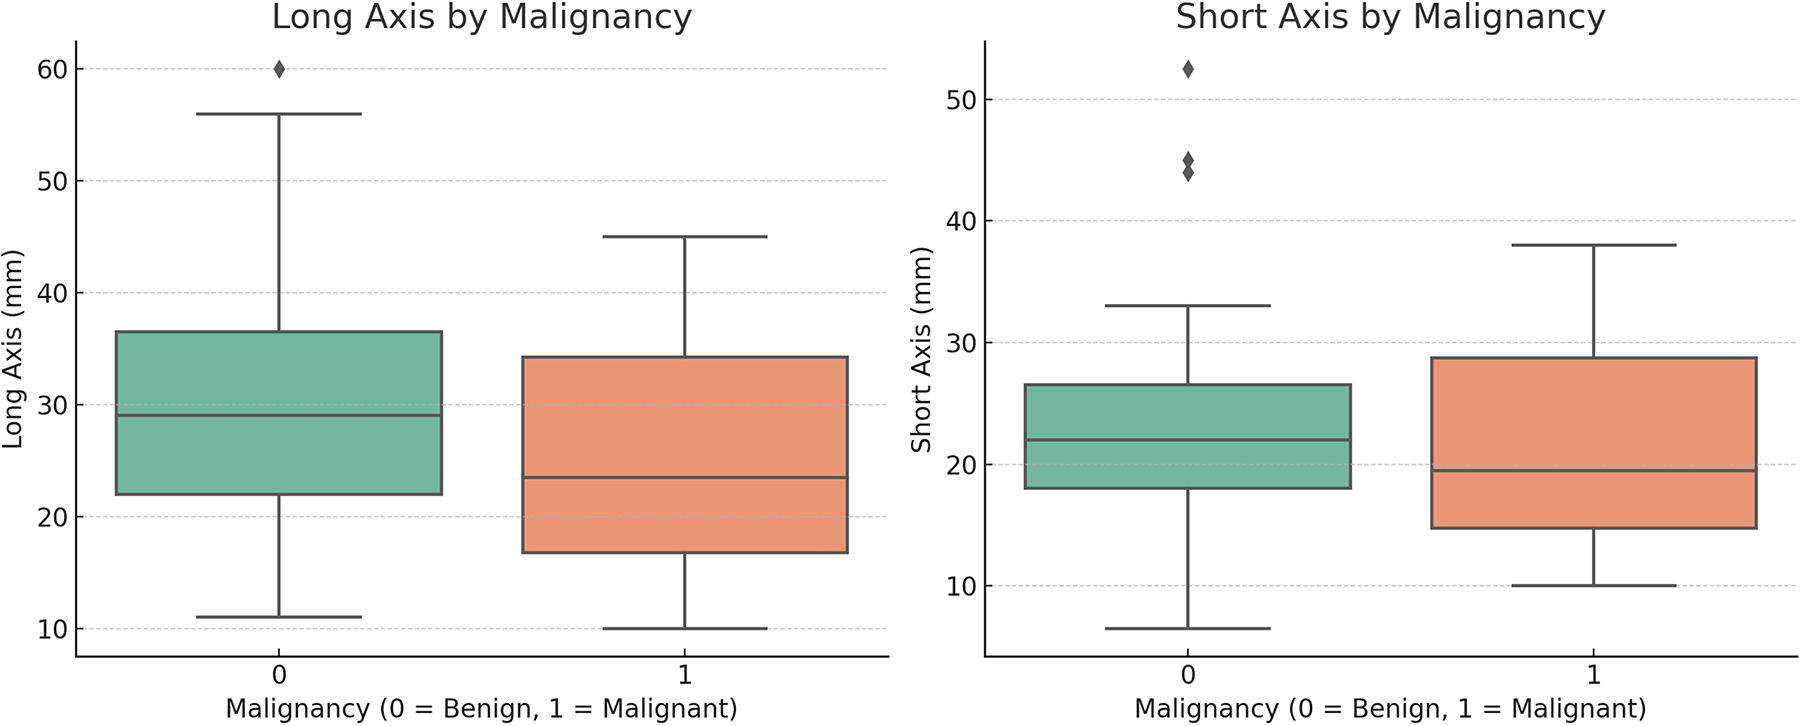
Lesion size did not differ significantly between benign and malignant parotid tumours or between PA and WT. Benign vs. malignant: median long-axis 29.0 vs. 23.5 mm (p = 0.541) and median short-axis 22.0 vs. 19.5 mm (p = 0.696; Mann–Whitney U-test). PA vs. WT: median long-axis 28.0 vs. 32.0 mm (p = 0.314) and median short-axis 21.5 vs. 23.0 mm (p = 0.345). Taken together, lesion size alone did not discriminate malignancy or histological subtype in this cohort (Fig. 3; Table 3).
Box-and-whisker plots of lesion size by malignancy status. Boxes show median and interquartile range; whiskers indicate the 1.5×IQR. Outliers are plotted individually.

Figure 3 Long description
The image shows two box-and-whisker plots. The first plot on the left compares the long axis of lesions by malignancy status, with the x-axis labeled 'Malignancy (0 = Benign, 1 = Malignant)' and the y-axis labeled 'Long Axis (mm)'. The second plot on the right compares the short axis of lesions by malignancy status, with the x-axis labeled 'Malignancy (0 = Benign, 1 = Malignant)' and the y-axis labeled 'Short Axis (mm)'. Each plot displays median, interquartile range and whiskers indicating variability outside the upper and lower quartiles. Outliers are marked individually in the short axis plot.
Comparison of lesion size between benign–malignant tumours and pleomorphic adenoma–Warthin tumour

Table 3 Long description
The table compares lesion sizes between benign and malignant tumors, and between pleomorphic adenomas and Warthin tumors. For benign tumors, the median long axis is 29.0 mm, compared to 23.5 mm for malignant tumors, with a p-value of 0.541 indicating no significant difference. The short axis median is 22.0 mm for benign and 19.5 mm for malignant tumors, with a p-value of 0.696. In the comparison between pleomorphic adenomas and Warthin tumors, the median long axis is 28.0 mm for adenomas and 32.0 mm for Warthin tumors, with a p-value of 0.314. The short axis median is 21.5 mm for adenomas and 23.0 mm for Warthin tumors, with a p-value of 0.345. These p-values suggest no statistically significant differences in lesion dimensions between the groups.
* Mann–Whitney U test.
All lesions were hyperintense on T2-weighted sequences; thus, T2 signal characteristics did not discriminate between PA and WT. T1 signal intensity and enhancement pattern were likewise not associated with histopathologic subtype (T1: p = 0.417; enhancement: p > 0.99; Fisher’s exact test). These findings suggest that neither T1 signal nor contrast enhancement alone provides a reliable distinction between the two most common benign parotid tumours. By contrast, a cystic-like appearance (Fig. 4) showed a significant association with diagnosis: it was absent in PA (0/22) but present in 46.7 per cent of WT cases (7/15), yielding a strong discriminative cue for WT (odds ratio [OR] 38.5; 95 per cent confidence interval [CI], 1.95–758.76; p = 0.001; Fisher’s exact test) (Table 4).
MRI findings of a parotid gland lesion confirmed as Warthin tumor. (a) Axial T1-weighted TSE Dixon in-phase, (b) axial T2-weighted TSE Dixon water-only, (c) coronal T2-weighted STIR, (d) axial pre-contrast T1-weighted TSE Dixon water-only, (e) axial post-contrast T1-weighted TSE Dixon water-only, and (f) sagittal T2-weighted TSE images show a well-defined lesion (arrow) within the left parotid gland. The mass appears hypointense on T1-weighted and hyperintense on T2-weighted images, with a cyst-like heterogeneous signal pattern and slight contrast enhancement following gadolinium administration. Fine-needle aspiration cytology and postoperative histopathology confirmed the diagnosis of Warthin tumor.

Figure 4 Long description
The image contains six MRI scans labeled a to f. Image a shows an axial T1-weighted TSE Dixon in-phase scan with an arrow pointing to a lesion in the left parotid gland. Image b is an axial T2-weighted TSE Dixon water-only scan, also highlighting the lesion with an arrow. Image c is a coronal T2-weighted STIR scan with an arrow indicating the lesion. Image d is an axial pre-contrast T1-weighted TSE Dixon water-only scan with an arrow pointing to the lesion. Image e is an axial post-contrast T1-weighted TSE Dixon water-only scan, again with an arrow marking the lesion. Image f is a sagittal T2-weighted TSE scan with an arrow showing the lesion's location. The lesion is consistently marked across all images, indicating its position within the left parotid gland.
Association between cystic-like appearance and histopathological diagnosis

Table 4 Long description
The table examines the relationship between cystic-like appearance and histopathological diagnosis in pleomorphic adenoma and Warthin tumour cases. Among the 22 pleomorphic adenoma cases, none exhibited a cystic-like appearance, while 7 out of 15 Warthin tumour cases did. The statistical analysis shows a significant association between the presence of cystic-like appearance and Warthin tumour, with a p-value of 0.001 and an odds ratio of 38.5, indicating a strong likelihood of this feature being present in Warthin tumours compared to pleomorphic adenomas. The confidence interval for the odds ratio is wide, ranging from 1.95 to 758.76, suggesting variability in the estimate.
* Fisher’s Exact test.
CI = confidence interval.
Firth-penalised logistic regression was used to examine associations between clinical/imaging features and the likelihood of malignancy. Covariates were age, sex, lesion dimensions (long- and short-axis diameters) and MRI enhancement. The MRI “cystic-like appearance” was analysed separately because it was observed exclusively in WTs (OR ≈ 38; p < 0.001) and in none of the malignant cases; accordingly, it was not included in the multivariable model for malignancy prediction, as it is histotype-specific and would induce quasi/complete separation. None of the examined covariates reached statistical significance (p < 0.05). Age showed no meaningful association (OR 0.95; 95 per cent CI, 0.86–1.05; p = 0.285). Male sex yielded an odds ratio above unity (OR 4.77; 95 per cent CI, 0.24–94.42), but with a wide confidence interval crossing 1 (p = 0.306). For size parameters, the long-axis diameter demonstrated an odds ratio below 1 (OR 0.88; 95 per cent CI, 0.64–1.21; p = 0.224), whereas the short-axis diameter showed an odds ratio above 1 (OR 1.24; 95 per cent CI, 0.95–1.62; p = 0.266). The presence of MRI enhancement was associated with a reduced, though non-significant, likelihood of malignancy (OR 0.13; 95 per cent CI, 0.01–3.31; p = 0.216). Overall, individual demographic or imaging features did not independently predict malignant histology in this cohort, underscoring the limited statistical power due to the small number of malignant cases (Table 5).
Firth logistic regression analysis for predicting malignancy

Table 5 Long description
The table presents a Firth logistic regression analysis assessing predictors of malignancy. The predictor 'Sex (male)' has the highest odds ratio of 4.77, but with a wide confidence interval (0.24−94.42) and a p-value of 0.306, indicating no statistical significance. Age has an odds ratio of 0.95 with a p-value of 0.285, suggesting a slight, non-significant decrease in odds with increasing age. The long axis and short axis measurements have odds ratios of 0.88 and 1.24, respectively, neither reaching statistical significance. MRI enhancement shows an odds ratio of 0.13, indicating a potential decrease in odds, but with a wide confidence interval and a p-value of 0.216, it is not statistically significant. Overall, none of the predictors show significant associations with malignancy in this analysis.
* Scaled for interpretability. Cystic-like appearance excluded (Warthin-specific).
CI = confidence interval.
Discussion
In our series, 90.5 per cent (38/42) of parotid neoplasms were benign and 9.5 per cent (4/42) were malignant. This distribution aligns with the upper range of previous reports emphasising the predominance of benign lesions.Reference Schmidt, Hall, Wilson and Layfield5–Reference Zbären, Schär, Hotz and Loosli7, Reference Tryggvason, Gailey, Hulstein, Karnell, Hoffman and Funk12 Moreover, it has been noted that the relative frequency of WT has increased over time, whereas diagnoses of PA have decreased. This trend may be attributable to an aging population and the more frequent incidental detection of lesions owing to the widespread use of imaging.Reference Tryggvason, Gailey, Hulstein, Karnell, Hoffman and Funk12, Reference Quer, Hernandez-Prera, Silver, Casasayas, Simo and Vander Poorten14
Agreement between FNAC and histopathology was poor in the multi-category classification but substantial in the binary benign–malignant grouping (κ = 0.636). This supports the view that FNAC is more reliable for diagnosing malignancy than for determining specific histopathologic subtypes.Reference Schmidt, Hall, Wilson and Layfield5–Reference Zbären, Schär, Hotz and Loosli7, Reference Tryggvason, Gailey, Hulstein, Karnell, Hoffman and Funk12, Reference Perkins, Toll and Reece13 In our series, the non-diagnostic rate was 22.5 per cent (indeterminate 18.0 per cent; insufficient 4.5 per cent), approaching the upper end of ranges reported in the literature. This may reflect heterogeneity in sampling technique or interpretive variability. Increasing the use of ultrasound-guided aspirations and standardised reporting systems such as the Milan classification may help improve diagnostic yield and reproducibility.Reference Schmidt, Hall, Wilson and Layfield5, Reference Stewart, MacKenzie, McGarry and Mowat6 In clinical practice, broader implementation of ultrasound-guided sampling could further reduce this rate. From a safety standpoint, no cases of infection, haemorrhage, facial nerve injury or tumour seeding were observed, consistent with the low complication profile of FNAC.Reference Stewart, MacKenzie, McGarry and Mowat6, Reference Zbären, Schär, Hotz and Loosli7
MRI was evaluated as a supportive modality to characterise lesion morphology and signal features. Notably, no statistically significant associations were identified between malignancy and tumour size, T1/T2 signal intensity or contrast enhancement. All lesions in this study were T2-hyperintense, including malignant cases, limiting the discriminative utility of T2-weighted imaging alone. Likewise, T1 signal and enhancement patterns failed to distinguish between PA and WT. The most reliable imaging predictor in our dataset was the presence of a cystic-like appearance on MRI, which showed a strong association with WT (p = 0.001; OR 38.5), present in 46.7 per cent of cases and absent in all PAs. This finding mirrors earlier studies emphasising the diagnostic relevance of cystic morphology in differentiating benign histotypes.Reference Takashima, Sone, Takayama, Maruyama, Hasegawa and Horii15–Reference Christe, Waldherr, Hallett, Zbaeren and Thoeny18
Recent literature has increasingly focused on multiparametric MRI approaches, particularly DWI and ADC mapping, to improve pre-operative characterisation of parotid gland tumours. In a recent study, Stoia et al. reported that multiparametric MRI may enhance diagnostic confidence in selected cases, although overlap between benign and malignant lesions remains substantial.Reference Stoia, Lenghel, Dinu, Tamaş, Bran and Băciut19 Similarly, meta-analytical data comparing core needle biopsy with FNAC suggest higher diagnostic accuracy for core biopsy, at the expense of increased invasiveness and potential complications, thereby reinforcing FNAC as a pragmatic first-line diagnostic tool in routine clinical practice.Reference Cho, Kim, Lee, Chee, Kim and Choi20 Taken together, these findings support the continued role of FNAC as the cornerstone of initial evaluation, with advanced imaging and alternative biopsy techniques reserved for selected or diagnostically challenging cases.
Lesion size alone was not a reliable discriminator between benign and malignant parotid gland tumours in our cohort. No size differences were observed between PA and WT either. In the Firth logistic regression, age, male sex, long- and short-axis diameters and contrast enhancement were not independent predictors of malignancy. The wide confidence intervals indicate limited statistical power, attributable to the small number of malignant cases.
Combined use of FNAC and MRI can increase sensitivity under an “OR” rule but at the expense of specificity, whereas an “AND” approach can increase specificity while reducing sensitivity. This rule-dependent trade-off is consistent with the findings reported by Paris, Inohara and Perkins. In our cohort, however, the combination did not confer a systematic advantage in overall accuracy or specificity.Reference Paris, Facon, Pascal, Chrestian, Moulin and Zanaret1–Reference de Ru, van Leeuwen, van Benthem, Velthuis, DMDS and Hordijk3, Reference Perkins, Toll and Reece13
These findings further underscore the importance of multidisciplinary diagnostic correlation among radiology, cytopathology and head and neck surgery in the pre-operative evaluation of parotid gland tumours. This integrated approach is particularly critical in rare or diagnostically challenging cases, where reliance on a single modality may be insufficient. Recent reviews have emphasised that close collaboration between imaging, cytological assessment and clinical judgment remains essential to ensure accurate diagnosis and optimal treatment planning in head and neck oncology.Reference Filippini, Carosi, Querzoli, Fermi, Ricciotti and Molteni21
Multivariable regression did not reveal any single MRI parameter or demographic variable (age, sex, lesion dimensions) as an independent predictor of malignancy. These results suggest that FNAC remains the cornerstone for pre-operative triage of parotid tumours, while MRI may be reserved for specific cases with diagnostic ambiguity, deep-lobe extension or suspected neurovascular involvement. Future prospective, multicentre studies with greater malignant case representation are warranted to validate these findings.
In this context, emerging artificial intelligence–based approaches, particularly radiomics, have attracted increasing attention for their potential to extract high-dimensional quantitative features from MRI beyond visual assessment. Recent systematic reviews suggest that MRI-based radiomics models may improve differentiation between benign and malignant salivary gland tumours and assist in histopathological subtype prediction. However, methodological heterogeneity, small sample sizes and limited external validation currently restrict routine clinical implementation. At present, these techniques should be regarded as complementary research tools rather than replacements for established cytological and radiological assessment pathways.Reference Mao, Wong, Zhang, So, Shan and Hung22
In our study, all cases had surgical–histopathological confirmation, and FNAC, MRI and histopathology data were matched. The main limitations were the small number of malignant cases, the retrospective design and heterogeneity in reporting terminology. The limited number of malignant cases in the present cohort inevitably reduces statistical power and restricts the generalisability of multivariable analyses. The wide confidence intervals observed in regression models reflect this limitation and underscore the risk of type II error. Nevertheless, this distribution mirrors real-world clinical practice, where benign parotid tumours predominate. Future multicentre, prospective studies with pooled malignant case series and standardised imaging and cytological protocols may overcome these constraints and allow more robust validation of predictive imaging biomarkers.
What is already known on the subject
• Fine-needle aspiration cytology (FNAC) is the standard initial diagnostic tool for parotid gland masses
• Magnetic resonance imaging (MRI) is frequently used as a complementary modality for lesion characterisation and pre-operative planning
• However, the concordance between FNAC and final histopathology shows considerable variability across studies, and the diagnostic value of MRI features remains uncertain
What this paper adds to our understanding
• FNAC demonstrated substantial accuracy for benign–malignant differentiation (κ = 0.636) but poor concordance for specific histopathological subtypes
• MRI features, such as T1/T2 signal intensity, enhancement and lesion size, were not independently predictive of malignancy
• A cystic-like appearance on MRI was strongly associated with Warthin tumour (p = 0.001; odds ratio = 38.5)
• These findings reinforce FNAC as the cornerstone of initial diagnostic evaluation, while supporting a more selective role for MRI focused on surgical planning and diagnostically challenging cases
Conclusion
Our findings support the use of FNAC as the cornerstone for pre-operative evaluation of parotid masses, with MRI serving as a targeted tool for surgical planning and selected diagnostic questions. A cystic-like morphology provides a strong clue in favour of WT. Given the uncertainties imposed by the small number of malignant cases, these results should be validated in larger, standardised cohorts.
From a practical clinical perspective, these results reaffirm FNAC as the first-line diagnostic tool in the routine pre-operative evaluation of parotid masses, even in the era of advanced imaging techniques.
Availability of data and materials
All images are obtained from PACS archives in anonymised format.
Funding
This research did not receive any specific grant from funding agencies in the public, commercial or not-for-profit sectors.
Competing interests
The authors declare not to have any conflicts of interest that may be considered to influence directly or indirectly the content of the manuscript.
Ethical approval
Batman Training and Research Hospital, Turkey, Non-invasive Investigation Ethics Committee approved this study (date: 23.03.2021, number: 271). Diagnosis methods were performed according to the approved guidelines. All patients gave written informed consent. All procedures in the study were performed on human participants in accordance with national research committee standards and ethical guidelines for the 1964 Helsinki Declaration and later amendments.
Author contributions
Asst. Prof. Pınar ATABEY contributed to the conceptualisation of the study. Asst. Prof. Şeref Barbaros Arık evaluated the imaging, collected patient data, conducted all measurements and statistical analyses. Asst. Prof Pınar ATABEY prepared the final draft of the manuscript. All authors reviewed the manuscript critically for important intellectual content and approved the final version for publication. All authors agree to be accountable for all aspects of the work.
Artificial intelligence involvement
The authors affirm that artificial intelligence tools generated no part of this manuscript or its data. Limited assistance was used for translation review only.


 Open access