


The Kraepelinian dichotomy of schizophrenia and bipolar disorder has been controversial since it was introduced over a century ago (Reference KraepelinKraepelin, 1899). There are no pathognomonic symptoms by which clinicians can reliably differentiate the two illnesses and there is increasing evidence that those with the two diagnoses may share some of the same genetic and environmental risk factors and neurobiological abnormalities (Reference Walker, Curtis and MurrayWalker et al, 2002). Schizophrenia is associated with a range of subtle abnormalities of brain volume identified using both hypothesis-driven region-of-interest and exploratory computational morphometry techniques. These include enlarged lateral and third ventricles and reduced prefrontal, temporal, thalamic and insular volumes (Reference Wright, Rabe-Hesketh and WoodruffWright et al, 2000; Reference Hulshoff Pol, Schnack and MandlHulshoff Pol et al, 2001; Reference Sigmundsson, Suckling and MaierSigmundsson et al, 2001). Brain structural abnormalities associated with bipolar disorder have been less extensively investigated, but may include lateral ventricular enlargement, an excess of white matter hyperintensities and volume reduction in some prefrontal regions (Reference Bearden, Hoffman and CannonBearden et al, 2001). Studies comparing brain volumetric deficits in individuals with schizophrenia and bipolar disorder against each other or the same control group are infrequent, inconclusive and confined to region-of-interest methodologies. In the present study we used computational morphometry to identify grey and white matter volume abnormalities throughout the entire brain in individuals with schizophrenia and those with bipolar I disorder who had experienced psychotic symptoms during exacerbation of illness. We hypothesised that both groups would demonstrate brain structural abnormalities compared with the same group of healthy volunteers. The similarities and differences in the pattern of abnormality were further clarified by a direct comparison between the two patient groups.
METHOD
Sample
Brain scans were successfully obtained by magnetic resonance imaging (MRI) from 114 individuals, comprising 25 with schizophrenia, 37 with bipolar I disorder and 52 healthy volunteers. Those with bipolar I disorder had experienced psychotic symptoms at some stage during exacerbation of illness. These participants were part of a larger study of families with more than one member with schizophrenia or bipolar disorder that included their unaffected first-degree relatives (Reference McDonald, Bullmore and ShamMcDonald et al, 2004). No unaffected relatives were included in the present study. We recruited patients through voluntary support groups or by direct referral from their mental health services; all had at least one other family member among their first- and/or second-degree relatives with the same or a related disorder. All patients were out-patients at the time of assessment. Healthy volunteers were recruited from the community via newspaper advertisements and from local staff, and were group matched to the patients and their unaffected relatives on the basis of age, gender and parental social class. None of the healthy volunteers had a personal history of any psychotic, bipolar or schizophrenia-spectrum disorder or a known family history of any functional psychosis. Participants were not included if they had a history of organic brain disease, head trauma resulting in loss of consciousness for more than 5 min or met DSM–IV criteria (American Psychiatric Association, 1994) for substance or alcohol dependence in the 12 months prior to assessment. The study protocol was approved by the ethics (research) committee of the South London and Maudsley NHS Trust. After a complete description of the study and its aims, informed consent was obtained in writing from all participants.
Patients and healthy volunteers were assessed using the same clinical scales. Structured diagnostic interviews were performed using the Schedule for Affective Disorders and Schizophrenia – Lifetime Version (SADS–L) (Reference Spitzer and EndicottSpitzer & Endicott, 1978) and additional information regarding the timing and nature of psychopathology was collected to enable DSM–IV diagnoses to be made. Socio-economic status based on details of parental occupation at birth was derived from the Office of Population Censuses and Surveys Standard Occupational Classification (Office of Population Censuses and Surveys, 1991).
Acquisition and pre-processing of magnetic resonance imaging data
For each participant a set of 1.5 mm thick contiguous coronal T 1-weighted magnetic resonance images encompassing the whole brain was acquired using a three-dimensional spoiled gradient recall echo sequence running on a GE N/Vi Signa System scanner (General Electric, Milwaukee, Wisconsin, USA) operating at 1.5 T with the following parameters: time to repetition=13.1 ms, inversion time=450 ms, echo time=5.8 ms, number of excitations=1, flip angle=20° and acquisition matrix= 256×256×128.
Optimised voxel-based morphometry (Reference Good, Johnsrude and AshburnerGood et al, 2001) was used to segment MRI data and to record probabilistic maps of grey matter and white matter volume density for each participant in a standard anatomical space. These pre-processing steps were implemented in Matlab version 6.0 (MathWorks, Natick, Massachusetts, USA) using SPM99 statistical parametric mapping software (Wellcome Department of Imaging Neuroscience, 2003). Each MRI scan was segmented into grey, white and cerebrospinal fluid (CSF) tissue classes in native space, and global tissue volumes were estimated. This and each other segmentation step used a modified mixture model cluster analysis technique with correction for non-uniformity of image intensity, combined with prior probabilistic knowledge of the spatial distribution of tissues, and included an automated procedure to remove non-brain tissue such as skull, scalp and venous sinus (Reference Good, Johnsrude and AshburnerGood et al, 2001). Customised study-specific grey, white and CSF template images in standard stereotactic space were then created from the control group, in order to minimise any scanner-specific bias and provide a template matched to the sample. The tissue maps of controls were smoothed using an 8 mm full-width at half-maximum (FWHM) isotropic Gaussian kernel and then spatially normalised using parameters derived from applying a 12-parameter affine transformation of each unsmoothed grey matter map to the standard SPM T 1 grey matter template and applying these to the smoothed segmented images. The images were then averaged to create customised grey, white and CSF tissue templates in standard stereotactic space. The original brain scan of each participant was then normalised to the customised grey matter template, thus removing any contribution of non-brain tissue or other tissue types to this spatial normalisation step. The spatial normalisation used residual sum of squared differences to match images and both an affine transformation and linear combination of smooth cosine basis functions to model global non-linear shape differences. These normalisation parameters were applied back onto the original brain image to produce an image ‘optimally’ normalised for grey matter segmentation and the images were resliced at a final voxel size of 1.5 mm3. All images were checked visually to confirm that they were well matched to the template. The images were then resegmented, using the customised tissue templates as probability maps, and the grey matter maps retained. These grey matter maps were thus in standard stereotactic (Talairach) space. This procedure was repeated using parameters derived from normalising each white matter map to the white matter template and reapplying to the original image, in order to derive white matter tissue maps for each participant. The grey and white matter images were then modulated through multiplying voxel values by the Jacobian determinants from the spatial normalisation to correct for volume changes introduced at this step (Reference Ashburner and FristonAshburner & Friston, 2000; Reference Good, Johnsrude and AshburnerGood et al, 2001). Finally, all normalised, segmented, modulated grey and white matter tissue maps were smoothed at 4 mm using a FWHM isotropic Gaussian kernel.
Statistical analysis of MRI data
Differences in grey matter and white matter volume between each patient group and the healthy volunteer group, and differences between the two patient groups, were estimated by fitting an analysis of covariance (ANCOVA) model at each intracerebral voxel in standard space, with age, gender and global tissue volume as covariates. We tested the null hypothesis by permutation at the level of spatially contiguous voxel clusters, as described in detail elsewhere (Reference Bullmore, Suckling and OvermeyerBullmore et al, 1999). Briefly, a map of the standardised ANCOVA model coefficient of interest (β) at each voxel was thresholded such that if β>1.96 (approximately, null probability of β<0.05) the voxel value was set to β -1.96, otherwise the voxel value was set to 0. This procedure generated a set of suprathreshold voxel clusters in three dimensions, each described by its ‘mass’ or the sum of suprathreshold voxel statistics it comprised. The mass of each cluster was tested against a null distribution ascertained by repeatedly re-estimating and thresholding the β coefficient of the ANCOVA model at each voxel after repeated random permutations of group membership; the results of ten permutations at each voxel were pooled over all intracerebral voxels to sample the permutation distribution of three-dimensional cluster mass under the null hypothesis of no differences in brain structure between the two groups. A critical value for statistical significance of cluster mass was derived from this permutation distribution. For each between-group comparison, we used probability thresholds for cluster level testing such that the expected number of false-positive tests for each map was less than one; typically one-tailed cluster-wise P<0.01. Significant clusters were anatomically labelled using the standard atlas of Talairach and Tournoux (Reference Talairach and TournouxTalairach & Tournoux, 1988). The principal advantages of cluster-level testing are that it confers greater sensitivity by incorporating information from more than one voxel in the test statistic, and it also substantially reduces the search volume or number of tests required for a whole brain analysis, thereby mitigating the multiple comparisons problem. Parametric tests for spatial extent statistics in brain mapping may be over-conservative; hence our preferred use of a relatively assumption-free non-parametric permutation test based on data resampling (Reference Bullmore, Suckling and OvermeyerBullmore et al, 1999; Reference Hayasaka and NicholsHayasaka & Nichols, 2003).
The mass of each cluster for each individual was transferred to a spreadsheet and, where multiple clusters were present, principal components analysis without rotation was used to explore the extent of correlation between discrete clusters and to reduce the dimensionality of the data prior to further analyses. Multiple linear regression with principal components scores as the dependent variable, and age, gender and global tissue volume as covariates, was used to test for a pathoplastic effect of gender on case–control differences in brain structure. The two-tailed probability threshold for significance was set at P=0.05.
RESULTS
Sample characteristics
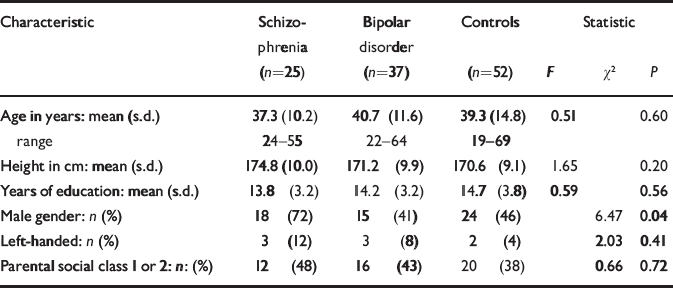
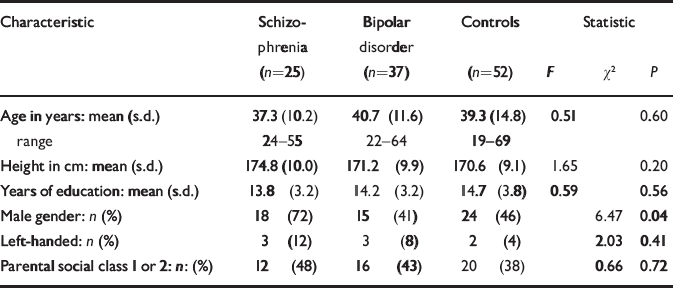
The socio-demographic profile of the participants is summarised in Table 1. There were no significant differences between the groups in age, years of education, proportion of subjects with higher parental social class or left-handedness. There was a significant gender difference between the groups because of a larger proportion of males in the schizophrenia group. The mean age at onset of first psychotic symptoms was 20.0 years (s.d.=5.0) for those with schizophrenia and the mean age at onset of first episode of affective disorder was 22.9 years (s.d.=5.5) for those with bipolar disorder. The mean duration of illness was 17.4 years (s.d.=10.4) for schizophrenia and 17.8 years (s.d.=11.3) for bipolar disorder. Of those with schizophrenia, 18 were taking atypical anti-psychotic drugs at the time of scanning and the remaining seven were taking typical antipsychotics. Of those with bipolar disorder, 31 were taking mood stabilisers at the time of scanning (lithium carbonate in 22 cases), 1 was taking olanzapine alone and 5 were on no medication; 8 of those on mood stabilisers were also taking antipsychotic medication.
Demographic characteristics of those with schizophrenia, those with bipolar disorder and controls
| Characteristic | Schizophrenia (n=25) | Bipolar disorder (n=37) | Controls (n=52) | Statistic | ||
|---|---|---|---|---|---|---|
| F | χ2 | P | ||||
| Age in years: mean (s.d.) | 37.3 (10.2) | 40.7 (11.6) | 39.3 (14.8) | 0.51 | 0.60 | |
| range | 24-55 | 22-64 | 19-69 | |||
| Height in cm: mean (s.d.) | 174.8 (10.0) | 171.2 (9.9) | 170.6 (9.1) | 1.65 | 0.20 | |
| Years of education: mean (s.d.) | 13.8 (3.2) | 14.2 (3.2) | 14.7 (3.8) | 0.59 | 0.56 | |
| Male gender: n (%) | 18 (72) | 15 (41) | 24 (46) | 6.47 | 0.04 | |
| Left-handed: n (%) | 3 (12) | 3 (8) | 2 (4) | 2.03 | 0.41 | |
| Parental social class 1 or 2: n: (%) | 12 (48) | 16 (43) | 20 (38) | 0.66 | 0.72 | |
Grey matter differences between those with schizophrenia and healthy volunteers
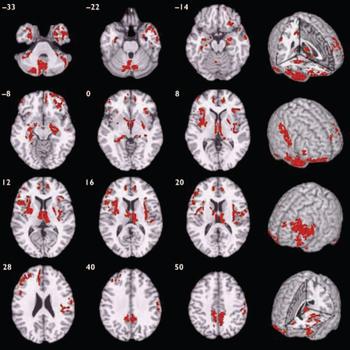
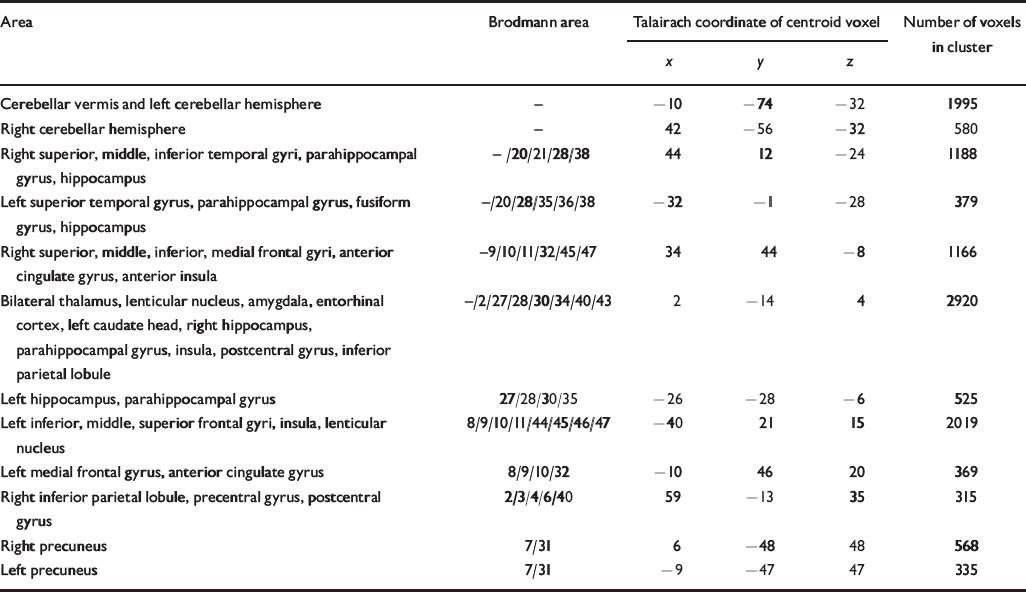
Compared with healthy volunteers, those with schizophrenia had spatially distributed regions of grey matter volume deficit in 12 three-dimensional voxel clusters (Fig. 1, Table 2). These deficits were predominantly bilateral and included the hemispheres and vermis of the cerebellum, orbitofrontal cortex and temporal pole (more prominently on the right) extending to the lateral temporal cortex, anterior cingulate gyrus, basal ganglia, thalamus, medial temporal lobe, insula, dorsolateral prefrontal cortex (more prominently on the left), right postcentral gyrus and inferior parietal lobule, and the precuneus. Principal components analysis showed that deficits were highly correlated between regions. All clusters of grey matter volume deficit loaded positively on the first principal component, which explained 74% of the total variance. Schizophrenia was strongly associated with reduced scores on this first component (B=-1.07, P<0.001, 95% CI -1.49 to -0.66) and there was no significant interaction between diagnostic group and gender (B=0.27, P=0.55, 95% CI -0.61 to 1.14), indicating that this pattern of grey matter deficit was not differentially expressed by males and females with schizophrenia. There were no significant regions of relative grey matter excess in those with schizophrenia compared with healthy volunteers.
Map of grey matter volume deficits when comparing individuals with schizophrenia with healthy volunteers, superimposed onto a single brain in standard stereotactic space. The brain slices are oriented in the plane of the Talairach atlas; distance (mm) above or below the intercommissural line is inset in the upper left corner of each slice; the right side of the brain is depicted by the right side of each slice. Cluster-wise probability of false-positive activation P=0.003; expected number of false-positive tests <1 over the whole map.
Talairach coordinates and Brodmann areas for regions of grey matter volume deficit in participants with schizophrenia (n=25) compared with healthy volunteers (n=52)
| Area | Brodmann area | Talairach coordinate of centroid voxel | Number of voxels in cluster | ||
|---|---|---|---|---|---|
| x | y | z | |||
| Cerebellar vermis and left cerebellar hemisphere | - | -10 | -74 | -32 | 1995 |
| Right cerebellar hemisphere | - | 42 | -56 | -32 | 580 |
| Right superior, middle, inferior temporal gyri, parahippocampal gyrus, hippocampus | -/20/21/28/38 | 44 | 12 | -24 | 1188 |
| Left superior temporal gyrus, parahippocampal gyrus, fusiform gyrus, hippocampus | -/20/28/35/36/38 | -32 | -1 | -28 | 379 |
| Right superior, middle, inferior, medial frontal gyri, anterior cingulate gyrus, anterior insula | -9/10/11/32/45/47 | 34 | 44 | -8 | 1166 |
| Bilateral thalamus, lenticular nucleus, amygdala, entorhinal cortex, left caudate head, right hippocampus, parahippocampal gyrus, insula, postcentral gyrus, inferior parietal lobule | -/2/27/28/30/34/40/43 | 2 | -14 | 4 | 2920 |
| Left hippocampus, parahippocampal gyrus | 27/28/30/35 | -26 | -28 | -6 | 525 |
| Left inferior, middle, superior frontal gyri, insula, lenticular nucleus | 8/9/10/11/44/45/46/47 | -40 | 21 | 15 | 2019 |
| Left medial frontal gyrus, anterior cingulate gyrus | 8/9/10/32 | -10 | 46 | 20 | 369 |
| Right inferior parietal lobule, precentral gyrus, postcentral gyrus | 2/3/4/6/40 | 59 | -13 | 35 | 315 |
| Right precuneus | 7/31 | 6 | -48 | 48 | 568 |
| Left precuneus | 7/31 | -9 | -47 | 47 | 335 |
Grey matter differences between those with bipolar disorder and healthy volunteers
Compared with healthy volunteers, those with bipolar disorder demonstrated no significant abnormalities (neither deficits nor excesses) of grey matter structure.
Grey matter differences between those with bipolar disorder and schizophrenia
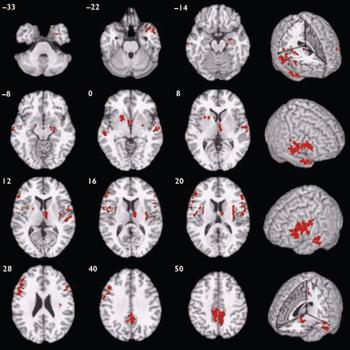
Participants with schizophrenia also demonstrated a distributed pattern of grey matter deficit when compared with those with bipolar disorder rather than with healthy volunteers (Fig. 2, Table 3). These deficits were located in several of the regions identified as abnormal in the case–control comparison for schizophrenia, including bilateral superior temporal neocortex, basal ganglia, insula, prefrontal cortex and precuneus, and right medial temporal lobe and thalamus. There were no regions of significant grey matter excess in those with schizophrenia compared with those with bipolar disorder.
Map of grey matter volume deficits when comparing participants with schizphrenia with those with bipolar disorder, superimposed onto a single brain in standard stereotactic space. The brain slices are oriented in the plane of the Talairach atlas; distance (mm) above or below the intercommissural line is inset in the upper left corner of each slice; the right side of the brain is depicted by the right side of each slice. Cluster-wise probability of false-positive activation P=0.002; expected number of false-positive tests <1 over the whole map.
Talairach coordinates and Brodmann areas for regions of grey matter volume deficit in participants with schizophrenia (n=25) compared with those with bipolar disorder (n=37)

| Area | Brodmann area | Talairach coordinate of centroid voxel | Number of voxels in cluster | ||
|---|---|---|---|---|---|
| x | y | z | |||
| Right superior, middle, temporal gyri, amygdala, hippocampus, parahippocampal gyrus, right putamen | -/21/27/28/34/38 | 31 | 1 | -19 | 439 |
| Left middle, superior temporal gyri | 21/22 | -58 | -17 | -6 | 280 |
| Left lenticular nucleus, bilateral caudate nucleus, right thalamus | - | -7 | 1 | 3 | 577 |
| Right middle, superior temporal gyri | 21/22/42 | 56 | -14 | 4 | 299 |
| Left inferior, middle frontal gyri, insula, precentral gyrus | 4/6/9/44/45/46 | -50 | 12 | 25 | 955 |
| Right inferior frontal gyrus, insula, precentral gyrus, postcentral gyrus | 6/22/43/44 | 35 | 6 | 16 | 415 |
| Right inferior, middle frontal gyri | 9/44/45/46 | 56 | 7 | 20 | 201 |
| Bilateral precuneus | 7/31 | 1 | -42 | 47 | 938 |
White matter differences between those with schizophrenia and healthy volunteers
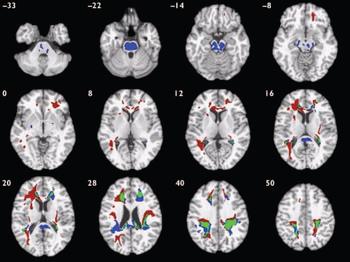
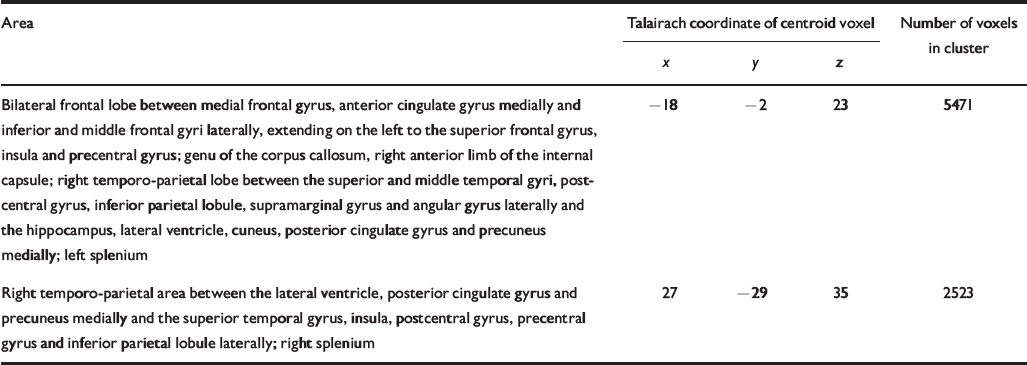
Compared with healthy volunteers, those with schizophrenia had deficits of white matter volume in two spatially extensive three-dimensional voxel clusters (Fig. 3, Table 4). These included parts of prefrontal, temporal and parietal lobes normally occupied by the long white matter tracts of the superior longitudinal fasciculus and occipitofrontal fasciculus bilaterally and the left inferior longitudinal fasciculus, as well as anterior and posterior parts of the corpus callosum. White matter volumes were highly correlated between clusters (r=0.90, P<0.001); mean cluster volume was therefore used to examine gender interactions. Those with schizophrenia had significantly reduced mean white matter volumes compared with controls (B=-1.59, P<0.001, 95% CI -2.46 to -0.72) and there was no significant interaction between diagnostic group and gender (B=0.64, P=0.49, 95% CI -1.18 to 2.46).
Map of white matter volume deficits when comparing participants with schizophrenia with healthy volunteers (red voxels) and those with bipolar disorder with healthy volunteers (blue voxels), superimposed onto a single brain in standard stereotactic space. Green voxels indicate overlapping regions. The brain slices are oriented in the plane of the Talairach atlas; distance (mm) above or below the intercommissural line is inset in the upper left corner of each slice; the right side of the brain is depicted by the right side of each slice. Clusterwise probability of false-positive activation P=0.011 for schizophrenia v. healthy volunteers and P=0.008 for bipolar disorder v. healthy volunteers; expected number of false-positive tests 51 for each analysis.
Talairach coordinates and Brodmann areas for regions of white matter volume deficit in participants with schizophrenia (n=25) compared with healthy volunteers (n=52)
| Area | Talairach coordinate of centroid voxel | Number of voxels in cluster | ||
|---|---|---|---|---|
| x | y | z | ||
| Bilateral frontal lobe between medial frontal gyrus, anterior cingulate gyrus medially and inferior and middle frontal gyri laterally, extending on the left to the superior frontal gyrus, insula and precentral gyrus; genu of the corpus callosum, right anterior limb of the internal capsule; right temporo-parietal lobe between the superior and middle temporal gyri, postcentral gyrus, inferior parietal lobule, supramarginal gyrus and angular gyrus laterally and the hippocampus, lateral ventricle, cuneus, posterior cingulate gyrus and precuneus medially; left splenium | -18 | -2 | 23 | 5471 |
| Right temporo-parietal area between the lateral ventricle, posterior cingulate gyrus and precuneus medially and the superior temporal gyrus, insula, postcentral gyrus, precentral gyrus and inferior parietal lobule laterally; right splenium | 27 | -29 | 35 | 2523 |
White matter differences between those with bipolar disorder and healthy volunteers
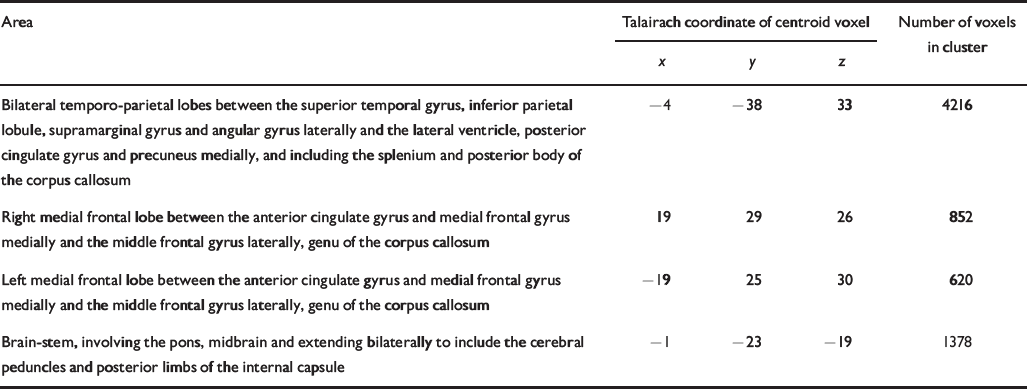
Compared with healthy volunteers, those with bipolar disorder had distributed regional deficits of white matter in four voxel clusters (Fig. 3, Table 5). These included parts of the brain-stem, prefrontal, temporal and parietal lobes normally occupied by the long white matter tracts of the superior longitudinal fasciculus and occipitofrontal fasciculus bilaterally, as well as anterior and posterior parts of the corpus callosum. All regions of white matter volume deficit loaded positively on the first principal component, which explained 72.4% of the total variance. Bipolar disorder was strongly associated with reduced scores on the first component (B=-0.79, P<0.001, 95% CI -1.19 to -0.39) and there was no significant interaction between diagnostic group and gender (B=-0.37, P=0.37, 95% CI -1.18 to 0.44).
Talairach coordinates and Brodmann areas for regions of white matter volume deficit in participants with bipolar disorder (n=37) compared with healthy volunteers (n=52)
| Area | Talairach coordinate of centroid voxel | Number of voxels in cluster | ||
|---|---|---|---|---|
| x | y | z | ||
| Bilateral temporo-parietal lobes between the superior temporal gyrus, inferior parietal lobule, supramarginal gyrus and angular gyrus laterally and the lateral ventricle, posterior cingulate gyrus and precuneus medially, and including the splenium and posterior body of the corpus callosum | -4 | -38 | 33 | 4216 |
| Right medial frontal lobe between the anterior cingulate gyrus and medial frontal gyrus medially and the middle frontal gyrus laterally, genu of the corpus callosum | 19 | 29 | 26 | 852 |
| Left medial frontal lobe between the anterior cingulate gyrus and medial frontal gyrus medially and the middle frontal gyrus laterally, genu of the corpus callosum | -19 | 25 | 30 | 620 |
| Brain-stem, involving the pons, midbrain and extending bilaterally to include the cerebral peduncles and posterior limbs of the internal capsule | -1 | -23 | -19 | 1378 |
White matter differences between those with bipolar disorder and schizophrenia
Notably, in both patient groups compared with healthy volunteers, there were extensive areas of white matter abnormality in anatomically coincident regions of bilateral frontal and temporo-parietal cortex (Fig. 3). Hence, the anatomical profile of white matter deficit was much more consistent between types of psychosis than the profile of grey matter deficit, which was highly specific to schizophrenia. We found no evidence for a significant difference in white matter structure between those with schizophrenia and those with bipolar disorder.
DISCUSSION
Grey matter differences
This study provides evidence that schizophrenia and bipolar disorder are characterised by quite distinctive abnormalities of brain structure in cortical and subcortical grey matter, and thus appear relatively discrete from this neurobiological perspective. Schizophrenia was associated with extensively distributed grey matter deficits involving the fronto-temporal neocortex, medial temporal lobe, insula and medial thalamic regions, all of which have been consistently reported to display volume deficits in prior region of interest and computational morphometric neuroimaging studies of schizophrenia (Reference Wright, Rabe-Hesketh and WoodruffWright et al, 2000; Reference Hulshoff Pol, Schnack and MandlHulshoff Pol et al, 2001; Reference Sigmundsson, Suckling and MaierSigmundsson et al, 2001). Other areas of volume deficit identified in the present study have also been described previously, including parts of the cerebellum (Reference Nopoulos, Ceilley and GailisNopoulos et al, 1999), right inferior parietal lobule (Reference Kubicki, Shenton and SalisburyKubicki et al, 2002) and precuneus (Reference Hulshoff Pol, Schnack and MandlHulshoff Pol et al, 2001).
The presence of grey matter deficit in prefrontal regions, thalamus and cerebellum provided the basis for the concept of ‘cognitive dysmetria’ in schizophrenia (Reference Andreasen, Paradiso and O'LearyAndreasen et al, 1998), i.e. the hypothesis that distributed pathology throughout key information processing nodes underlies the deficits in integrating and coordinating information associated with schizophrenia. We also found volume deficit of the basal ganglia in those with schizophrenia compared with healthy volunteers; this is at variance with several other studies which have reported increased basal ganglia volume. The basal ganglia is rich in dopaminergic input, and increased volume in patients with schizophrenia has usually been attributed to conventional or typical anti-psychotic drugs, which potently block dopamine D2 receptors; thus, basal ganglia volume increase has not been found in patients who have had minimal exposure to typical antipsychotics or purely atypical antipsychotic drug treatment (Reference Lang, Kopala and VandorpeLang et al, 2001). In this context, we note that the majority of those with schizophrenia in our sample (18 out of 25) were taking atypical antipsychotic drugs; this may have disclosed disease-related reductions in basal ganglia volume that could be obscured by the volume-increasing effects of typical antipsychotics.
In sharp contrast to those with schizophrenia, grey matter volume was relatively well preserved (statistically indistinguishable from normal) in those with bipolar disorder, despite the fact that they were chosen to be closely akin to those with schizophrenia in terms of severity of illness and experience of positive psychotic symptoms. Brain structural changes in bipolar disorder are arguably under-researched, although some groups have reported volumetric abnormality within grey matter structures, such as enlargement of the amygdala (Reference Altshuler, Bartzokis and GriederAltshuler et al, 2000) and reduction of the subgenual cingulate gyrus (Reference Drevets, Price and SimpsonDrevets et al, 1997); these were not found in the present study. Variable sample size and heterogeneity may account for some of these discrepancies. Structural neuroimaging studies of bipolar disorder have often been conducted using broad diagnostic categories such as ‘affective disorder’ or ‘affective psychosis’ which encompass a heterogeneous sample of patients. Since brain structural abnormalities in unipolar depression may differ from those in bipolar disorder (e.g. hippocampal volume is reportedly reduced in unipolar depression (Reference Frodl, Meisenzahl and ZetzscheFrodl et al, 2002) but preserved in bipolar disorder (Reference Altshuler, Bartzokis and GriederAltshuler et al, 2000)), it is arguable that adoption of broad diagnostic categories may have obscured brain structural differences specifically related to bipolar disorder. The possibility that medication could reverse or prevent grey matter volume deficit in bipolar disorder also cannot be excluded. Most of our patients were taking lithium, which is neurotrophic and has been reported to increase grey matter volume in vivo (Reference Moore, Bebchuk and WildsMoore et al, 2000).
To the best of our knowledge, no prior neuroimaging study has specifically compared individuals with familial bipolar I disorder and a history of psychotic symptoms with those with schizophrenia. When compared directly in this way, individuals with schizophrenia demonstrated distributed regions of grey matter volume deficit which involved most of the regions identified in the comparison of those with schizophrenia and healthy volunteers, namely bilateral fronto-temporal cortex, insula, basal ganglia, precuneus and right medial temporal lobe and thalamus. These findings further emphasise the specificity to schizophrenia of regional grey matter volume deficits in these areas. Previous studies that compared individuals with schizophrenia and bipolar disorder (or ‘affective psychosis’) either with each other or with the same control group have reported conflicting findings. Some found that grey matter or medial temporal lobe volume deficit was specific to schizophrenia (Reference Harvey, Persaud and RonHarvey et al, 1994; Reference Pearlson, Barta and PowersPearlson et al, 1997; Reference Zipursky, Seeman and BuryZipursky et al, 1997; Reference Altshuler, Bartzokis and GriederAltshuler et al, 2000; Reference Hirayasu, Tanaka and ShentonHirayasu et al, 2001), whereas others found evidence for deficit in both disorders (Reference Friedman, Findling and KennyFriedman et al, 1999; Reference Lim, Rosenbloom and FaustmanLim et al, 1999; Reference Velakoulis, Pantelis and McGorryVelakoulis et al, 1999). A recent study reports that insular cortex reduction is specific to schizophrenia, whereas both schizophrenia and affective psychosis share volume reduction of the left temporal pole (Reference Kasai, Shenton and SalisburyKasai et al, 2003). However, there are multiple methodological differences between these studies conducted over the course of a decade, including changes in scanner technology and data analysis as well as variation in sample size and diagnostic inclusion criteria. In a previous voxel-based morphometry study of individuals with a first episode of psychosis, Kubicki et al (Reference Kubicki, Shenton and Salisbury2002) found distributed regional grey matter deficit in schizophrenia but not in affective psychosis, which is consistent with the present study (although a subsequent analysis confined to limited areas revealed mild volume reduction in the insula among patients with affective psychosis).
Our study has provided clear evidence for greater salience of grey matter abnormalities in those with schizophrenia compared with matched individuals with bipolar disorder, suggesting that schizophrenia may generally be associated with more severe and extensive disorganisation of cortical and subcortical grey matter. Our ‘negative’ finding, that there is no significant grey matter abnormality in those with bipolar disorder, should probably be evaluated more cautiously in the light of the moderate sample size and the necessarily conservative nature of multiple hypothesis testing entailed by whole brain morphometry.
White matter differences
There was evidence for white matter abnormalities in both patient groups; moreover, there was a striking degree of anatomical coincidence in the distribution of white matter deficits in schizophrenia and bipolar disorder. In both groups of individuals with psychotic disorder, white matter volume was significantly reduced in the frontal and temporo-parietal territory of major longitudinal tracts and in the corpus callosum.
Reduction of regional white matter volume has been less comprehensively studied than grey matter in schizophrenia, partly because methods for morphometric subdivision of white matter have only recently been developed. Earlier studies focused on area or shape measurements of the corpus callosum and most found reduced callosal area of distorted shape (Reference Woodruff, McManus and DavidWoodruff et al, 1995).
There have also been neuroradiological reports of qualitatively diagnosed white matter hyperintensities in schizophrenia, especially among elderly subjects with late onset of psychotic symptoms (Reference Davis, Stewart and FriedmanDavis et al, 2003). More recently studies using computational morphometry have identified regional white matter volume deficit in schizophrenia within fronto-temporal and parietal regions and anterior corpus callosum (Reference Sigmundsson, Suckling and MaierSigmundsson et al, 2001; Reference Spalletta, Tomaiuolo and MarinoSpalletta et al, 2003). This evidence is in accordance with that from magnetic transfer imaging and diffusion transfer imaging, which have identified white matter abnormalities in those with schizophrenia compared with controls, predominantly involving fronto-temporal regions; this is also in accordance with evidence from neurocytochemistry, neuropathology and gene expression studies implicating white matter dysfunction in schizophrenia (Reference Davis, Stewart and FriedmanDavis et al, 2003).
In bipolar disorder, increased rates of hyperintense white matter lesions in subcortical and periventricular regions are among the most consistently reported anatomical abnormalities (Reference Bearden, Hoffman and CannonBearden et al, 2001) but regional morphometry of white matter has rarely been studied. A recent twin study reported reduced white matter volume in frontal regions bilaterally in those with bipolar disorder, which is consistent with the present study (Reference Kieseppa, van Erp and HaukkaKieseppa et al, 2003); another study found no white matter volume change in prefrontal subregions (Reference Lopez-Larson, DelBello and ZimmermanLopez-Larson et al, 2002).
Our finding that schizophrenia and bipolar disorder are both characterised by white matter volume deficit in frontal and parietal regions is in accordance with the hypothesis that both major types of psychosis represent a disorder of anatomical connectivity between components of large-scale neurocognitive networks (Reference Bullmore, Frangou and MurrayBullmore et al, 1997; Reference Wright, Sharma and EllisonWright et al, 1999). It is also in accordance with recent evidence from gene expression profiling studies of frontal cortical tissue, which have identified specific downregulation of genes related to myelination and oligodendrocyte function in both schizophrenia and bipolar disorder (Reference Hakak, Walker and LiHakak et al, 2001; Reference Tkachev, Mimmack and RyanTkachev et al, 2003). Ultrastructural abnormalities and reduced density of oligodendroglial cells in the prefrontal cortex have also been reported in both disorders (Uranova et al, Reference Uranova, Orlovskaya and Vikhreva2001, Reference Uranova, Vostrikov and Orlovskaya2004).
Methodological issues
Strengths of this study include the moderately large numbers of carefully characterised participants who were selected to optimise the clinical homogeneity of the groups with psychotic disorder and to ensure that the comparison between groups was reasonably well controlled for illness duration and severity. The same group of healthy volunteers was used for both case–control comparisons and was well matched for key socio-demographic variables to both patient groups. We used contemporary computational tools for fully automated whole-brain morphometric analysis and non-parametric hypothesis testing, sourcing and combining relevant software from different laboratories to construct a customised image-processing ‘pipeline’.
The study also had a number of limitations besides the general issue of type 2 error already discussed. In common with many previous studies, the bipolar and schizophrenia groups were not well matched for gender, owing to an excess of males within the schizophrenia group. However, gender was included as a covariate in all case–control and case–case comparisons, and there was no evidence for a significant interaction between gender and diagnostic group, implying that there was no major modulatory effect of gender on volumetric deficits due to disorder. Both groups of patients were recruited on the basis of having other family members with a similar illness. It is therefore possible that the results of this study may not be generally applicable to those with non-familial forms of psychosis. Both groups of patients had chronic illnesses with many years of exposure to psychotropic medication, and thus it is theoretically possible that the common white matter morphometric deficit resulted from such exposure. However, medication exposure differed between the two groups, with most individuals with bipolar disorder only exposed to anti-psychotic medication during exacerbation of illness. Although the morphometric analysis of white matter volume deficit suggested involvement of certain longitudinal and interhemispheric tracts, the anatomical labelling of tracts on the basis of Talairach coordinates should be regarded as heuristic. A more compelling demonstration that specific tracts are involved in both psychotic disorders, and that anatomical connectivity between frontal and temporo-parietal cortex is compromised as a result, could be provided by future studies incorporating diffusion tensor imaging and tractography techniques.
The Kraepelinian dichotomy
Our findings neither wholly support nor wholly negate the Kraepelinian dichotomy of psychosis. Support for the Kraepelinian position comes from the fact that schizophrenia was characterised by a distinctive pattern of distributed grey matter deficit in fronto-temporal, subcortical and cerebellar regions, whereas psychotic bipolar disorder was not associated with significant grey matter abnormality. However, the classic dichotomy is partially subverted by our demonstration of common white matter abnormalities in the two disorders, suggesting that anatomical disconnectivity between frontal and temporo-parietal cortex may be important for emergence of psychotic syndromes in general.
Clinical Implications and Limitations
CLINICAL IMPLICATIONS
-
▪ The Kraepelinian dichotomy of psychosis is par partially tially upheld since distributed grey matter deficit in fronto-temporal, subcortical and cerebellar regions was found only in schizophrenia and not in bipolar disorder.
-
▪ White matter volume deficit in frontal and temporo-parietal regions is a morphometric characteristic of both major psychotic disorders.
-
▪ Anatomical disconnectivity between frontal and temporo-parietal cor cortices tices may be important for the emergence of psychotic syndromes in general.
LIMITATIONS
-
▪ All patients were from families with other affected members and results may not be applicable to epidemiological samples.
-
▪ The patient groups were not well matched for gender.
-
▪ The impact on brain structure of the differing medications used to treat these patient groups could not be assessed in the present study.
Acknowledgement
C.McD. and E.B. were supported by the Wellcome Trust.




eLetters
No eLetters have been published for this article.