Preface
The following set of papers describe in detail the science goals of the future SPace Infrared-telescope for Cosmology and Astrophysics (SPICA). The SPICA satellite will employ a 2.5-m telescope, actively cooled to around 6 K, and a suite of mid- to far-IR spectrometers and photometric cameras, equipped with state of the art detectors. In particular, the SPICA Far-Infrared Instrument (SAFARI) will be a grating spectrograph with low (R ≃ 300) and medium/high (R ≃ 3 000–11 000) resolution observing modes, instantaneously covering the 35–230 µm wavelength range. The SPICA Mid-Infrared Instrument (SMI) will have three operating modes: a large field of view (FoV) (12arcmin × 10 arcmin) low-resolution 17–36 µm spectroscopic (R ≃ 50–120) and photometric camera at 34 µm, a medium resolution (R ≃ 2000) grating spectrometer covering wavelengths of 17–36 µm, and a high-resolution echelle module (R ≃ 28000) for the 12–18 µm domain. A large FoV (80arcsec × 80 arcsec), three channel, (110, 220, and 350 µm) polarimetric camera will also be part of the instrument complement. While these papers will focus on some of the major scientific questions that the SPICA mission aims to address, more details about the mission and instruments can be found in Roelfsema et al. (in preparation).
1 INTRODUCTION
One of the most important themes in extragalactic astronomy over the next decades will be the exploration of the very early stages of galaxy formation, when the first light arose from the so-called Dark Ages, with many future facilities planning to dedicate a significant effort in pursuing this goal. The properties and evolution of galaxies appear to be linked to the growth of their central black holes (BHs) (e.g., Kormendy & Ho Reference Kormendy and Ho2013, and references therein), although the mechanisms responsible for this link are not understood: how supermassive black holes (SMBHs) formed at the centres of galaxies, and what their role was in the formation and evolution of galaxies, will still be key astrophysics questions in the coming years. There is observational evidence, as well as a theoretical rationale to suggest an intimate relation between the evolution of galaxies and the growth of their central SMBHs. On the theoretical side, cosmological simulations require feedback from active galactic nuclei (AGN) in order to suppress star formation (SF) in massive galaxies (e.g., Di Matteo, Springel, & Hernquist Reference Di Matteo, Springel and Hernquist2005, Croton Reference Croton2006, Booth & Schaye Reference Booth and Schaye2009). Observational evidence in the local Universe includes the very tight relation between the BH mass and the stellar velocity dispersion (M BH−σ*; e.g., Gültekin et al. Reference Gültekin, Cackett, Miller, Di Matteo, Markoff and Richstone2009, and references therein) and the molecular outflows that are omni-present in local Ultra-Luminous InfraRed Galaxies (ULIRGs; e.g., Spoon et al. Reference Spoon2013). The tight M BH-σ* relation, however, breaks early on (as early as z ≃ 0.3; see Woo et al. Reference Woo, Treu, Malkan and Blandford2008), and while at high z ionised-gas outflows are very common, there are only a handful of tentative detections of molecular outflows (e.g., Falgarone et al. Reference Falgarone, Iono, Tatematsu, Wootten and Testi2015). Therefore, the nature of the symbiotic relation between galaxy evolution and accretion onto SMBHs is still matter of debate. For this reason, understanding the formation of galaxies and their subsequent evolution will be possible only if we obtain coeval observations of the emitted radiation due to accretion of matter onto the first SMBHs that formed in the Universe. We therefore need to uncover and cover galaxies and AGN over a broad range of redshifts and luminosities, in order to characterise the accretion and SF histories, and to be able to separate the two contributions within the same sources.
The bulk of the SF and SMBH accretion in galaxies took place more than six billion years ago, sharply dropping towards the present epoch (e.g., Madau & Dickinson Reference Madau and Dickinson2014). Most of the energy emitted by stars and accreting SMBHs is absorbed by dust, and re-emitted at longer wavelengths. The existence of a large number of distant sources radiating the bulk of their energy in the IR implies that the critical phases of SF and BH accretion history took place in heavily obscured systems, embedded within large amounts of gas and dust (e.g., Burgarella et al. Reference Burgarella2013; Madau & Dickinson Reference Madau and Dickinson2014). The substantial reddening affecting these dust-obscured objects makes their characterisation in the optical/UV severely biased and sometimes even impossible [e.g., Rowan-Robinson et al. (Reference Rowan-Robinson1997) and Hughes et al. (Reference Hughes1998) first showed that the star-formation rate density, SFRD, was higher when measured in the far-IR and sub-mm than in the optical/UV]. By observing and measuring dust re-emission in the IR, we will indirectly measure the primary radiation, looking at the main processes at work in obscured regions of galaxies. Determining how much of the star-formation rate and black-hole accretion rate densities (SFRD and BHARD, respectively) are obscured by dust between z ≃ 3 and z ≃ 6 will have also important implications for our knowledge of the dust content within galaxies, as well as for the dust attenuation law evolution and, consequently, for the epoch and processes of dust formation.
The advent of space-based infrared (IR) observatories allowed us to directly measure the dust-obscured SF activity, independently on any extinction corrections. Evolutionary studies with deep Spitzer mid-IR (24-µm) surveys first unveiled the dust-obscured SF to z ~ 2.5–3 (i.e., Le Floc’h et al. Reference Le Floc’h2005; Pérez-González et al. Reference Pérez-González2005; Caputi et al. Reference Caputi2007; Rodighiero et al. Reference Rodighiero2010)—albeit with large uncertainties at z > 1.5–2 due to the difficulty in recovering the far-IR bump at longer wavelengths. The deepest Herschel surveys in the far-IR with PACS (observing at 100 and 160 µm; Poglitsch et al. Reference Poglitsch2010) allowed us to trace the SFRD and BHARD evolution up to z ~ 3–4 (i.e., Gruppioni et al. Reference Gruppioni2013; Magnelli et al. Reference Magnelli2013; Delvecchio et al. Reference Delvecchio2014), while those with the longer wavelength instrument (SPIRE, observing at 250, 350, and 500 µm; Griffin et al. Reference Griffin2010), detected higher redshift galaxies (to $z{_>\atop ^{\sim }}6$
; e.g., Riechers et al. Reference Riechers2013, Lutz Reference Lutz2014, Rowan-Robinson et al. Reference Rowan-Robinson2016, Laporte et al. Reference Laporte2017), but with large identification uncertainties due to source blending. The first far-IR luminosity function (LF) reaching z ≃ 4 (Gruppioni et al. Reference Gruppioni2013) obtained with the Herschel PACS Evolutionary Probe (PEP; Lutz et al. Reference Lutz2011) survey data, suggested a rapid decline of the SFRD at z > 3, following a plateau between z ~ 1 and z ~ 3. A decline is suggested in the SFRD at z > 3, confirmed by the recent super-deblending analysis of deep Herschel images by Liu et al. (Reference Liu2017) in the GOODS-North field. The latter authors found that there is still a significant contribution from the dusty galaxies missed by optical to near-IR colour selections at 3 < z < 6. However, a recent analysis of Herschel 500-µm sources in the Herschel Multi-tiered Extragalactic Survey (HerMES; Oliver et al. Reference Oliver2012) by Rowan-Robinson et al. (Reference Rowan-Robinson2016) has provided hints of even higher SFRD at z = 3–6 (significantly higher than UV estimates), with the obscured SFRD remaining almost constant up to z ~ 6, while the UV estimates show a decline of more than an order of magnitude towards higher redshifts. This result, in agreement with the previous work by Dowell et al. (Reference Dowell2014), and with the GRB measurements by Kistler et al. (Reference Kistler, Yüksel, Beacom, Hopkins and Wyithe2009), seems to imply that the epoch of high SFRD, and hence of rapid heavy element formation, extends at least from z ~ 6 to z ~ 1. This is a significantly earlier start to the epoch of high SFRD than inferred from previous studies and could pose problems for theoretical models of galaxy formation (setting the epoch of intense activity at z ~ 1–3). Moreover, this result strengthens the inconsistency between IR data and semi-analytic models (SAMs) at high-z previously found by Gruppioni et al. (Reference Gruppioni2015), with SAMs largely under-predicting the high SFRs seen in starburst galaxies at z > 2.
$z{_>\atop ^{\sim }}6$
; e.g., Riechers et al. Reference Riechers2013, Lutz Reference Lutz2014, Rowan-Robinson et al. Reference Rowan-Robinson2016, Laporte et al. Reference Laporte2017), but with large identification uncertainties due to source blending. The first far-IR luminosity function (LF) reaching z ≃ 4 (Gruppioni et al. Reference Gruppioni2013) obtained with the Herschel PACS Evolutionary Probe (PEP; Lutz et al. Reference Lutz2011) survey data, suggested a rapid decline of the SFRD at z > 3, following a plateau between z ~ 1 and z ~ 3. A decline is suggested in the SFRD at z > 3, confirmed by the recent super-deblending analysis of deep Herschel images by Liu et al. (Reference Liu2017) in the GOODS-North field. The latter authors found that there is still a significant contribution from the dusty galaxies missed by optical to near-IR colour selections at 3 < z < 6. However, a recent analysis of Herschel 500-µm sources in the Herschel Multi-tiered Extragalactic Survey (HerMES; Oliver et al. Reference Oliver2012) by Rowan-Robinson et al. (Reference Rowan-Robinson2016) has provided hints of even higher SFRD at z = 3–6 (significantly higher than UV estimates), with the obscured SFRD remaining almost constant up to z ~ 6, while the UV estimates show a decline of more than an order of magnitude towards higher redshifts. This result, in agreement with the previous work by Dowell et al. (Reference Dowell2014), and with the GRB measurements by Kistler et al. (Reference Kistler, Yüksel, Beacom, Hopkins and Wyithe2009), seems to imply that the epoch of high SFRD, and hence of rapid heavy element formation, extends at least from z ~ 6 to z ~ 1. This is a significantly earlier start to the epoch of high SFRD than inferred from previous studies and could pose problems for theoretical models of galaxy formation (setting the epoch of intense activity at z ~ 1–3). Moreover, this result strengthens the inconsistency between IR data and semi-analytic models (SAMs) at high-z previously found by Gruppioni et al. (Reference Gruppioni2015), with SAMs largely under-predicting the high SFRs seen in starburst galaxies at z > 2.
On the other hand, recent Atacama Large Millimeter Array (ALMA) observations of the Hubble Ultra Deep Field (Dunlop et al. Reference Dunlop2017) seem to contradict these results, by finding that the SFRD peaks at z ≃ 2.5, and that the star-forming Universe transits from primarily unobscured to primarily obscured at z ≃ 4. Note that this result depends strongly on the template SEDs adopted to compute the SFR, since ALMA samples the rest-frame SED significantly longward of the far-IR peak [although Dunlop et al. (Reference Dunlop2017) fit the template considering the Herschel limits, and estimate a maximum difference of 20–30% due to this]. The Dunlop et al. (Reference Dunlop2017) result seems to be in agreement with recent ALMA observations of the Hubble Frontier Fields to extremely deep limits, suggesting the presence of very little dust in galaxies at z > 4 (Bauer et al. in preparation), and with the result by Bourne et al. (Reference Bourne2017). The latter authors find a transition between obscured and unobscured SFRDs at z ~ 3, with a high redshift decline following that of UV surveys, by stacking SCUBA-2 images up to z ~ 5.
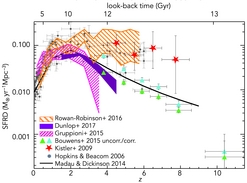
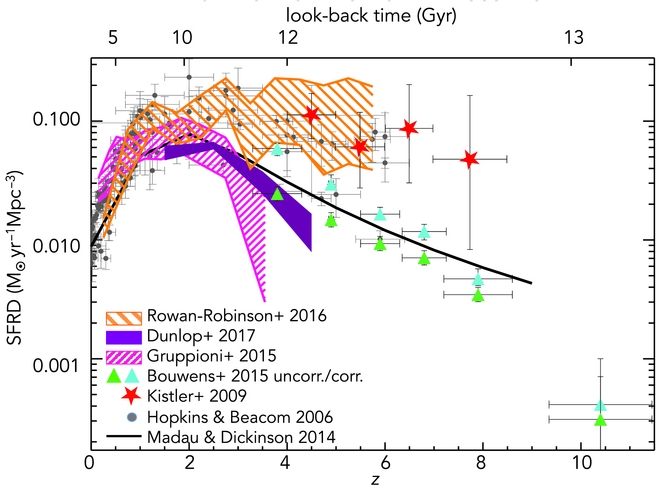
In summary, we have on the one hand, the SPIRE large-scale (e.g., a total of >800 deg2 surveyed; Oliver et al. Reference Oliver2012, Eales et al. Reference Eales2010, Valiante et al. Reference Valiante2016) and meaningful statistics (several hundreds of thousands sources detected) at high redshift that are affected by identification and redshift measurement problems, while on the other hand, the more precise ALMA results that are based on very small statistics and sky area coverage (e.g., the largest continuum survey of contiguous fields performed with ALMA covers only 4.5 arcmin2 and has detected only 16 sources; Dunlop et al. Reference Dunlop2017). In Figure 1, we show our current knowledge (or rather lack of it) of the cosmic history of the SFRD, as derived by different surveys (most of which have been discussed above) performed at different wavelengths. The large spread in the results and estimates at z > 3 is clearly evident, not only between obscured (e.g., IR/sub-mm) and unobscured (e.g., optical/UV) survey data, but also between IR/sub-mm surveys in different fields, with different instruments (e.g., Rowan-Robinson et al. Reference Rowan-Robinson2016 with Herschel and Dunlop et al. Reference Dunlop2017 with ALMA). Note that at z ≳ 6, the current estimates differ by more than an order of magnitude, with very different implications for galaxy formation and evolution scenarios (see e.g., Fontanot, Hirschmann, & De Lucia Reference Fontanot, Hirschmann and De Lucia2017). However, as evident from Figure 1, at z ≳ 3, there are currently no IR surveys that can conclusively confirm whether the obscured SFRD declines (and whether how) from z ~ 1.5, as suggested by UV studies, or remains constant to z ~ 6, as suggested from gamma-ray burst (GRBs; Kistler et al. Reference Kistler, Yüksel, Beacom, Hopkins and Wyithe2009) and sub-mm measurements (e.g., Rowan-Robinson et al. Reference Rowan-Robinson2016).
Redshift evolution of the comoving SFRD. Different derivations of the obscured and unobscured SFRD are compared: the light grey data points show the extinction-corrected optical/UV compilation by Hopkins & Beacom (Reference Hopkins and Beacom2006); the pink hatched area shows the IR SFRD from Gruppioni et al. (Reference Gruppioni2015) (obtained by integrating the Herschel LF of Gruppioni et al. (Reference Gruppioni2013) after subtracting the AGN contribution from each source); the orange hatched area is the SFRD obtained by Rowan-Robinson et al. (Reference Rowan-Robinson2016) by re-analysing the Herschel high-z sub-mm sources; the purple area shows the uncertainty region of the Dunlop et al. (Reference Dunlop2017) SFRD from ALMA data; the black solid line shows the best-fit model by Madau & Dickinson (Reference Madau and Dickinson2014) to the dust-corrected UV data and IR data; the cyan (green) filled triangles are the dust-corrected (uncorrected) UV data by Bouwens et al. (Reference Bouwens, Illingworth, Oesch, Caruana, Holwerda, Smit and Wilkins2015); and the red stars are the measurements derived from high-z GRB by Kistler et al. (Reference Kistler, Yüksel, Beacom, Hopkins and Wyithe2009).
Indeed we have very little direct evidence characterising dusty SF at very high redshifts, since current estimates of the SFRD and SF population at z > 3–4 are nearly all derived by the observation of unobscured objects from rest-frame UV or optical surveys (e.g., Bouwens et al. Reference Bouwens, Illingworth, Oesch, Caruana, Holwerda, Smit and Wilkins2015). Bouwens et al. (Reference Bouwens2009) found no relevant dust attenuation at z > 5 (based on the UV continuum slope of high-z Lyman Break Galaxies, LBGs), and they concluded that the UV LF contains all the information needed to estimate the SFRD at these redshifts. Nonetheless, this might represent only a partial view: in fact, if dusty obscured objects do exist at high redshift, they would be totally missed by the UV surveys and their contribution will remain completely unknown without far-IR surveys.
From the AGN side, all the available estimates of the BHARD are at z < 3. They include X-ray (e.g., Merloni & Heinz Reference Merloni and Heinz2007), optical (e.g., Hopkins, Richards, & Hernquist Reference Hopkins, Richards and Hernquist2007), and IR survey data (e.g., Delvecchio et al. Reference Delvecchio2014). All of them are strongly dependent on the bolometric correction (which can be as high as a factor of 100 in the X-ray) and subject to large uncertainty about the contribution of heavily obscured and Compton-thick (CT; N H > 1024 cm−2) AGN. The latter can severely affect the optical and X-ray measurements, especially at high-z, where larger fractions of CT AGN are expected. Indeed, these sources are responsible for most of the power produced by accretion in the Universe (e.g., Gilli, Comastri, & Hasinger Reference Gilli, Comastri and Hasinger2007; Treister, Urry, & Virani Reference Treister, Urry and Virani2009; Comastri et al. Reference Comastri, Gilli, Marconi, Risaliti and Salvati2015; Harrison et al. Reference Harrison2016) and therefore are likely to represent a crucial phase in the joint evolution of galaxies and AGN. Although they are expected to make up a significant fraction of the X-ray background (e.g., Gilli et al. Reference Gilli, Comastri and Hasinger2007), the fainter fraction of the CT-AGN population escapes even the deepest X-ray surveys currently available. However, thanks to the reprocessed IR emission from the circum-nuclear dusty torus obscuring the optical/UV/soft X-ray, these objects are expected to be detectable in IR surveys.
Observations in the mid-IR to very faint flux densities (around a few µJy) are the only means to detect SF and/or AGN activity in most of these heavily obscured sources at large cosmological distances. Indeed, a significant fraction of the star-forming galaxies dominating the SFRD of the Universe at z = 1–4, when most of the stellar populations in the most massive galaxies were being assembled (Fontana et al. Reference Fontana2006; Pérez-González et al. Reference Pérez-González2008; Marchesini et al. Reference Marchesini, van Dokkum, Förster Schreiber, Franx, Labbé and Wuyts2009), are very faint in the UV/optical (Pérez-González et al. Reference Pérez-González2005), and their SFRs can only be measured through mid-/far-IR observations reaching fluxes well below 1 mJy (Herschel reached the confusion limit of ≃1 mJy at 100 µm, and so was unable to go much further than z ~ 3–4). In this context, a deep photometric survey in the IR, reaching up to z ~ 6–7, will be crucial for clarifying the evolution of the dust-obscured SF and accretion activity, allowing us to reveal, for the first time, the dark side of the reionisation epoch and of the newly formed galaxies and BHs. The deepest extragalactic surveys performed by Spitzer-MIPS and Herschel-PACS (e.g., GOODS, H-GOODS, and PEP) could not reach redshifts larger than 3 and 4, respectively (e.g., Pérez-González et al. Reference Pérez-González2005; Magnelli et al. Reference Magnelli2013; Gruppioni et al. Reference Gruppioni2013) in the more sensitive bands (e.g., Spitzer 24µm and Herschel 100µm), while the Herschel longer wavelength instrument (SPIRE, observing at 250, 350, and 500µm), did detect potentially higher redshift galaxies although they are often difficult to identify, due either to the large obscuration at optical wavelengths or to the very large beam-size of SPIRE (~18 arcsec at 250µm; ~35 arcsec at 500µm). In any case, the deepest cosmological surveys performed by Herschel at high-z have detected only the most luminous galaxies (L IR > 1012 L⊙ at z ~ 3; Gruppioni et al. Reference Gruppioni2013, Magnelli et al. Reference Magnelli2013). Previous IR space telescopes did not have enough sensitivity, while the upcoming James Webb Space Telescope (JWST), due to launch in 2018, will have a very narrow FoV, which will reflect in a very low mapping speed for surveys.
SPICA (e.g., Nakagawa et al. Reference Nakagawa, Matsuhara and Kawakatsu2012; Sibthorpe et al. Reference Sibthorpe, Helmich, Roelfsema, Kaneda, Shibai, Simon, Schaaf and Stutzki2015; Roelfsema et al. 2017), an IR space observatory with a 2.5-m primary mirror cooled to about 6 K, and with a new generation of ultra-sensitive detector arrays, will offer the community a unique astronomical facility, covering the rich 12–350µm spectral range, capable of making deep and wide surveys to unprecedented depths in spectroscopy, photometry, and polarimetry. The two instruments on board of SPICA, SAFARI, a joint European-Canadian-US contribution, and SMI from Japan, together provide several modes of operation with high resolution (HR, R ≃28 000) spectroscopy in the mid-IR (12–18µm) and low (LR, R ≃150) to medium resolution (MR, R up to ≃11 000) spectroscopy instantaneously over the full 17 to 36µm and 35 to 230µm ranges, at a sensitivity of a few times 10−20 Wm−2 (5σ, 10 h). In addition to the mid- (SMI) and far-IR (SAFARI) spectrographs, driving the main science objectives with SPICA (see Spinoglio et al. 2017 and Kaneda et al. 2017, this issue), the SMI/LR capability provides a 10arcmin × 12 arcmin slit viewer camera (SMI/CAM, a broadband imager centred at 34µm, with a 30–37µm band), which is perfectly suited to perform wide-area surveys, while SAFARI delivers imaging polarimetry (SAFARI/POL at 100, 200, and 350µm) and photometry-mapping in the far-IR (centred at 45, 72, 115, and 185µm). In the SMI/LR spectral mapping mode, the multi-slit spectrometer and the camera are operated simultaneously, yielding multi-object spectra from 17 to 36µm and R = 5 deep imaging at 34µm (see Kaneda et al. Reference Kaneda and MacEwen2016). The 30–37µm band will be very important for the detection of warm dust at high redshift, providing the ‘sweet spot’ for unveiling the high-z elusive/obscured AGN escaping detection at any other wavelengths.
For a detailed description of SPICA instrumentation and capabilities, and of its main scientific goals, we refer to Roelfsema et al. (2017, A&A in preparation) and Kaneda et al. (Reference Kaneda and MacEwen2016).
This paper focuses mainly on the study of high-z (>3) SF galaxies and AGN with photometric surveys in the mid-IR, and is organised as follows. In Section 2, we focus on the reasons why we need deep mid-IR photometric surveys; in Section 3, we discuss the main contribution of deep mid-/far-IR photometric surveys to our understanding of the SFRD and BHARD cosmic evolution up to the reionisation epoch. In Section 4, we present our concept for the best photometric survey strategy with an observatory like SPICA, with predictions of expected numbers of sources and redshift distributions, while in Sections 5 and 6, we discuss the importance of such surveys for the detection of highly obscured AGN and starburst galaxies, respectively. In Section 7, we present our conclusions.
Throughout this paper, we use a Chabrier (2003) initial mass function (IMF) and we adopt a ΛCDM cosmology with H 0 = 70 km s−1 Mpc−1, Ωm = 0.3, and ΩΛ=0.7.
2 THE NEED FOR A DEEP MID-IR PHOTOMETRIC SURVEY WITH SPICA
A deep and large-area photometric survey in the band covered by SMI/CAM on SPICA (30–37µm, centred at 34µm) will be essential within the galaxy formation and evolution context, in particular for:
-
(a) unveiling the dust obscured population (either AGN or star forming) up to high redshift (i.e., the reionisation epoch), providing a conclusive measure of the obscured SFRD and BHRD from z = 0 to z ≃ 6–7;
-
(b) effectively detecting heavily obscured Compton-thick and elusive AGN missed by deep observations in the optical, UV, and X-ray bands;
-
(c) efficiently mapping large areas of the sky with the wide FoV, creating a blind catalogue for unbiased target selection for mid- and far-IR spectroscopic follow-up;
-
(d) filling the wavelength gap between the currently existing and forthcoming facilities operating in the IR domain (e.g., between the JWST, 0.6–23µm range, and ALMA, 350–3500µm).
3 OBSCURED SFRD AND BHARD AT HIGH-z WITH SPICA
The emission from galaxies and AGN at different wavelengths provides information about different physical processes within them; thus, to link the different physical processes together it is necessary to observe the same galaxies at many wavelengths. Although many current, forthcoming and future facilities, including ALMA, the JWST, the Extremely Large Telescopes (ELTs), and the Advanced Telescope for High-ENergy Astrophysics (ATHENA), will dedicate a significant effort towards the study of the first luminous sources formed in the Universe, a wavelength gap in a band (mid-/far-IR) crucial for understanding the link between SF and BH accretion will remain.
SPICA–SMI/CAM, observing in photometric mode in the previously unexplored 30–37µm band, will be so sensitive that it will reach the confusion limit (estimated at ~9µJy at 5σ) in slightly more than 1 h, thus enabling large areas of sky to be covered in relatively small amounts of time and detecting star-forming galaxies and obscured AGN out to z ~ 6–7. Producing statistically significant, confusion-limited surveys in the mid-IR will be a unique capability of SPICA. A multi-tiered photometric survey with SPICA–SMI/CAM will enable us to identify a mid-IR unbiased sample of galaxies and AGN over a wide range in redshifts, pushing the study of galaxy and AGN evolution all the way back to the reionisation epoch.
A SPICA photometric survey will contribute to our knowledge of the cosmic SFRD and BHARD at three different levels, depending on the availability of either spectroscopic or multi-wavelength ancillary data.
-
(1) At 0 < z < 3, HR spectroscopic observations of SMI/CAM-targeted sources with SAFARI will provide important indicators of the physics of the ISM—particularly of the ionised gas—within galaxies and AGN at the peak of the obscuration and SF/accretion epoch. Detailed spectroscopy of individual galaxies selected from wide-area surveys provides a unique suite of diagnostic tools accessible only in the IR. These diagnostics, based on mid- and far-IR lines, are fundamental for characterising the physics of the ISM in dusty galaxies (see Spinoglio et al. 2017, this volume). IR spectroscopy will allow us both to measure the redshift of dusty sources and to link the different line properties to the IR luminosity, was well as the SFR and the AGN luminosity (if present), as described in section 3.1. Moreover, IR spectroscopy will allow the detection of molecular gas outflows driven either by AGN or SF (see González-Alfonso et al. 2017, this volume), and will also measure the amount of metals and dust within galaxies (see Fernández-Ontiveros et al. 2017, this volume).
-
(2) At z > 3 (and lower), simultaneous observations with the SMI/LR (R ≃ 50–120) will detect features in the mid-IR range (i.e., polycyclic aromatic hydrocarbons, PAHs: the 3-µm rest-frame feature will be in the SMI range up to z ≃ 11, the 9.7-µm silicate absorption to z ≃ 3) of normal SF galaxies, which represent key tracers of SFR and AGN accretion and can be used to determine redshift. Kaneda et al. (2017) estimate that at redshifts greater than ~4, the PAH features should be detectable only in extremely luminous sources (ultra/hyper Luminous IR Galaxies: LIRGs/HyLIRGs), with L IR ⩾ 1012.5 − 13 L⊙ (although the PAH properties and strengths at high redshifts might be different from what we expect based on lower z observation).
-
(3) For galaxies either at higher redshifts (greater than ~4) or having lower luminosity (not as extreme as ULIRG/HyLIRGs, i.e., with L IR < 1012 L⊙), not detected in high-/low-resolution spectroscopy by either SAFARI or SMI/LR, ancillary data would be necessary, in order to provide identifications, measure the redshifts, and quantify the SFRs and/or AGN accretion rates. For this reason, the deep SPICA photometric surveys will be performed on extensively observed fields, where large multi-wavelength coverage will be available (see, e.g., the Herschel Extragalactic Legacy Project, HELP, Vaccari Reference Vaccari2016, providing homogenised multi-wavelength datasets on all the Herschel extragalactic wide-area fields). Follow-up observations with SAFARI in photometric mode at 45µm will help shaping the SEDs, providing a measure at longer wavelengths than the detection one. For the SPICA sources unidentified by any other means (which will be particularly interesting, since they will open up a window to a potentially unknown population), specific follow-up campaigns will be needed, with, e.g., ALMA, ELTs and other facilities that will be operational at the time SPICA is expected to fly. As shown in Sections 4.2, 5, and 6, ALMA and ELTs will be able to identify all the sources detected by SPICA–SMI/CAM at 34 µm, up to very high redshifts (z ≳ 8).
3.1. Calibrate the z < 3–4 SED-fitting physical quantities through IR lines
As extensively discussed by Spinoglio et al. (2017), since the emission-line intensities and ratios in the mid- and far-IR domain do not suffer from dust extinction like the optical and UV emission lines, they provide unique information on the physical conditions (i.e., electron density and temperature, degree of ionisation, and excitation and chemical composition) of the gas within the dust-obscured regions of galaxies with intense SF activity or surrounding an AGN (Spinoglio & Malkan Reference Spinoglio and Malkan1992; Rubin et al. Reference Rubin, Simpson, Lord, Colgan, Erickson and Haas1994; Panuzzo et al. Reference Panuzzo, Bressan, Granato, Silva and Danese2003). To properly quantify the contribution of AGN and SF from young massive stars to the overall energy budget in large samples of dusty obscured galaxies, mid- and far-IR lines can be used as proxies of the accretion rate (e.g., [O iv]25.9 µm and [Ne v]14.3, 24.3 µm) and the SFR (e.g., [Ne ii]12.8 µm, [S iii]18.7, 33.5 µm and [O iii]52, 88 µm), since the luminosity of the mid-/far-IR lines has been found to trace and strongly correlate with either the SF or the AGN luminosity in galaxies (e.g., Spinoglio et al. Reference Spinoglio, Dasyra, Franceschini, Gruppioni, Valiante and Isaak2012; Bonato et al. Reference Bonato2014a, Reference Bonato2014b; De Looze et al. Reference De Looze2014; Gruppioni et al. Reference Gruppioni2016). These relations, derived only in the local Universe for a limited number of objects, depend on the relative AGN contribution to the IR luminosity. SPICA, measuring spectra for thousands of galaxies up to z ≃ 3–4, will allow us to derive similar relations for statistically significant samples of sources spanning a wide range of luminosities, allowing us to test their evolution and understand the physical processes at play.
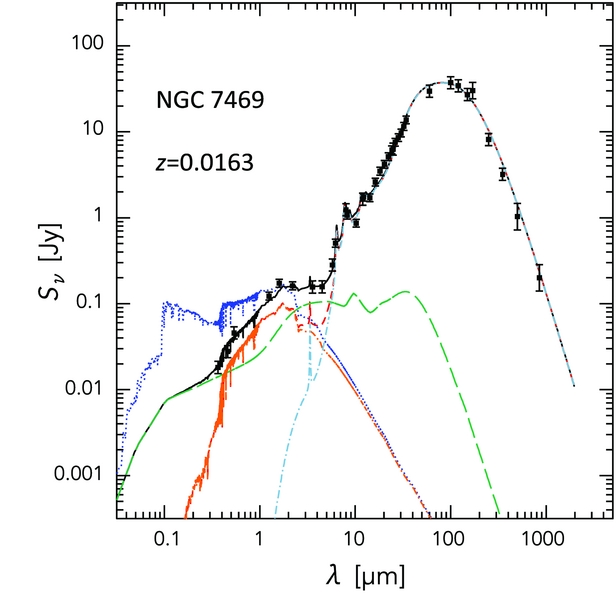
In this context, Gruppioni et al. (Reference Gruppioni2016) have obtained new estimates of AGN accretion and SF luminosity for local Seyfert galaxies from the 12-µm sample of Rush, Malkan, & Spinoglio (Reference Rush, Malkan and Spinoglio1993), by performing a detailed broadband SED decomposition including the emission of stars, dust heated by SF, and a possible AGN dusty torus (see Figure 2 for an example of an SED consistently decomposed into its main building blocks).
Example of an observed SED decomposed into stellar, AGN and star-formation components, using the technique developed by Berta et al. (Reference Berta2013). The black filled circles with error bars are the photometric data relative to the optically classified Seyfert 1 NGC7469. The blue dotted line shows the unabsorbed stellar component, the red dashed line shows the combination of extinguished stars and dust IR emission, while the long-dashed green line shows the dusty torus emission. The pale-blue dot-dashed line shows the dust re-emission, while the black solid line is the sum of all components (total emission).
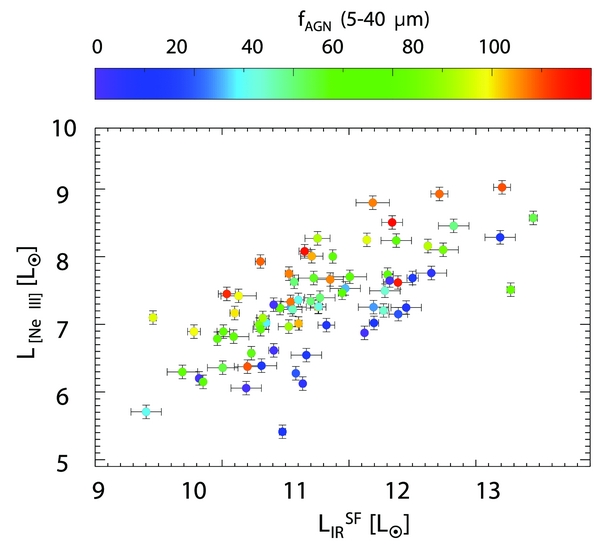
The IR luminosity due to SF, and the intrinsic AGN bolometric luminosity derived through SED fitting, have been shown to strongly correlate with the IR line luminosity, with the scatter mainly due to different relative AGN contributions for different galaxies in the sample (see Figure 3 for an example of the correlation between the [Ne iii] 15.6 µm line luminosity and the IR luminosity due to SF, with different colours highlighting different AGN fractions). By extrapolating the local derivations of Herschel-detected line emission and SF or AGN luminosities to higher redshifts, it was possible to obtain mid- and far-IR line LFs (Gruppioni et al. Reference Gruppioni2016). These estimates, used in combination with IR galaxy and AGN evolutionary models, are now useful for making predictions of what we expect to observe with SPICA (in terms of emission lines and numbers of objects detectable in the different lines) up to z ~ 3–4 and beyond (see Spinoglio et al. 2017).
Luminosity of the [Ne III] 15.6µm line as a function of the 8–1000µm luminosity due to SF (L SF IR), as derived from the SED decomposition analysis (e.g., see Figure 2, pale blue dot-dashed line) of the 12-µm sample of local galaxies performed by Gruppioni et al. (Reference Gruppioni2016). The different colours of the symbols represent the different AGN fractions to the 5–40µm luminosity (i.e., f AGN (5–40~ µm) in the top colour-bar).
SPICA will thus extend these studies to a redshift of 3 to 4, directly linking the physical quantities obtainable from photometric observations (e.g., SED fitting) with emission line (ISM) properties, in fainter and higher redshift galaxies than the local Seyferts analysed by Gruppioni et al. (Reference Gruppioni2016). These relations, whose evolution with redshift will be studied in detail, will be extremely useful in calibrating the physical quantities derived through SED-fitting using IR lines up to z ~ 3. Then we will use these calibrations at higher z, to estimate the physical properties of the ISM and the nature of the heating source, for galaxies out of reach of SPICA spectroscopy (due to sensitivity limits of the spectrographs).
3.2. Obscured SFRD and BHARD evolution from their peak to reionisation (z > 4)
The exquisite photometric capabilities of SPICA will make it possible to resolve the existing discrepancy in the contribution of dust-obscured sources to the z > 4 SFRD (see Figure 1). This is also likely to impact on the estimate of the relative contribution of galaxies and AGN to the reionisation (see e.g., Fontanot, Cristiani, & Vanzella Reference Fontanot, Cristiani and Vanzella2012; Fontanot et al. Reference Fontanot, Cristiani, Pfrommer, Cupani and Vanzella2014). As mentioned in the previous section, galaxies at z > 3–4, unless strongly lensed, will be hardly detectable in spectroscopic mode by SPICA. High-z sources could therefore be detected only in photometric mode, using the SMI/CAM, which will be sufficiently sensitive to easily reach the confusion limit for a 2.5-m telescope (estimated 9 µJy, 5σ; see section 4.1).
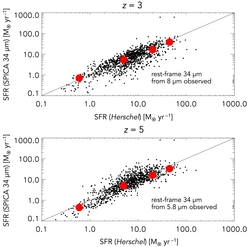
The validity of the 34-µm (continuum) SFR indicator alone (although a redshift estimate/measure is needed) has been tested at z = 3–5 by extrapolating the total IR luminosities (converted to SFRs) estimated from the observed 34-µm luminosity. In fact, the 34µm observed band at z ≃ 3 and 5 samples, the 8- and 5.8-µm continuum rest-frame, respectively. A measure can be obtained by tuning the SED templates as calibrated by Spitzer and Herschel (Magdis et al. Reference Magdis2012), with a spread of about a factor of 1.8 (comparable to the intrinsic scatter of the SFR-stellar mass relation). The relation (shown in Figure 4) is very promising, because it could be extremely useful to derive the SFR of the 34-µm selected sources without far-IR counterparts (e.g., too faint to be detected by SAFARI above confusion), and thus obtain their IR luminosities without the need to integrate over their SEDs. To perform this test, we used the SPLASH/IRAC data for local galaxies (z < 0.3) from the COSMOS survey (Laigle et al. Reference Laigle2016), where the observed 8- and 5.8-µm IRAC fluxes mimic the rest-frame emission of the 34-µm filter at z = 3 and 5, respectively.
Examples of how the photometric SPICA survey at 34µm could be able to recover the SFR of star-forming galaxies at z = 3 and z = 5. We compare the SFR (effectively the total IR luminosity) extrapolated from the observed 34-µm flux density at z = 3 (top panel) to that computed when including photometric data from Herschel. To perform this test, we used a sample of local galaxies (z < 0.3) from the COSMOS survey (Laigle et al. Reference Laigle2016), where the observed 8-µm IRAC fluxes mimic the rest-frame emission of the 34-µm filter at z = 3. Similarly, we adopted the 5.8-µm IRAC fluxes (bottom panel) to probe the 34-µm filter at z = 5. The red filled circles show the median values in bins of SFR.
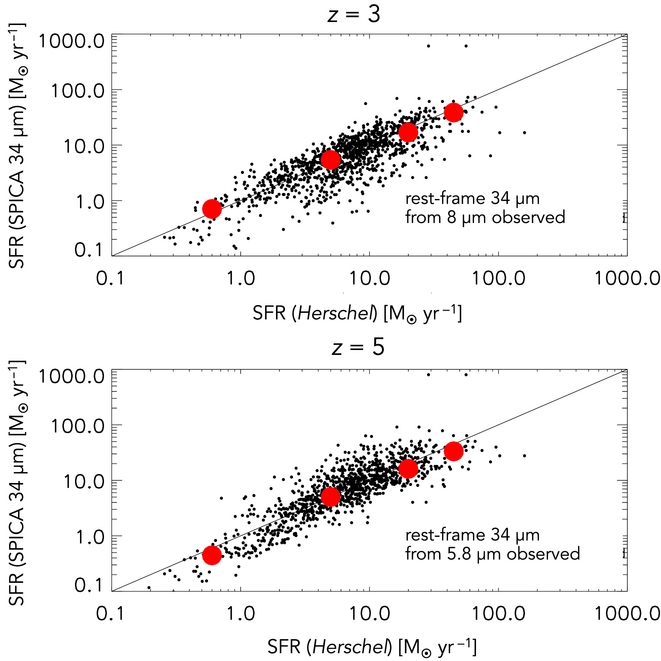
Although the relations are favourable, they are based on the assumption that the properties of galaxies at z ⩾ 4 are similar to those at z ~ 2. We do, however, know that the typical SED of ULIRGs at z ~ 2 is different from that at z ~ 0 and therefore this result has to be treated with caution. For the high-z galaxies, follow-up with ALMA, IRAM, or single-dish sub-mm observatories could help to calibrate these relations, providing better estimates of the total IR luminosity.
4 A PHOTOMETRIC SURVEY WITH SPICA–SMI/CAM
While we expect hundreds of high-z, IR-selected sources to be available for follow-up by the time SPICA is expected to fly (e.g., built up from surveys with Herschel, ALMA, SPT, JWST, Euclid, and WFIRST), SPICA with SMI will be uniquely capable of discovering new galaxies. Unlike SPICA, ALMA, and the JWST are not designed to map large regions of the sky but will be able to make detailed observations of the objects uncovered by SPICA. Multi-tiered photometric surveys with SPICA–SMI in the newly available 30–37µm band, will be used to select an unbiased sample of galaxies and AGN over a wide range of redshifts. These observations can be followed-up by SAFARI in both spectroscopic and photometric mode, pushing the study of galaxy and AGN evolution up to z ~ 6, and testing the claim that at z > 4 dust attenuation is negligible. Indeed, very recently, Laporte et al. (Reference Laporte2017) found a (gravitationally lensed) star-forming galaxy at z ≃ 8, with an estimated dust mass (through ALMA data) of 6× 10⁶ M⊙. Similar (or larger) dust masses, if found in the majority of high-z galaxies, will have important implications for our understanding of galaxy (and dust) formation and evolution.
4.1. Estimated source confusion for a 2.5-m mirror telescope
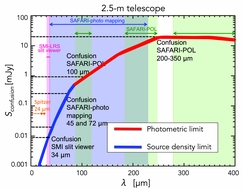
To estimate the confusion limit expected for a given sized telescope (2.5 m in our case), it is necessary to extrapolate the extragalactic source counts down to very faint flux densities and to consider the diffraction-limited beam size of the telescope. For source counts, we have considered the models of Pozzi et al. (Reference Pozzi2015), which are able to reproduce the latest Herschel survey data, extrapolated to fainter fluxes. We have followed Dole, Lagache, & Puget (Reference Dole, Lagache and Puget2003) to determine the confusion limits that will affect photometric surveys taken with a given angular resolution. According to Dole et al. (Reference Dole, Lagache and Puget2003), there are two sources of confusion: (1) the photometric limit (i.e., the noise produced by sources fainter than the detection threshold), where the photometric criterion is the requirement that sources are detected with a S/N > 5; and (2) the source density limit (i.e., depending on the fraction of ‘blended’ sources). For the source density criterion, we require that <30% of the sources are close enough not to be separable, i.e., are within 0.8×FWHM of another source). We use the higher of these values at a given wavelength to set the confusion limit to which we will integrate to in the SPICA maps. As shown in Figure 5, at λ ⩽70–80µm the main limitation for deep photometric surveys is the fraction of blended sources (blue curve), while at λ > 70–80µm, the photometric limit dominates (red curve).
Confusion limit as a function of wavelength for a diffraction-limited 2.5-m telescope. The limits of the SMI/CAM (30–37µm) and of SAFARI (/POL at 100, 200, and 350µm, and in photometry mapping at 45 and 72µm) are shown as horizontal dashed lines, while the pink, blue, and green shaded areas show the wavelength ranges covered by SMI/CAM, SAFARI photometric mapping, and SAFARI/POL, respectively. The blue part of the curve is determined by the source density criterion, while the red part is defined by the photometric criterion. For comparison, the confusion limit reached by Spitzer (with a 0.85-m mirror) at 24µ (from Dole et al. Reference Dole2004) is shown as orange horizontal line.
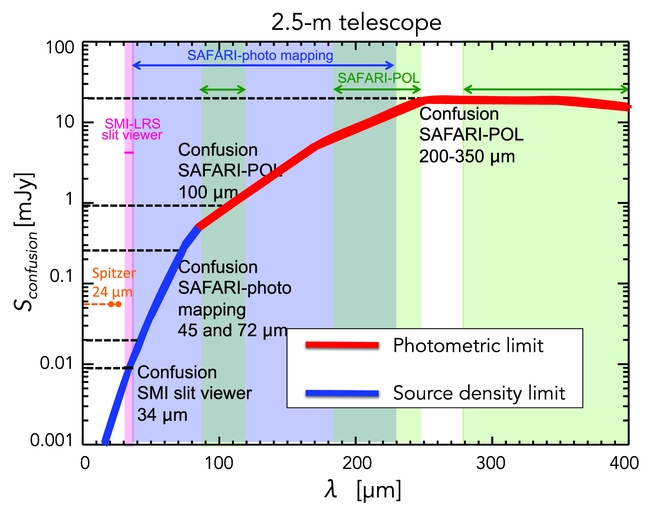
While the confusion limit is roughly constant above 200µm, the combination of the source number density variation with wavelength and the reduction in beam size at as wavelength decreases means that the confusion flux density decreases dramatically at shorter wavelengths. This will allow SPICA, given its high sensitivity, to go much deeper at 35 and 45µm without hitting confusion, than did PACS at 100µm. The estimated 5σ confusion of SMI/CAM (30–37µm) is ~9µJy, while the SAFARI confusion is ~0.02, 0.25, and 1 mJy at 45, 72, and 100µm, respectively, and 18 mJy at >200µm [the latter values are confirmed also by the Herschel results of Magnelli et al. (Reference Magnelli2013) in the H-GOODS Survey and of Nguyen et al. (Reference Nguyen2010) in the HerMES survey, reaching confusion at 0.8 and 19 mJy at 100 and 250µm, respectively]. Given the estimated confusion limits, it will be possible to use the 45µm channel of SAFARI (in photometric mode, i.e., used by binning the spectra) to follow-up targeted SMI sources (the FoV of SAFARI in photometric mapping is only 1arcmin × 1 arcmin) out to relatively high redshifts, going 2–3× below confusion. We note that the confusion estimates depend on source counts extrapolations, and that different criteria to derive confusion can provide different values. As an example, if we follow the method described in Franceschini et al. (Reference Franceschini, Toffolatti, Danese and de Zotti1989), we would find limits 2–3 times lower than our estimated values at wavelengths <60µm (i.e., where we are dominated by the source density criterion). In fact, the only way to determine the actual level of confusion (and thereby constrain galaxy evolution and source count models) is to make the measurements—for which we require an instrument like SPICA.
4.2. Survey strategy
The optimal survey structure envisaged to perform evolutionary studies consists of multiple layers of different sizes and depths (i.e., the classical ‘wedding-cake’). Here we present a plan for three surveys with SMI/CAM in the 30–37µm band.
-
1. Ultra-deep survey (UDS): A sub-confusion survey (down to 5σ ≃ 3µJy—i.e., three times lower than the estimated confusion) of 0.2 deg2, to examine the confusion noise itself. This could be done in just a few fields with extensive multi-wavelength coverage (e.g., CANDELS fields). According to the expected nominal sensitivities, the estimated time (only observational, excluding overheads) needed for such a survey is around 100 h (six pointings).
-
2. Deep survey (DS): A survey of ~1 deg2 in area down to the 5σ confusion limit of 9µJy, which will be reached in 1.75 min exposure per pointing. Since 36 pointings are needed to cover the desired area, a total of 64 h will be necessary to perform the survey (for comparison, the Design Reference Mission, DRM, for JWST including a deep—16µJy, 5σ—survey at 21µm with MIRI, over a field of 10arcmin × 9 arcmin, will take 160 h to complete). The SPICA DS should be performed on an extensively observed area of the sky of similar size (e.g., COSMOS), to take advantage of the available multi-wavelength coverage.
-
3. Shallow survey (SS): 600 deg2 (to study the bright-end of the LF) to 5σ about 0.2 mJy. The estimated time need without instrument overhead is about 78 h (21 600 pointings to cover the whole area). A wide-area multi-wavelength surveyed region of the sky to be covered by the SS, could be part of the GAMA Herschel-ATLAS survey (Eales et al. Reference Eales2010), or the Euclid Deep Survey fields.
If we could ignore the limited lifetime of SPICA and the need to share time with other projects, we could imagine a very large area survey, covering about 3 000 deg2 with SMI/CAM (performed on fields like the deep LSST or GAMA fields). Such a wide-area survey, considered as an example of the excellent SPICA–SMI/CAM performance as a photometer, would take about 390 h to reach a depth of 0.2 mJy, and would be instead time-prohibitive for JWST–MIRI.
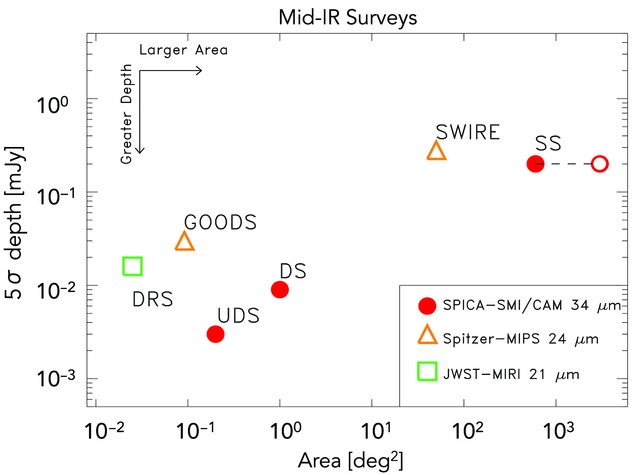
In Figure 6, we show the depth reached versus area covered for the planned extragalactic photometric surveys with SMI/CAM at 34µm (red filled circles) described above (the UDS, DS, and SS, including the example of an extremely wide area survey). compared to those performed with Spitzer-MIPS at 24µm (the deepest, GOODS, and the largest, SWIRE; orange open triangles), and to the DRM survey planned with JWST–MIRI at 21µm (green open square). From the figure, the great improvement of SPICA is immediately clear with respect to Spitzer in both sensitivity (i.e., the deepest MIPS 24-µm survey, GOODS, was more than a factor of 10 and more than a factor of 3 shallower than the planned UDS and DS, respectively) and area (i.e., the widest MIPS 24-µm survey, SWIRE, covered over 10 times less area than the planned SS). Even not considering the much better speed efficiency of SPICA with respect to JWST in mapping the sky, the planned DRM survey with JWST–MIRI at 21µm will be 5–6 times shallower than the SMI/CAM UDS, and will cover only about the 12% of the area.
Depth versus survey area for the planned extragalactic photometric surveys with SMI/CAM at 34µm (red filled circles), compared to the values reached by the surveys performed with Spitzer-MIPS at 24µm (the deepest, GOODS, and the largest, SWIRE; orange open triangles), and what will be reached by the Design Reference Mission survey planned with JWST–MIRI at 21µm (green open square). The red open circle represents the example of an extremely wide area survey (3 000 deg2) that could potentially be performed with SMI/CAM (in 390 h).
The SPICA photometric surveys could be followed-up by photometric mapping with SAFARI at 45, 72, 100, 250, and 350µm. Deep surveys at these wavelengths are confusion-limited, with confusion corresponding to significantly higher fluxes (40µJy at 45µm, 1 mJy at 100µm, at 5σ) than the SMI ones, although, knowing the position of the 34-µm sources, we can reliably extract flux down to lower limits (e.g., to 3σ). SAFARI, with its 1arcmin × 1 arcmin FoV, will be suitable for carrying out points source photometry on interesting sources selected from the SMI/CAM survey.
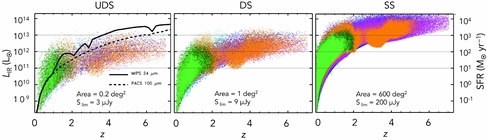
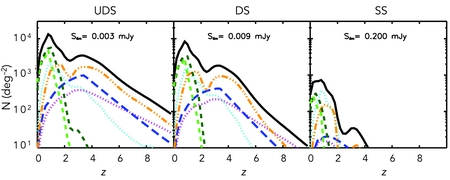
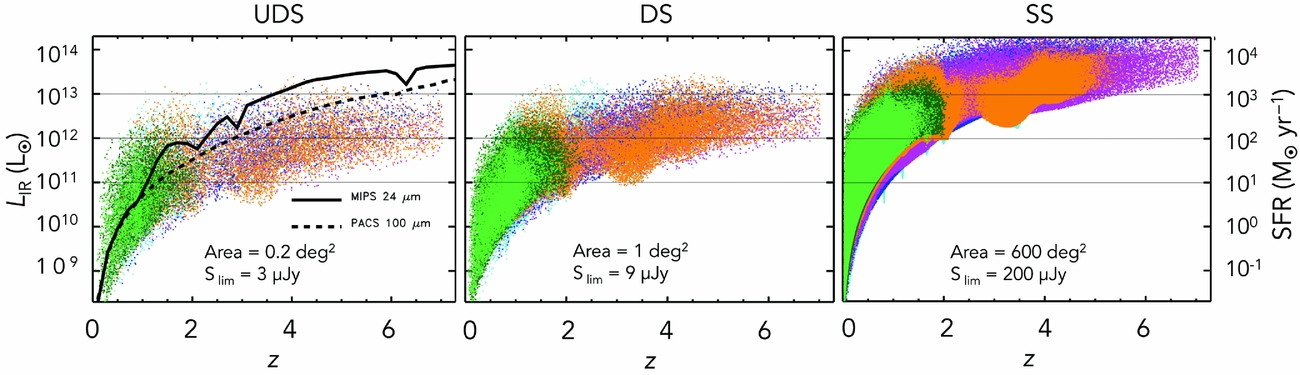
In term of evolutionary studies, to investigate the evolution of IR galaxies and AGN through their LF, the UDS will be crucial for sampling the faint end of the LF by detecting low luminosity IR sources at high redshifts (i.e., L IR ≃ 1011 − 11.5 L⊙ to z = 5–6, L IR ≃ 1012 L⊙ to z ≳ 6), while the DS will sample the knee of the IR LF, with a statistically significant number of galaxies. The SS, being unique in covering such a large area of the sky in IR, is expected to detect numerous bright IR sources to shape the bright-end of the LF with a very large statistics. In Figure 7, we show a simulation of the 8–1000µm integrated luminosity, i.e., L IR, (and the corresponding SFR obtained through the Kennicutt Reference Kennicutt1998 relation scaled for a Chabrier IMF) and the redshift distribution expected for the three planned surveys (left: UDS, middle: DS, right: SS). The different colours represent the evolution of the different SED-types, as defined and studied by Gruppioni et al. (Reference Gruppioni2013) and Pozzi et al. Reference Pozzi2015:
Expected total IR luminosity (SFR) as a function of redshift for the three photometric surveys planned with SPICA–SMI/CAM (left: UDS to 3µJy; middle: DS to 9µJy; right: SS to 0.2 mJy). The different colours of the points represent the behaviour of different SED-types: cyan, starburst; green, spiral; dark-green, SF-AGN(spiral); orange, SF-AGN(SB); magenta, AGN2; and blue, AGN1 (see Gruppioni et al. Reference Gruppioni2013 for details and the text for a brief description of these populations). For comparison, the limiting IR luminosity corresponding to the fluxes reached by the deepest surveys with Spitzer (MIPS 24µm) and Herschel (PACS 100µm) are shown in the left panel as black solid and dashed lines, respectively. The horizontal lines mark the LIRG, ULIRG, and HyLIRG limits.
-
• normal spiral galaxies (green);
-
• pure starburst sources (i.e., showing no signs of hosting an AGN, cyan);
-
• star-forming galaxies hosting an AGN, which can be either low-luminosity inside a spiral-like galaxy (SF-AGN(spiral), dark-green), or obscured within a starburst galaxy (SF-AGN(SB), orange);
-
• AGN-dominated sources, either optically unobscured (AGN1, blue) or obscured (AGN2, magenta).
Note that the distributions correspond to the effective area of the planned surveys: in the wide area, shallow survey the number of expected sources is far larger than in the deeper surveys, with a significant tail also at high redshift (>4–5), although it is mostly composed of extremely bright AGN-dominated sources (≳ 1013 L⊙). On the other hand, with the UDS, we expect to detect galaxies with L IR ≲ 1010 L⊙ up to z ~ 2, and L IR ≲ 1011 L⊙ up to z ~ 4.
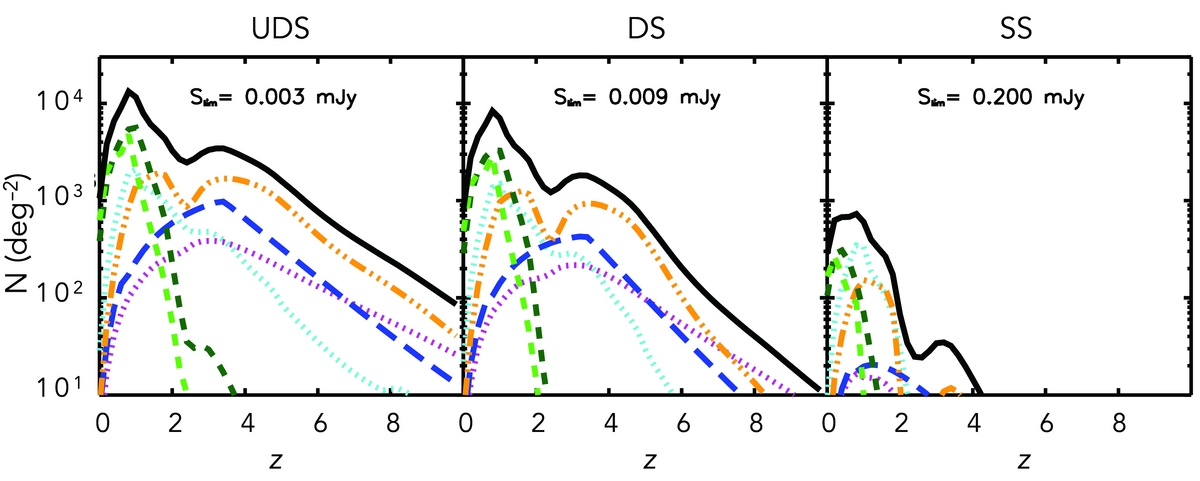
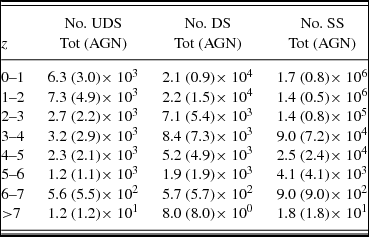
The estimated redshift distributions (per unit area, i.e. in deg−2) that could be obtained with the three SMI surveys are shown in Figure 8. These have been derived by considering the Herschel source evolution for the different IR populations described above, as found by Gruppioni et al. Reference Gruppioni2013 and further modelled to higher redshifts by Pozzi et al. Reference Pozzi2015, using a backward phenomenological approach, combined with spectrophotometric evolution of dust and SED evolution. Note that the estimates here have been extrapolated to z ≃ 10 by considering the evolutions derived by Pozzi et al. (Reference Pozzi2015) up to z ≃ 5. The distributions are shown per unit area, to give the idea of the different numbers and relative population contributions obtainable at different redshifts to different flux depths; these need to be scaled for the real area of each survey to derive the expected numbers in each of the planned configurations (in Table 1, we present the effective numbers within the planned areas, while Figure 7 shows a visual comparison between the surveys in terms of source density and depth). Note that the numbers given in Table 1 are simply for redshift intervals regardless of luminosity; even if the three surveys appear similar in terms of source numbers, one must consider also the reachable luminosities when planning a survey. The different luminosities reached at the different redshifts by the three planned surveys are clearly shown in Figure 7.
Expected redshift distributions for the SMI photometric surveys (per square degree). The different lines and colours correspond to the different IR galaxy and AGN populations, of Figure 7 (see caption and text description). The black solid line is the total redshift distribution, obtained by summing all the different populations. The estimates are based on the Herschel LF evolution found by Gruppioni et al. (Reference Gruppioni2013), as revised by Pozzi et al. (Reference Pozzi2015).
Expected no. of sources in the SMI 34-µm survey.
According to the model considered here (reproducing the latest Herschel results), as we go deeper in flux, the higher z tail becomes increasingly dominated by star-forming galaxies hosting an obscured AGN (SF-AGN(SB); orange points and dot-dashed line in Figures 7 and 8, respectively). These galaxies will eventually outnumber the AGN-dominated objects (AGN1 and AGN2; blue and magenta), which prevail at the brighter fluxes at high-z. Therefore, the UDS at high-z will be dominated by elusive/obscured AGN hosted by SF galaxies (likely to be the obscured phase preceding the AGN-bright epoch), making it even more important to develop a reliable tool for selecting and identifying this kind of object and for separating the SF from the AGN contribution. This scenario is based on models, while it is necessary to measure the high-z IR populations through photometric surveys. In order to investigate the nature of the faint/high-z mid-IR sources, we will need to follow-up the SMI/CAM 34-µm detections in other bands such as optical, far-IR, sub-mm, and X-ray.
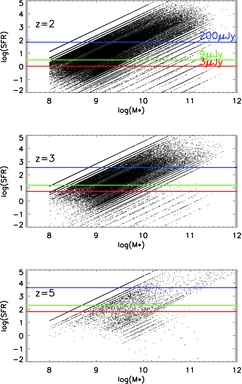
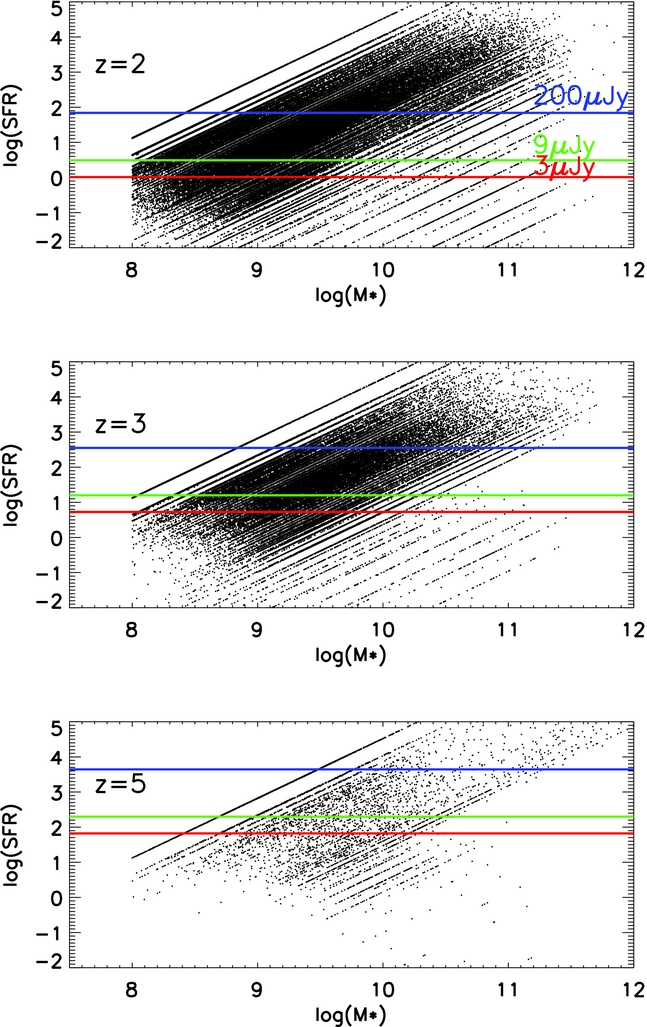
In Figure 9, we show the SFR-stellar mass relation (also called the ‘main-sequence’, MS), found by several authors for star-forming galaxies over a wide range of redshifts and luminosities (e.g., Noeske et al. Reference Noeske2007; Elbaz et al. Reference Elbaz2007; Daddi et al. Reference Daddi2007; Rodighiero et al. Reference Rodighiero2011), as derived for the COSMOS survey (Laigle et al. Reference Laigle2016) in bins of photometric redshift up to z = 5. The SFRs have been computed using a standard SED-fitting method in the UV/optical domain (by assuming discrete values of the SF histories, extinction, and stellar ages, responsible for the parallel stripes). The horizontal lines show the accessible SFRs reaching 3, 9, and 200µJy with a 34-µm survey (limiting fluxes of the UDS, DS, and SS, respectively). With the UDS (red lines), we will be able to study the SF population lying along the MS at z = 3, and most of them at z = 5. The DS will be able to recover most of the SFR–M* relation for SF galaxies at z = 3, while the SS already at $z{_<\atop ^{\sim }}2$
will be useful for studying the populations lying above the line, corresponding to objects with more intense SFRs.
$z{_<\atop ^{\sim }}2$
will be useful for studying the populations lying above the line, corresponding to objects with more intense SFRs.
The SFR versus stellar mass relation (MS) at z = 2, 3 and 5, as drawn from the COSMOS survey (Laigle et al. 2016). Small black dots have been selected from the COSMOS sample in bins of photometric redshift, with SFR computed from a standard optical/UV SED-fitting procedure. We show with horizontal solid lines the predictions for the level of SFR reachable by the proposed SPICA photometric surveys at 34µm. Different colours mark the three depths for the deep (red, 3µJy) medium (green, 9 µJy) and shallow (red, 200µJy) surveys. Clearly, only with the deeper integrations will SPICA be able to probe the bulk of the MS SF galaxies (at least up to z = 3). At larger redshifts (z > 3), we will rely on statistical stacking techniques.
The proposed SPICA photometric survey, as planned above, would be complementary to those expected to be carried out with JWST, ALMA, and the Square Kilometre Array (SKA, operating at radio wavelengths). While the SMI/CAM will lack the very HR of JWST–MIRI and ALMA, it will be much more efficient in mapping large fields, detecting large numbers of mid-IR sources. ALMA is ideal for carrying out HR observations of high-z sources (detecting sources easily up to z = 10), given its extremely high sensitivity and the k-correction becoming negative at millimetre (mm) wavelengths. However, given its small FoV (i.e., around 1arcmin × 1 arcmin at 115 GHz, Band 3), ALMA is not efficient for observing large areas of the sky. It is, however, crucial for constraining the peak of dust re-emission due to SF (and measuring the SFR) in high-z sources.
Deep mid-IR surveys are planned with JWST, which in just a few years time will perform high-sensitivity observations of galaxies at near-/mid-IR wavelengths with HR imaging spectroscopy. These observations will be already completed by the time SPICA will fly, and could be used to complement and test the validity of the SPICA survey data. However, analogously to ALMA, JWST–MIRI will observe only small areas of the sky (i.e., the FoV of the mid-IR instrument MIRI is only 1.25arcmin × 1.88 arcmin).
The SKA Phase 1 multi-tiered survey envisaged by Prandoni & Seymour (Reference Prandoni and Seymour2015) at 1–10 GHz is expected to reach SFR levels comparable to those of SPICA and similar redshifts. These observations, already in hand at the time SPICA is expected to fly, combined with the SMI/CAM survey data will allow to determine the validity and to study the evolution of the radio-IR correlation up to z ≃ 6. SMI/CAM will provide identification for the dusty SKA 1 sources and a crucial photometric point probing warm dust, allowing a better separation between AGN and star-forming galaxies.
Thanks to the large FoV (10arcmin × 12 arcmin) and the mapping speed of over 100 times faster than its mid-IR predecessor JWST (see Kaneda et al. Reference Kaneda and MacEwen2016), SMI/CAM on SPICA will easily cover significantly wider areas of the sky. The main advantages of a larger area lie in the detection of statistically significant numbers of sources spanning a wide range of redshifts and luminosities (crucial for evolutionary studies, e.g., the LF at different redshifts), the discovery of rare objects and the coverage of large volumes of the sky needed for large-scale structure studies.
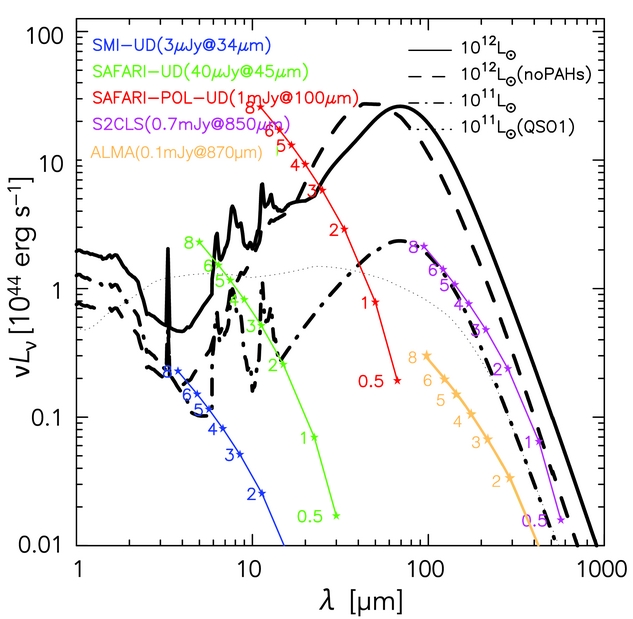
In Figure 10, we show an example of the detectability of sources of different SED types (e.g., LIRG, ULIRG with and without PAHs, and QSO) by SPICA (SMI/CAM, SAFARI in photometric mode and SAFARI-POL), ALMA, and SCUBA-2. Note that these are all local template SEDs, thus they might be different at high-z; however, the indication from the figure is that SMI/CAM will be able to detect sources with these SEDs up to high redshifts (z > 6) in the UDS, while SAFARI-POL will be mostly useful in the SS, since it will reach z ≃ 3–4 only for the ULIRGs. The coloured curves in Figure 10 show the (confusion) limits of the different instruments at different redshifts (as described in the figure caption). It is evident how such SEDs will be easily detected by ALMA up to very high redshifts (i.e., >8); this is a crucial point for those sources not identified by any other means (e.g., through SAFARI spectroscopy), which will be fully characterised by follow-up observations with ALMA and the next generation of ELTs.
Predicted detectability of sources of different SED types (LIRG and ULIRG with and without PAHs, QSO) by SPICA (SMI, SAFARI, and SAFARI/POL, compared to ALMA and SCUBA-2. The coloured curves show the (5σ confusion) limits of the different instruments/facilities at different redshifts, with the small stars corresponding to the listed values (blue: SMI; green: SAFARI photometry at 45µm; red: SAFARI/POL at 100 µm; magenta: SCUBA-2 at 850µm; orange: ALMA Band 8 at 870µm).
5 BROADBAND FOOTPRINTS OF DISTANT, OBSCURED, AND COMPTON-THICK AGN
The synergy and complementarity of the capabilities of both SPICA and ATHENA, which are foreseen to operate during the same period (launch at the end of the 2020s) would probe the full cosmic history of BH accretion, regardless of obscuration. The new window in the 30–37µm range, that can only be explored by SPICA, will be crucial for detecting the mid-IR excess of CT sources up to z ≃ 6–7 (sampling warm dust at rest-frame 4–5µm at those redshifts). These AGN are believed to be responsible for most of the power produced by accretion in the Universe (e.g., Gilli et al. Reference Gilli, Comastri and Hasinger2007; Treister et al. Reference Treister, Urry and Virani2009) and therefore are likely to represent a crucial phase in the joint evolution of galaxies and AGN. Due to the powerful capability of the 30–37µm band for detecting AGN at high-z, a degree-scale SMI photometric survey at 34µm is an optimal way to answer the following key questions: What were the formation sites and hosts of the first SMBHs at the highest accessible redshifts (z up to 6–7)? Did SMBHs form from small, low-mass seeds (~102M⊙) and accrete above the Eddington limit, or did they form from intermediate-mass seeds (~102 − 5M⊙) and accrete at or below the Eddington limit? Did they form instead by direct collapse of BHs?
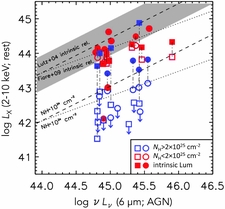
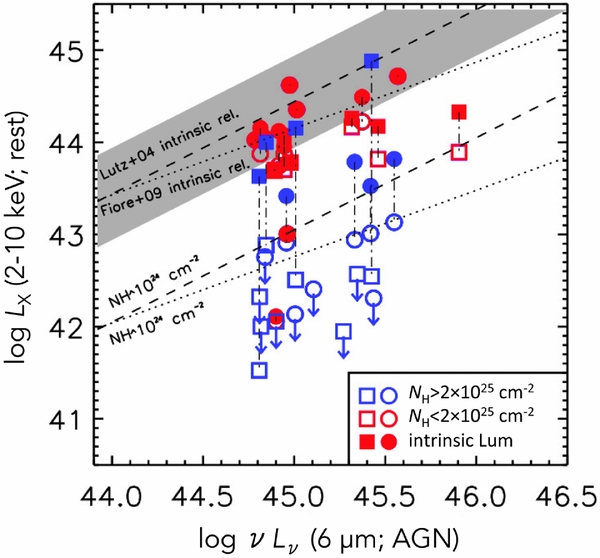
A significant fraction (about 30%) of the mid-IR selected AGN at z ≃ 2 are undetected in the current deep X-ray surveys (e.g., Fiore et al. Reference Fiore2008; Del Moro et al. Reference Del Moro2016) and not even the future X-ray missions such as ATHENA (i.e., the ESA L2 mission expected to fly in 2028; Nandra et al. Reference Nandra2013) will be able to reveal all of them (e.g., still ~20% of all the SMBHs and up to 50% of the CT AGN could be X-ray silent and identifiable only through mid-IR observations; Comastri et al. Reference Comastri, Gilli, Marconi, Risaliti and Salvati2015). Figure 11, from Del Moro et al. (Reference Del Moro2016), shows the X-ray luminosities against the 6-µm luminosities (considered as a proxy of the AGN luminosity) for a sample of mid-IR luminous quasars at 1 < z < 3, identified through detailed SED analyses in the GOODS-Herschel fields; despite being very bright in the mid-IR band, about 30% of these quasars are not detected in the extremely deep Chandra X-ray data available in these fields (even the reflection spectrum and the usually strong Fe Kα line at 6.4 keV are buried) and a large fraction are found to be CT (24–48%). This would mean that a large part of the cosmic X-ray background arises from a population mostly undetectable by current and future X-ray surveys, with nuclear obscuring column densities even higher than NH ≃ 1025 cm−2 (e.g., Comastri et al. Reference Comastri, Gilli, Marconi, Risaliti and Salvati2015). Current estimates of the fraction of these CT systems range from a few percent to over 50% of the overall obscured AGN population (e.g., Brightman & Nandra Reference Brightman and Nandra2011).
X-ray luminosity (2–10 keV rest-frame) versus AGN rest-frame 6µm luminosity (in units of erg s−1) calculated from the SEDs; the observed X-ray luminosity (not corrected for absorption) is plotted with open symbols, while the intrinsic luminosity, i.e., corrected for the NH measured from the X-ray spectra, is plotted with filled symbols. Unobscured and moderately obscured quasars (NH < 2 × 1023 cm−2) are plotted in blue, while the heavily obscured sources (NH > 2 × 1023 cm−2) are plotted in red. Circles and squares correspond to sources in GOODS-N and -S, respectively. The shaded region represents the scatter of the intrinsic L 6µm–L X relation found by Lutz et al. (Reference Lutz, Maiolino, Spoon and Moorwood2004), shown as dashed line, while the dotted line represents the relation found by Fiore et al. (Reference Fiore2009).
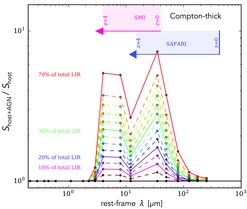
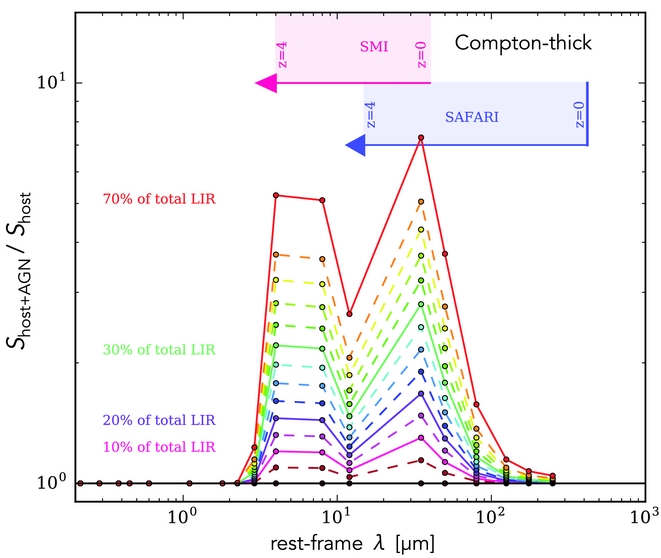
Deep mid-IR (spectro)-photometric surveys will push the search for heavily obscured AGN to higher redshifts and significantly lower sensitivity levels than ever achieved before, which, together with multi-wavelength ancillary information and IR spectroscopy, will provide complete samples of heavily obscured and CT AGN. In fact, most of the CT sources missed by the deepest X-ray surveys reveal themselves in the mid-IR, thanks to the warm emission from the circum-nuclear dust (i.e., torus) around the central accretion disk. This warm emission manifests itself as a mid-IR excess, with the emission from the AGN-heated dust significantly adding to the mid-IR SED of a galaxy. Indeed, in Figure 12, we show the ratio between a set of simulated SEDs in which we added the contribution of a CT AGN to the SED of the host galaxy (see Ciesla et al. Reference Ciesla2015, for more details). The candidate CT AGN could be selected from deep 34-µm photometric observations, then followed-up by SAFARI, with their fine-structure lines (if detectable in HR spectroscopy) allowing a precise measurement of their redshifts, an accurate determination of the origin of the energy powering the IR emission (SF versus AGN) and, finally, a reliable evaluation of the bolometric luminosity of the AGN emission. The contribution of the AGN to the total IR luminosity varies from 10 to 70%. It is clear that the spectral regions in which we expect the CT AGN to affect the most of the host galaxy SED is between 3–12 µm and 20–100 µm in the rest frame. As shown on Figure 12, these ranges are perfectly probed by SMI and SAFARI. By selecting mid-IR sources with faint near-IR and optical emission, Daddi et al. (Reference Daddi2007) and Fiore et al. (Reference Fiore2008) suggest that several mid-IR excess sources in the Chandra Deep Field-South can be obscured AGN at 1 ⩽ z ⩽ 3, on the basis of stacking techniques applied to X-ray wavelengths. The combination of both the 34-µm (SMI) and the 100-µm (SAFARI) data points can be used with models of circum-nuclear dust emission (e.g., Efstathiou & Rowan-Robinson Reference Efstathiou and Rowan-Robinson1995; Fritz, Franceschini, & Hatziminaoglou Reference Fritz, Franceschini and Hatziminaoglou2006; Nenkova et al. Reference Nenkova, Sirocky, Nikutta, Ivezić and Elitzur2008; Hönig & Kishimoto Reference Hönig and Kishimoto2010; Feltre et al. Reference Feltre, Hatziminaoglou, Fritz and Franceschini2010) and star-forming galaxy templates to separate the part of the luminosity originating from accretion onto a BH from that due to SF. This is an advantage over the information provided by Herschel and the JWST, which will miss the mid- and far-IR channels, respectively. Performing this kind of survey for the crucial z ~1–4 epoch over degree-size fields, with a single mission in a reasonable amount of time, is beyond the reach of any current or planned facilities other than SPICA.
Ratios between the SEDs of a galaxy hosting a CT AGN and the SED of the same galaxy without AGN emission. The different coloured lines indicate different contributions of the AGN luminosity to the total IR luminosity, from 10 to 70%. The spectral regions probed by SMI/CAM (30–37µm) and SAFARI/POL (100–350µm), in photometric mode, from redshift 0 to 4, are indicated with the red and blue regions, respectively, and correspond to the rest-frame spectral range where we expect the AGN to impact the most its host galaxy SED. SPICA (SMI + SAFARI) will cover the entire mid-/far-IR bolometric output of these sources, disentangling the AGN from the SF galaxies (what Herschel could not do without a mid-IR channel).
The AGN population currently known at z ≃ 6–7 consists of luminous optical quasars (e.g., Fan Reference Fan2003, Gallerani et al. Reference Gallerani, Fan, Maiolino and Pacucci2017) and although these objects host the most massive BHs (>109 M⊙) in the Universe, they are extremely rare. At these redshifts, typical AGN, which are of lower luminosity and often obscured and/or diluted by their host galaxy emission, remain largely undiscovered. X-ray selection has provided the most robust AGN samples to date, but finding the most obscured objects has proved challenging. To date, no obscured AGN have been identified at z > 5 (the most distant known is at z = 4.75; Gilli et al. Reference Gilli2014). Recently, some AGN have been identified in low metallicity systems, lacking X-ray emission (Simmonds et al. Reference Simmonds, Bauer, Thuan, Izotov, Stern and Harrison2016). Therefore, a complete census of the AGN population and a complete BHARD estimate, would require a selection complementary to X-ray (e.g., in the IR). SPICA will be able to detect heavily CT AGN, i.e., those that are fully or almost fully enshrouded and embedded in dust, so that even the reflection spectrum and the Fe Kα line at 6.4 keV lie buried and undetected at X-ray energies.
The relative abundance of weak and powerful AGN (independently of obscuration) as a function of cosmic time and host galaxy properties, is a vital ingredient of any attempt to clarify the entangled history of the galaxies and their active nuclei. At low AGN luminosities, where the host galaxy emission may limit the mid-IR target selection, there are obvious synergies with ATHENA, which is expected to reveal hundreds of mildly CT AGN: IR spectroscopy with SPICA would allow us to fully characterise these sources. Among the scientific goals of ATHENA is, in fact, the detection of a few hundreds of z > 6 AGN—which could be followed-up by deep SPICA–SMI photometry and SAFARI spectroscopy—and a few tens of CT AGN at 1 < z < 4 (Aird et al. Reference Aird2013). The CT AGN are expected to be hosted in galaxies as faint as A mission ≃ 28mag (AB) in the optical/near-IR. At these depths, the source density is expected to be about 1 arcsec−2 (Guo et al. Reference Guo, White, Angulo, Henriques, Lemson, Boylan-Kolchin, Thomas and Short2013), corresponding to three optical sources within the ATHENA WFI FoV/error circle. It will therefore be challenging to identify the correct counterpart of the X-ray emitter (although Bayesian methods might help).
A survey centred at 34µm down to (or below) the estimated confusion limit (like the one described in the previous section) would be sensitive to moderate luminosity (L
IR ~ 1011 L⊙) obscured AGN out to z ≃ 5–6, and particularly in the $3\le z{_<\atop ^{\sim }}6$
range, where the co-evolution of SF and accretion activity is expected to already be in place. It will also be sensitive to lower luminosity/Seyfert-like AGN (L
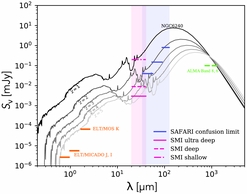
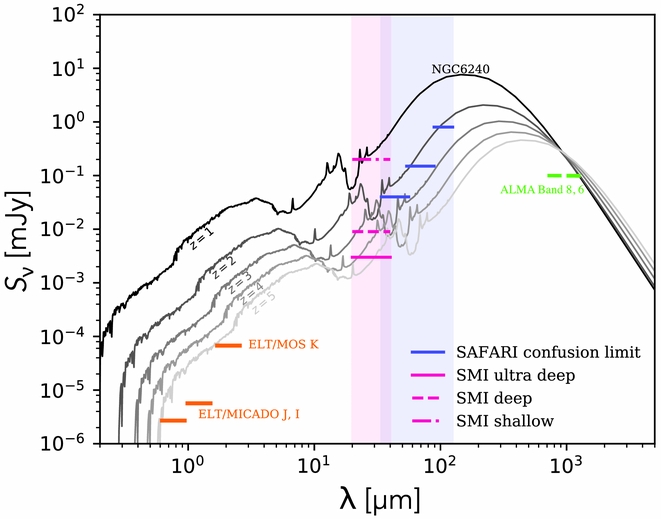
IR ~ 1010 L⊙) to z ≃2 (see Figure 7). In Figure 13, we show an example of the expected SPICA detectability of the local CT AGN NGC6240, classified as LIRG (L
IR = 7 × 10¹¹ L⊙): SMI will be able to detect it up to z ≃ 5 (in the UDS), while follow-up observations with SAFARI for such an object will be possible only up to z ≃ 2–2.5, even in the SAFARI’s less confused photometric bands (i.e., 45 and 72µm). ELTs and ALMA will be able to easily detect sources similar to NGC6240 out to z ≃ 5 in a few minutes up to hours, and to higher redshifts by integrating for longer than considered in the plot.
$3\le z{_<\atop ^{\sim }}6$
range, where the co-evolution of SF and accretion activity is expected to already be in place. It will also be sensitive to lower luminosity/Seyfert-like AGN (L
IR ~ 1010 L⊙) to z ≃2 (see Figure 7). In Figure 13, we show an example of the expected SPICA detectability of the local CT AGN NGC6240, classified as LIRG (L
IR = 7 × 10¹¹ L⊙): SMI will be able to detect it up to z ≃ 5 (in the UDS), while follow-up observations with SAFARI for such an object will be possible only up to z ≃ 2–2.5, even in the SAFARI’s less confused photometric bands (i.e., 45 and 72µm). ELTs and ALMA will be able to easily detect sources similar to NGC6240 out to z ≃ 5 in a few minutes up to hours, and to higher redshifts by integrating for longer than considered in the plot.
Template SED of the local CT AGN NGC6240 (obtained by fitting the observed data with CIGALE; http://cigale.lam.fr/), scaled by redshift up to z = 5. NGC6240 is a LIRG, with L IR = 7 × 10¹¹ L⊙. The pink and blue regions show the wavelength ranges sampled by SMI (30–37µm) and SAFARI (at 45, 72, and 100µm, over the bands 34–56 and 54–89µm in photometric mapping, and 75–125µm with SAFARI-POL), respectively, while the pink horizontal lines represent the limits of the Ultra-Deep, Deep, and Shallow reference surveys planned with SMI and described in Section 4. The blue horizontal lines show the confusion flux density for a 2.5-m telescope in the SAFARI bands. For comparison, ALMA (3σ, 5 h in Band 8 and 20 min in Band 6, green horizontal lines), ELT/MOS and ELT/MICADO (3 h, orange horizontal lines) detection limits are shown.
6 STAR-FORMING GALAXIES AT $z {_>\atop ^{\sim }}4$

Observing distant galaxies in the far-IR/sub-mm is challenging and only the brightest objects, experiencing a burst of SF activity can be directly detected (e.g., Pope et al. Reference Pope2006; Capak et al. Reference Capak2011; Riechers et al. Reference Riechers2013). However, they have extreme SF properties and IR luminosities, but low spatial densities, and are not representative of the high-redshift galaxy population at z = 3–4. This is, for instance, the case for GN20 (Daddi et al. Reference Daddi2009) at z = 4.05, one of the best studied sub-mm galaxies at z > 4, showing a 6.2-µm PAH feature (Riechers et al. Reference Riechers2014), and COSMOS AzTEC-1 at z = 4.3, studied by Yun et al. (Reference Yun2015).
To probe the typical properties of the bulk of the galaxy population at z > 3, stacking analyses have been developed to study the average SFR and the gas mass of galaxies not individually detected with the deepest Herschel images (e.g., Magdis et al. Reference Magdis2012; Heinis et al. Reference Heinis2014; Schreiber et al. Reference Schreiber2015; Béthermin et al. Reference Béthermin2015; Tomczak et al. Reference Tomczak2016). ALMA has allowed us to detect less extreme galaxies at z ⩾ 4 (Capak et al. Reference Capak2015; Maiolino et al. Reference Maiolino2015; Scoville et al. Reference Scoville2016), but these samples are mostly based on UV-selected samples, biased significantly against massive galaxies (Spitler et al. Reference Spitler2014; Wang et al. Reference Wang2016), and lack of statistics. Recently, Schreiber et al. (Reference Schreiber, Pannella, Leiton, Elbaz, Wang, Okumura and Labbé2017) observed a sample of a hundred massive galaxies (M* > 5 × 10¹⁰ M⊙) at z ≃ 4 with ALMA. A third of the sample was detected, revealing that the MS relation of galaxies was already in place at this redshift, and they derived an average dust temperature of 40 K for z = 4 galaxies. This dust temperature is higher than what was determined for lower redshift galaxies and indeed GN20, i.e., 33 K (Magdis et al. Reference Magdis2012), implying IR emission peaking at slightly shorter wavelengths. This would make the bulk of high redshift galaxies easily detectable by SPICA.
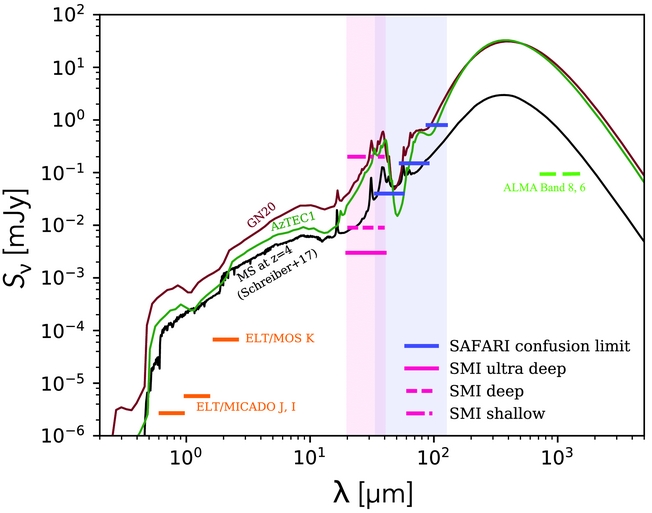
Figure 14 shows the SED of the typical MS galaxies at z = 4 detected by Schreiber et al. (Reference Schreiber, Pannella, Leiton, Elbaz, Wang, Okumura and Labbé2017) at 870 µm with ALMA (discussed above), as well as the SEDs of the two starbursts GN20 and AzTEC-1. Note that it is likely that some of the MS galaxies that have been considered to derive the average template might contain an AGN, thus this source cannot be considered as a ‘normal’ SF galaxy (as it is referred to). A survey with SMI/CAM will easily allow us to build a statistically significant sample of z ≃ 3–5 MS galaxies, removing the biases suffered from previous studies of individual extremely luminous objects. Figure 14 shows that in the SMI/CAM DS (reaching confusion at 34 µm), we would be able to detect galaxies with SEDs similar to these templates at least out to z ≃ 4 and beyond (in the UDS). Dusty galaxies like GN20 and AzTEC-1 could be followed-up in at least two bands (i.e., 45 and 72 µm) by SAFARI in photometric mode at least out to z ~ 4, while a galaxy similar to the average MS template could be detected by SAFARI at 45 µm (but not beyond z ~ 4). For the follow-up of normal MS star-forming galaxies, ALMA and ELTs will be necessary. As shown in the plot, ALMA and E-ELT in a very short time (from few minutes to few hours) will reach fluxes significantly fainter than those needed to detect these z = 4 sources, being able to easily identify galaxies with such SEDs up to much higher redshifts and/or fainter luminosities.
Fits to the observed SEDs of: the z ≃ 4 starburst galaxy GN20 (purple); and the z = 4.34 sub-mm galaxy AzTEC-1 (green). These are both fitted with the models of Efstathiou & Siebenmorgen (Reference Efstathiou and Siebenmorgen2009), and the average z ≃ 4 MS galaxy observed by Schreiber et al. (Reference Schreiber, Pannella, Leiton, Elbaz, Wang, Okumura and Labbé2017) with ALMA (black). Pink horizontal lines represent the limits of the Ultra-Deep, Deep, and Shallow reference surveys planned with SMI and described in Section 4. The blue horizontal lines show the confusion flux for a 2.5-m telescope in the SAFARI bands. For comparison, ALMA (3σ, 5 h in Band 8 and 20 min in Band 6: green horizontal lines), ELT/MOS and ELT/MICADO (3 h, orange horizontal lines) detection limits are shown.
7 CONCLUSIONS
A multi-layer photometric survey at 34 µm with SPICA–SMI/CAM would enable the observations of galaxies and AGN to unprecedented depth, in an unexplored band between the JWST and the Herschel wavelength ranges. Such surveys will be sensitive enough to detect hundreds of z ~ 6 sources in a relatively small amount of time (~240 h in total) and have an FoV large enough to reveal tens of thousands of galaxies and AGN at z = 3–5. Due to the wavelength coverage and the efficiency in observing large areas of the sky, SPICA–SMI/CAM will be unique in its capability to scan the sky at IR wavelengths, studying the evolution of dusty galaxies with unprecedented statistics and depth and discovering new classes of objects, either faint, or rare or peculiar, i.e., sources not previously detected in any other bands. A UDS of 0.2 deg2, three times below the estimated confusion, a DS of 1 deg2 to confusion and an SS of 600 deg2 to 0.2 mJy can be considered as the best strategy for studying galaxy evolution with SPICA photometry, covering the faint-end, the knee, and the bright end of the LF up to high redshifts (z ≃ 6) with statistically significant samples of sources (at any redshifts and luminosities). The proposed ‘wedding-cake’ survey should be performed on popular and extensively observed fields, to take advantage of the great wealth of multi-wavelength information already available. Specific follow-up studies with ELTs and ALMA will be performed for sources lacking any identification in existing deep images and catalogues. The SPICA photometric surveys will be the only study able to derive the obscured SFRD and BHARD with large statistical samples up to the reionisation epoch, an epoch for which the only information available to date is derived using rest-frame UV observations, which are subject to large systematic uncertainties due to the presence of dust. These surveys will be the only way to obtain a complete census of highly obscured (e.g., CT) AGN and to shed light on the amount of dust in galaxies at z > 3–4, as well as to derive important clues about the evolution of galaxies and dust.
ACKNOWLEDGEMENTS
This paper is dedicated to the memory of Bruce Swinyard, who initiated the SPICA project in Europe, but sadly passed away on 2015 May 22 at the age of 52. He was ISO-LWS calibration scientist, Herschel-SPIRE instrument scientist, former European PI of SPICA, and design lead of SAFARI. This mission would not have been possible without the SAFARI consortium and the entire SPICA team.
We thank the anonymous referee, whose useful comments and suggestions helped improving this paper.