





Introduction
‘By the end of this winter everyone will be vaccinated, healed, or dead’, Jens Spahn (former German minister of public health)Footnote 1
The Secretary-General of the UN, Antonio Guterres, noted in 2018 that ‘our world is suffering from a bad case of ‘Trust Deficit Disorder’… people are losing faith in political establishments, polarization is on the rise and populism is on the march’ (Guterres Reference Guterres2018). He returned to this theme in April 2020 at the height of the first wave of COVID-19, calling trust in science and institutions a ‘vaccine against the disease of misinformation’ (Guterres Reference Guterres2020). Trust in institutions is crucial during crisis times, when information is scarce and uncertain and governments need to take emergency actions, outside the scope of ‘normal politics’ (van Middelaar Reference van Middelaar2021). Trust is essential in such circumstances, as individuals sense the urgency and pressure governments are facing when devising policy to address the challenges and threats to society brought by the crisis. In such situations, policy compliance is of high relevance. However, high levels of compliance may be difficult to achieve as citizens are bombarded with conflicting information from various sources and do not necessarily possess the knowledge to judge the accuracy of claims or the course of action proposed by experts and politicians. This is why buy-in from the public may be complemented by more coercive measures with the aim to increase compliance.
Our paper contributes to the literature on the role of institutional trust and coercion in shaping policy compliance, focusing on the case of vaccine hesitancy during the COVID-19 pandemic. The COVID-19 pandemic brought vaccination politics to the forefront. However, the issue of vaccination has been a politicized issue before and has been controversially discussed for other vaccination campaigns (Kennedy Reference Kennedy2019). What makes COVID-19 a special case and particularly suitable to examine the interplay between trust and coercion is the urgency and scale the vaccination campaign had at that time. Compared to ‘normal times’, vaccination against COVID-19 was deemed urgent to protect vulnerable groups, provide relief to hospitals, and allow the reopening of the economy. The scale of the campaign was also on a different level, as governments aimed to have upward of 90% of the population vaccinated to achieve ‘herd immunity’. They then needed to persuade the population to take ‘booster shots’ to maintain immunity.
Theoretically, we draw on a rich literature in policy studies that unpacks why citizens comply with government policies. We propose that compliance is primarily driven by individual-level trust in relevant domestic institutions and ideology. If trust, or ideology, is not enough for people to comply, governments can resort to coercive measures. However, there is little we know about how coercive measures affect policy compliance at varying degrees of institutional trust. In this paper, we focus on two possible scenarios. The first is an ‘amplifying’ scenario where the policy instrument and trust are jointly sufficient to increase compliance. Their effects would come on top of each other. In this scenario, low-trusting individuals would not react to the policy instrument. The second is a ‘compensation’ scenario, where either trust or the policy instrument is sufficient for higher compliance. Lacking one, the other would be sufficient for higher compliance. In this scenario, low-trusting individuals would see a stronger effect of the policy instrument, with a weaker or null effect for high-trusting individuals, who would get vaccinated even without the policy.
To empirically test the compensatory or amplifying nature of various factors that contribute to compliance, we rely on original data from the United Kingdom and Germany. The data were collected in September 2021. At that point in time, the vaccination drive in both countries was in full swing, but it showed signs of vaccination fatigue, while no end of the pandemic was in sight and a new variant of the virus (Omicron) loomed on the horizon. This situation caused public health experts and politicians to worry that the public health situation would deteriorate again during the winter. Using observational and experimental data, we show that trust in institutions and ideological beliefs are important predictors of whether citizens decide to get vaccinated. More specifically, we find that people supporting the populist radical-right are the least likely to follow the call to get vaccinated. This finding is in line with previous contributions to the field (ie Betsch, Schmid, Heinemeier et al. (Reference Betsch, Schmid, Heinemeier, Korn, Holtmann and Böhm2018); Nielsen and Lindvall (Reference Nielsen and Lindvall2021); Albrecht (Reference Albrecht2022); Backhaus, Hoven and Kawachi (Reference Backhaus, Hoven and Kawachi2023); Han, Zheng, Cristea et al. (Reference Han, Zheng, Cristea, Agostini, Bélanger, Gt¨zkow, Kreienkamp and Leander2023), among others). With a few exceptions, which we discuss in the results section, the motivation to get vaccinated is influenced by the same factors in Germany and in the United Kingdom.
The results of the second study show that the ‘green pass’ policy instrument significantly increased the willingness to get a booster shot for individuals already vaccinated in Germany but not in the United Kingdom, where most individuals already intended to comply, resulting in a ceiling effect. Overall, individuals not yet vaccinated are considerably more likely to do so if they trust political institutions. The implication of the findings of both studies is that trust has a ‘compensation’ effect with policy instruments. Trust also compensates for other policy measures, as trusting individuals are highly likely to get vaccinated with or without the ‘green pass’ policy incentive, while individuals with low levels of trust are more likely under the ‘green pass’ scenario.
The paper is structured as follows. In section Previous research and theoretical considerations, we offer a literature review that informs our argument and yields the guiding hypotheses. Section Research design provides background information on how the pandemic evolved in the United Kingdom and Germany with a focus on the period of vaccination roll-out and the public discourse surrounding this policy. We also touch upon key decisions in relation to the implementation of ‘COVID-certificates’ and so-called ‘green passes’. Subsequently, we present the research design and introduce the online survey experiment. In section Results, we discuss the results, and section Conclusion concludes.
Previous research and theoretical considerations
Determinants of voluntary compliance
There is ample evidence that trust, in particular institutional trust, is a powerful determinant of voluntary compliance with government policies (Devine Reference Devine2024). Higher levels of trust in government and its adjunct institutions are found to be positively related to voluntary compliance (Chanley, Rudolph and Rahn Reference Chanley, Rudolph and Rahn2000; Marien and Hooghe Reference Marien and Hooghe2011). High levels of trust in government and institutions have been associated with effectively implemented policies and the rule of law and indicate that a citizen is satisfied with government performance more broadly (Rothstein and Uslaner Reference Rothstein and Uslaner2005; Van der Meer and Hakhverdian Reference Van der Meer and Hakhverdian2017; Newton, Stolle and Zmerli Reference Newton, Stolle, Zmerli and Eric2018; Herreros Reference Herreros2023). Trust becomes particularly relevant in times of crisis and high levels of uncertainty (van Middelaar Reference van Middelaar2021; Lalot, Heering, Rullo et al. Reference Lalot, Heering, Rullo, Travaglino and Abrams2022), such as during the early stages of the pandemic, when many citizens felt threatened by the evolving (health) crisis. Studies show that in such situations, more trusting people are more likely to comply with mandated rules and regulations than citizens with lower levels of trust (Lalot, Heering, Rullo et al. Reference Lalot, Heering, Rullo, Travaglino and Abrams2022).
Recent contributions to the literature examining compliance with pandemic-related restrictions show that trust in government, and other relevant institutions, is positively correlated with the observance of mandated restrictions, such as social distancing rules or restrictions on people’s freedom to move, and vaccine uptake (Devine, Gaskell, Jennings et al. Reference Devine, Gaskell, Jennings and Stoker2021; Goldstein and Wiedemann Reference Goldstein and Wiedemann2022; Han, Zheng, Cristea et al. Reference Han, Zheng, Cristea, Agostini, Bélanger, Gt¨zkow, Kreienkamp and Leander2023; Devine, Valgardsson, Smith et al. Reference Devine, Valgardsson, Smith, Jennings, di Vettimo, Bunting and McKay2024; Green, Evans and Snow Reference Green, Evans and Snow2025). However, it remains unclear how trust interacts with policy measures and individual attitudes. We do not have a good understanding of whether those who trust more in institutions are also more likely to respond to other policy incentives, or whether policies can specifically target those with low trust. Similarly, we do not yet understand whether trust and other attitudes, such as ideology, amplify each other’s effects or not. Understanding these dynamics is crucial for designing effective policy interventions. If coercive policy only works on high-trusting individuals, who are already more likely to comply, then the policy would increase the gap between those with low and high trust.
We theorize two possible scenarios for how trust might interact with coercive policies and related individual attitudes such as ideology: trust as an ‘amplifier’ (‘amplification’ effect) and trust ‘compensating’ policies (‘compensation’ effect).Footnote 2 For simplicity, for the remainder of this discussion, we will only refer to trust and coercive policies, but the same logic applies to other individual attitudes such as ideology. An amplification effect means that the effects of trust and policy coercion combine and add up on top of each other. Consider a hypothetical example of how an educational intervention, such as an after-school program, might interact with student IQ to influence future test scores. In an amplification scenario, those with high IQs would benefit the most from the program and increase their test scores more than students with lower IQs. The gap between the two groups would widen with the intervention. In a compensation scenario, the intervention would have the highest impact for those with lower IQs, as they have more room to make gains. In this scenario, the gap between the two groups would narrow after the intervention.
In our case, if trust ‘amplifies’ the effects of coercive policy, we expect to find stronger positive effects for highly trusting individuals. Under this scenario, individuals with a higher level of trust may be more likely to get vaccinated under a coercive policy because they trust that the chosen policy instrument is necessary, and its use is legitimate. Compliance, in this scenario, would require both trust and coercion, while those with lower trust would not see much change. As a consequence, the gap between the two groups would widen. If, instead, trust and coercive policy instruments are ‘compensatory’, we expect to see stronger positive effects of policies for low-trusting individuals as they react to the prospect of sanctions or fines in cases of non-compliance. High-trusting individuals should be highly likely to get vaccinated even in the absence of the policy.Footnote 3 We remain agnostic as to which element is the compensatory one. The ‘compensation’ scenario simply claims that either element (trust or policy instrument) is sufficient to increase policy compliance and fill in for the missing part.
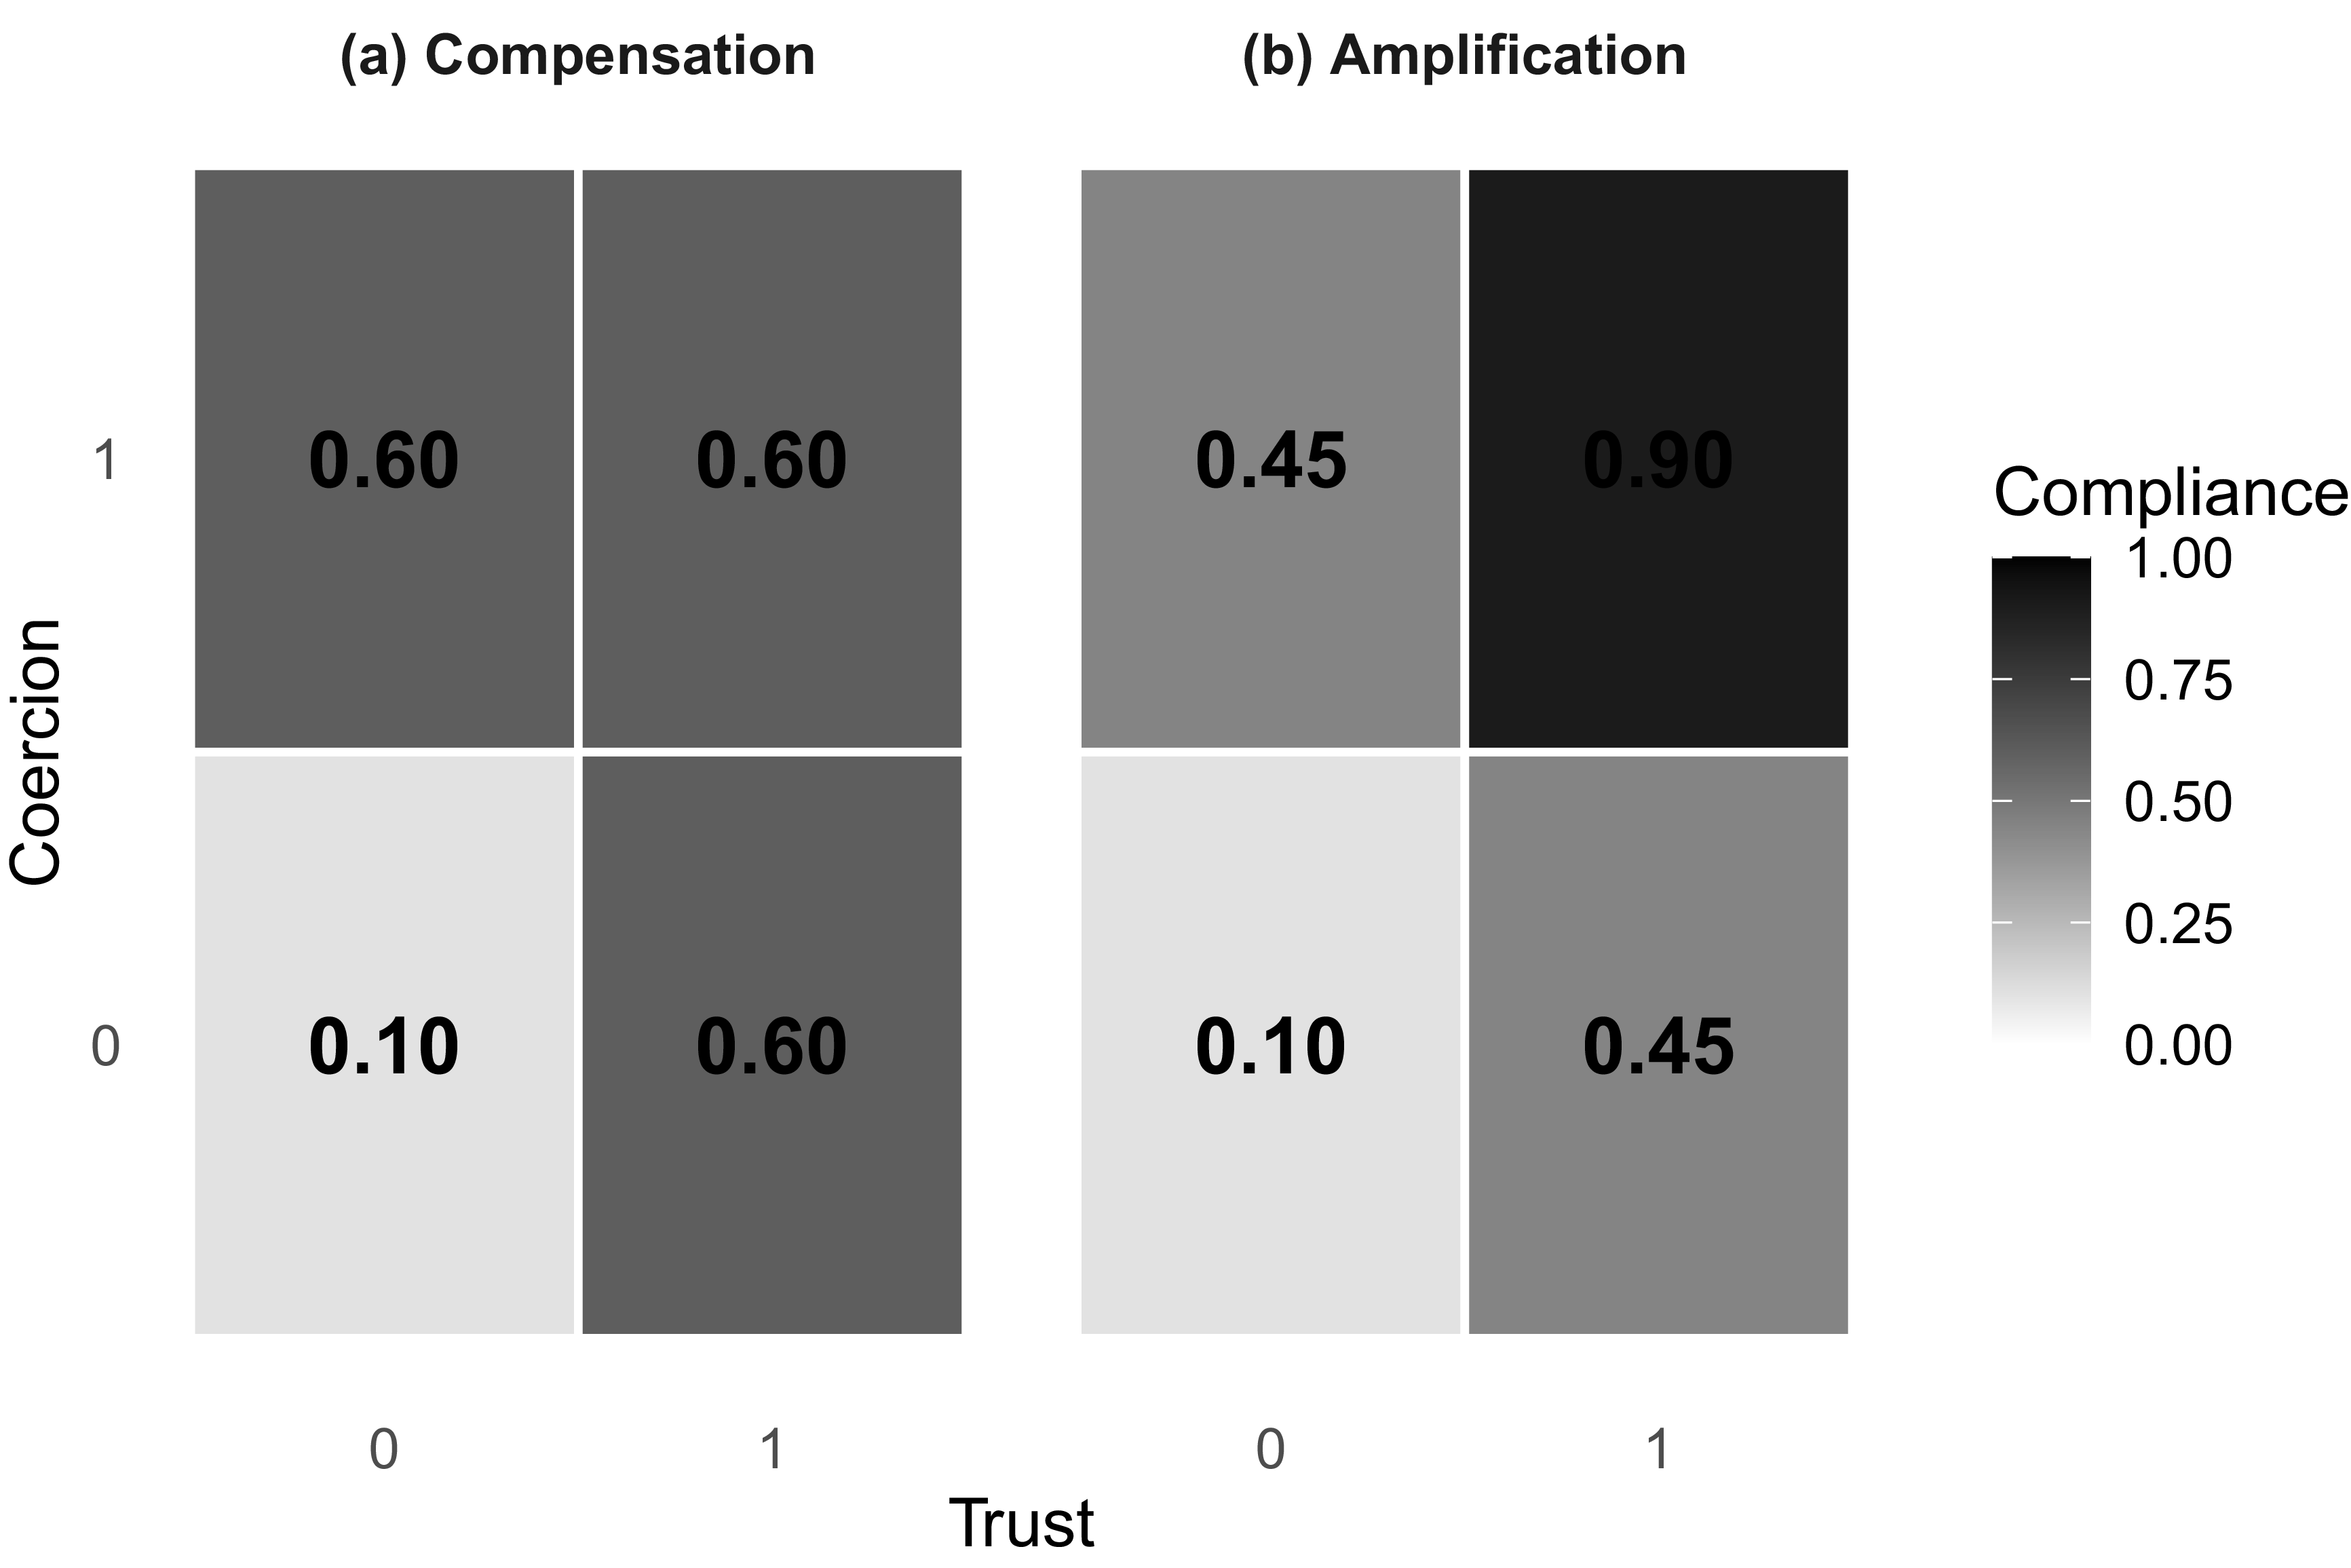
Figure 1 illustrates the difference in a 2 × 2 heat map. Panel (a) shows the compensatory effect. Moving from low coercion to high coercion has an effect for those not trusting (0.5 increase moving from the bottom left cell to the upper left cell), but no additional effect for those who trust (an effect of 0 moving from the top left cell to the top right cell). Conversely, the effect of increasing trust is negligible for those already affected by coercion, but important for those without coercion. Panel (b) shows the amplification effect. The effect of policy coercion for those not trusting is now 0.35, moving from the bottom left cell to the upper left cell. Now there is an additional effect for those who trust, of 0.45 when moving from the top left cell to the top right cell. The two effects now amplify each other, and it is those with high trust and subject to coercion who are most likely to comply. Notice that the overall effect is the same. It is the distribution of the effect among the cells that is captured by our two scenarios.
Illustration of compensation vs. amplification effects.

We propose that trust in the government, health institutions, and the health industry helps citizens to better handle situations in which information to assess the course of action proposed by the government and health experts is limited. In the case of COVID-19, the level of uncertainty was very high, first due to the novelty of the threat (new type of disease) and later due to the novel type of vaccination that became available to citizens in early spring 2021. Because institutional trust also extends to policies mandated and supported by the relevant institutions (Levi and Stoker Reference Levi and Stoker2000; Rothstein and Stolle Reference Rothstein and Stolle2008), we expect people with higher levels of trust – on average – to have a significantly higher likelihood of getting vaccinated than citizens that have a lower level of trust. Furthermore, we propose that higher levels of trust among non-vaccinated citizens increase the likelihood to eventually get vaccinated. We therefore expect trust to be ‘compensatory’ with policies and individual characteristics, rather than ‘amplify’ them. However, we form contrasting hypotheses to test the two divergent mechanisms.
In addition to trust (whether in its amplifying or compensating form), a citizen’s ideological disposition also influences how they perceive and evaluate their governments’ policy advice. We expect that citizens who situate themselves more to the left are more likely to comply with government policy to get vaccinated due to their – on average – higher level of prosocial behavior (Schubach and Thielmann Reference Schubach and Thielmann2025), while citizens who are more on the right of the political spectrum are less likely to comply with the vaccination mandate. The underlying mechanism that informs this proposition is that citizens who are more conservative and economically liberal are – on average – less supportive of policies that conflict with an individual’s self-determination and personal freedom. Citizens on the conservative spectrum are also less supportive of state interventions than citizens who position themselves more on the left of the political spectrum (Feldman Reference Feldman and Leonie2013).
Furthermore, compliance often comes with (immaterial) personal costs and unclear benefits (Scholz and Lubell Reference Scholz and Lubell1998). This was in particular the case with the vaccination mandate as the virus was not perceived as a threat by some groups within the society, while their cooperation was still needed to achieve immunity levels high enough for vulnerable groups to be protected. There is evidence that citizens who are more on the left of the political spectrum are more solidaristic and socio-tropic and therefore more concerned with the overall public health situation than citizens who position themselves more on the right side of the political spectrum (see Piurko, Schwartz and Davidov (Reference Piurko, Schwartz and Davidov2011); Evans and Neundorf (Reference Evans and Neundorf2020)). Based on this, we expect respondents who place themselves more to the left of the political spectrum to comply – on average – more with the vaccination mandate than respondents on the right of the spectrum.
During COVID, in particular during its early stages, decisions affecting people’s everyday life were taken under severe time pressure, with limited knowledge and deliberation. Many of the policies to contain the virus were suggested by health experts and implemented in a top-down manner. Decision-making processes took place outside of regular legislative processes, or legislative processes were significantly cut short. This instigated criticism and opposition from populist parties and their supporters (Rovny, Bakker, Hooghe et al. Reference Rovny, Bakker, Hooghe, Jolly, Marks, Polk, Steenbergen and Anna Vachudova2022; Schwörer and Fernández-García Reference Schwörer and Fernández-García2022). The criticism voiced by these parties was rooted in their critical view of experts and the ruling elites, and the fact that decisions taken would ignore the ‘will of the common people’.
The relationship between populism, institutional distrust, and policy compliance is theoretically complex and potentially circular. Institutional distrust has been shown to be a determinant of support for populist parties (Geurkink, Zaslove and Jacobs Reference Geurkink, Zaslove and Jacobs2020), with populist rhetoric that deepens distrust over time. This dynamic can create a self-reinforcing cycle (Hooghe and Dassonneville Reference Hooghe and Dassonneville2018). This dynamic extends specifically to (scientific) experts and health institutions through what scholars term ‘science-related populism’ (Mede and Schäfer Reference Mede and Schäfer2020): the belief that academic elites ignore ordinary people’s common sense when determining what constitutes legitimate knowledge. Given this, citizens who support populist parties may be particularly resistant to both trust-based appeals (or voluntary compliance with government-mandated policies and expert-driven recommendations). Whether coercive policies compensate for this distrust or amplify populist resistance remains an open empirical question that our design allows us to test. Given this, we also expect supporters of populist parties to be more skeptical of the vaccination mandate and more likely to not be vaccinated.Footnote 4
Hypotheses:
H1a: Trust in institutions compensates for other reasons why individuals might not get vaccinated. Trust should have a stronger effect for populist voters, those dissatisfied with COVID policy, and the unvaccinated.
H1b: Trust in institutions amplifies other reasons why individuals might not get vaccinated. Trust should have a weaker effect for populist voters, those dissatisfied with COVID policy, and the unvaccinated.
Coercive policy to increase vaccine uptake
If voluntary compliance with the policies implemented is not sufficient, governments can raise the costs of non-compliance for citizens. Such costs can take different forms. During the pandemic, the majority of countries, for example, fined people when violating social distancing rules, lockdowns, or other measures taken to contain the pandemic.Footnote 5 When it comes to vaccination, however, fining people for not complying with the mandate is incompatible with citizens’ right to physical integrity. This is why a variety of other strategies to incentivize vaccination take-up were implemented. In line with already existing knowledge (see ie Betsch, Schmid, Heinemeier et al. (Reference Betsch, Schmid, Heinemeier, Korn, Holtmann and Böhm2018)), COVID-19 vaccines were administered free of charge, and public authorities aimed to make it as easy as possible for citizens to obtain vaccination appointments. Given the novelty of the disease and the vaccine, governments and relevant other actors also engaged in large information campaigns to build confidence in the vaccine and educate citizens.Footnote 6
However, governments realized that free and easy access and the effort to build confidence in the newly developed vaccines did not yield sufficiently high numbers of vaccinated citizens. To avoid that the public health systems would be overburdened again during the fall and winter of 2021, governments across Europe changed strategy and switched to more coercive tools.Footnote 7 On the one hand, public authorities tried to call on citizens’ sense of responsibility and duty by moralizing non-compliance with the vaccination mandate (Bor, Jörgensen, Lindholt et al. Reference Bor, Jörgensen, Lindholt and Bang Petersen2023) and also emphasized again the risks of an infection.Footnote 8 Results from recent studies indicate that these mechanisms did have the expected effect. Schraff (Reference Schraff2021) shows that anxiety or fear was indeed a significant determinant of compliance. Similar results were found by Jörgensen, Bor and Bang Petersen (Reference Jörgensen, Bor and Bang Petersen2021) who show that fear motivated compliance with protective behavior.
On the other hand, and going beyond mere talk, governments announced measures that would significantly restrict the individual freedoms of unvaccinated people by, for example, banning them from visiting restaurants, social events, and participating in leisure activities, or traveling abroad. Such activities and venues would only be open to people presenting so-called ‘vaccination passports’ or ‘green passes’. The requirement to present a vaccination passport for a variety of activities was expected to serve as a strong incentive for those citizens still undecided and not necessarily those with very strong anti-vaccination convictions.
Among those who are already vaccinated, we expect that learning about the upcoming restrictions, on average, will increase the willingness to get a booster shot. As with individual characteristics, we form contrasting hypotheses for the role of trust. If trust ‘compensates’ the policy, then people whose level of institutional trust is high already are very likely to get a second shot with or without the policy. People with low levels of institutional trust, however, should react positively to the policy. If trust ‘amplifies’ the effects of the policy, then we should see higher levels of compliance for trusting individuals under the policy, with lower or negative effects for low-trusting individuals.
We do not expect that the implementation of a vaccination passport affects the behavior of citizens with strong anti-vaccination convictions. On the contrary, such policies may lead to an even stronger resentment of the vaccination mandate (Jörgensen, Bor and Bang Petersen Reference Jörgensen, Bor and Bang Petersen2024).
Instrument-Specific Hypotheses:
H2a: Trust in institutions compensates for the coercive policy-measure. The policy treatment has a stronger effect for those with low trust.
H2b: Trust in institutions amplifies the coercive policy-measure. The policy treatment has a stronger effect for those with high trust.
Research design
Rolling it out: COVID-19 vaccination in the United Kingdom and Germany
In this section, we provide relevant background information surrounding the timing of our surveys. Specifically, we provide insight into the period between January 2021 and January 2022. This covers the time when the first vaccines were administered to vulnerable citizens to the time when the majority of citizens in Western countries had the chance to get two (or three) shots of the available COVID-19 vaccines. With a little more than one year into the pandemic, the prospect of an effective vaccine was welcomed with a lot of enthusiasm among citizens in the two countries that are part of this study and in Western Europe more generally. While we cannot draw firm conclusions regarding the impact of these factors on our findings, we nonetheless argue that it is important to understand what the general public health situation in each of the two countries was at the time.
The development of an effective vaccine was seen as the key to overcoming the public health crisis and saving lives. Indeed, vaccine development began as soon as the genetic sequence of COVID-19 was released on 10 January 2020 (Fauci Reference Fauci2021). Less than a year later, ‘Phase 3’ trials showed several vaccines with more than 90% efficacy. As with many health-related prevention measures, vaccines work best if a majority of the target population complies with the policy. The prospect that the vaccine would be on offer to the mass public (in the Western hemisphere) shortly (with first vaccines applied to vulnerable groups of people already late 2020) was greeted with enthusiasm and a sense of relief shared by many, indicating that achieving a substantively high proportion of vaccinated citizens should be reached with ease. In some countries, however, the initial enthusiasm faded rather quickly and gave way to a variety of controversies surrounding the application of some vaccines (ie AstraZeneca) on the one hand, and criticism about how the vaccination roll-out was managed, on the other hand. It became clear that the ambitious goal of reaching ‘herd immunity’ through a very high proportion of citizens who comply with the government’s call to get vaccinated was likely too ambitious.
Parallel to these vaccine-specific discussions, debates on how public health can be maintained and overcrowding of public health institutions avoided continued, fueled by a new variant of the virus (Delta-variant at that time) that proved to be more transmissible than earlier types. That also meant that there was a continued need to protect vulnerable groups within societies without restricting individual freedoms too much. In this situation, policymakers started to discuss new policy schemes (so-called ‘green passes’) that would restrict the range of activities accessible to unvaccinated people with the aim to a) protect the vaccinated and vulnerable groups and b) increase the pressure on unvaccinated citizens to comply with the vaccination mandate during this crucial period.
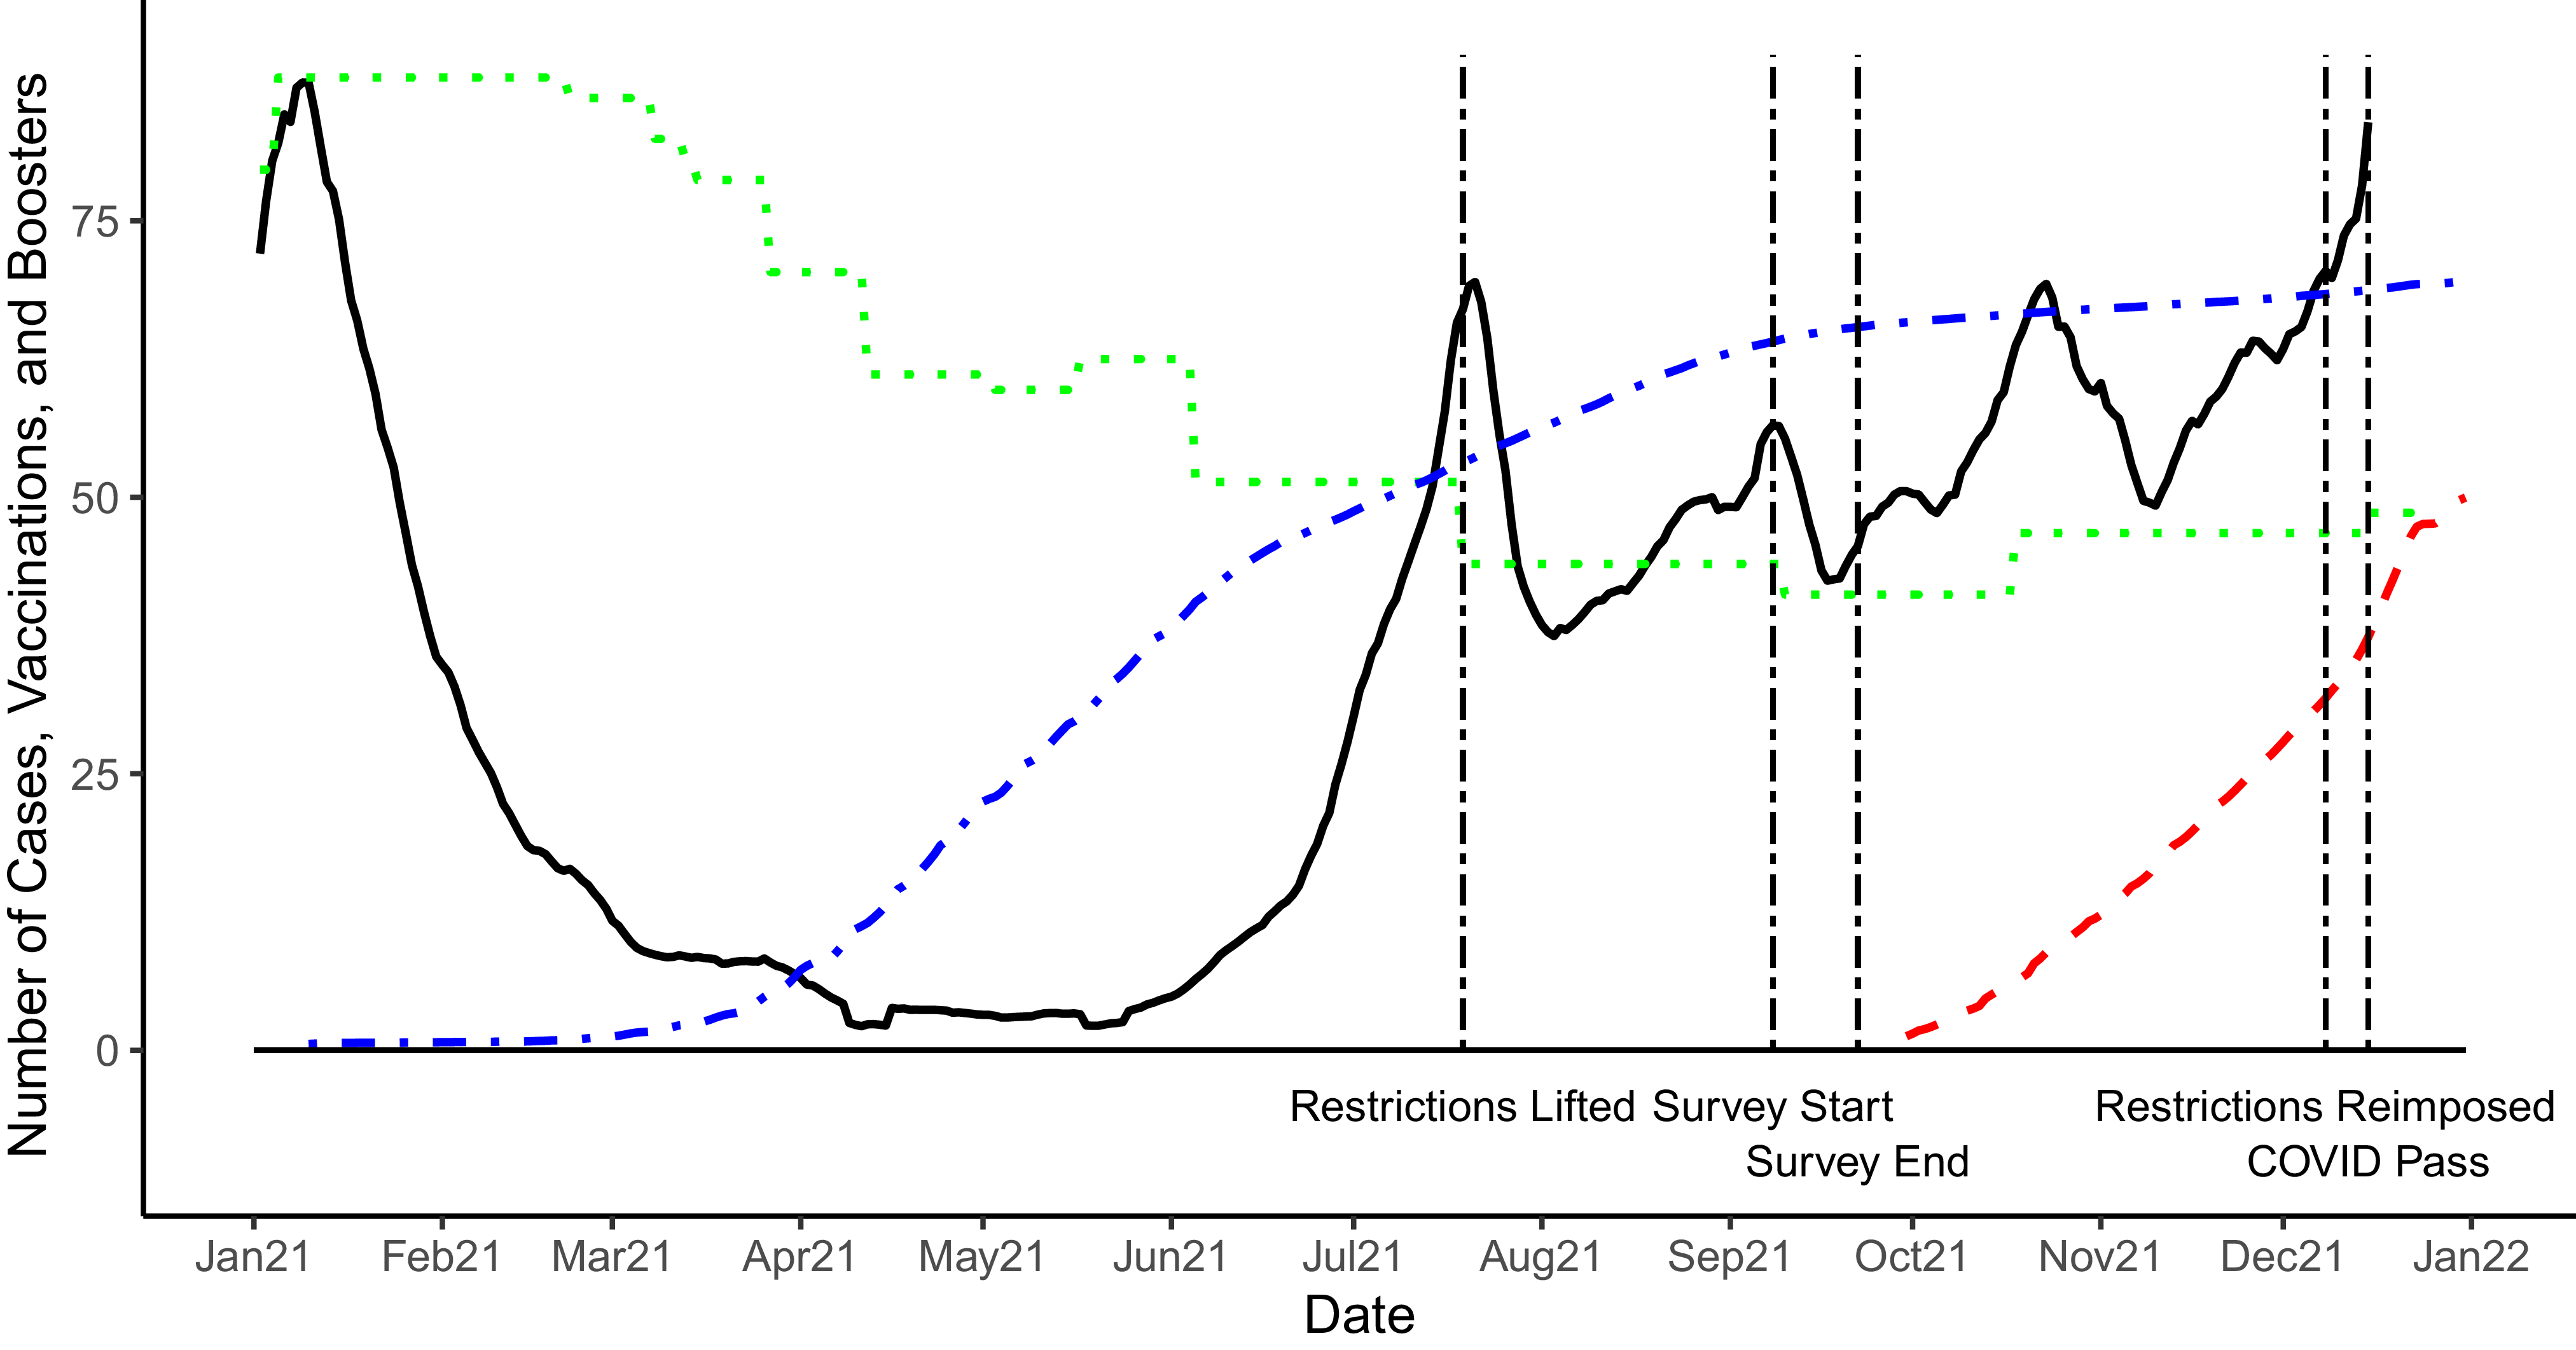
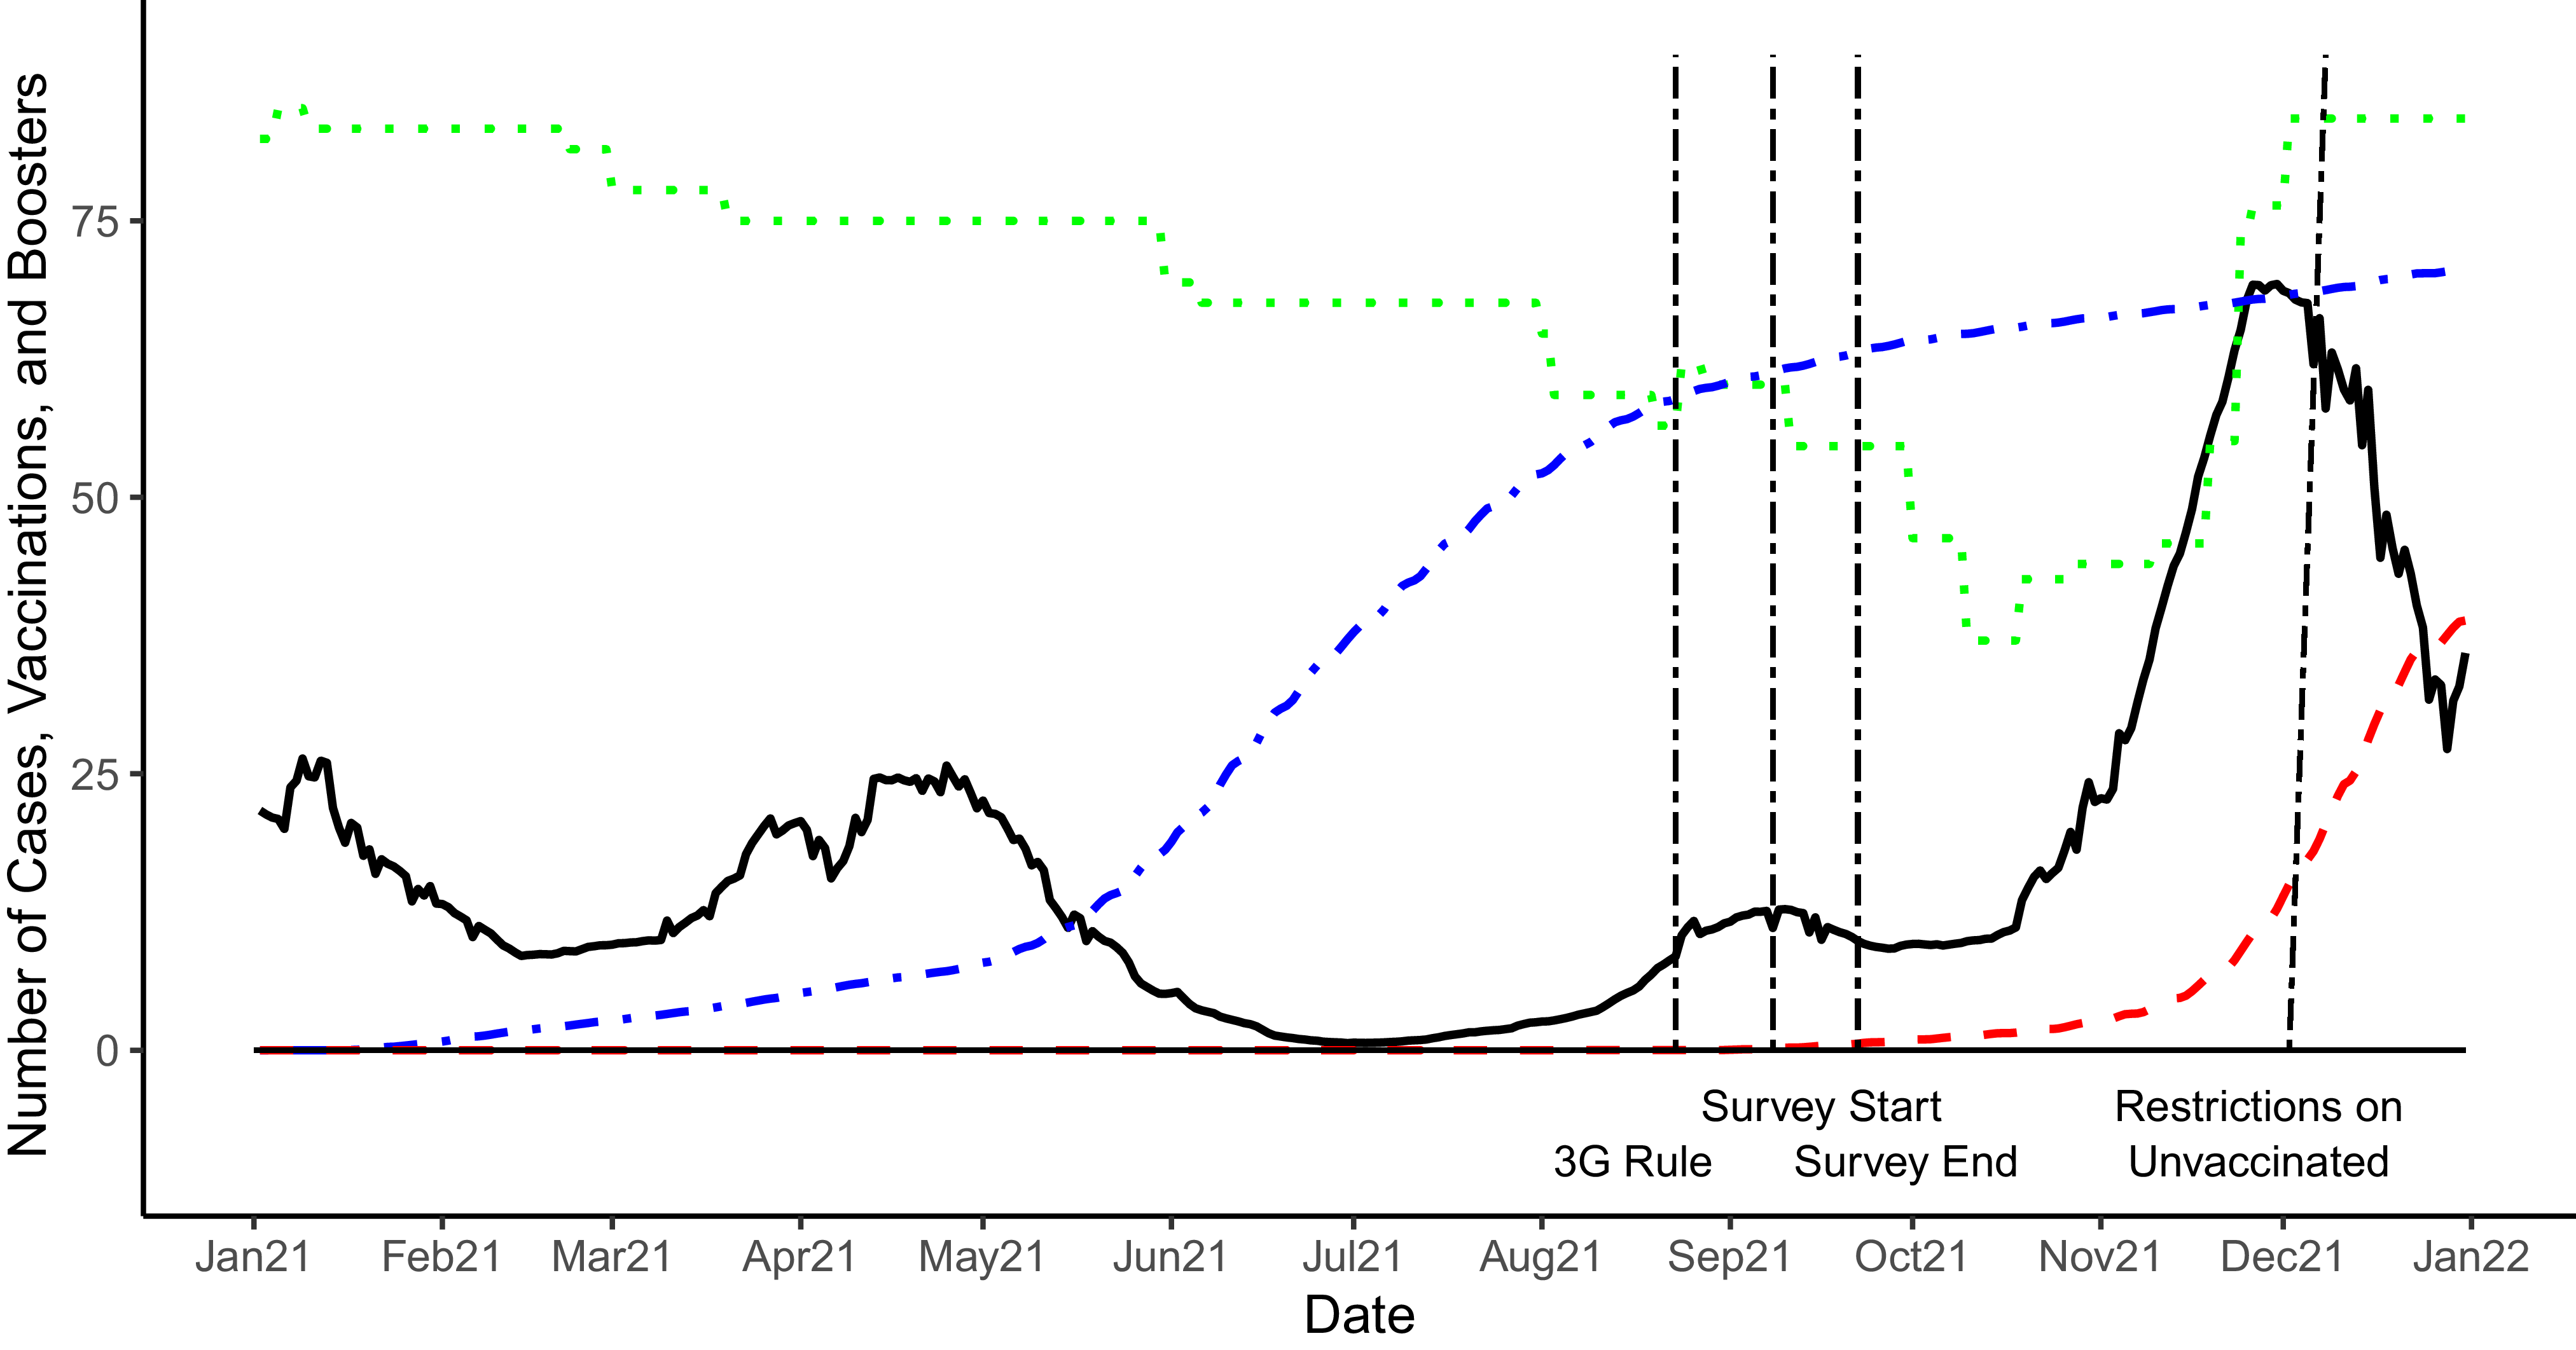
Figures 2 and 3 show how the pandemic evolved over these 12 months and indicate political decisions relevant for our paper. Specifically, we show the development of the caseload (in number of new cases/100,000 inhabitants), the number of fully vaccinated citizens (as percentage points), the number of people who got their booster shot (CSSE 2023), and the level of restrictions as captured by the Oxford Stringency Index (OxCGRT 2020). The vertical lines visualize the timing of the survey and relevant political decisions related to restrictions that were imposed to manage the pandemic and alleviate the pressure on public health institutions during that year.


Comparing the timelines between the United Kingdom and Germany shows differences in the evolution of the pandemic in late March. At the time, the vaccination roll-out had gained a significant pace in both countries. While in the United Kingdom, the caseload during spring 2021 was relatively low, Germany lived through a small wave of infections between March and May 2021. The United Kingdom started to administer the first vaccinations at the end of 2020 prioritizing front-line workers, particularly in the health care and educational sector. The political discourse during the first phase of the vaccination roll-out in the United Kingdom was marked by a great level of enthusiasm and the way the vaccination campaign was organized was generally well received. During the first months of the mass roll-out, the uptake by the general public was quick, and by mid-July almost half of the adult population was considered fully vaccinated. This coincided with the lifting of all restrictions at the peak of the COVID-19 wave caused by the newly emerging Delta-variant. By the time we fielded our survey, more than 70% of the overall population was fully vaccinated and the curve (representing the fully vaccinated population) flattened out. The booster campaign started in the fall, shortly after the collection of our data.
In Germany, the vaccination roll-out was considerably slower. The reasons for the slightly later start of the vaccination campaign were related, on the one hand, to the coordinated approach by EU member states during the negotiation and purchase period and the distribution of the vaccines among the EU member states. On the other hand, the pace was slowed down by complicated domestic distribution processes and constraints, such as the fact that general practitioners (at the start of the vaccination drive) were not allowed to administer COVID-19 vaccines, chaotic scheduling procedures for vaccination appointments, and malfunctioning vaccination centers. These struggles also had a negative impact on how the vaccination campaign set off. Indeed, Germans were considerably less satisfied with the vaccination campaign compared to other Europeans (Truchlewski, Kriesi, Moise et al. Reference Truchlewski, Kriesi, Moise and Oana2025). The slow start was further complicated by controversial decisions and discussions related to the AstraZeneca vaccine which caused confusion among part of the population and led to an increase in vaccine hesitancy.Footnote 9
We see a similar pattern emerging with the uptake of the booster shot. While in the United Kingdom, a large number of citizens readily accepted to get a booster shot, likely also incentivized by the prospect of the re-introduction of restrictions, in particular the necessity to have a COVID passport to participate in certain activities, the uptake of booster shots in Germany was slow and the curve shows signs of flattening toward the end of the period visualized in the graph. This is in line with other research which showed that UK citizens were among the most enthusiastic to receive vaccinations for COVID-19, while enthusiasm was much lower in Germany (Lazarus, Ratzan, Palayew et al. Reference Lazarus, Ratzan, Palayew, Gostin, Larson, Rabin, Kimball and El-Mohandes2020). Other research, which came after our data collection, confirmed that Germans were more likely to be skeptical of the development of vaccines, their safety, and have higher distrust of authorities (Desson, Kauer, Otten et al. Reference Desson, Kauer, Otten, Peters and Paolucci2022; Reis et al. Reference Reis, Michalski, Bartig, Wulkotte, Poethko-Müller, Graeber, Schaffrath Rosario, Hövener and Hoebel2024). We conclude that German respondents have more room to be influenced by our coercive policy instrument.
Two of the timeline factors that we discuss are crucial for the design and the timing of our survey. First, our survey came after the initial vaccination campaign was completed, in the sense that all adults had had a chance to get their vaccination, and before the start of the booster campaign. We utilize the timing of the fielding phase to perform two analyses: one on recall of the initial vaccination (observational) and another on the self-reported likelihood of getting the booster shot using a vignette experiment (or the initial vaccine for respondents that were still unvaccinated).
The second factor is related to the timing of the introduction of restrictive green pass policies. In the United Kingdom, general restrictions, such as limitations for group gatherings and shop closures, were lifted in July 2021, and partially reimposed only in December, when the COVID Pass was introduced.Footnote 10 In Germany, the 3G rule had been in place since 23 August 2021,Footnote 11 which meant that to access public spaces, Germans needed to be vaccinated, recently healed from COVID, or have a recent test (geimpft, geheilt, and getested). Unvaccinated individuals therefore had the option to continually test to avoid restrictions. This changed when a new wave, fueled by the Omicron variant, hit the country. On 3 December 2021, Germany imposed more severe restrictions on the unvaccinatedFootnote 12 which limited their access to public spaces and social gatherings. Accordingly, neither our respondents in the United Kingdom nor those in Germany were ‘pre-treated’, in the sense of living under a policy regime where a policy similar to our ‘green pass’ experimental treatment already existed.
Data
We conducted an experiment embedded in a population-based survey. The surveys were fielded by Respondi (now ‘Bilendi’) in late summer 2021 (between September 8 and 23), making use of different country-specific online access panels.Footnote 13 Voting-age nationals were selected from these access panels using gender- and age-based quotas. In each country, we surveyed around 1200 individuals. The survey consisted of three sections.
In the first section, we collect information about respondents’ political views and preferences as well as their levels of trust in different types of organizations and institutions: trust in private pharmaceutical companies, in medical research centers, in government, and in the national health service. For the analysis, we create a factor to capture the underlying level of trust in institutions.Footnote 14 We also asked respondents a number of questions regarding their satisfaction with government policy toward COVID: satisfaction with business economic support, vaccination roll-out, economic support for individuals, protection of vulnerable groups, restrictions, and personal freedom. We combine these attitudes into a factor capturing underlying satisfaction with COVID policies.Footnote 15
In addition, we also leveraged their attitudes toward a number of economic policies, and their understanding of how responsibilities should be distributed between politics and experts. All respondents were asked to indicate the extent to which they were worried about COVID-19 and whether or not they ever tested positive for COVID-19. Furthermore, we also asked respondents about their vaccination status.Footnote 16 Respondents who indicated that they did not have the intention to get vaccinated were asked to indicate the reason that best explains their objection from a list of commonly cited reasons for vaccinating hesitancy.
The second part of the survey consisted of a ‘vaccination’ experiment, which we will discuss in more detail below. The third section collected information about participants’ socioeconomic background, such as the level of education, income, and family status. In what follows, we present key information about the distribution of vaccinated vs. unvaccinated people in our sample and provide insight about respondents’ objections to get vaccinated.
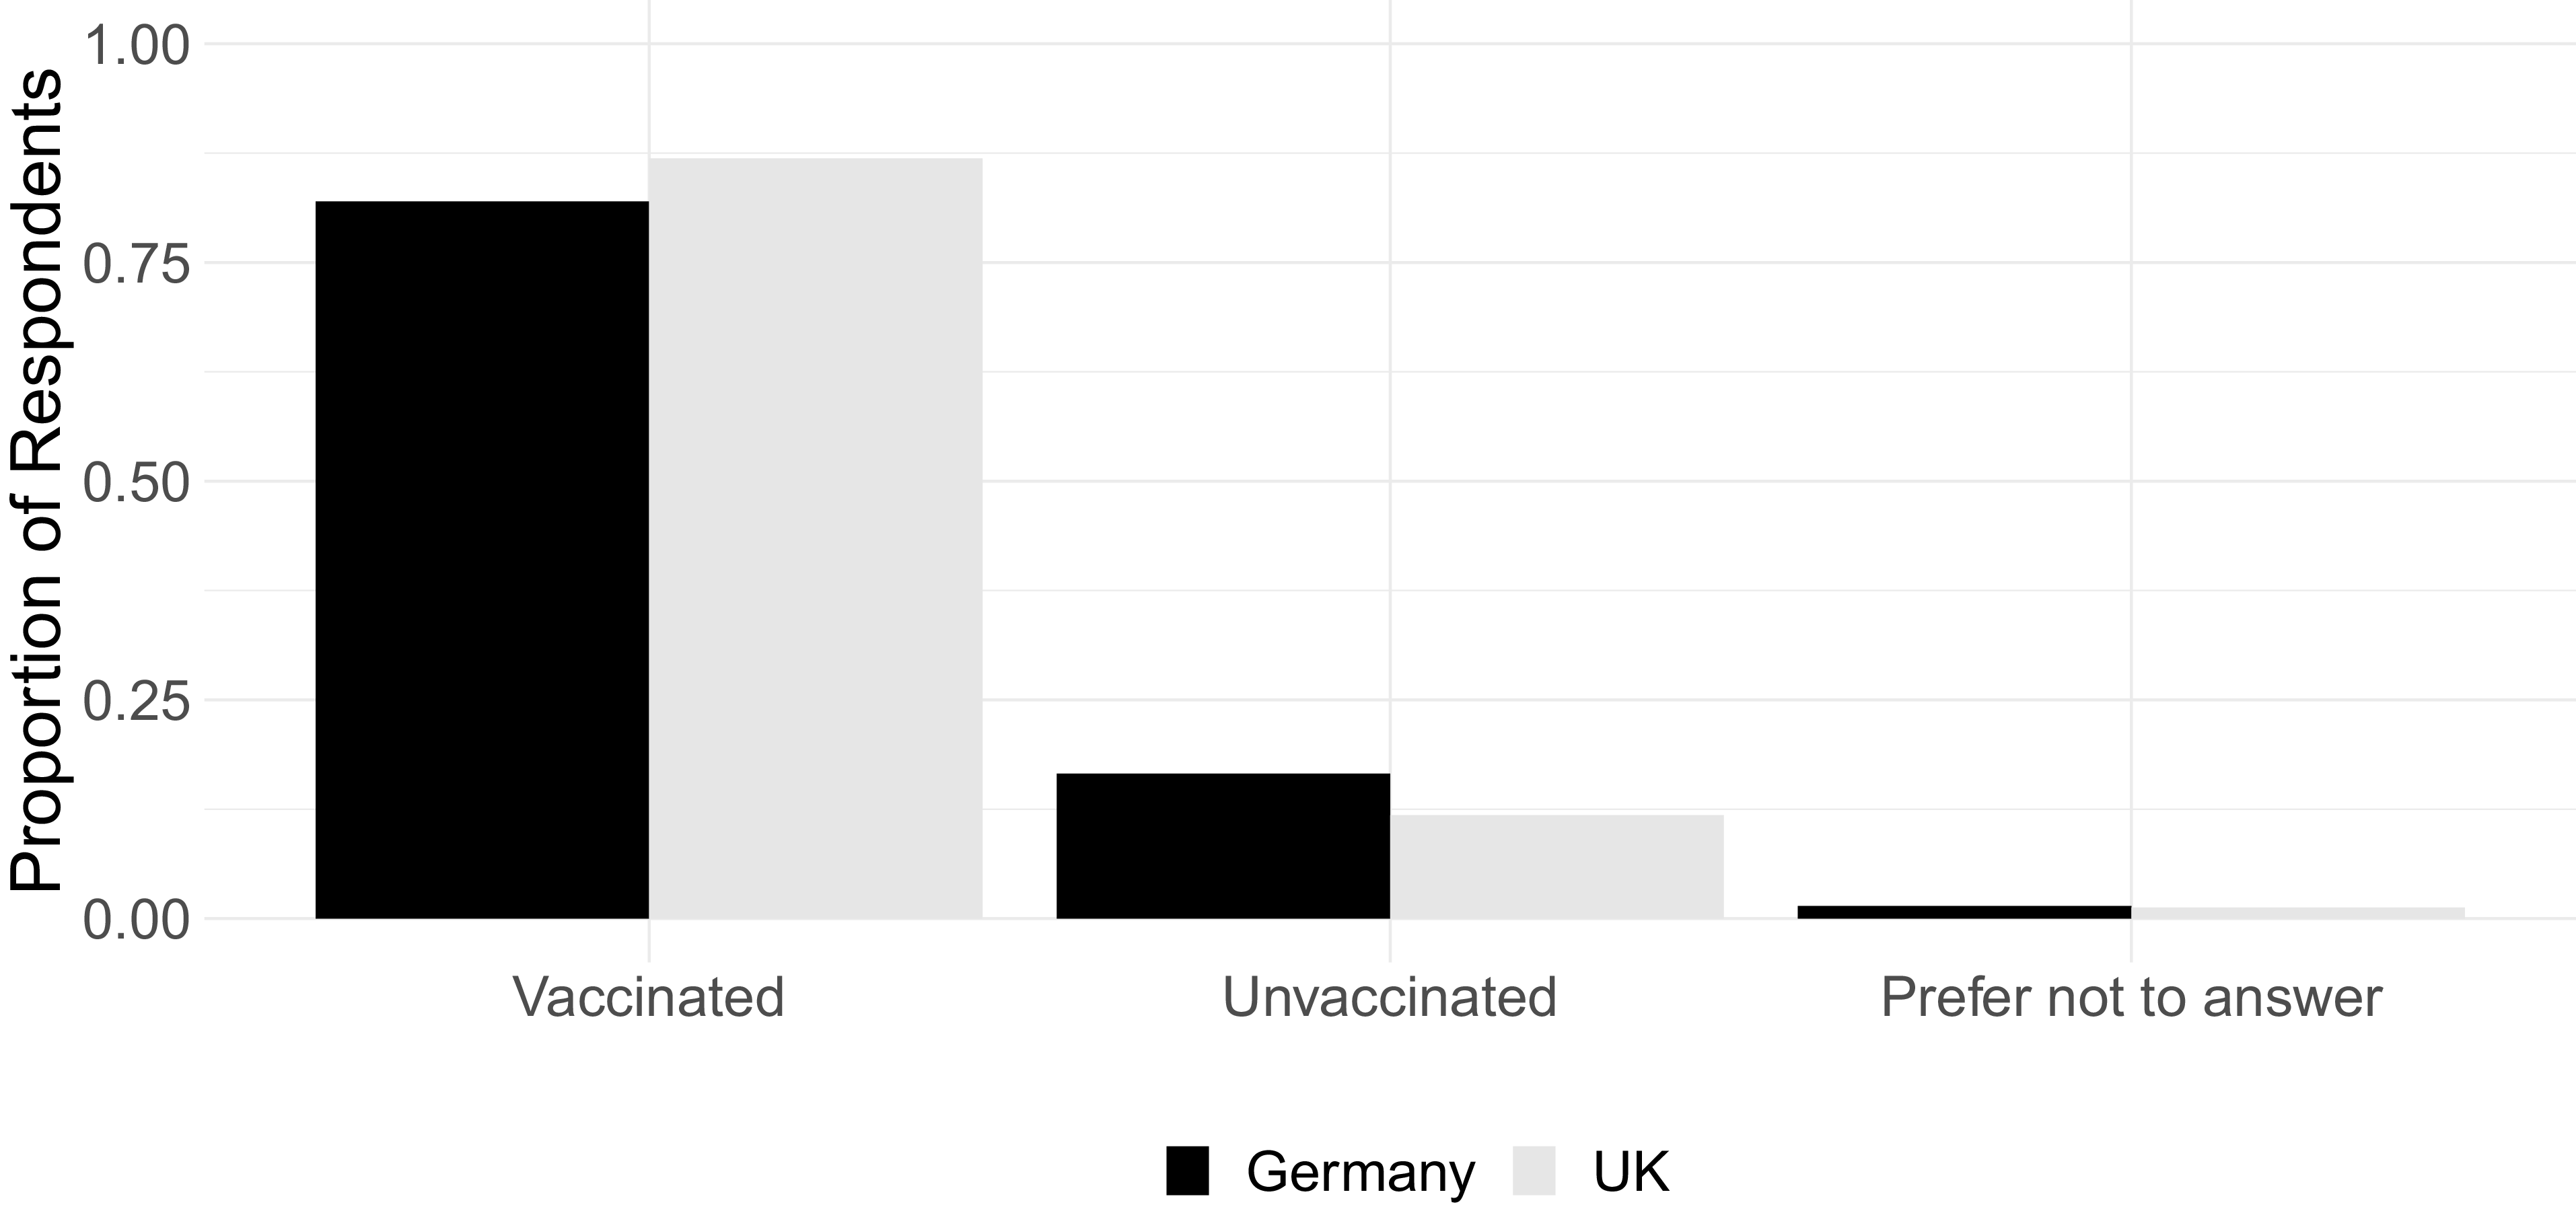
Figure 4 shows that at the time of our survey, 83.2% of our German respondents were already vaccinated.Footnote 17 Official data at the time show that in Germany at that point in time, 73.4% of the adult population was vaccinated (ECDC 2023). This indicates that our survey slightly over-sampled vaccinated people in Germany.Footnote 18 At the same time, the proportion of respondents who indicated that they are vaccinated is slightly higher in the United Kingdom (88%), in line with the vaccination rate reported by the NHS at the time (86%) (NHS 2025). 22.5% of the non-vaccinated respondents in the United Kingdom and 29.9% of the non-vaccinated German respondents indicated that they did not intend to get vaccinated.Footnote 19 A very small share of our respondents in both countries preferred not to answer this question.
Vaccination status in sample.

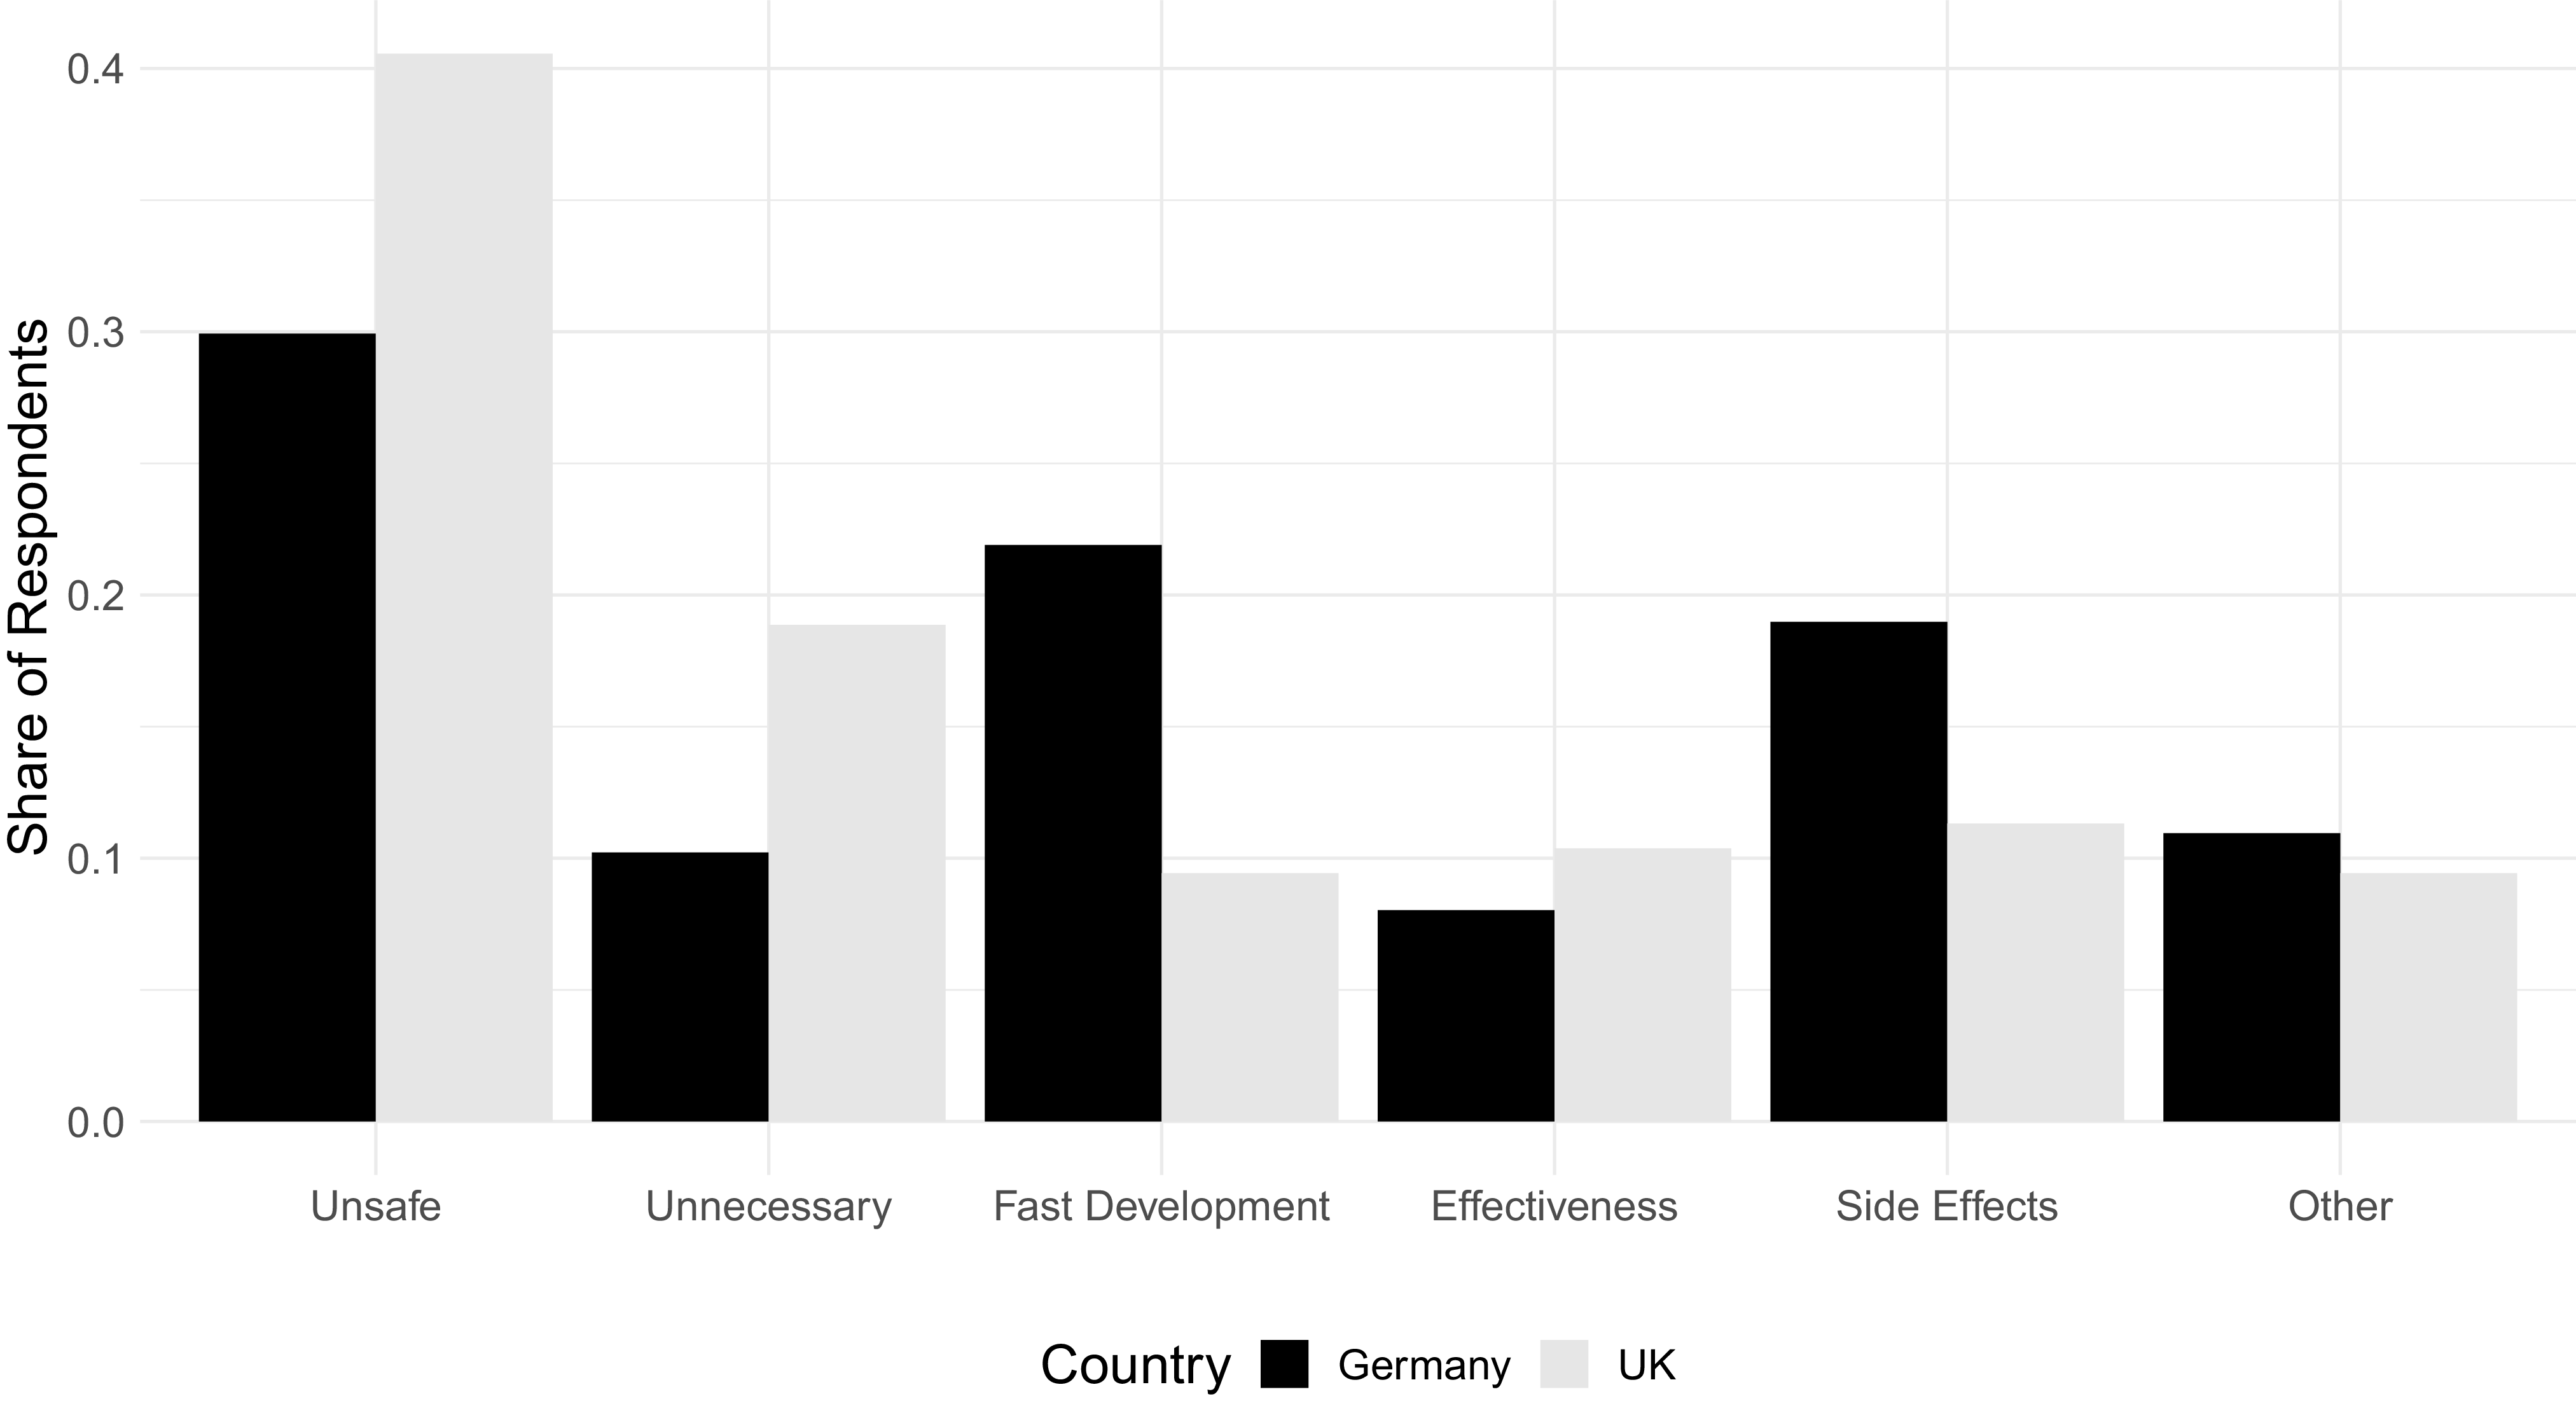
Figure 5 shows that a plurality of respondents in both countries who were not vaccinated when fielding our survey indicated that they thought that the vaccine was unsafe (40% of British and 30% of German respondents, respectively).Footnote 20 The second most important factor to objecting vaccination for German respondents was the fast development of the vaccine (roughly 22%) followed by the fear of potential side effects (19%). In the United Kingdom, the second largest group of non-vaccinated respondents deemed it unnecessary to get vaccinated (19%). All other categories received a similar share of responses. The survey also allowed respondents to indicate other factors that contributed to their decision. One reason indicated by several respondents was the feeling that the state/government was forcing them to get vaccinated, which – in the end – led them to abstain.Footnote 21 Another reason that respondents offered was related to a general sense of mistrust and fear that the state would fool and harm its citizens.Footnote 22
Reasons for vaccine hesitancy.

Experimental design
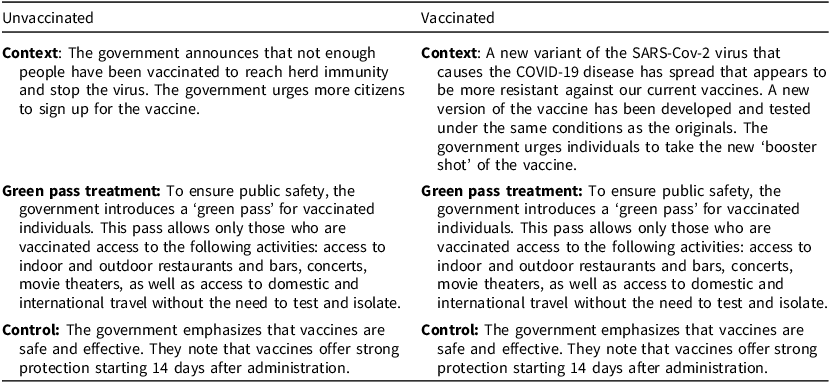
For the experimental part, participants were first divided into two groups, which differ in their vaccination status. The first group consists of respondents who indicated that they are already vaccinated. The second group consists of respondents who indicated that they were not vaccinated. Depending on whether a respondent belongs to the group of vaccinated or unvaccinated people, they were exposed to different scenarios. Prior to the group-specific scenario, all respondents read the following disclaimer: ‘We are now going to present you with a scenario regarding the vaccination campaign in [the United Kingdom/Germany]’. Table 1 details the experimental setup.
Experimental setup

After having read the vignette, respondents were asked to answer the following outcome question: Considering the above scenario, how likely are you to get vaccinated against COVID-19, for the unvaccinated group, and Considering the above scenario, how likely are you to get vaccinated with the ‘booster shot’ against COVID-19?, for the vaccinated group.Footnote 23
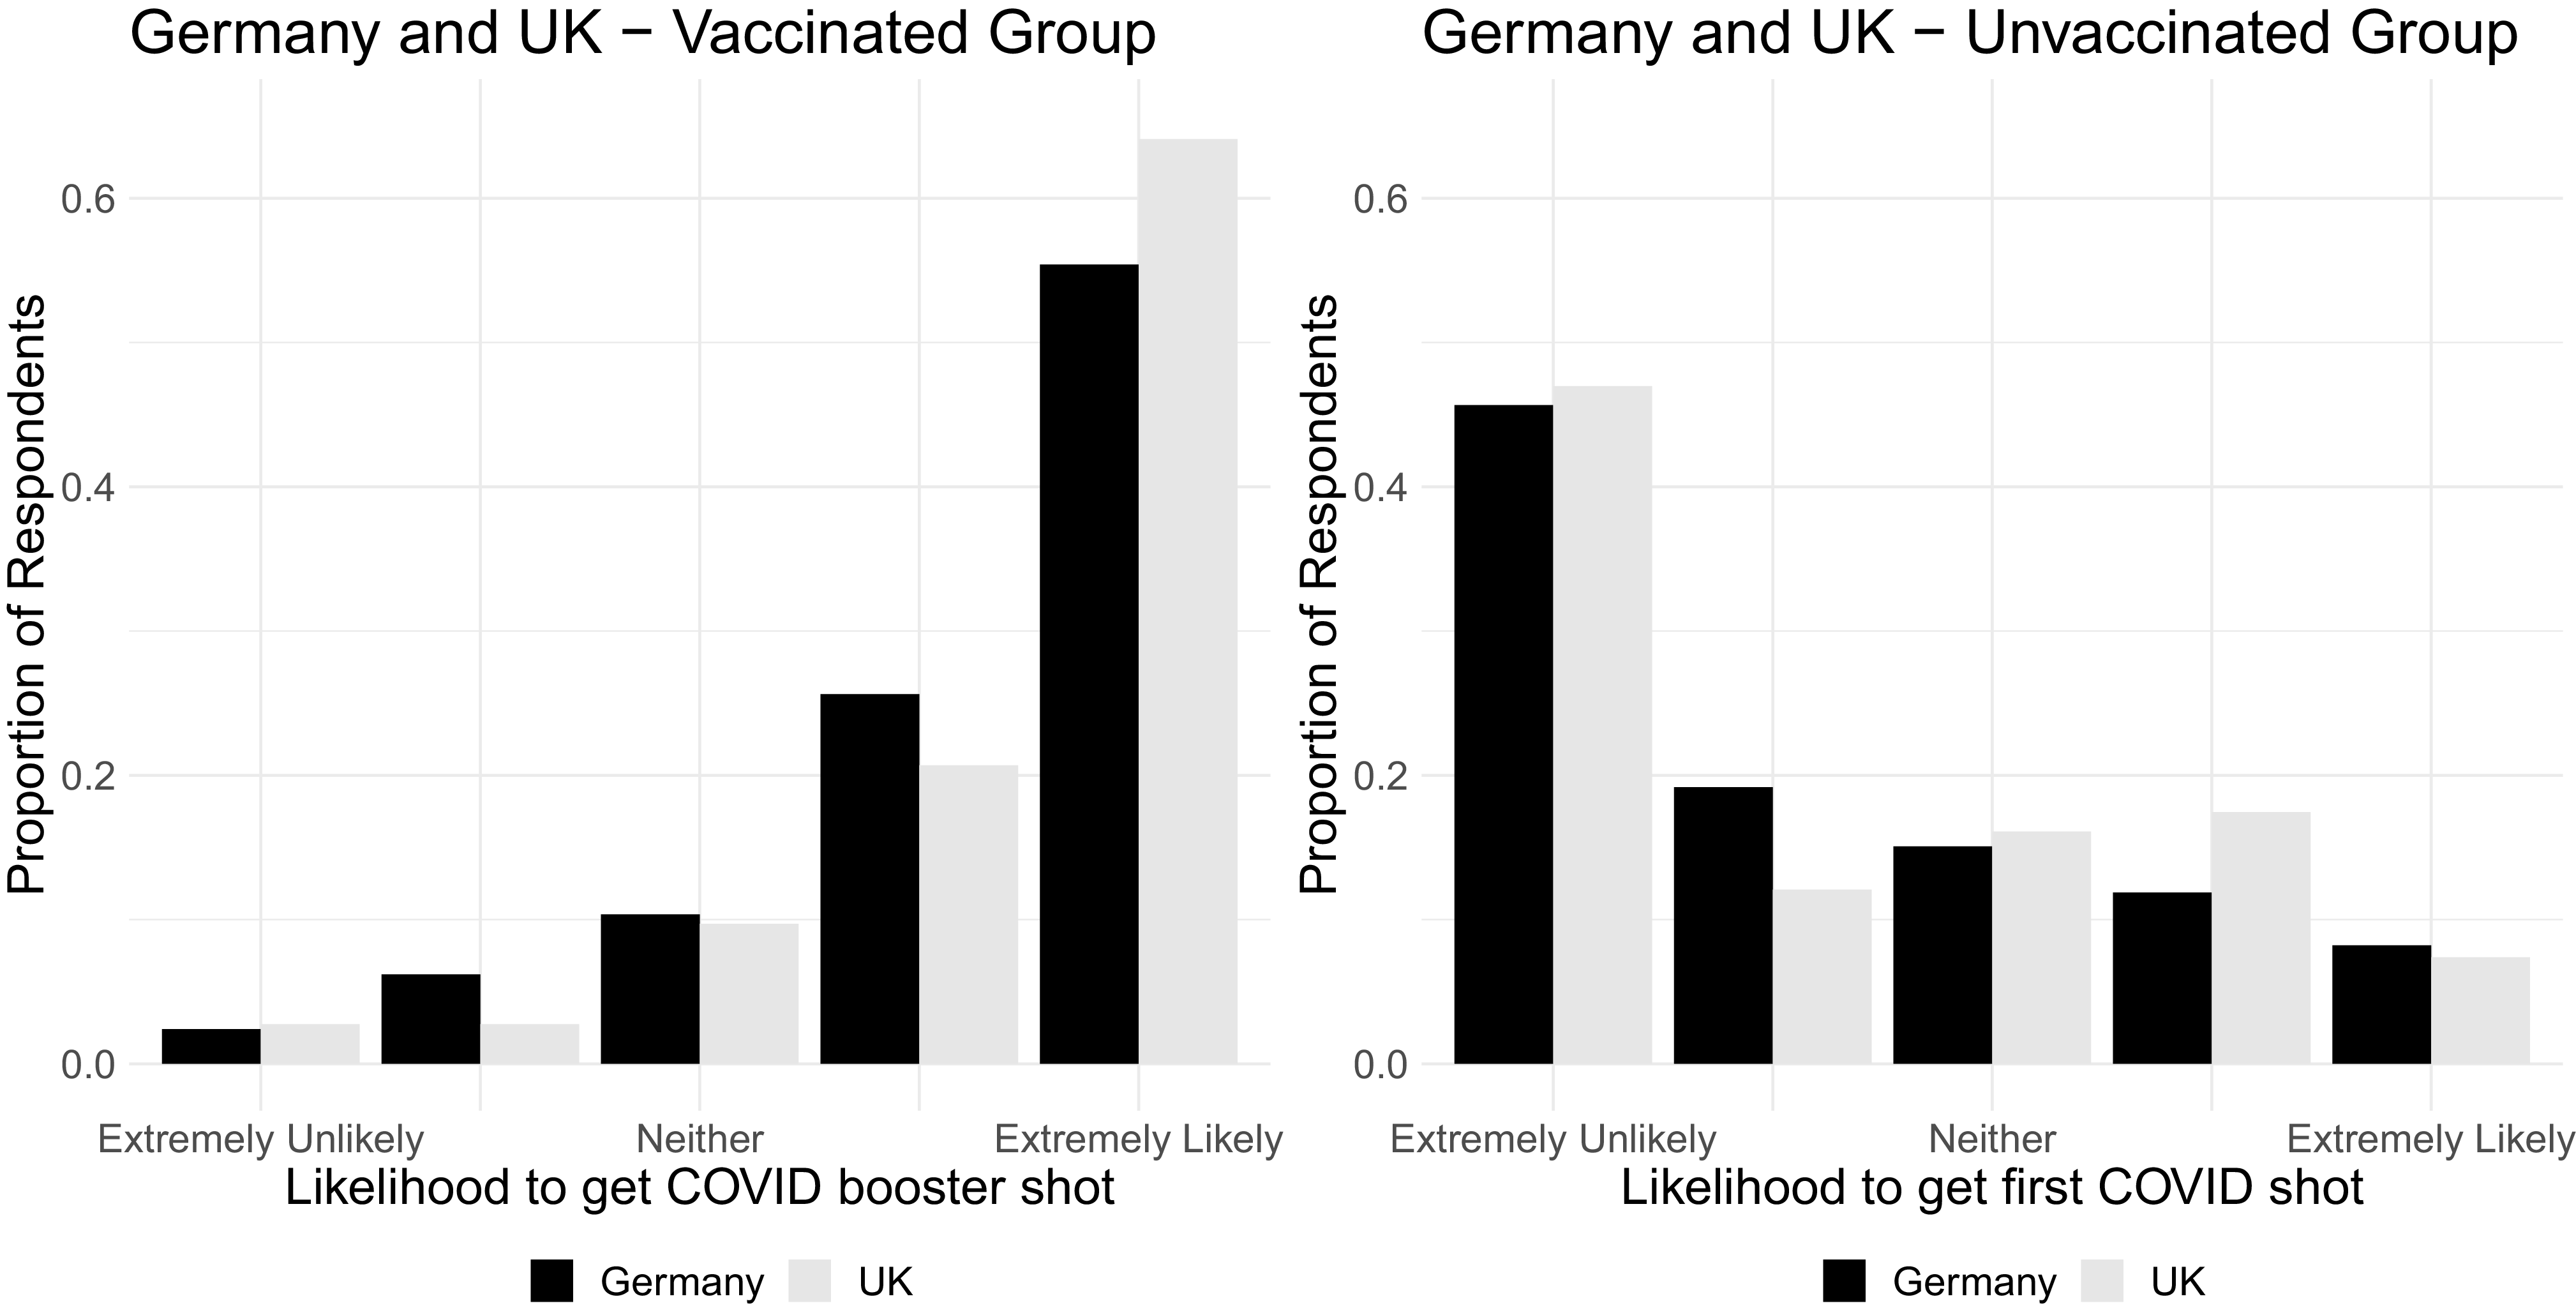
Figure 6 shows the distribution of our first outcome variable, the one that captures respondents’ reaction to the vignette experiment. Unsurprisingly, the proportion of respondents among the already vaccinated who indicate that they will also get a COVID-19 booster shot is very high in both countries. Combining the categories capturing citizens who responded that they are ‘likely’ or ‘extremely likely’ to get the booster shot amounts to more than 80% in both countries. Turning to the group of unvaccinated respondents shows that the majority (between 60% and 70%) in this group indicate that they are unlikely to get vaccinated. Only roughly 15% in both countries are undecided.
Distribution of dependent variable.

Results
Trust and ideological drivers (observational)
We first look at the results from the observational part of our data to identify the political drivers of vaccine hesitancy. Given the timing of our survey, a majority of respondents in both countries were vaccinated with the initial vaccine as preparations for booster shots were under way. We can therefore investigate the political drivers of existing vaccination, that is, how those who were already vaccinated differ from those who weren’t, and second, for future vaccination, how individuals who wanted to be vaccinated in the future differ from those who didn’t. The following part is based on two dependent variables which correspond to the different parts of the argument outlined above: 1) the first dependent variable captures whether a respondent is vaccinated (yes/no). 2) The second dependent variable is a post-treatment variable where respondents indicate (after having learned about the planned restrictions/implementation of a ‘green pass’), whether they intend to get a booster or would get their first vaccination.Footnote 24
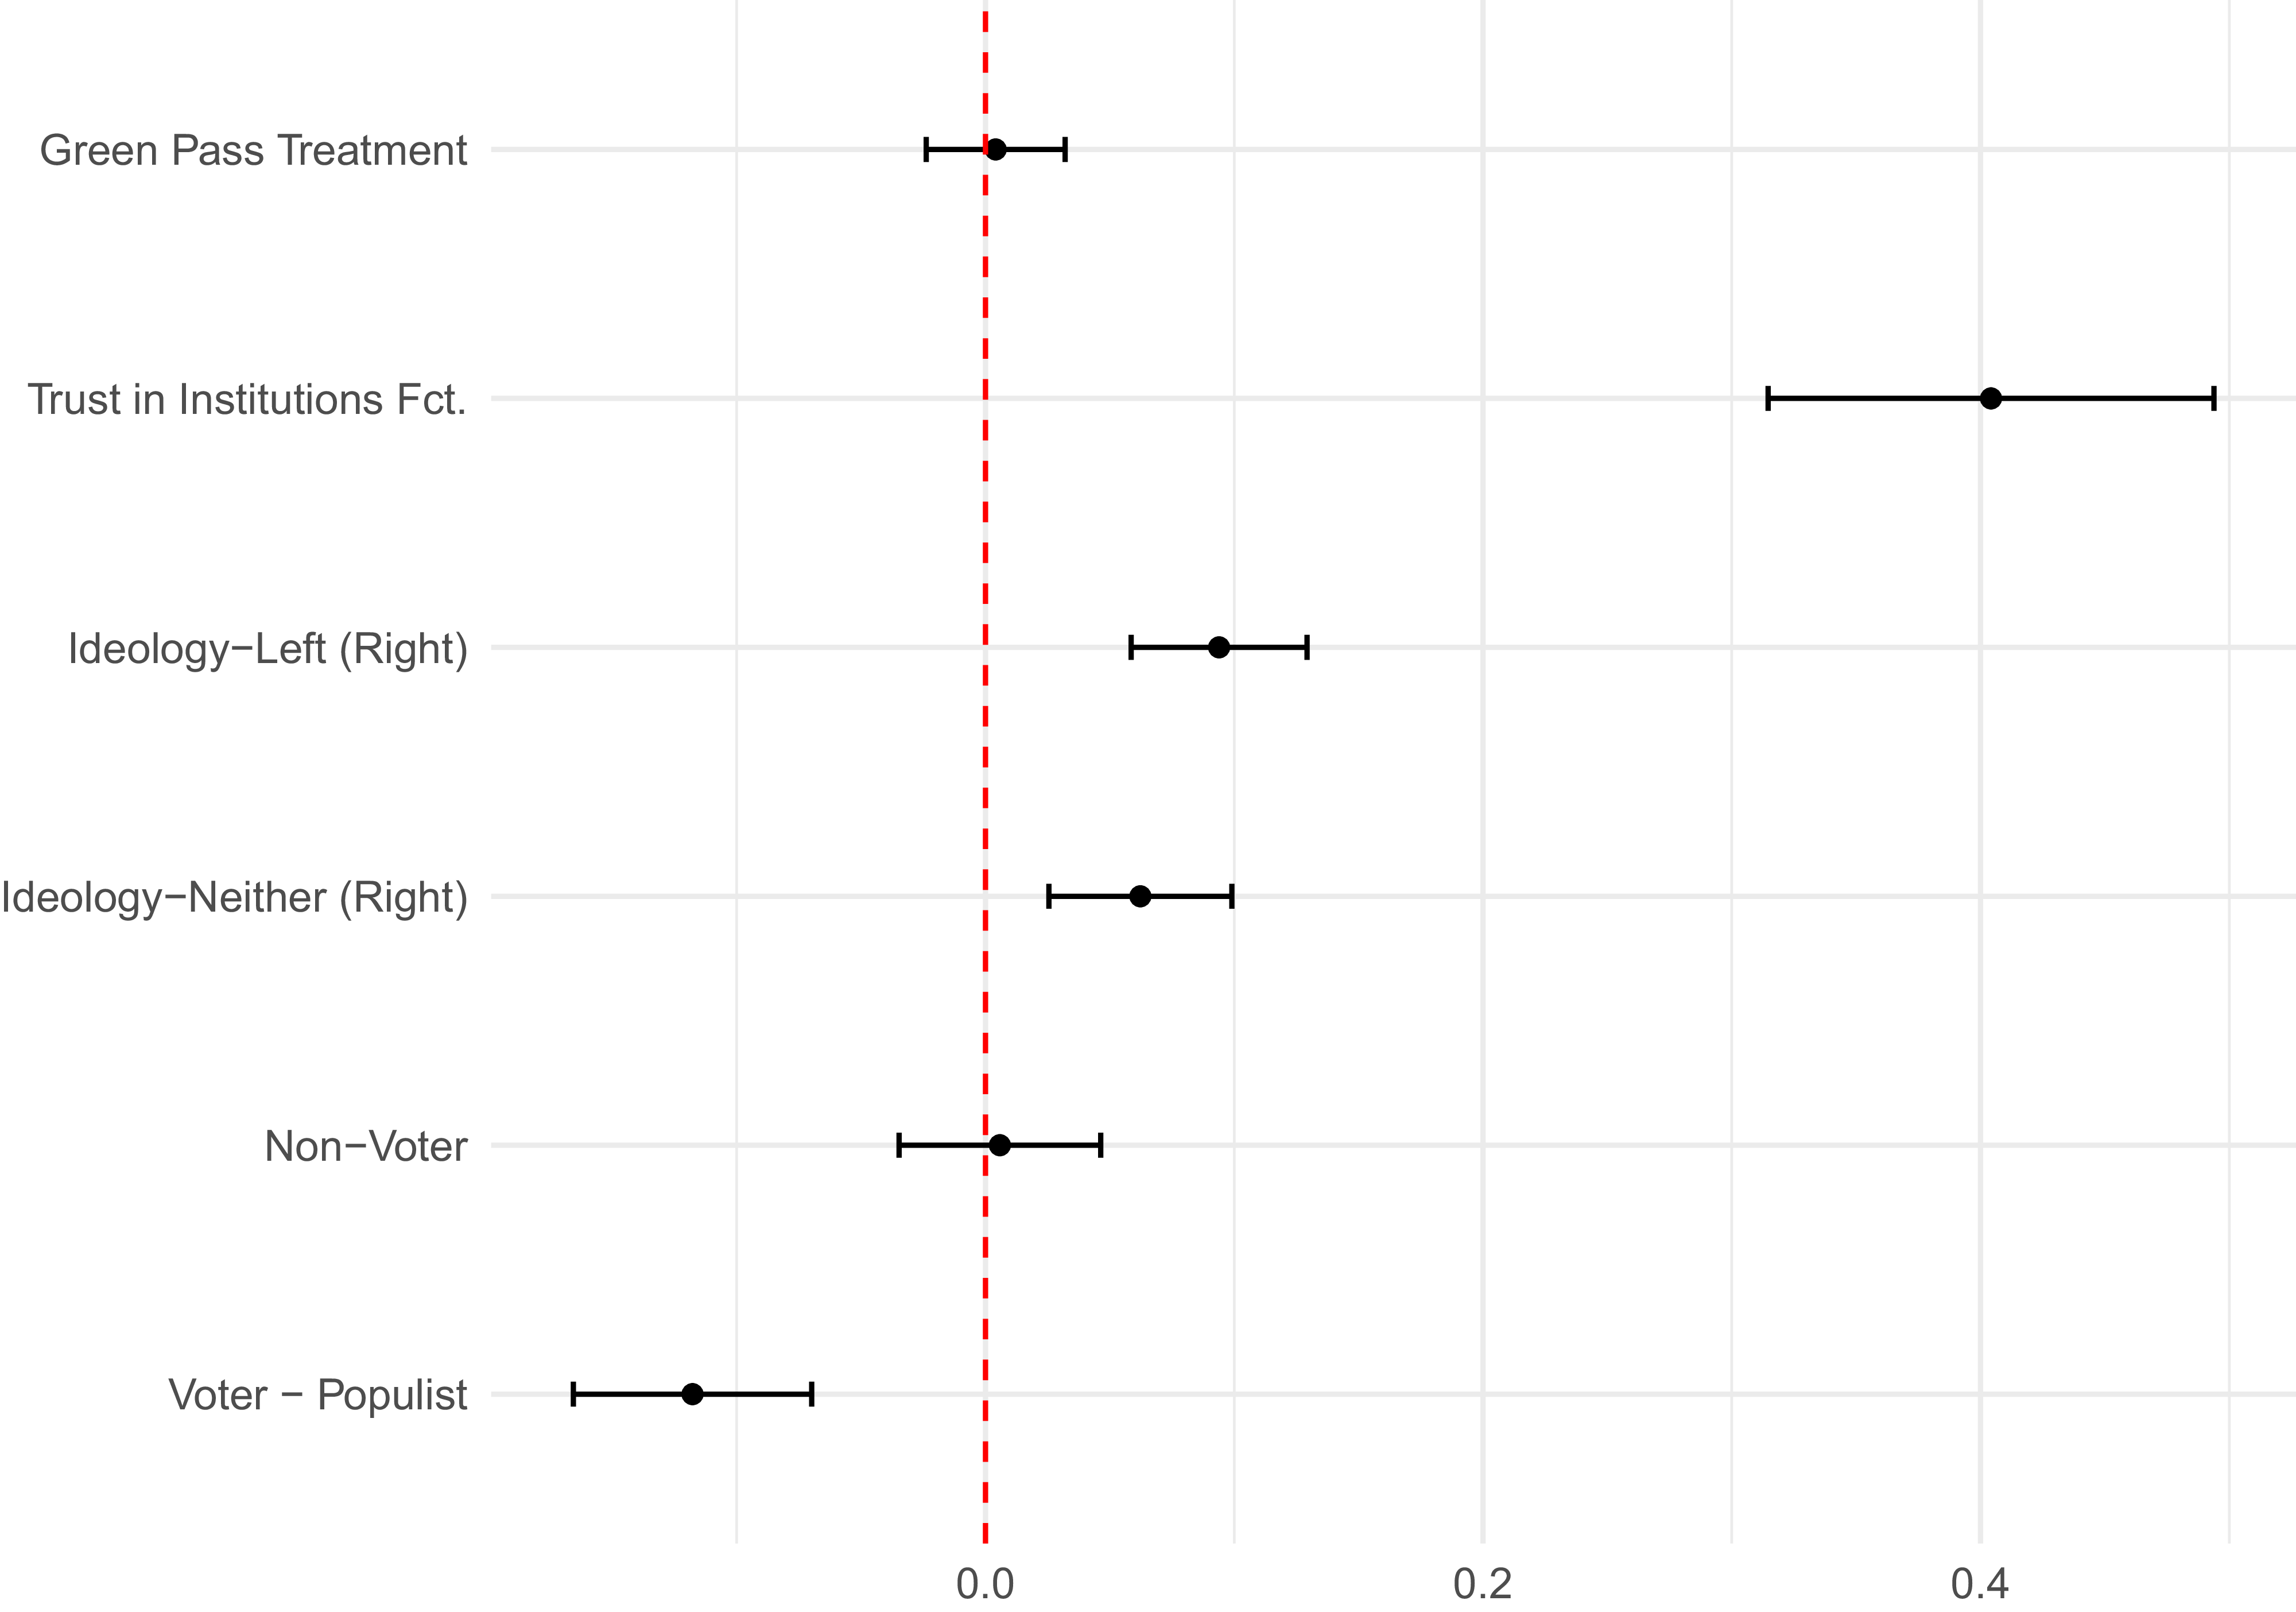
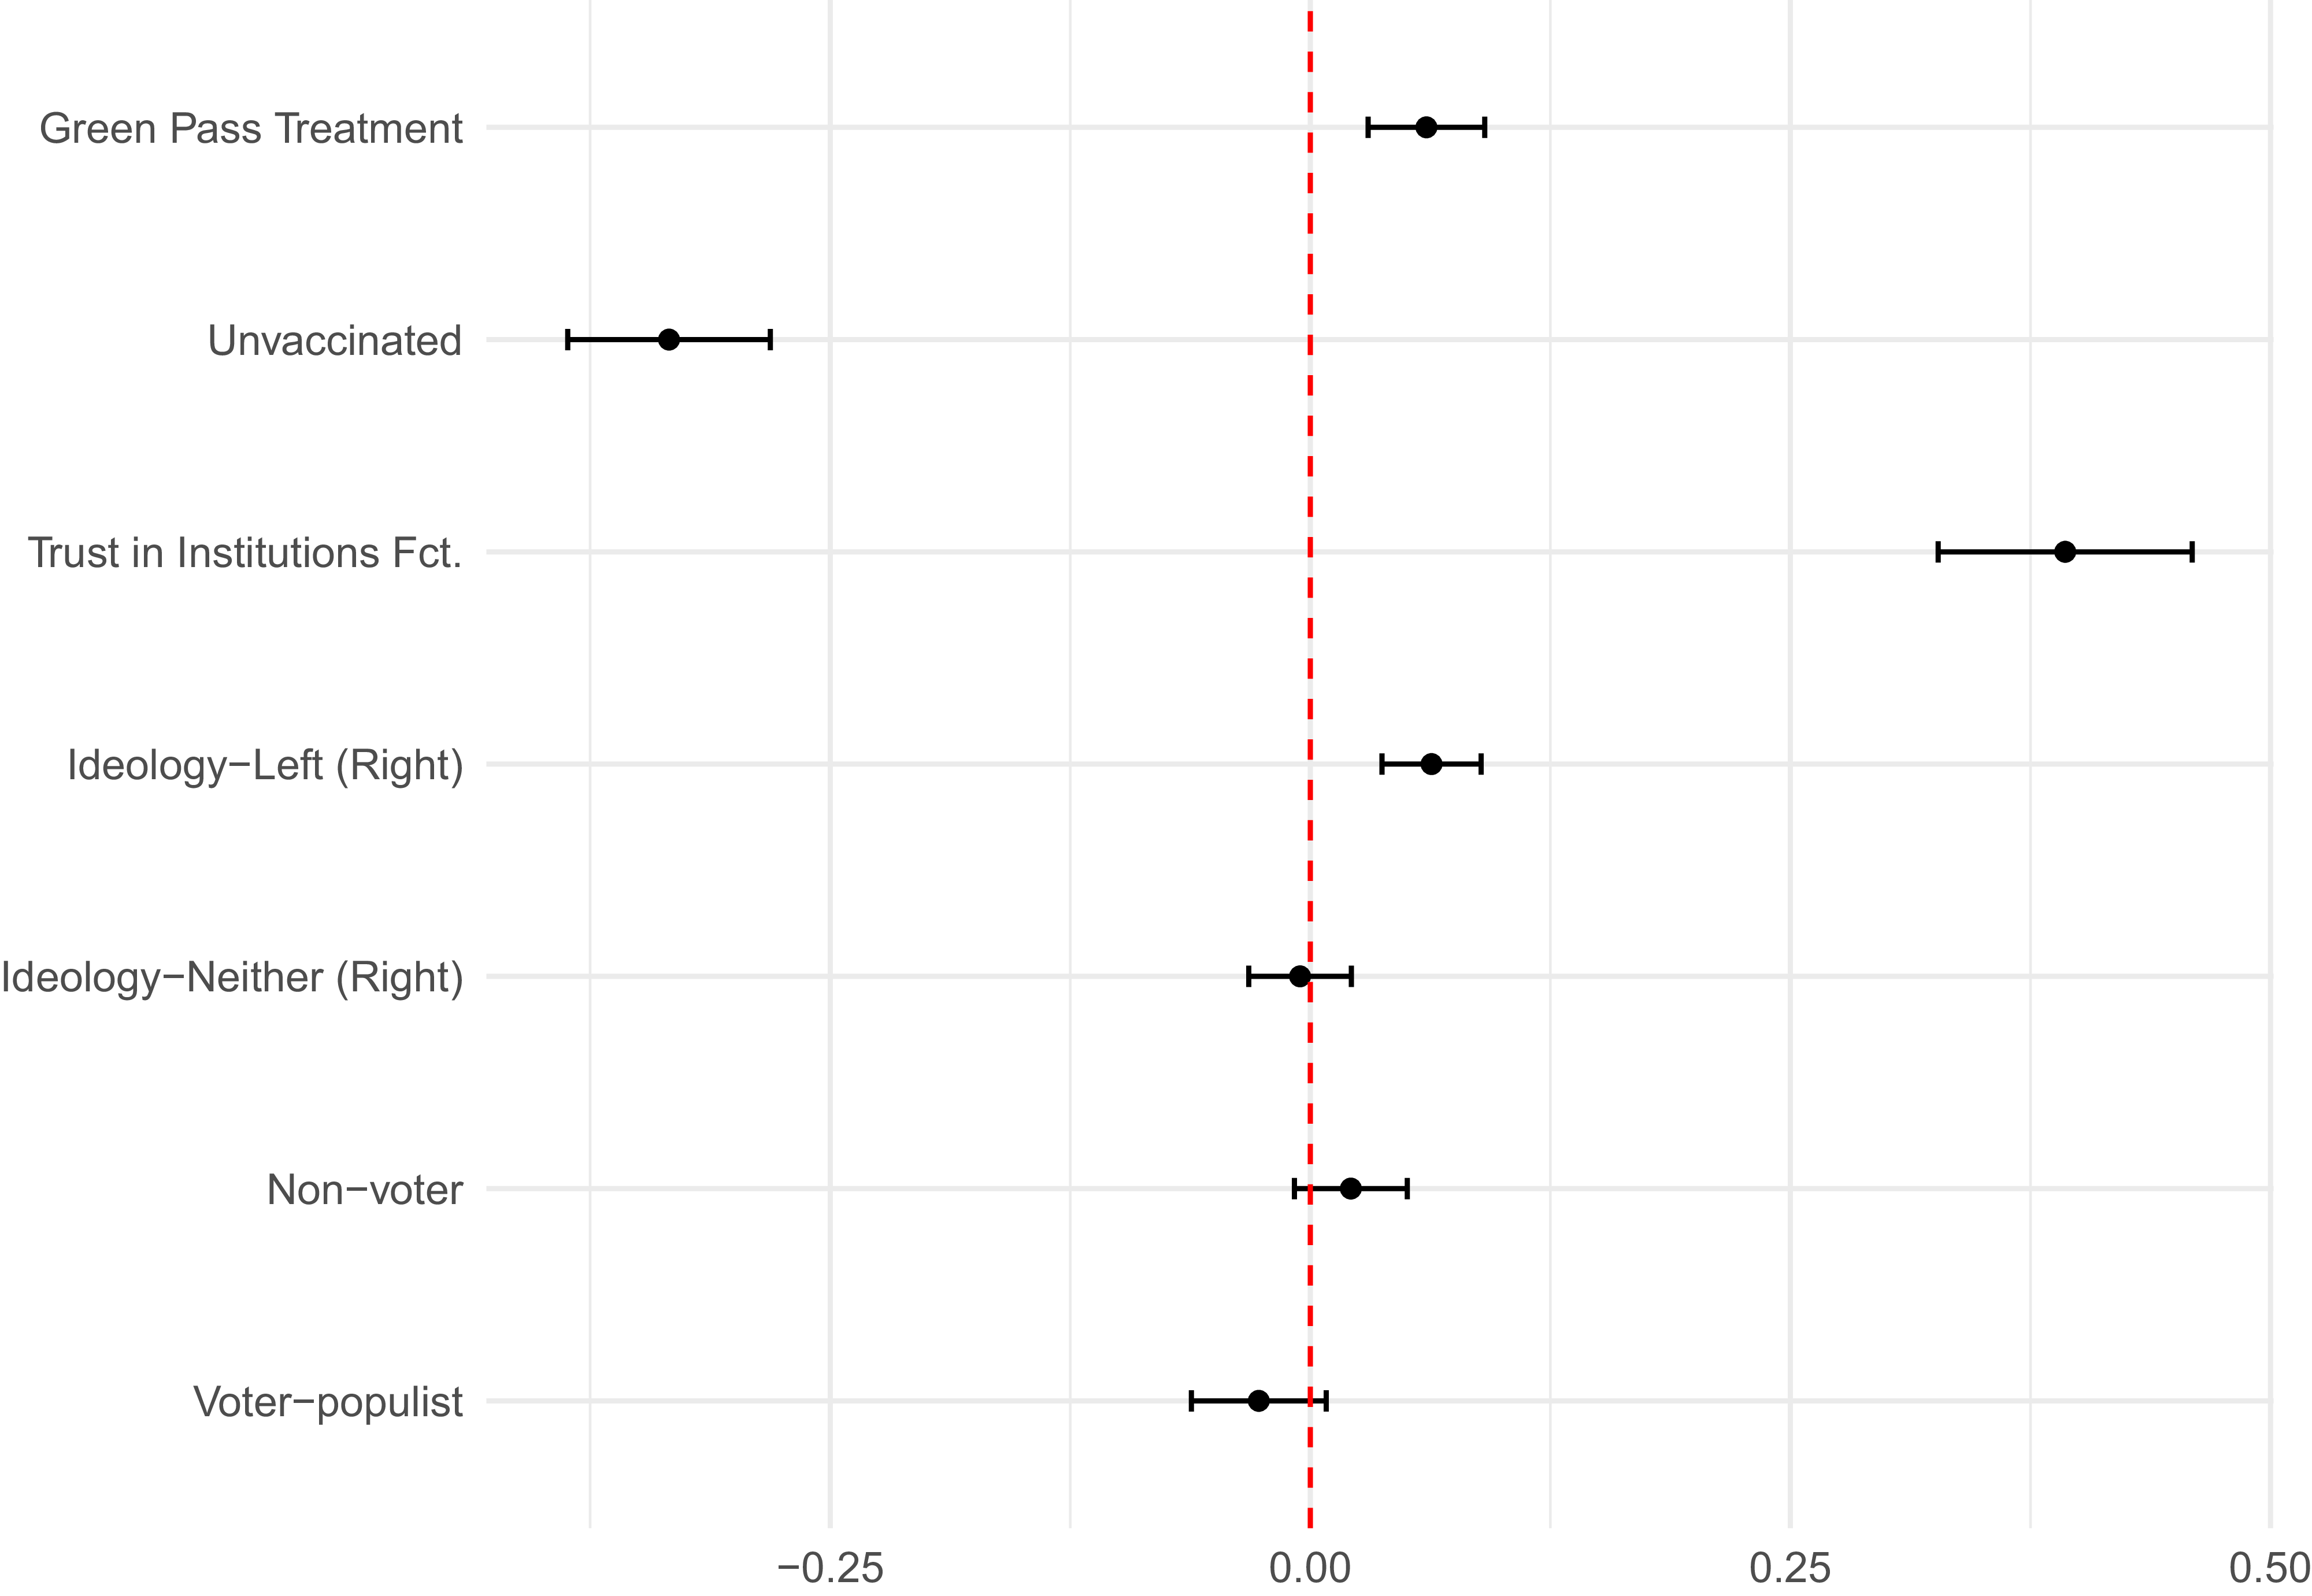
Figure 7 shows which factors contribute to the decision of getting vaccinated. The dependent variable takes the value of 1 for respondents who indicated that they are vaccinated and 0 for respondents who are not vaccinated. We use a linear probability model for ease of interpretation, but a logistic model yields the same results (see online Appendix Table A1, also for our full set of controls). All variables are re-scaled from 0 to 1; therefore, all effects can be interpreted as maximum effects in changing predicted probabilities for being vaccinated. We control for demographics, voting likelihood, satisfaction with the government’s handling of COVID-19, concern over COVID-19, and whether the respondent had ever tested positive for COVID-19. We first include the treatment as a simple balance test. As expected, there is no difference between treatment groups. After accounting for the other factors in our model, the country difference between Germany and the United Kingdom disappears.
Linear Probability Model – likelihood of being vaccinated.
Note: Linear probability model. Model includes a three-way interaction between country, vaccination status, and treatment, which are omitted from the graph. Controls omitted from the graph: gender, age, income, education, voting likelihood, satisfaction with COVID policy, concern with COVID, COVID diagnosis, and country.

Trust in institutions, captured by our factor, is the strongest predictor for vaccination status. The difference between the least and the most trusting individuals is a more than 40% higher likelihood of being vaccinated. These results correspond with findings from similar studies (ie studies that focus on compliance with preventive behavior more generally Becher, Stegmueller, Brouard et al. (Reference Becher, Stegmueller, Brouard and Kerrouche2021); Nielsen and Lindvall (Reference Nielsen and Lindvall2021); Han, Zheng, Cristea et al. (Reference Han, Zheng, Cristea, Agostini, Bélanger, Gt¨zkow, Kreienkamp and Leander2023)) but also studies that look at vaccine hesitancy and compliance (Lindholt, Jörgensen, Bor et al. Reference Lindholt, Jörgensen, Bor and Bang Petersen2021).
To assess the impact of ideology on a respondent’s vaccination status, we break up our 10-point ideology scale into three categories: respondents who position themselves between 0 and 4 are coded as ‘left’ and respondents who are between 6 and 10 are coded as ‘right’. The middle category (5) and non-responses are categorized as ‘neither’. The baseline category in our model is a right-wing respondent. Compared to self-identified right-wing respondents, both left-wing respondents and those who do not position themselves on this scale are more likely to be vaccinated by 10 and 6 percentage points, respectively.
Based on our question asking respondents who they voted for, we also created an indicator for those voting for populist parties (AfD and Die Linke in Germany, UKIP, BNP and Reform UK for the United Kingdom), mainstream parties (all the rest), or no party. Compared to voters supporting mainstream parties, those who expressed no preference for a party were not more or less likely to be vaccinated. However, voters who supported populist parties were considerably less likely to be vaccinated (12%). This is in line with other contributions that associate populist sentiments with lower levels of overall compliance with health regulations and vaccine hesitancy (Albrecht Reference Albrecht2022; Backhaus, Hoven and Kawachi Reference Backhaus, Hoven and Kawachi2023). The literature explains this with a generally higher level of distrust and anti-system attitude among supporters of populist and extremist parties (Bang Petersen, Bor, Jörgensen et al. Reference Bang Petersen, Bor, Jörgensen and Lindholt2021; Lindholt, Jörgensen, Bor et al. Reference Lindholt, Jörgensen, Bor and Bang Petersen2021). Moreover, the vaccination drive was a project closely governed by the political elite together with the scientific community, which evoked conspiracy theories and further opposition (Eberl, Huber and Greussing Reference Eberl, Huber and Greussing2021).
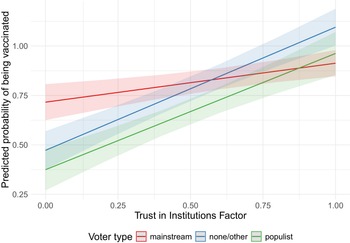
To adjudicate between H1a and H1b, we run a series of interactions between institutional trust, populist voting, vaccination status, and satisfaction with COVID policy. Figure 8 shows the predicted probabilities of being vaccinated according to trust in institutions and populist voting. We observe a compensation effect, whereby trust is more relevant for populist voters and non-voters. At lower levels of trust, both populist voters and non-voters are significantly less likely to be vaccinated compared to mainstream party voters. However, at higher levels of trust, they are just as likely to be vaccinated. This provides initial evidence for H1a over H1b.
Vaccination status by trust in institutions and populism.
Note: The coding of populist parties is based on the PopuList project (https://popu-list.org/).

Figure 9 shows the interaction effect between trust in institutions and our factor capturing satisfaction with COVID policy. We observe the same compensation trend: respondents who are dissatisfied with COVID policy are far less likely to be vaccinated when they have low trust in institutions, but just as likely when they have high trust in institutions. This provides further evidence of H1a over H1b.
Vaccination status by trust in institutions and satisfaction with COVID.

We now move on to assess how announcing restrictions for unvaccinated people affect their willingness to still get vaccinated. For this, we make use of data collected through a survey experiment that informed half of our respondents about upcoming restrictions (implementation of restrictions, such as ‘green passes’) for unvaccinated people. After the exposure to the information treatment, we asked our respondents whether they intended to get their first vaccination or a booster shot (for those already vaccinated). The answer to this question serves as our outcome variable in the following analyses. We first use the outcome variable in an observational setting to test our political hypotheses. The observations for the two countries and experimental groups are pooled. We control for the treatment, country, demographics, voting likelihood, concern with COVID, COVID diagnosis, satisfaction with COVID policy, and existing vaccination status, as well as the three-way interaction between country, treatment, and vaccination status. The results are plotted in Figure 10.Footnote 25
OLS – likelihood of future vaccination.
Note: Linear probability model. Controls omitted from the graph: gender, age, income, education, voting likelihood, satisfaction with COVID policy, concern with COVID, COVID diagnosis, and country.

As expected, an individual’s existing vaccination status is one of the strongest predictor for future vaccination. Not being already vaccinated reduces the probability of getting vaccinated by more than 30 percentage points compared to the probability of getting a booster shot for those already vaccinated. Importantly, the maximal effect of trust in institutions is even stronger. The difference between those with the highest and lowest level of institutional trust is a 40 percentage point reduction in the probability of getting a new vaccine. Other factors, such as ideology, have more modest effects. The effect for populist voters remains negative, though no longer statistically significant.
We conduct a further test for differentiating between H1a and H1b, that is, between the compensation and amplifying effects of trust in institutions, by asking whether trust in institutions has a stronger effect for those already vaccinated or those not yet vaccinated. Figure 11 plots the predicted values. In line with other findings, and with H1a, trust in institutions has a stronger effect for those not yet vaccinated. At low levels of trust, both those already vaccinated and the unvaccinated are less likely to opt for a new vaccine. However, the effect is much more pronounced for the unvaccinated. Conversely, the gap between the two groups narrows, without fully closing, at high levels of institutional trust. Trust, therefore, again shows a compensation effect. Whatever the reasons are for individuals not wanting to vaccinate, it appears that trust compensates, to a degree, for those reasons, and is associated with a higher likelihood of wanting a new vaccine.
Predicted values for future vaccination for vaccinated and unvaccinated respondents (by Trust in Institutions).

Impact of policy change on vaccination drive (experiment)
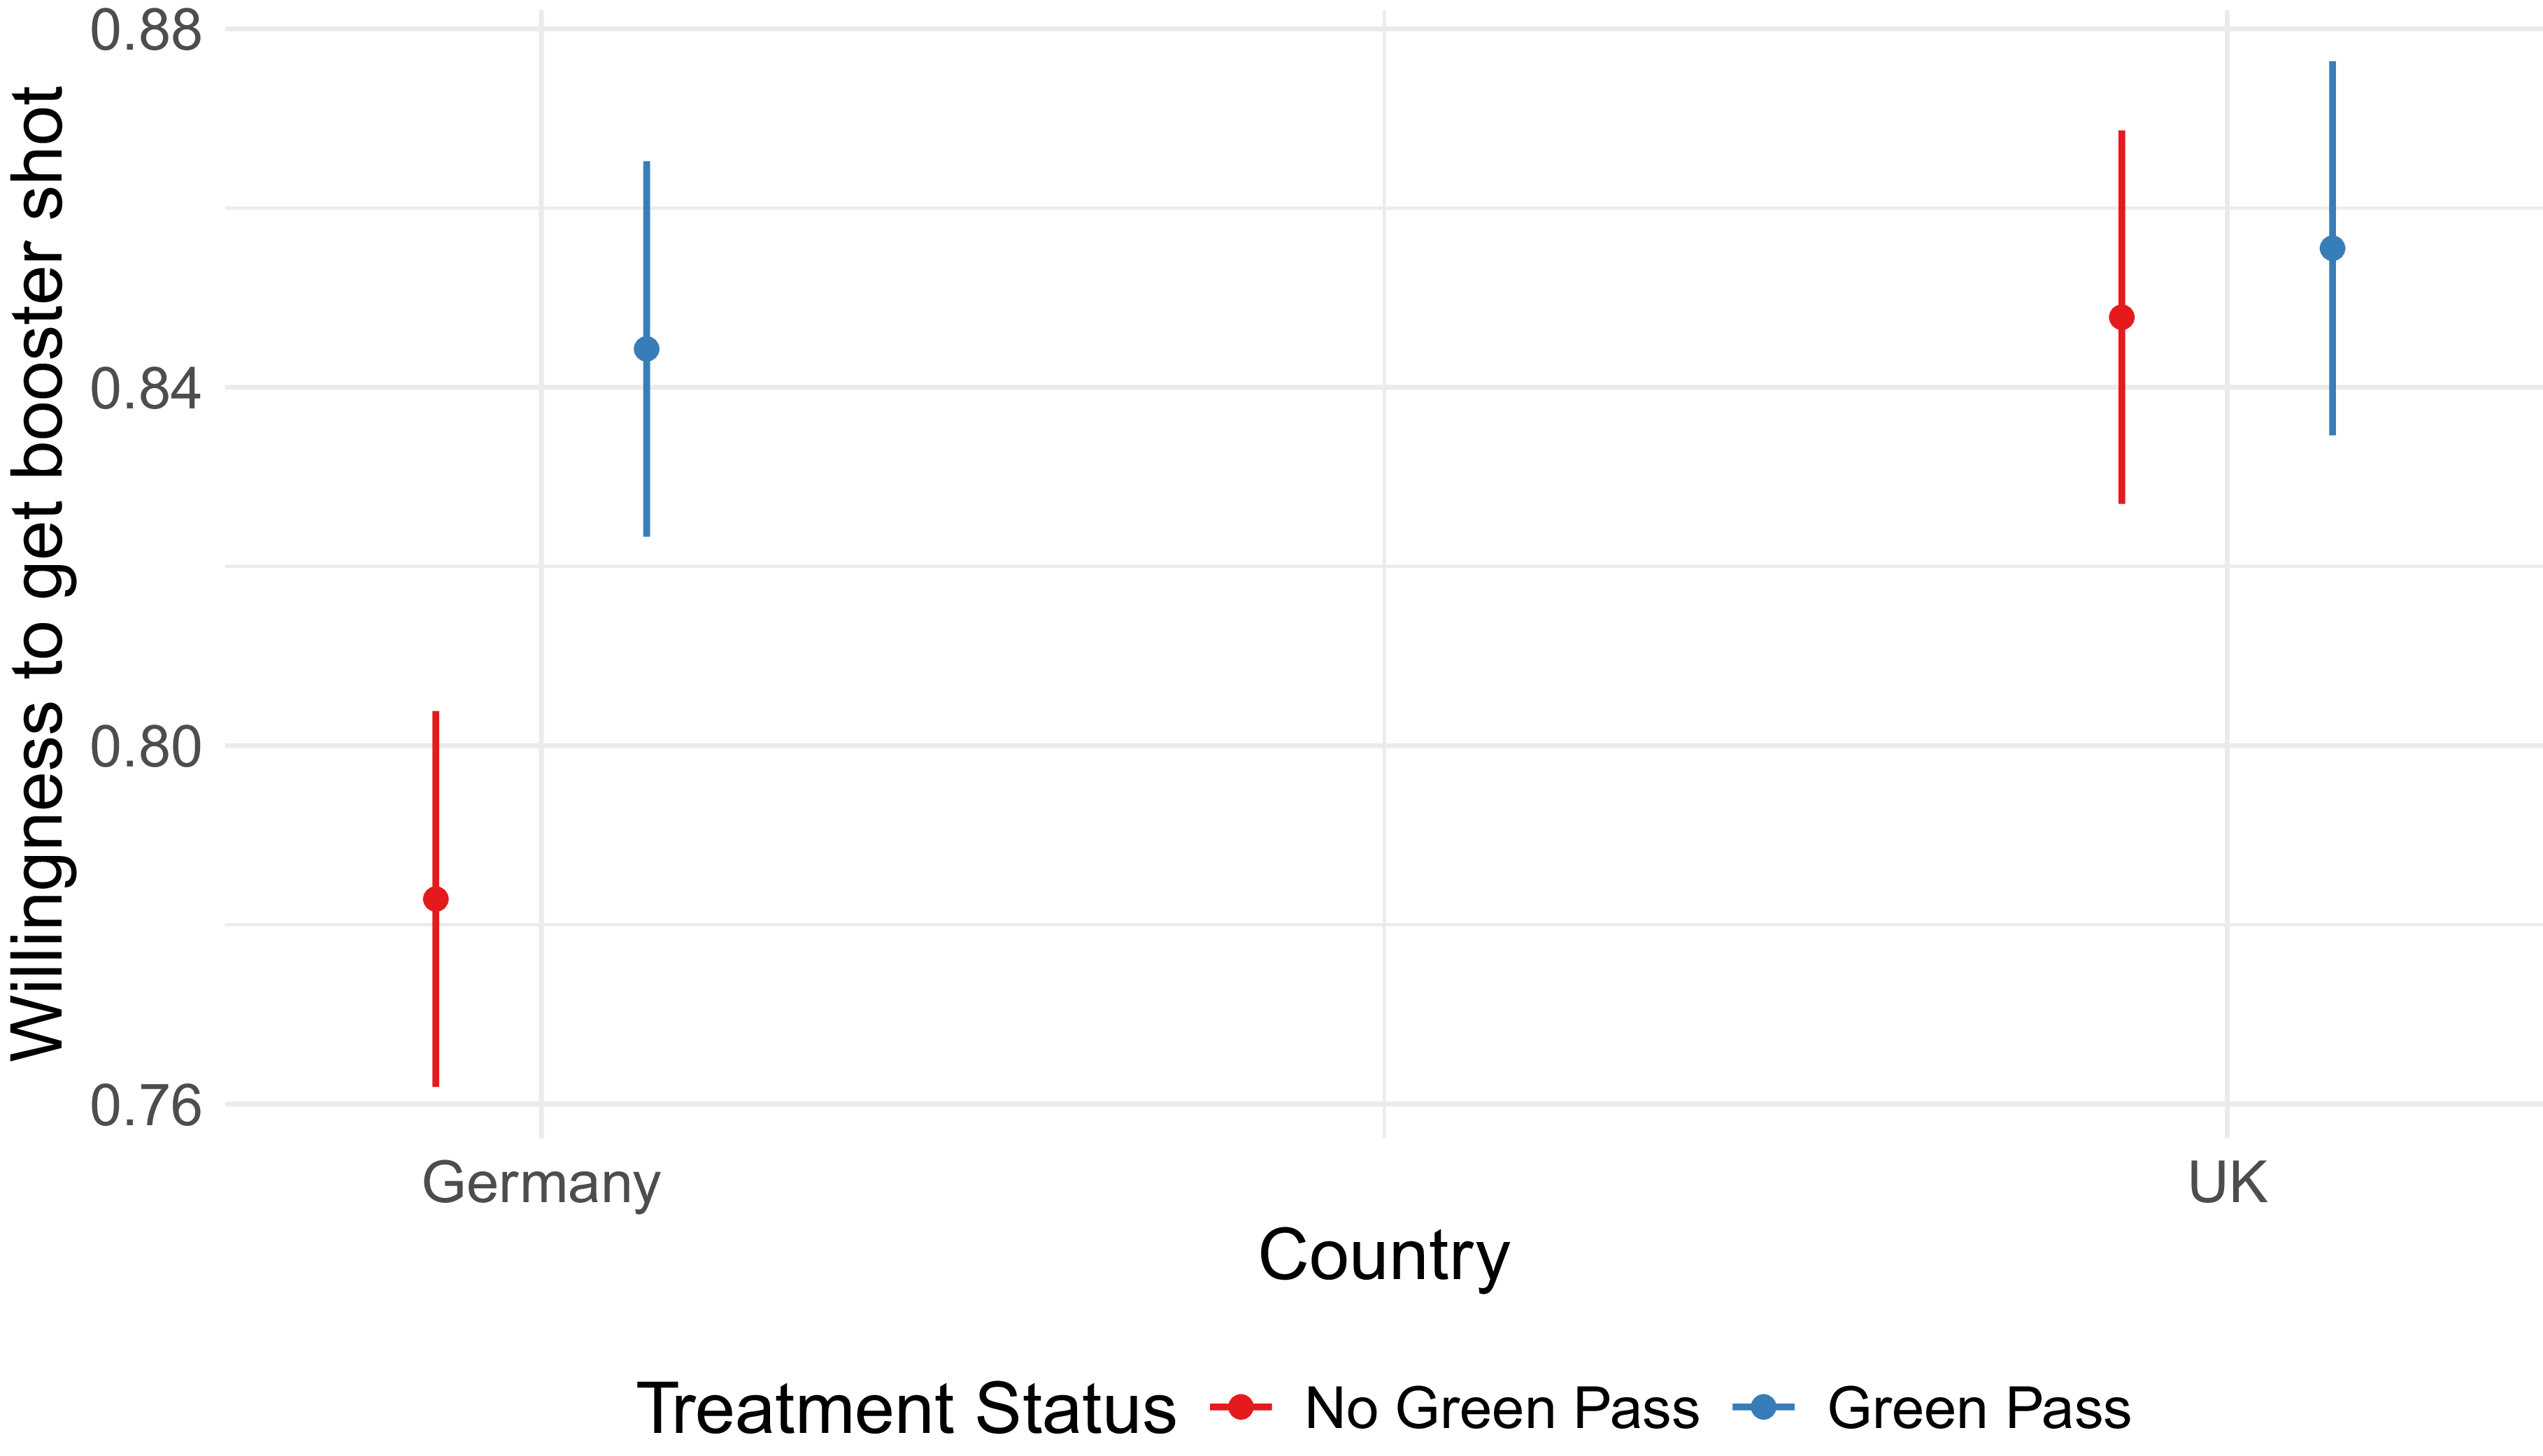
As discussed in the introduction and the background section, governments implemented a range of policies with the aim to a) protect vulnerable citizens and – at a later stage – to incentivize hesitating people to get vaccinated. We now turn to the impact of coercive policy on the decision to get vaccinated and our experimental results. Figure 12 shows the average treatment effect by country for the people who – at the time when the experiment was fielded – were already vaccinated (see also online Appendix Table A3). The policy treatment (the information that the government plans to implement a green pass) has a statistically significant and positive effect in Germany. Respondents who received the policy treatment are about 8 percentage points more likely to want to get a booster shot after learning that the government plans to implement a ‘green pass’ policy for people to access certain services and hospitality. The treatment has no statistically significant effect in the United Kingdom, meaning that respondents who learn about the potential introduction of COVID passports do not differ in their likelihood to get a booster shot or not. One reason for this might be a ceiling effect. About 85% of UK respondents who were vaccinated were already intending to get a booster shot. This figure is only reached by our treated German respondents. The remaining 15% might simply be unresponsive to this type of policy.Footnote 26
Average treatment effect – vaccinated group.

To adjudicate between H2a and H2b, we run heterogeneous effects by trust in institutions. Figure 13 shows the predicted probabilities to get a booster shot according to treatment status and trust in institutions.Footnote 27 In line with the main specification, we find no effect for the United Kingdom. For Germany, we find that trust in institutions and the policy treatment are compensatory. That is, at low levels of trust, the policy instrument has a much stronger effect, an almost 20 percentage point difference in willingness to get a booster shot. This gap narrows as trust in institutions rises. Both treatment and control groups are as likely to get vaccinated when trust in institutions is very high – the predicted probabilities are, in fact, close to 1, indicating a ceiling effect at high levels of institutional trust. In other words, very highly trusting individuals are ‘always-takers’, they would get the booster shot with or without the policy intervention. Low-trusting individuals can, in fact, be persuaded by a policy intervention even if this intervention is not related to trust but is rather coercive. Therefore, in line with our observational findings, we observe a compensation effect of trust, thus supporting H2a.
Trust and treatment effect – vaccinated.

When we turn to heterogeneity by ideology, we see that it plays a more limited role. While right-wing and unaffiliated individuals are less likely overall to get vaccinated, they do not seem to respond differently to the treatment. Online Appendix Table A4 shows the null result. We do observe heterogeneity when it comes to voter type. Online Appendix Figure A3 shows that, in Germany, non-voters are more responsive to the treatment (echoing the effect of low trust). In the United Kingdom, it is populist voters that are more responsive to the treatment. This is the same dynamic that we see with low trust in Germany. These are populist-voting individuals who got the initial round of vaccination but are more resistant to get a booster. The treatment brings them in line with other types of voters in the United Kingdom.
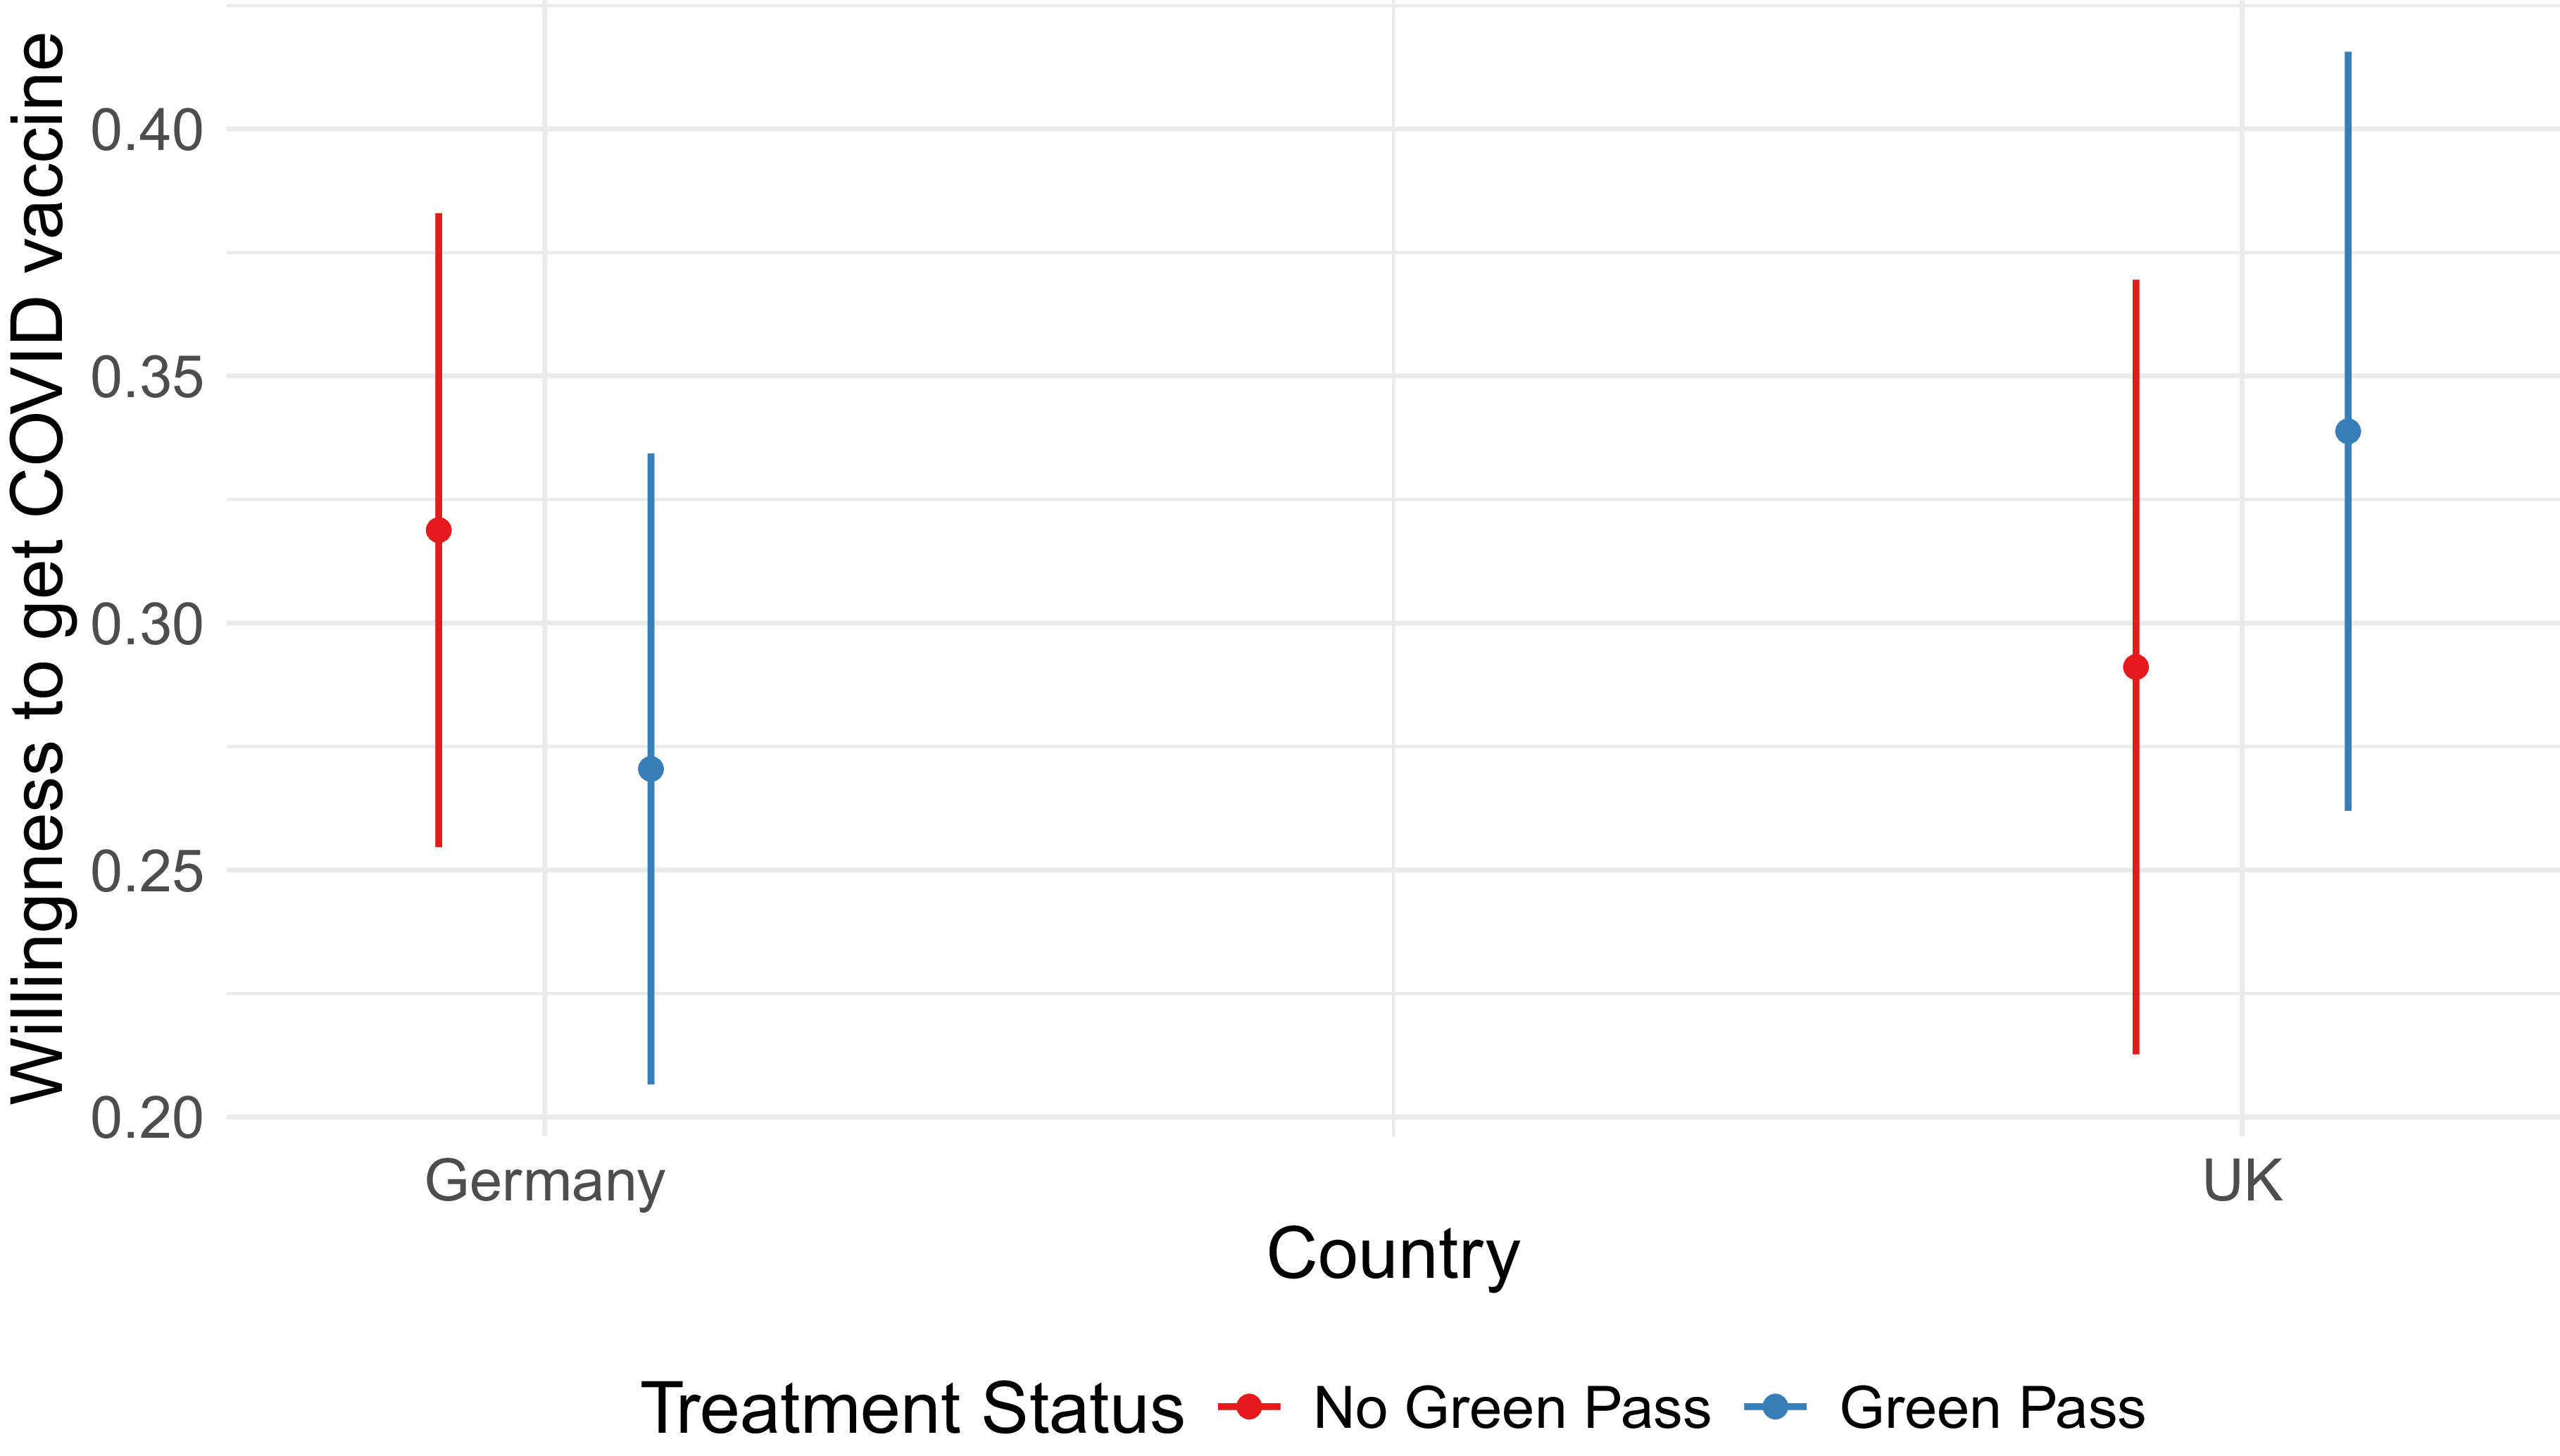
When we look at the unvaccinated group (Figure 14), we see no main effect for either country. This suggests that such policies are not an effective tool to convince vaccine-skeptical individuals to get vaccinated. However, these results need to be taken with a grain of salt as our sample only includes 368 respondents (across both countries) who indicated that they were not vaccinated at the time we fielded our survey. The same is true for heterogeneous effects by trust in institutions (Figure A2) and ideology (Table A4).
Average treatment effect – unvaccinated group.

Conclusion
The findings of this study highlight the critical role of trust in institutions has for policy compliance, in particular during times of crisis. Trust is not only a ‘vaccine against the disease of misinformation’ but has proven to be – as our analyses show – a cornerstone of vaccine roll-out in both countries. While trusting people, on average, are more likely to comply with the vaccine mandate, trust becomes particularly relevant if the policy is met by ideological and political resistance. In such situations, trust in institutions and politics compensates for otherwise missing factors that motivate citizens to comply with policies.
Our experimental results confirm these patterns. In Germany, vaccinated individuals were more likely to say that they would get a booster in the ‘green pass’ scenario, suggesting that the policy can drive up vaccination rate. Importantly, this effect is strongest for individuals who do not trust institutions. Again, we see a ‘compensation’ effect, whereby trust in institutions compensates for other reasons why individuals might not get vaccinated.
Our results also show that policies that go beyond informing people about the necessity and importance to adhere to a policy, or reduce costs and ease access to a policy, have their limits. Policies, such as the announcement to implement restrictions and link certain activities to a persons’ vaccination status, may incentivize some individuals to comply but could also lead to a backlash effect and solidify a citizen’s decision of non-compliance. While our results point in that direction, the number of unvaccinated people in our sample is too small to get statistically significant results. Other studies point to increased vaccine uptake as well as backlash from coercive policies, among skeptical groups (de Figueiredo, Larson and Reicher Reference de Figueiredo, Larson and Reicher2021; Steinert, Sternberg, Prince et al. Reference Steinert, Sternberg, Prince, Fasolo, Galizzi, Büthe and Veltri2022; Boland, Starke, Bensmann et al. Reference Boland, Starke, Bensmann, Marcinkowski and Dietze2024). Coercive policies, however, do not generate a backlash effect among the group of already vaccinated citizens who have to get a booster shot. Institutional trust generates understanding for more coercive policies implemented in times of crisis characterized by extraordinary circumstances.
Our findings further underscore the relevance of institutional trust as a good that governments in representative democracies cannot dispense with. This is particularly relevant when the policies that governments formulate interfere with people’s right to physical integrity and personal freedoms as it was the case during the public health crisis caused by COVID-19. These decisions were also taken under tremendous time pressure and outside regular legislative procedures. While crises at first lead to higher levels of trust (Van der Meer, Steenvoorden and Ouattara Reference Van der Meer, Steenvoorden and Ouattara2023; Esaiasson, Sohlberg, Ghersetti et al. Reference Esaiasson, Sohlberg, Ghersetti and Johansson2021), this effect tends to wane off over time with levels of trust declining significantly (Gualano, Lo Moro, Voglino et al. Reference Gualano, Lo Moro, Voglino, Bert and Siliquini2022; Weinberg Reference Weinberg2022). Therefore, it is all the more important that political actors contribute to nurture and preserve trust during ‘normal’ times.
Our findings carry important implications for policy design during public health crises. While coercive instruments like ‘green pass’ policies can increase compliance among low-trusting individuals, policymakers should recognize that trust-building and coercive measures operate as complements rather than substitutes in achieving widespread voluntary compliance. In contexts where institutional trust is low, governments face a dual challenge: they have to design and implement policies that trigger immediate behavioral change while simultaneously investing in longer-term trust-building efforts. This suggests a sequenced approach where coercive measures provide short-term compliance gains while transparent communication, consistent messaging from credible experts, and inclusive deliberative processes should be in place that work toward rebuilding and maintaining institutional trust over time (Lalot, Heering, Rullo et al. Reference Lalot, Heering, Rullo, Travaglino and Abrams2022; Goldstein and Wiedemann Reference Goldstein and Wiedemann2022). Critically, over-reliance on coercive tools without attending to trust erosion may lead to a vicious cycle where low-trusting citizens increasingly resist government directives, necessitating ever-more coercive interventions (Jörgensen, Bor and Bang Petersen Reference Jörgensen, Bor and Bang Petersen2024). Policymakers should therefore carefully calibrate the stringency of coercive measures, weighing immediate public health benefits against potential long-term damage to institutional trust, particularly among already-skeptical populations. Investment in procedural justice – ensuring that policy processes are perceived as fair, transparent, and responsive – may help maintain trust even when coercive measures are deemed necessary (Marien and Hooghe Reference Marien and Hooghe2011; Van der Meer and Hakhverdian Reference Van der Meer and Hakhverdian2017).
Our cross-country results point to a ceiling effect in the United Kingdom. The higher share of vaccine-skeptical respondents in Germany results in a stronger effect of the ‘green-pass’ policy. This is in line with other research that found greater vaccine skepticism in German-speaking countries (Desson, Kauer, Otten et al. Reference Desson, Kauer, Otten, Peters and Paolucci2022). We note that the compensation thesis also holds in the United Kingdom, where respondents with populist views who are exposed to the treatment reach compliance levels close to those voting for mainstream parties. However, the ceiling effect implies that coercive policies are more effective in countries with moderate compliance with policy, such as Germany. Ultimately, our study is also limited by the two countries that we look at. Further research can corroborate our findings in other contexts. Further research can also investigate how trust and coercive policies interact with other attitudes related to vaccination, such as ‘healthism’ (Kirbiš Reference Kirbiš2023). Finally, our study of the effects of coercive policy uses hypothetical scenarios in a vignette experiment. While the external validity of such a scenario is high, given that such proposals were discussed in both countries at the time, this remains a hypothetical scenario. Further research can corroborate our findings with longitudinal analysis and more qualitative data.
Supplementary material
The supplementary material for this article can be found at https://doi.org/10.1017/S147567652610125X
Data availability statement
Data and replication code are available on Harvard Dataverse: https://doi.org/10.7910/DVN/MPIGKQ.
Acknowledgements
We are grateful to Tamara Popic for extensive comments which greatly improved the paper. We would also like to thank participants in the 2024 Council for European Studies Conference, Radical Movements and the Politics of Health Panel, as well as participants in the Crisis of Expert Knowledge and Authority seminar at the European University Institute, for their valuable feedback.
Funding statement
This study did not receive financial support.
Competing interests
The authors declare no competing interests.
Ethical standards
This study was performed in line with the principles of the Declaration of Helsinki. Informed consent was obtained from all individual participants included in the study.






 Open access

