1. Introduction
The evolution and nucleosynthesis of the most metal-poor stars and, in particular, the determination of the mass thresholds for the formation of SNe at the lowest metallicity regimes hold some of the clues to understanding the formation and early chemical evolution of galaxies.
According to the ⋀ −Cold Dark Matter model, the current standard model of Big-Bang cosmology, the first starsFootnote a formed at redshift z ∼ 20–30, just a few hundred million years after the Big-Bang, in ∼106 M⊙ mini-halos where atomic gas and traces of H2 could efficiently condense and radiatively cool. This theory was presented by Couchman & Rees (Reference Couchman and Rees1986) and Tegmark et al. (Reference Tegmark, Silk, Rees, Blanchard, Abel and Palla1997), although the interest in the evolution of metal-free stars dates from more than two decades earlier. Ezer (Reference Ezer1961) computed pure hydrogen zero-age main sequence models over a wide range of masses. Truran & Cameron (Reference Truran and Cameron1971) proposed that the first stars in the universe were the direct nucleosynthetic heirs of the Big-Bang. This origin determined their pristine composition, consisting of H, He, and trace amounts of light elements.
During the 1970s, the interest in the evolution of metal-free and very metal-poor stars was consolidated, and it has continued to the present day. Simultaneously, the study of primordial star formation and of the primitive initial mass function (IMF) developed. The debate on the possibility of occurrence of non-massive metal-free stars and on the actual shape of the ancient IMF began. High-resolution multidimensional hydrodynamical calculations have recently confirmed the possibility of forming primordial low-mass stars [see, for instance, Susa, Hasegawa, & Tominaga (Reference Susa, Hasegawa and Tominaga2014) and references therein]. Nevertheless, the concept of critical metallicity (Bromm et al. Reference Bromm, Ferrara, Coppi and Larson2001), which refers to the minimum metal content required for the formation of low-mass stars, seems to be observationally supported (Frebel, Johnson, & Bromm Reference Frebel, Johnson and Bromm2007), and thus the debate over the existence of low-mass primordial stars is not over yet.
Given the uncertainties in the IMF for the most metal-poor stars, and the lack of observational constraints, we must face the uncertainty of their existence, although so must those studying hyper-massive stars (Heger et al. Reference Heger, Baraffe, Fryer and Woosley2001). Metal-poor models are further hampered by many unknowns, mostly related to stellar mixing, the location of convective boundaries, and mass-loss rates due to stellar winds. These uncertainties also affect stellar modelling at higher Z [see, for instance, the discussion in Doherty et al. (Reference Doherty, Gil-Pons, Siess and Lattanzio2017) and references therein], although in such cases calibration by comparison with observations is more often feasible and some restrictions on input physics can be obtained. This is not the case in the most metal-poor regime because of different reasons. First, the possibility of comparing with observations is limited because of the relatively small sample of detected objects in the most metal-poor regime. At present, only ∼ 10 stars are known to have metallicity [Fe/H]Footnote b < −4.5 (Starkenburg et al. Reference Starkenburg2017; Aguado et al. Reference Aguado, Allende Prieto, González Hernández and Rebolo2018; Bonifacio et al. Reference Bonifacio2018; and references therein). The record is held by the star detected by Keller et al. (Reference Keller2014), with [Fe/H]<−7.1. As metallicity increases, so does the number of observed stars. According to the SAGA database (Suda et al. Reference Suda2008; Suda et al. Reference Suda, Yamada, Katsuta, Komiya, Ishizuka, Aoki and Fujimoto2011; Yamada et al. Reference Yamada, Suda, Komiya, Aoki and Fujimoto2013; Suda et al. Reference Suda2017b), there are ∼ 500 stars with [Fe/H] < −3. Second, even the most metal-poor stars detected may be the descendants of not one but a few approximately coeval objects. Their surface abundances may have suffered some degree of pollution due to internal processes such as dredge-up episodes, and accretion from the interstellar medium. Finally, as will be reviewed in this work, computation of the evolution of the most metal-poor stars is very demanding. Low-mass stars experience violent flashes which put hydrostatic codes at the limit of their performance (Picardi et al. Reference Picardi, Chieffi, Limongi, Pisanti, Miele, Mangano and Imbriani2004; Campbell & Lattanzio Reference Campbell and Lattanzio2008; Woodward, Herwig, & Lin Reference Woodward, Herwig and Lin2015); more massive objects can experience thousands of thermal pulses (Lau, Stancliffe, & Tout Reference Lau, Stancliffe and Tout2008; Gil-Pons et al. Reference Gil-Pons, Doherty, Lau, Campbell, Suda, Guilani, Gutiérrez and Lattanzio2013) and not only their detailed nucleosynthetic yields but even their fates as white dwarfs or SNe are, at present, uncertain for relatively wide ranges of initial masses and metallicities.
The evolution of stars of metallicity Z ≲ 10−4−10−3 has been extensively studied and is relatively well understood [see, for instance, Iben (Reference Iben2012)]. Their fate depends primarily on their mass, but the initial composition, input physics, or the presence of a companion star can also play a crucial role and modify their fate. Traditionally, single stars with initial mass M ZAMS ≲ 7‒10 M⊙ (depending on the metallicity) will develop a degenerate core and end their lives as white dwarfs. The more massive counterparts on the other end will go through all nuclear burning stages and explode as core-collapse SNe (CC SNe, CC SN for the singular). However, in between these two recognised stellar components, there is a very narrow mass range of 0.2–0.5 M⊙ width beyond the maximum mass for the formation of white dwarfs where stars are likely to evolve as electron-capture SNe (EC-SNe, EC-SN for the singular). These explosions are triggered by electron captures on 24Mg and 20Ne in the degenerate ONe core. EC-SNe have attracted interest in the 1980s (Miyaji et al. Reference Miyaji, Nomoto, Yokoi and Sugimoto1980; Nomoto Reference Nomoto1984; Nomoto Reference Nomoto1987), and models have been subsequently improved. More realistic EC-SN progenitors, including the evolution from the main sequence, with updated input physics, and closer to the time of the explosion have been presented since then (Ritossa, García-Berro, & Iben Reference Ritossa, García-Berro and Iben1999; Jones et al. Reference Jones, Ritter, Herwig, Fryer, Pignatari, Bertolli and Paxton2016).
Intermediate-mass stars can be defined as those of mass high enough to avoid a core He flash, but not massive enough to end their lives as CC SNe. They become white dwarfs when they are able to lose their envelopes by stellar winds before their cores reach the Chandrasekhar mass, M Ch. If some mechanism prevents envelope ejection before the core reaches M Ch, a SN explosion would ensue. This type of SN (in a metallicity-independent context) was first proposed by Arnett (Reference Arnett1969) and later named SN I1/2 by Iben & Renzini (Reference Iben and Renzini1983), after considering that the explosion mechanism should be similar to that of a thermonuclear Type Ia SN, but that these objects should show hydrogen in their spectra, like a type-II SN. According to Iben & Renzini (Reference Iben and Renzini1983), SN I1/2 explosions could be expected at least for the most massive Asymptotic Giant Branch (AGB) stars, which experienced C ignition before their cores were reduced to masses below M Ch. However, detailed evolutionary calculations [see Siess (Reference Siess2010) and references therein] showed that this SN mechanism was prevented by the ejection of the stellar envelope (through winds), before the core reached M Ch. Interest in SN I1/2 grew again in the 2000s in the context of the evolution of primordial stars with very weak stellar winds. The possibility that they could have existed in the primitive universe was discussed first in Zijlstra (Reference Zijlstra2004) and later in Gil-Pons, Gutiérrez, & García-Berro (Reference Gil-Pons, Gutiérrez and García-Berro2007) and Lau et al. (Reference Lau, Stancliffe and Tout2008). Note that, as happens for higher metallicity stars, the occurrence of metal-poor intermediate-mass stars in close binary systems may drastically alter their evolution and fates.
Gaining insight into stellar evolution at the extremely metal-poor (EMP) regime ([Fe/H] ≲ −3 or Z ≲ 10−5, assuming scaled solar composition) represents a small but nevertheless potentially important part in the formidable problem of understanding the primitive universe. It involves, besides stellar evolution and nucleosynthesis, additional inputs from different fields of astrophysics. Cosmological and star formation theories should be considered, as well as interstellar medium physics, thermodynamical and chemical evolution, and galaxy formation theories [see, for instance, the review by Karlsson, Bromm, & Bland-Hawthorn (Reference Karlsson, Bromm and Bland-Hawthorn2013)].
Increasingly powerful computational resources enable us to construct refined models, and investigate a much more extended range of possible input physics. The huge increase in observational data of metal-poor stars coming from big surveys, such as the HK objective-prism survey (Beers, Preston, & Shectman Reference Beers, Preston and Shectman1992), the Hamburg-ESO survey (Christlieb, Wisotzki, & Graßhoff Reference Christlieb, Wisotzki and Graßhoff2002), SkyMapper (Keller et al. Reference Keller2007), the Sloan Extension for Galactic Understanding and Exploration (Yanny et al. Reference Yanny2009), and the Large Sky Area Multi-Object Fibre Spectroscopic Telescope (Cui et al. Reference Cui2012), will be further expanded with the new wide-field multi-object spectrograph for the William Herschel Telescope, WEAVE (Dalton et al. Reference Dalton2012), the PRISTINE survey (Starkenburg et al. Reference Starkenburg, Shetrone, McConnachie and Venn2014), and, specially, with the James Webb Space Telescope (Zackrisson et al. Reference Zackrisson, Rydberg, Schaerer, Östlin and Tuli2011). They will provide us with a wealth of information about the elusive [Fe/H] ≤ −4.5 (Z ≲ 5 × 10⁻⁷) stars, to which the findings of the computational models described in this work relate.
In the present work, we compile and discuss our current knowledge of the evolution and fates of single intermediate-mass stars between primordial metallicity and Z = 10−5. For the sake of providing context, we also summarise the successes and problems of low- and high-mass stellar models in the interpretation of observations of metal-poor stars. This document is structured as follows. Section 2 reviews the history of the understanding of primordial star formation, and of stellar evolution at the lowest metallicities. Section 3 summarises the evolution of intermediate-mass stars in the considered metallicity regime. Section 4 delves into the main uncertainties which affect our knowledge of these stars. Section 5 is devoted to analysis of their final fates, considering different input physics. Section 6 summarises the main features of the most metal-poor stars detected. Section 7 describes the nucleosynthesis of intermediate-mass stars of Z ≤ 10−5 and relates it to observational evidence introduced in Section 6. In the last section, the results presented in this review are discussed, and possible future lines of work are outlined.
The following nomenclature is used in the present manuscript. Unless otherwise stated, metallicity Z is the total mass fraction of metals, meaning all species other than H and He. Metallicity may also be expressed by referring to solar values, such as via [Fe/H], according to the standard expression given in Footnote 2. EMP stars in this work refer to those whose metallicity Z ≤ 10−5. Note that the standard definition of EMP corresponds to stars with [Fe/H] < −3 (Beers & Christlieb Reference Beers and Christlieb2005). Using standard solar composition values [see Asplund et al. (Reference Asplund, Lambert, Nissen, Primas and Smith2006) and references therein], Z ∼ 10−5 is equivalent to [Fe/H] < −3, except for a few 0.1 dex. However, it should be noted that, given their origin either as primordial or descendants of primitive SNe, EMP stars are not expected to have abundances that are simply scaled versions of the solar composition, and observations confirm this trend [see, for instance, Bonifacio et al. (Reference Bonifacio2015), Keller et al. (Reference Keller2014), Yong et al. (Reference Yong2013a), or Caffau et al. (Reference Caffau2011)]. The entire metallicity range from Z ∼ 10−5 ([Fe/H] ∼−3) down to Z ∼ 0 is included in the expression primordial to EMP stars. According to Beers & Christlieb (Reference Beers and Christlieb2005), ultra metal-poor and hyper metal-poor stars refer to stars with [Fe/H] <−4 and [Fe/H] <−5, respectively. Primordial stars have been computed either using a strict zero metal content or considering Z ZAMS ∼ 10−10. This value is above the expected Big-Bang nucleosynthesis metallicity (Coc et al. Reference Coc, Vangioni-Flam, Descouvemont, Adahchour, Angulo, Arnould, Lewitowicz, Münzenberg, Akimune, Ohta, Utsunomiya, Wada and Yamagata2004) but, as we will show in Section 3, it still preserves the characteristics of primordial star evolution. Note also that the intermediate-mass stars we analyse, although initially metal-poor, may evolve to become highly enriched in metals during their evolution. Strictly speaking, it would be more correct to refer to them as “iron-poor”, but we will still call them metal-poor, following the more frequent nomenclature in the literature.
2. The nature of ancient stars and the history of their modelling
The first models of stars composed purely of H and He started appearing in the literature during the early 1970s. The evolution of the main central H- and He-burning stages in a wide range of masses, from the low to the massive cases, was computed by Ezer & Cameron (Reference Ezer and Cameron1971), Ezer (Reference Ezer1972), and shortly afterwards by Cary (Reference Cary1974), and Castellani & Paolicchi (Reference Castellani and Paolicchi1975). Wagner (Reference Wagner1974) undertook the first exploration of the behaviour of stars as a function of metallicity Z and concluded that this behaviour became independent of Z for values Z ≲ 10−6. D’Antona & Mazzitelli (Reference D’Antona and Mazzitelli1982) were the first to report the existence of a helium flash in a low-mass primordial star.
Understanding the first stars also involves understanding their formation process and the primitive IMF. Yoneyama (Reference Yoneyama1972) concluded that, in the absence of metals, primordial clouds would lack the dust and heavy molecules able to provide the necessary cooling and fragmentation mechanisms which drive the formation of non-massive stars.Footnote c This result was in sharp contrast to the present observed IMF (Salpeter Reference Salpeter1955; Miller & Scalo Reference Miller and Scalo1979; Kroupa Reference Kroupa2001; Chabrier Reference Chabrier2003) that favours low-mass stars. Carlberg (Reference Carlberg1981) and Palla, Salpeter, & Stahler (Reference Palla, Salpeter and Stahler1983) found that absorption in the H2 molecule could provide the necessary cooling to form low-mass primordial stars. Also on the basis of H2-cooling, Yoshii & Saio (Reference Yoshii and Saio1986) reported a primordial IMF that peaked at intermediate-mass values, between 4 and 10 M⊙. The latter results motivated interest in a further study of the evolution and nucleosynthesis of the late stages of low- and intermediate-mass stars (as well as massive), and a number of works dealing with the absence or existence of the thermally pulsing AGB of primordial stars were published (Castellani, Chieffi, & Tornambe Reference Castellani, Chieffi and Tornambe1983; Chieffi & Tornambe Reference Chieffi and Tornambe1984; Fujimoto et al. Reference Fujimoto, Iben, Chieffi and Tornambe1984). Later works of Omukai et al. (Reference Omukai, Nishi, Uehara and Susa1998) also supported the possibility of forming low-mass primordial stars, and Nakamura et al. (Reference Nakamura, Mazzali, Nomoto and Iwamoto2001a) determined a bimodal primordial IMF peaked both at about 1 and 10 M⊙.
The big picture of the nature of the first stars changed again after 3D hydrodynamical simulations of primordial star formation by Abel et al. (Reference Abel, Anninos, Norman and Zhang1998), Abel, Bryan, & Norman (Reference Abel, Bryan and Norman2002), and Bromm & Loeb (Reference Bromm and Loeb2003), who concluded that primordial stars had to be very massive (MZAMS ≳ 103 M⊙). Pair-Instability SN models, triggered by the production of electron–positron pairs at high entropy and temperature (e.g. Umeda & Nomoto Reference Umeda and Nomoto2002; Woosley Reference Woosley2017), and very energetic core-collapse SNe or hypernovae (e.g. Nakamura et al. Reference Nakamura, Umeda, Iwamoto, Nomoto, Hashimoto, Hix and Thielemann2001b; Nomoto & Umeda Reference Nomoto, Umeda, Fusco-Femiano and Matteucci2002) gained popularity as the first polluters of the primitive universe.
The effects of rotation and induced mixing on the early evolution of primordial to very low-metallicity massive stars were also investigated (e.g. Ekström et al. Reference Ekström, Meynet, Chiappini, Hirschi and Maeder2008) and the associated nucleosynthetic yields presented by various groups (Woosley & Weaver Reference Woosley and Weaver1995; Umeda & Nomoto Reference Umeda and Nomoto2002; Chieffi & Limongi Reference Chieffi and Limongi2002; Chieffi & Limongi Reference Chieffi and Limongi2004; Kobayashi et al. Reference Kobayashi, Umeda, Nomoto, Tominaga and Ohkubo2006; Heger & Woosley Reference Heger and Woosley2010; Limongi & Chieffi Reference Limongi and Chieffi2012; Takahashi, Umeda, & Yoshida Reference Takahashi, Umeda and Yoshida2014). In the context of primordial massive star models, it is also important to consider the success of SN yields in interpreting observations of metal-poor stars (Umeda & Nomoto Reference Umeda and Nomoto2003; Limongi, Chieffi, & Bonifacio Reference Limongi, Chieffi and Bonifacio2003; Bonifacio, Limongi, & Chieffi Reference Bonifacio, Limongi and Chieffi2003; Ryan et al. Reference Ryan, Aoki, Norris and Beers2005; Kobayashi et al. Reference Kobayashi, Ishigaki, Tominaga and Nomoto2014; Tominaga, Iwamoto, & Nomoto Reference Tominaga, Iwamoto and Nomoto2014).
Despite the uncertainty of the existence of non-massive stars in the lowest Z regime, many groups continued the study of their evolution (Hollowell, Iben, & Fujimoto Reference Hollowell, Iben and Fujimoto1990; Fujimoto, Ikeda, & Iben Reference Fujimoto, Ikeda and Iben2000; Weiss et al. Reference Weiss, Cassisi, Schlattl and Salaris2000; Dominguez et al. Reference Dominguez, Straniero, Limongi and Chieffi2000; Chieffi et al. Reference Chieffi, Domínguez, Limongi and Straniero2001; Schlattl et al. Reference Schlattl, Cassisi, Salaris and Weiss2001; Siess, Livio, & Lattanzio Reference Siess, Livio and Lattanzio2002; Gil-Pons et al. Reference Gil-Pons, Suda, Fujimoto and García-Berro2005, Reference Gil-Pons, Gutiérrez and García-Berro2007; Campbell & Lattanzio Reference Campbell and Lattanzio2008; Lau et al. Reference Lau, Stancliffe and Tout2008). The characteristics of the thermally pulsing AGB and Super-AGB, the nucleosynthetic yields, and even the elusive final fates of some of these stars were outlined and debated.
Increasingly higher resolution simulations of star formation suggested that photoionisation and photoevaporation were able to halt mass-accretion onto metal-free protostars. As a consequence, primordial stars of masses in the range 50–300 M⊙ were able to form ((McKee & Tan Reference McKee and Tan2008; Bromm et al. Reference Bromm, Yoshida, Hernquist and McKee2009). Other simulations (Stacy & Bromm Reference Stacy and Bromm2014; Hirano et al. Reference Hirano, Hosokawa, Yoshida, Umeda, Omukai, Chiaki and Yorke2014; Susa et al. Reference Susa, Hasegawa and Tominaga2014), with even higher resolution, opened the possibility of forming low- and intermediate-mass stars in primordial environments. Additionally, further fragmentation of circumstellar disks could result in binary or multiple stellar systems composed of low-mass objects (Clark et al. Reference Clark, Glover, Smith, Greif, Klessen and Bromm2011). Yet, until recently, the preferred perspective among a large part of the scientific community was that Pop III stars were massive or very massive. Pop III refers to the first (metal-free) generation of stars. Pop II corresponds to subsequent generations, formed from metal-poor gas ejected by Pop III objects and their progeny. Pop I is young (metal-rich) stars.
Omukai (Reference Omukai2000), Bromm et al. (Reference Bromm, Ferrara, Coppi and Larson2001), and Spaans & Silk (Reference Spaans and Silk2005) introduced the concept of critical metallicity to describe the minimum metal content in star-forming gas clouds which could allow the formation of low-mass (Pop II) stars. The transition from environments able to host the formation of Pop III to those able to host the formation of Pop II stars was determined by the occurrence of additional gas-cooling mechanisms: line-cooling (Bromm & Loeb Reference Bromm and Loeb2003), which gave a critical metallicity Z crit ∼ 10−3.5Z ⊙, and dust-induced fragmentation (Schneider & Omukai Reference Schneider and Omukai2010; Dopcke et al. Reference Dopcke, Glover, Clark and Klessen2013), which gave Z crit values 2–3 orders of magnitude lower than the line-cooling mechanism.
The line-cooling mechanism and thus the existence of a critical luminosity seem to be observationally supported (Frebel et al. Reference Frebel, Johnson and Bromm2007), although the absence of detection of stars below a certain metallicity might be simply a consequence of their rarity and low luminosities, or due to pollution resulting from accretion of interstellar material (Komiya, Suda, & Fujimoto Reference Komiya, Suda and Fujimoto2015). However, doubts were shed on the latter results by Tanaka et al. (Reference Tanaka, Chiaki, Tominaga and Susa2017) and Suzuki (Reference Suzuki2018). Schneider et al. (Reference Schneider, Omukai, Bianchi and Valiante2012) proposed that the dust produced during the evolution of primordial massive stars and SN explosions could induce the fragmentation required to form Pop II low-mass stars.
3. Evolution of primordial to EMP intermediate-mass stars
The results for the example models presented in this manuscript have been obtained with monstar, the Monash University Stellar Structure code [see for instance, Frost & Lattanzio (Reference Frost and Lattanzio1996); Campbell & Lattanzio (Reference Campbell and Lattanzio2008); Gil-Pons et al. (Reference Gil-Pons, Doherty, Lau, Campbell, Suda, Guilani, Gutiérrez and Lattanzio2013)]. It considers the isotopes relevant for the evolution (1H, 3He, 4He, 12C, 14N, 16O, and the rest of species are included in Z other). Nuclear reaction rates are from Caughlan & Fowler (Reference Caughlan and Fowler1988) with the update from NACRE (Angulo et al. Reference Angulo1999) for the 14N(p, γ) 15O. For discussion on implementation of carbon burning in a limited nuclear network, we refer to Doherty et al. (Reference Doherty, Siess, Lattanzio and Gil-Pons2010). The convective treatment implements the modified Schwarzschild criterion with the attempt to search for convective neutrality (Castellani, Giannone, & Renzini Reference Castellani, Giannone and Renzini1971; Robertson & Faulkner Reference Robertson and Faulkner1972; Frost & Lattanzio Reference Frost and Lattanzio1996), which is also known as induced overshooting. This treatment intends to limit the effects of the unphysical discontinuity in the radiative gradient at the convective boundary that is induced by the composition difference between the mixed convective zone and the adjacent radiative shells [the details about this algorithm can be found in Frost & Lattanzio (Reference Frost and Lattanzio1996)].
Mass-loss rates are calculated following Vassiliadis & Wood (Reference Vassiliadis and Wood1993), and opacities for stellar interiors are from the OPAL tables developed at the Lawrence Livermore National Laboratory (Iglesias & Rogers Reference Iglesias and Rogers1996). Molecular opacities are either from Ferguson et al. (Reference Ferguson, Alexander, Allard, Barman, Bodnarik, Hauschildt, Heffner-Wong and Tamanai2005) for the Z = 10−10, Z = 10−8 and Z = 10−6 cases, or from Lederer & Aringer (Reference Lederer and Aringer2009) and Marigo & Aringer (Reference Marigo and Aringer2009) for the Z = 10−5 case. Note that our models are solar-scaled, following Grevesse & Noels (Reference Grevesse, Noels, Prantzos, Vangioni-Flam and Casse1993), with Z sun = 0.02. Besides, our primordial models use the initial metallicity from Gil-Pons et al. (Reference Gil-Pons, Suda, Fujimoto and García-Berro2005), that is, Z = 10−10. This value is higher than the strict Z = 0 frequently used in the literature (e.g. Chieffi et al. Reference Chieffi, Domínguez, Limongi and Straniero2001; Siess et al. Reference Siess, Livio and Lattanzio2002), and the approximate values Z = 10−12−10−13 are expected from Big-Bang nucleosynthesis (Coc, Uzan, & Vangioni Reference Coc, Uzan and Vangioni2014). Nevertheless, as we will see later in this section, in terms of the characteristics of the evolution, yields and fates of the considered stars, Z = 0 and Z = 10−10, produce the same results. The limitations imposed by additional choices of input physics are discussed in due course.
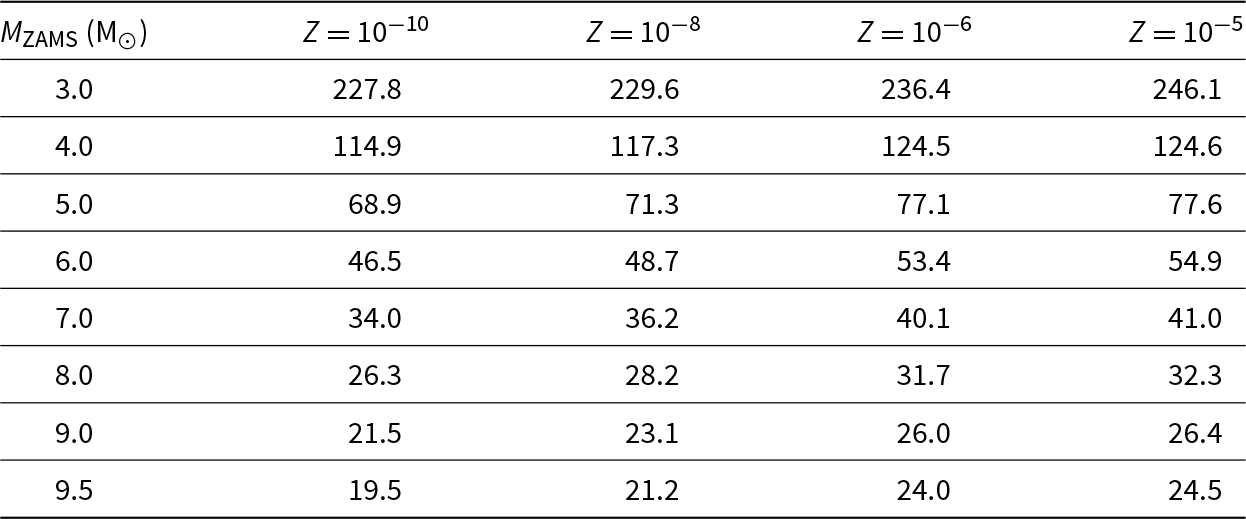
Models have been computed for Z = 10−10 (primordial), 10-8, and 10-6, for initial masses between 3 and 9.8 M⊙. Models for the Z = 10−5 case with masses between 4 and 9 M⊙ were taken from Gil-Pons et al. (Reference Gil-Pons, Doherty, Lau, Campbell, Suda, Guilani, Gutiérrez and Lattanzio2013). An initial mass spacing of 1 M⊙ was chosen, except for cases near the mass thresholds for the formation of SN I1/2, where additional models were calculated to obtain a mass spacing of 0.5 M⊙, and for the cases near the mass thresholds for the formation of electron-capture and CC SNe, where we chose a mass spacing of 0.1 M⊙.
3.1. Evolution during the main central burning stages
3.1.1. Core hydrogen and helium burning
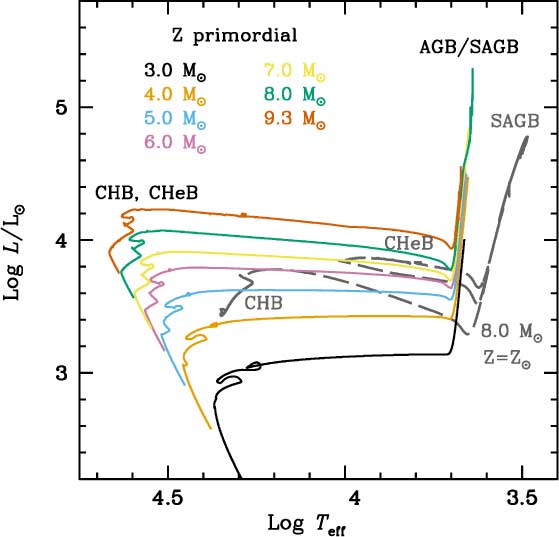
Stars that will become Super-AGB stars are at the upper end of the mass range defined as intermediate-mass stars (IMS). We will refer to these stars, destined to become Super-AGB stars, as SIMS for Super Intermediate-Mass Stars. We save the name Super-AGB for that specific phase of evolution of the SIMS. The evolution of primordial and EMP IMS presents substantial differences with respect to that of higher Z objects. The main central burning stages of primordial stars over a wide range of masses have been well known since the 1970s (see Section 1 for references). The absence of metals and, in particular, of C and N forces the star to ignite central H through the pp-chains and form a relatively small convective core. Because the energy generation rates associated with the pp-chains (∝Tn with n ≃ 4) are more weakly dependent on temperature than those associated with the CN-cycle (with n ≃ 20), main sequence primordial stars are more compact and hotter than their higher Z counterparts of similar masses (see Figure 1). Central H-burning temperatures in primordial models reach values ∼ 108K, whereas those of solar metallicity remain ≲ 4 × 10⁷K. During CHB, both the central temperature and density smoothly increase and allow the synthesis of He and a small amount of C, via the triple-alpha reaction. Note at this point that the strong temperature dependence of the 3-α reaction rate (roughly ∝ T 40), together with the high central temperatures during CHB, is critical to understanding the formation of 12C in these primordial stars. Once the total mass fraction of C reaches ∼10−10, the CN-cycle starts operating, which causes a sudden increase in the release of energy, a brief core expansion period, and the disappearance of core convection. After the core readjusts itself, central H-burning continues and is now dominated by the CN-cycle. The central density and temperature rise again and a new convective core forms and lasts until the end of CHB. The particular value of the central C abundance at the onset of the CN-cycle, the duration of the entire CHB phase, and the resulting mass of the H-exhausted core strongly depend on the adopted input physics, such as the nuclear reaction rates, the assumptions concerning convective overshooting, and the choice of opacity tables (Siess et al. Reference Siess, Livio and Lattanzio2002). In general, all models of initial mass above 1 M⊙ experience the transition from pp-chain to CN-cycle-dominated CHB. This transition occurs earlier (and thus with higher central H abundance) for more massive models.
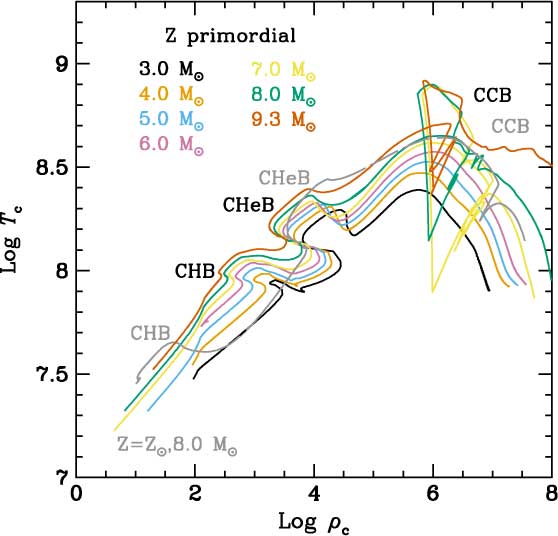
Evolution in the log ρ c – log T c plane of some selected models of primordial metallicity. The approximate locations of the main central burning stages H, He, and C are labelled CHB, CHeB, and CCB, respectively. For comparison we also show the evolution of the 8.0 M⊙ solar metallicity model (grey line and labels).
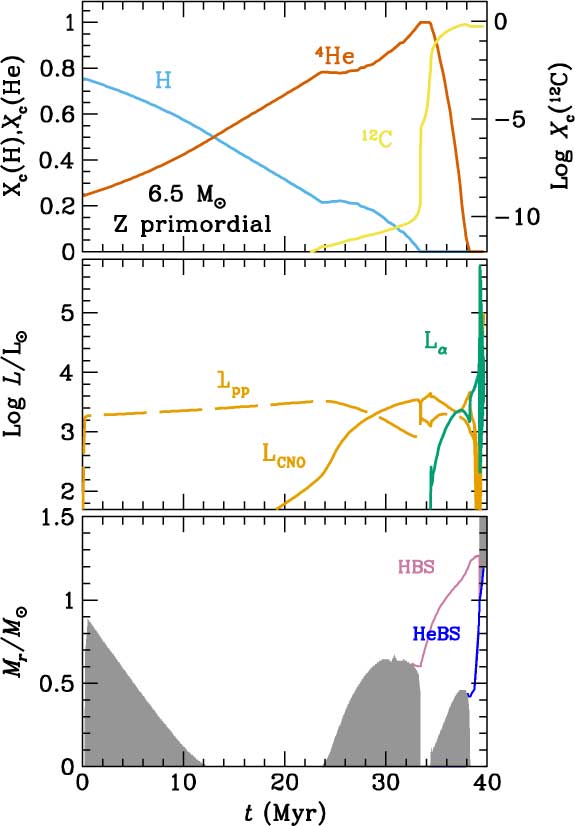
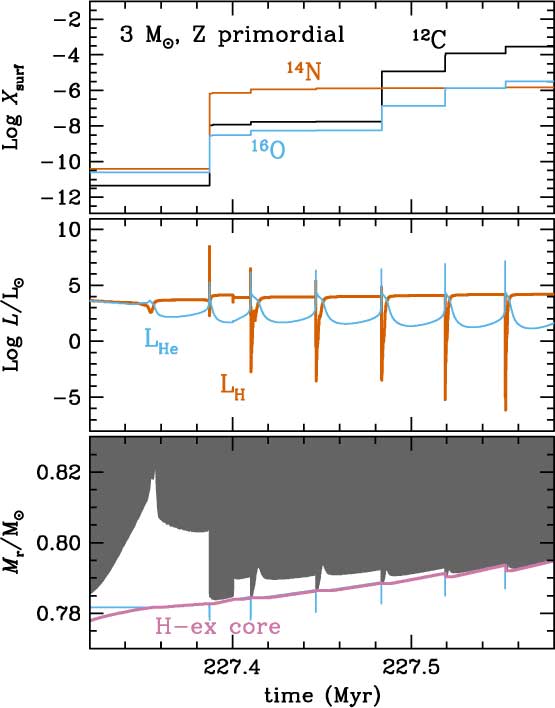
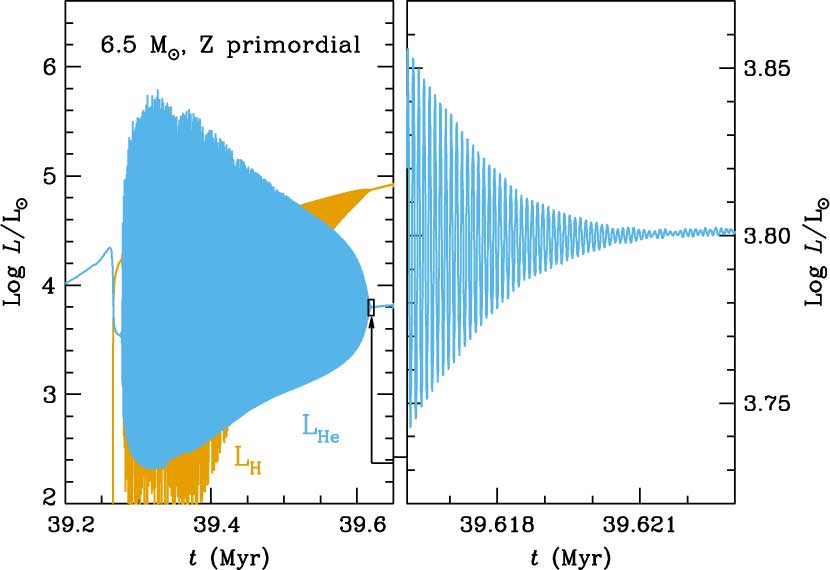
As an example of central H- and He-burning stages, we show the evolution of a primordial 6.5 M⊙ model in Figure 2.
Evolution of a 6.5 M⊙ primordial model. Upper panel: evolution of the central abundances of H, 4He, and 12C. Middle panel: evolution of the luminosities from H-burning through the pp-chains (Lpp), the CNO cycle (LCNO), and the 3α reaction (Lα). Lower panel: evolution of convective zones and the location of the HBS and of the He-burning shell (HeBS).
The evolution of central temperature versus central density (log ρ c – log T c) for some selected models of primordial intermediate-mass stars and, for comparison, the evolution of an 8.0 M⊙ solar metallicity case are shown in Figure 1. In this figure the occurrence of CHB at higher T for the primordial cases can be clearly seen. Once central H is exhausted, the structure and composition of the resulting He cores are similar to analogous cores from higher Z stars and thus both the core He- and C-burning phases occur at similar loci in the log ρ c – log T c diagram. Indeed, even if the physical evolution of the He core does not directly depend on its metallicity, it is indirectly influenced through the behaviour of the HBS. Intermediate-mass H-exhausted cores are more compact and hotter than their higher Z counterparts. Therefore, central He-burning starts and the central 3α reactions provide energy supply very shortly after CHB (Chieffi et al. Reference Chieffi, Domínguez, Limongi and Straniero2001; Siess et al. Reference Siess, Livio and Lattanzio2002). Consequently stellar contraction stops, the star stays in the blue region of the Hertzsprung-Russell (HR) diagram, and an efficient HBS does not develop. Without a powerful HBS, the corresponding envelope expansion and cooling associated with the ascent of the red giant branch (RGB) are avoided. The high-temperature gradients which would drive the formation of a deep convective envelope are not achieved and thus the first dredge-up process is also averted.Footnote d Thus, intermediate-mass primordial stars maintain a pristine envelope until the end of CHeB.Footnote e
Table 1 shows the approximate lifetimes (at the end of calculations) of a selection of EMP model stars. We clearly see the reduction of stellar lifetimes with decreasing metallicity. The differences between these lifetimes and those given by Siess et al. (Reference Siess, Livio and Lattanzio2002) are small, being between 0.4% and 4%.
Times (in Myr) at the end of our calculations for selected EMP example models
Calculations were halted during the later stages of the thermally pulsing AGB or Super-AGB.
The avoidance of the first dredge-up is not a phenomenon unique to intermediate-mass primordial stars, as it is also shared by intermediate-mass stars of initial metallicity lower than Z ZAMS ∼ 10−3. The evolution in the Hertzsprung–Russell diagram of some models of primordial IMS and, for comparison, also a solar metallicity IMS are shown in Figure 3. Both the core H-burning and the CHeB phases occur in the hot part of this diagram for the primordial metallicity objects. They also evolve at higher luminosities until the AGB or Super-AGB phase and remain hotter during this phase (Becker, Iben, & Tuggle Reference Becker, Iben and Tuggle1977). At this point a new overall contraction ensues, an efficient HBS finally forms, and the star expands and cools to become a giant hosting a deep convective envelope. Then the second dredge-up process begins. Note that intermediate-mass primordial stars do not develop a first dredge-up, but the terminology of a second dredge-up is still used in the literature to refer to the dredge-up episode occurring at the end of CHeB, by analogy with higher Z cases. We will show in Section 3.2.1 that the efficiency of this process is very sensitive to the choice of input physics (and associated uncertainties). This is critical for the later evolution as thermally pulsing AGB or Super-AGB stars and, eventually, for their final fates. Tables 2 and 3 show a summary of relevant parameters during the evolution of a selection of our primordial and Z = 10−5 models.
Evolution in the Hertzsprung–Russell diagram of some selected models of primordial metallicity. The approximate locations of the main central burning stages are labelled. For comparison, the evolution of an 8.0 M⊙ solar metallicity model has been included. The evolution along the thermally pulsing AGB or Super-AGB has been truncated for better display.
Relevant structure and composition parameters for the primordial and Z = 10−5 models

M CC represents the maximum size of the convective core during core H-burning (CHB). X C (C) and X C (O) are, respectively, the central abundances of C and O at the end of CHB, respectively. M HexC in columns 5 and 6 refers to the size of the H-exhausted core at the beginning and at the end of core He-burning (CHeB). X HBS (C), X HBS (N), and X HBS (O) are abundances at the H-burning shell (HBS) (at the mass point of its peak 14N abundance) at the end of central He-burning. (C / O)c is the quotient of the central abundances of C and O at the same time. The last columns gives the mass point of C ignition. All masses are given in solar units. Note that the end of CHB was taken when central H abundance X c(H) < 10−8. The beginning of CHeB was taken when LHe= 100 L⊙. The end of CHeB was taken when central He abundance X c(He) < 10−8.
Relevant structure and composition parameters for the primordial and Z = 10−5 models
M HexC represents the mass of the H-exhausted core and is given before and after the second dredge-up (SDU). X S(C), X S(N), and X S(O) in columns 4 to 6 are, respectively, the surface abundances of C, N, and O after the SDU. M HeexC and M HexC are, respectively, the masses of the He- and H-exhausted cores just before the first thermal pulse of the thermally pulsing AGB or Super-AGB. X S(C), X S(N), and X S(O) in columns 9 to 11 are, respectively, the surface abundances of C, N, and O at this time.
3.1.2. Carbon burning
Regardless of their initial metallicity, all stars that develop CO cores of masses ≳ 1.05 M⊙ after central H- and He-burning will proceed to the ignition of carbon. It is important to recall that the central C abundance at the time of ignition critically depends on the characteristics of the previous He-burning phase and, in particular, on the occurrence of breathing pulses (Castellani et al. Reference Castellani, Chieffi, Tornambe and Pulone1985), a type of convective instability which occurs near the time of central He-exhaustion, and affects the convective core boundary. Their extent and even their occurrence strongly depend on the the numerical treatment of convective boundaries (Constantino, Campbell, & Lattanzio Reference Constantino, Campbell and Lattanzio2017).
Carbon burning in primordial to Z = 10−5 stars occurs in a very similar fashion to their higher metallicity counterparts (Gil-Pons et al. Reference Gil-Pons, Suda, Fujimoto and García-Berro2005, Gil-Pons et al. Reference Gil-Pons, Doherty, Lau, Campbell, Suda, Guilani, Gutiérrez and Lattanzio2013). The details of the process have been known since the 1990s (Ritossa et al. Reference Ritossa, García-Berro and Iben1999 and references therein), with ignition occurring in conditions of partial degeneracy for solar metallicity in intermediate-mass stars. This was further analysed in, e.g., Siess (Reference Siess2006), Doherty et al. (Reference Doherty, Siess, Lattanzio and Gil-Pons2010), Farmer, Fields, & Timmes (Reference Farmer, Fields and Timmes2015), and references therein. Here we present a brief overview, highlighting the few particularities of metal-poor stars, and refer to Doherty et al. (Reference Doherty, Gil-Pons, Siess and Lattanzio2017) for more detail.
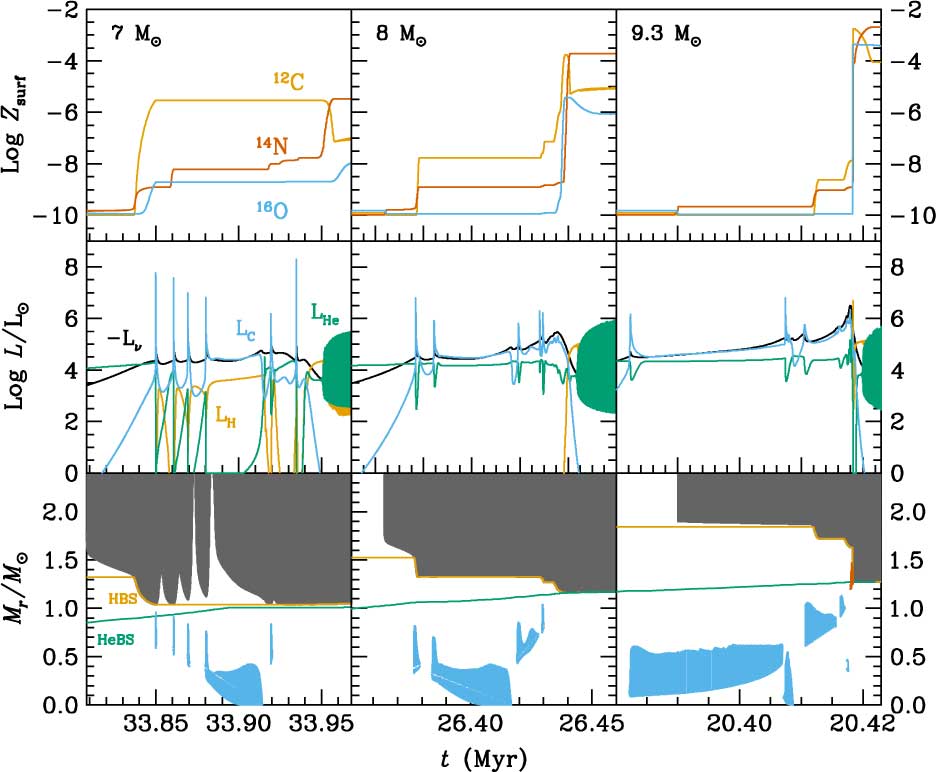
Figure 4 summarises the evolution of the main structural parameters and the surface abundances of C, N, and O for the 7, 8, and 9.3 M⊙ primordial models during C-burning and the first thermal pulses of the Super-AGB phase. The models shown are, respectively, representative of low-mass Super-AGBs, intermediate-mass Super-AGBs, and massive Super-AGB stars. Extended C-burning occurs in stars which are able to form CO cores of masses ≳1.05 M⊙ and proceeds as follows. Once the central He-burning phase has been completed, the resulting CO core contracts and heats, so that neutrino energy losses become important for the innermost regions of the star. The temperature maximum moves outward and when it reaches ≈6 × 10⁸ K, carbon ignites off-centre (the higher the initial mass of the SIMS, the closer to the centre is the ignition). Because C-burning takes place under conditions of partial degeneracy we find that the thermal instability produces strong flashes with peak luminosities that may exceed 108L⊙, as seen in the middle panels of Figure 4. Each flash provides large energy injections able to drive the formation of local convective zones which disappear shortly after the flashes are extinguished (see lower panels of Figure 4). Successive flashes advance towards deeper regions of the core and, eventually, the C-burning flame reaches the centre. Yet, the central temperature is not high enough for complete exhaustion of central C. The exceptions are the most massive SIMS, which burn C in an approximately stationary way and do exhaust central carbon completely, or leave a residual C abundance not higher than a few tenths of a percent. C-burning in Super-AGB stars is therefore similar to He-burning through core flashes in low-mass stars. However, because in Super-AGB stars the CO core is more massive and the conditions there are more extreme, C-burning must consume a larger amount of fuel than He-burning in low-mass stars to lift the degeneracy. The C-burning process does not finish when the C flame reaches the centre of the star. Instead, the CO degenerate regions located above the resulting ONe core also ignite in flashes and develop associated convective shells. At the end of C-burning, a typical early Super-AGB star is composed of an ONe-rich core, a CO-rich shell, and a H and He-rich envelope, more or less polluted in metals by the effect of the different mixing episodes that we will describe in the next subsection.
Summary of the evolution during C-burning (starting near the beginning of the early AGB (E-AGB) phase), and the first thermal pulses of the thermally pulsing Super-AGB for the 7, 8, and 9.3 M⊙ models with primordial Z. Lower panels show the temporal evolution of the convective envelope (grey) and of the inner convective shells (the ones associated with C flashes are shown in blue, and the one associated with He-burning and gravothermal energy release during the dredge-out episode of the 9.3 M⊙ model is shown in vermilion). We also show the evolution of the mass location of the HBS (orange) and the HeBS (green). Middle panels show the evolution of the luminosities from H-, He-, and C-burning together with neutrino losses (LH, LHe, LC, and Lν, respectively). Upper panels show the evolution of surface mass fractions (Z surf) of C, N, and O.
The location of the base of the convective envelope is altered during C-burning because of the highly energetic C flashes. These flashes drive local expansion and cooling which causes the recession of the convective envelope. Once the thermal conditions that existed prior to the flashes are restored, the bottom of the convective envelope returns close to its position before the occurrence of the flash.
The minimum mass for C ignition, referred to as M up depends on the composition, input physics, and numerical aspects of the evolutionary calculations. With the physical prescriptions adopted here, monstar yields a lower mass threshold of 6.8 M⊙ for the primordial star, and the corresponding model experiences five convective flashes before C-burning reaches the centre. At the time of carbon ignition the partially degenerate CO core mass is 1.05 M⊙, and the central carbon abundance is 0.55. C ignition is located at the mass point 0.69 M⊙. We are following the definition of M up proposed by Doherty et al. (Reference Doherty, Gil-Pons, Siess, Lattanzio and Lau2015), which requires the formation of a C convective shell. As a comparison, the 6.7 M⊙ model experiences C-burning briefly and ineffectively, with associated maximum luminosities of only a few hundred L⊙, without C convective shells, and resulting in a practically unaltered CO core.
The highest mass for which a primordial star experiences the Super-AGB phase is ∼ 9.7 M⊙. This model ignites C very close to the centre, in conditions of degeneracy much milder than those of the 6.8 M⊙ model. Note that the lowest initial mass for the occurrence of central C ignition does not correspond to the upper mass threshold for the occurrence of Super-AGB stars. Instead, some stars may ignite C centrally, develop a brief inefficient Ne-burning phase, and continue their lives as thermally pulsing Super-AGB stars.
3.2. Mixing episodes prior to the thermally pulsing AGB or Super-AGB phase
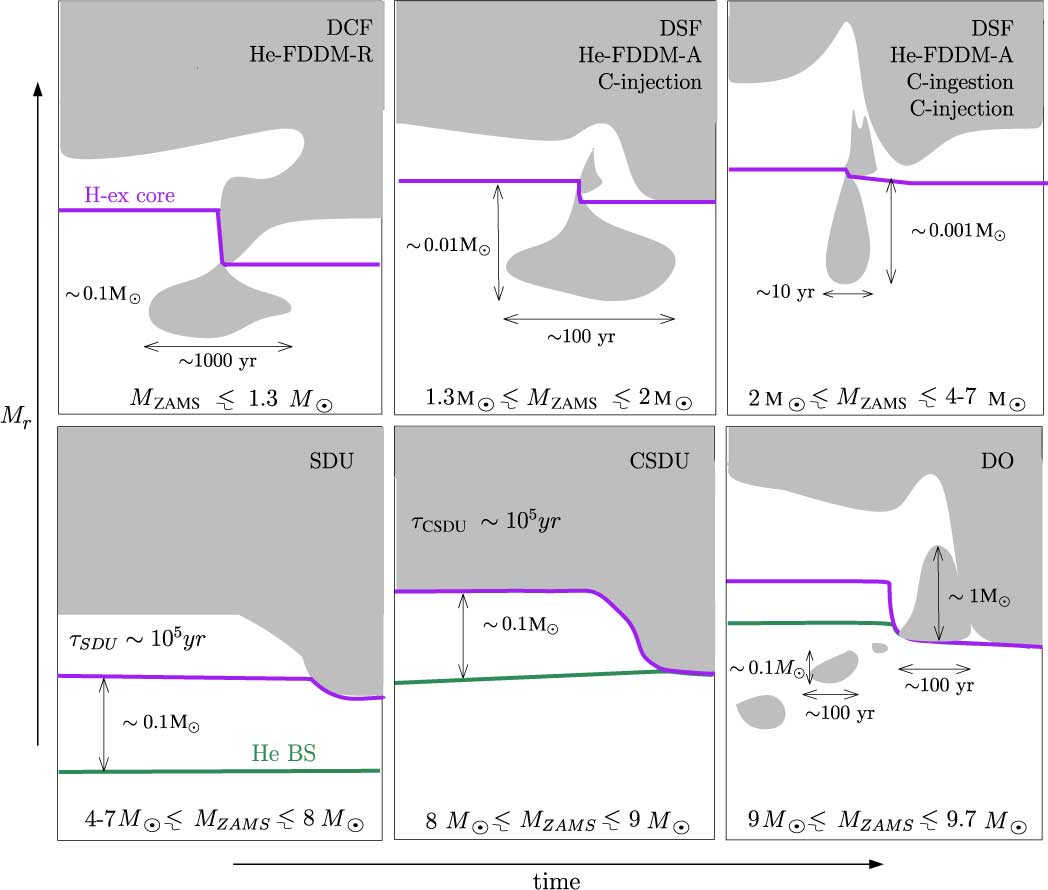
Prior to the thermal pulsing phase, a variety of mixing processes enrich the stellar surface in metals. The present work focuses on intermediate-mass evolution and thus, in the following subsections, we describe the second dredge-up and the dredge-out episodes. However, it is also appropriate to mention the occurrence of a PIE during the core He flash, located at the tip of the RGB for low-mass stars (MZAMS ≲ 1.3 M⊙). PIEs result from rapid ingestion of protons into high-temperature regions, typically regions where He-burning is active. Through their modelling of a low-mass primordial star, D’Antona & Mazzitelli (Reference D’Antona and Mazzitelli1982) originally speculated that these types of events may occur. This was confirmed by Fujimoto, Iben, & Hollowell (Reference Fujimoto, Iben and Hollowell1990) and Hollowell et al. (Reference Hollowell, Iben and Fujimoto1990) and has been studied regularly since then (e.g. Cassisi, Castellani, & Tornambe Reference Cassisi, Castellani and Tornambe1996; Fujimoto et al. Reference Fujimoto, Ikeda and Iben2000; Schlattl et al. Reference Schlattl, Cassisi, Salaris and Weiss2001; Picardi et al. Reference Picardi, Chieffi, Limongi, Pisanti, Miele, Mangano and Imbriani2004; Campbell & Lattanzio Reference Campbell and Lattanzio2008; Mocák et al. Reference Mocák, Campbell, Müller and Kifonidis2010; Suda & Fujimoto Reference Suda and Fujimoto2010; Lugaro et al. Reference Lugaro, Karakas, Stancliffe and Rijs2012; Cruz, Serenelli & Weiss Reference Cruz, Serenelli and Weiss2013; and references therein). Even though they share common features, the DCFs that occur at the tip of the RGB are different from the dual shell flashes (DSFs) that develop in intermediate-mass stars at later times during the thermally pulsing AGB, and involve He-convective zones associated with thermal pulses (see Section 3.3). For the sake of clarity, the relevant mass ranges and the different nomenclature for various mixing events are shown in Figure 5.
Schematic view of mixing episodes in metal-poor stars. The grey areas show the location of convective zones in the mass coordinate M r versus time, the purple line shows the outer limit of the H-exhausted core (defined as the mass coordinate where the H mass fraction drops below 10-6), and the green line shows the location of the HeBS. Upper panels show the different nomenclature used to refer to the mixing phenomena. The upper left panel shows the dual core flash (DCF) (Schlattl et al. Reference Schlattl, Cassisi, Salaris and Weiss2001; Picardi et al. Reference Picardi, Chieffi, Limongi, Pisanti, Miele, Mangano and Imbriani2004; Campbell & Lattanzio Reference Campbell and Lattanzio2008) or He-flash driven deep mixing event at the tip of the RGB (Suda & Fujimoto Reference Suda and Fujimoto2010). The upper middle panel shows the DSF (Campbell & Lattanzio Reference Campbell and Lattanzio2008) or He-flash driven deep mixing event at the AGB (Suda & Fujimoto Reference Suda and Fujimoto2010), also named C injection by Siess et al. (Reference Siess, Livio and Lattanzio2002). The upper right panel shows the He-flash-driven deep mixing event at the AGB (Suda & Fujimoto Reference Suda and Fujimoto2010), or proton ingestion (Chieffi et al. Reference Chieffi, Domínguez, Limongi and Straniero2001, Lau et al. Reference Lau, Stancliffe and Tout2008, Cristallo et al. Reference Cristallo, Piersanti, Straniero, Gallino, Domínguez and Käppeler2009 and Siess et al. Reference Siess, Livio and Lattanzio2002). The lower left panel shows a standard second dredge-up episode (SDU), the lower middle panel shows a corrosive second dredge-up episode (CSDU), and the lower right panel shows a dredge-out episode (DO) (Gil-Pons et al. Reference Gil-Pons, Doherty, Lau, Campbell, Suda, Guilani, Gutiérrez and Lattanzio2013). The orders of magnitude of the duration of the convective shell episodes and their sizes are given, as well as the orders of magnitude of the duration of the entire SDU and CSDU.
3.2.1. The Second Dredge-Up
For stars of initial metallicity Z ≲ 10−3 the first ascent of the giant branch occurs after the exhaustion of central He. In a normal second dredge-up episode, the envelope expansion is accompanied by the formation of a deep convective envelope, able to penetrate the He core. This second dredge-up episode results in envelope enrichment of 4He, 14N, and 13C, and depletion in 12C and, to a lesser extent, 16O. In the case of primordial to Z = 10−8 stars, many models experience primarily an increase in the 12C and 16O surface abundances [see Lau, Stancliffe, & Tout (Reference Lau, Stancliffe and Tout2009) and references therein]. Although the changes to the surface composition are similar, they are driven by different processes.
For the lowest metallicities, there is a relatively low entropy barrier and a higher compactness and temperature. In particular, the high temperatures in the HBS (near 108K) allow the occurrence of the 3α reaction within this shell [see, for instance, Chieffi et al. (Reference Chieffi, Domínguez, Limongi and Straniero2001)]. When this material is engulfed by convection and dredged to the surface, it results in increases in the abundance of 12C and 16O. Even though the result in terms of surface composition is similar (an increase in 12C and 16O), we should distinguish this type of hot second dredge-up episode from the corrosive second dredge-up reported for the more massive Z = 10−5 stars in Gil-Pons et al. (Reference Gil-Pons, Doherty, Lau, Campbell, Suda, Guilani, Gutiérrez and Lattanzio2013) (see Figure 5). In the corrosive second dredge-up, the base of the convective envelope is able to dredge up material from the CO core. The corrosive second dredge-up is actually present for initial masses ≳ 8 M⊙ in the metallicity range from primordial to Z = 10−4, but also up to solar metallicity in narrower mass ranges (Doherty et al. Reference Doherty, Gil-Pons, Siess, Lattanzio and Lau2015). Note that during this event the He-burning shell (HeBS) remains active, with a He luminosity of a few thousands L⊙.
Lau et al. (Reference Lau, Stancliffe and Tout2009) presented detailed post-second dredge-up surface abundances of intermediate-mass stars (2–6 M⊙) of metallicities between Z = 10−8 and Z = 10−4. They found a very mild enrichment in their 10−8 ≤ Z ≤ 10−7 models for M ZAMS ≲ 5 M⊙ but a significant pollution (up to Z surf ∼ 10−6) for their 6 M⊙ model. In the metallicity range 10−6 ≤ Z ≤ 10−4 the largest surface enhancement occurred for models with 3 M⊙ ≤ M ZAMS ≤ 5 M⊙. This metal pollution is due to the hot second dredge-up described above. Additionally, Lau et al. (Reference Lau, Stancliffe and Tout2009) showed that the implementation of overshooting below the envelope [treated as in Schroder, Pols, & Eggleton (Reference Schröder, Pols and Eggleton1997), with δον = 0.12] further increased second dredge-up efficiency, and they calculated the corresponding surface abundances.
A summary of surface abundances after second dredge-up obtained by different authors is presented in Figure 6. We also present the resulting core masses and surface metal abundances obtained with monstar, after the second dredge-up, corrosive second dredge-up, or dredge-out (explained in the next subsection). Note that the primordial 3 M⊙ model does not undergo a second dredge-up episode. Note also that the precise initial metallicity for the primordial cases in our example models (Z = 10−10) is different in the models from the literature (Z = 0 strictly).
Upper panel: second dredge-up episode enrichments for primordial to Z = 10−5 model stars. Solid lines correspond to models computed with monstar. X surf represents the sum of the mass fraction of all species with atomic number ≥ 6. Note that primordial models in this case have been computed with Z ZAMS = 10−10 (see text for details). The primordial models by other authors use Z ZAMS = 0. Bottom panel: size of the H-exhausted core Mc at the end of the second dredge-up.
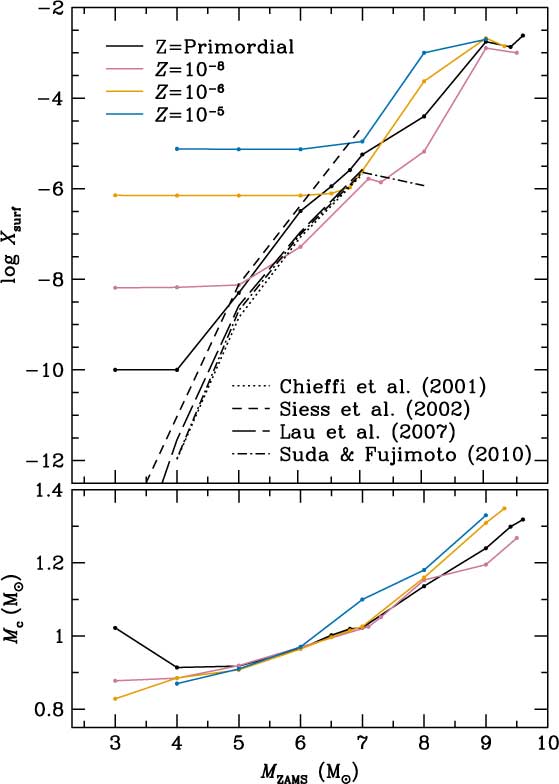
The details of the treatment of convective boundaries and mixing are particularly critical for the second dredge-up and the later evolution and fate of primordial to EMP SIMS of M ZAMS ≳ 7–9 M⊙. Stellar models which implement the strict Schwarzschild criterion undergo a rather mild second dredge-up (Suda & Fujimoto Reference Suda and Fujimoto2010), whereas the inclusion of overshooting produces a higher surface enrichment [see Chieffi et al. (Reference Chieffi, Domínguez, Limongi and Straniero2001); Siess et al. (Reference Siess, Livio and Lattanzio2002)]. The calculations with monstar presented in this work, which implement a treatment of convection that includes the search for neutrality (Lattanzio Reference Lattanzio1986; Frost & Lattanzio Reference Frost and Lattanzio1996), also lead to a moderately high enrichment in surface metals.
In the case of Super-AGB stars, second dredge-up occurs at different stages of the C-burning phase for stars of different initial masses. For primordial to EMP stars up to ≈ 7 M⊙ (destined to become low-mass Super-AGB stars), it takes place before the first C flash, and its effects are relatively mild. As an example, the primordial 7 M⊙ star envelope is enriched only up to a metallicity of Z surf ∼ 10−6. Stars of higher initial mass have hotter He-exhausted cores and thus ignite C earlier. For instance, the 8 M⊙ model experiences the corrosive second dredge-up after the first C flash. This is shown in the upper middle panel of Figure 4, in which the C surface abundance of the 8 M⊙ model peaks to values above 10-4 shortly before the thermally pulsing Super-AGB begins. Finally, the envelopes of the most massive Super-AGB stars, such as the primordial 9.3 M⊙ in Figure 4, are only enriched at the end of the C-burning process, and shortly before the dredge-out occurs.
3.2.2. Dredge-out episodes
The most massive Super-AGB stars (≳9.2 M⊙ for the primordial case and ≳ 8.8 M⊙ for the Z = 10−5 case) experience a type of PIE at the end of their C-burning phase, in which a convective HeBS merges with the convective envelope. This so-called dredge-out process has been widely studied (Iben, Ritossa, & García-Berro Reference Iben, Ritossa and García-Berro1997; Ritossa et al. Reference Ritossa, García-Berro and Iben1999; Siess Reference Siess2007; Gil-Pons et al. Reference Gil-Pons, Doherty, Lau, Campbell, Suda, Guilani, Gutiérrez and Lattanzio2013; Takahashi, Yoshida, & Umeda Reference Takahashi, Yoshida and Umeda2013; Doherty et al. Reference Doherty, Gil-Pons, Siess, Lattanzio and Lau2015; Jones et al. Reference Jones, Ritter, Herwig, Fryer, Pignatari, Bertolli and Paxton2016). During the dredge-out, protons are ingested in regions of temperatures ≳ 108 K, in which He-burning is active, and thus a strong H flash develops. An example of a dredge-out episode is shown in the right panels of Figure 4. The behaviour of convective zones during this process is also outlined in Figure 5. The H flashes associated with these PIEs are stronger for the highest initial mass cases (up to 1010L⊙ for the primordial 9.5 M⊙ model). From a nucleosynthetic point of view, they are able to dredge out very significant amounts of C and O to the stellar surface, whose metallicity increases from practically negligible to values above Z = 10−3. It is also worth noticing (see Figure 6) that the final surface metallicity Z surf after the dredge-out is practically the same for all metal-poor models, regardless of the initial Z.
Although dredge-out has been recognised since the 1990s, its effects on the star, and especially the nucleosynthesis, are far from well understood. This is primarily because the timescale for the ingestion of protons is similar to that of the burning of the very same protons. Jones et al. (Reference Jones, Ritter, Herwig, Fryer, Pignatari, Bertolli and Paxton2016) suggested that the vast amount of energy that is generated in a very narrow region during the H flash might lead to an important mass ejection, i.e. the event may become hydrodynamical. This interesting hypothesis should be checked by 3D hydrodynamical calculations.
3.3. Evolution during the thermally pulsing AGB and Super-AGB phase
Once the main central burning stages are completed, intermediate-mass stars become giants consisting of a degenerate core (composed either of CO, CO-Ne, or ONe with a surrounding thin CO shell), and a H-rich convective envelope. In either case both the HBS and the HeBS become active and, as the HeBS advances outwards and gets close enough to the HBS, a He flash or thermal pulse ensues. This marks the beginning of the thermally pulsing AGB or Super-AGB phase, in which steady H-burning and unstable He-burning alternate to provide the nuclear energy supply for the star. The thermally pulsing AGB phase was recently described in detail in Karakas & Lattanzio (Reference Karakas and Lattanzio2014), and in Doherty et al. (Reference Doherty, Gil-Pons, Siess and Lattanzio2017), who placed special emphasis on the evolution of thermally pulsing Super-AGB stars. Besides their characteristic double-shell burning, thermally pulsing AGB and Super-AGB stars present additional features, such as the formation of inner convective shells, which are a consequence of the high and fast energy release occurring during each thermal pulse. From a nucleosynthetic point of view, thermally AGB and Super-AGB stars may experience the phenomena known as hot bottom burning (HBB) and third dredge-up.
Primordial to EMP models of initial mass M ZAMS ≳ 2 − 3 M⊙ may experience HBB (Siess et al. Reference Siess, Livio and Lattanzio2002; Lau et al. Reference Lau, Stancliffe and Tout2009; Constantino et al. Reference Constantino, Campbell, Gil-Pons and Lattanzio2014). One should note, however, that the occurrence of HBB as a function of initial mass in the primordial to Z = 10−8 cases shows a peculiar behaviour, which will be analysed in the following subsections. HBB is characterised by very high temperatures at the base of the convective envelope, especially in metal-poor stars that develop more massive cores than their metal-rich counterparts. The temperatures can reach extreme values ≳ 160 × 106 K and strongly impact the envelope composition (see Section 7).
The third dredge-up may occur after a thermal pulse and corresponds to the penetration of the convective envelope into the intershell region that contains material previously processed by He-burning. This third dredge-up causes surface enrichments in 3α products and has a direct impact on the fate of stars, as it alters the core growth rate by repeatedly reducing the mass of the H-exhausted core. The third dredge-up may actually stop the stellar core from reaching the Chandrasekhar mass during the thermally pulsing AGB or Super-AGB phase. Additionally, in EMP stars, the C surface enhancement caused by the third dredge-up may result in a significant increase in mass-loss rates. Unfortunately, the efficiency of this process and even its occurrence is a matter of debate. Authors who computed and analysed the thermally pulsing AGB and Super-AGB of primordial stars of masses M ZAMS≳ 5 M⊙ either found quite efficient third dredge-up when using some degree of overshooting (Chieffi et al. Reference Chieffi, Domínguez, Limongi and Straniero2001; Siess et al. Reference Siess, Livio and Lattanzio2002) or no third dredge-up at all when using the strict Schwarzschild criterion to determine the limits of convection [see, for instance, Gil-Pons et al. (Reference Gil-Pons, Gutiérrez and García-Berro2007); Lau et al. (Reference Lau, Stancliffe and Tout2008); Suda & Fujimoto (Reference Suda and Fujimoto2010)], or even when applying some amount of overshooting (Gil-Pons et al. Reference Gil-Pons, Gutiérrez and García-Berro2007).
3.3.1. Do primordial and EMP AGB and Super-AGB stars experience thermal pulses?
Chieffi & Tornambe (Reference Chieffi and Tornambe1984) were the first to perform calculations beyond the main central burning stages of intermediate-mass primordial stars. They considered a 5 M⊙ model which developed a 0.78 M⊙ degenerate core. Unlike similar models of higher initial metallicities, their primordial star did not develop He flashes characteristic of the thermally pulsing AGB phase.
Instead they found that He-burning proceeds steadily, and this behaviour was understood as a consequence of the higher temperatures of the HBS. In the absence of CNO elements, H is burnt at much higher temperatures, allowing for simultaneous production of carbon via the 3α reactions, i.e. the 3α reactions are working simultaneously in the HBSs and HeBSs which therefore advance at a similar rate. The intershell region thus does not grow in mass and thermal pulses are inhibited. Interestingly, Chieffi & Tornambe (Reference Chieffi and Tornambe1984) realised that an envelope pollution as low as Z surf ∼ 10−6 was enough to reactivate the occurrence of thermal pulses.
These results were accompanied and supported by the work of Fujimoto et al. (Reference Fujimoto, Iben, Chieffi and Tornambe1984). They developed a semi-analytical model to study the general behaviour of the thermally pulsing AGB stars of the lowest metallicities. They considered the degenerate core mass and the envelope metallicity as key parameters of their analysis. It was established that stars hosting pristine envelopes drastically changed their behaviour when the core mass reached a critical value of  $M_1^* = 0.73{{\text{M}}_ \odot }$.
This critical core mass corresponds to the transition between a HBS powered by the pp-chains (in low-mass stars) and the CNO cycles (in more massive stars). Stars with core masses below  $M_1^*$ are able to undergo He shell flashes, whereas those with more massive degenerate cores develop steady He shell burning. Actually, above $M_1^*$ the occurrence of thermal pulses depends on the envelope composition. As demonstrated by Fujimoto et al. (Reference Fujimoto, Iben, Chieffi and Tornambe1984), if the CNO envelope mass fraction exceeds X CNO ∼ 10−8 then He shell flashes are present again. In the absence of (self-)pollution, it is therefore expected that most primordial intermediate-mass stars will end their lives as SNe. We will develop this point further in Section 5.
The existence of thermal pulses in primordial stars was revisited by Fujimoto et al. (Reference Fujimoto, Ikeda and Iben2000), Dominguez et al. (Reference Dominguez, Straniero, Limongi and Chieffi2000), and Chieffi et al. (Reference Chieffi, Domínguez, Limongi and Straniero2001). Unlike expectations from former works, these authors did obtain thermal pulses for stars of initial mass between 5 and 8 M⊙. Shortly afterwards Siess et al. (Reference Siess, Livio and Lattanzio2002) presented ‘normal’ thermally pulsing AGB stars of primordial metallicity. The reason for this behaviour is explained with further detail in the following subsections. Here we just mention that it is related to an increase in surface metallicities (Z surf ≳ 10−6−10−5), either during the E-AGB, or during the first HeBS instabilities, and thus the essential physics of the result by Fujimoto et al. (Reference Fujimoto, Iben, Chieffi and Tornambe1984) and Chieffi et al. (Reference Chieffi, Domínguez, Limongi and Straniero2001) still remained.
Later works by Suda et al. (Reference Suda, Aikawa, Machida, Fujimoto and Iben2004), Lau et al. (Reference Lau, Stancliffe and Tout2008, Reference Lau, Stancliffe and Tout2009),Campbell & Lattanzio (Reference Campbell and Lattanzio2008), and Suda & Fujimoto (Reference Suda and Fujimoto2010) on the evolution of primordial and very metal-poor stars confirmed the occurrence of thermal pulses. Gil-Pons et al. (Reference Gil-Pons, Gutiérrez and García-Berro2007) showed that, even after an extremely inefficient second dredge-up, which led to surface CNO abundances ∼10−9, thermal pulses still occurred. Therefore primordial stars do experience thermal pulses, even when their envelopes are just barely polluted during their E-AGB phase.
3.3.2. Evolution as ‘normal’ thermally pulsing AGB and Super-AGB stars
We have seen that ‘normal’ thermal pulses follow if the core mass is lower than a critical value, or if the stellar envelope has been enriched in metals above some critical amount. This enrichment can arise from a previous DCF episode, an efficient second dredge-up episode, or the occurrence of mixing events at the beginning of the AGB or Super-AGB phase. This then leads to more or less efficient third dredge-up and/or HBB, and the activation of relatively strong stellar winds, which eventually allow the ejection of stellar envelopes. Then we may say that such metal-poor stars behave as ‘normal’ thermally pulsing AGB and Super-AGB stars. Here we describe the conditions for the occurrence of a ‘normal’ thermally pulsing AGB or Super-AGB phase in primordial to EMP stars.
- DSF and C-ingestion events:
Models of initial mass 0.8 M⊙ ≲ M ZAMS ≲ 1.3 M⊙ and metallicity below ∼ 10−6−10−5 may experience one or several PIEs during the thermally pulsing AGB phase. These PIEs are similar to the DCF briefly outlined in Section 3: in a DSF the low entropy barrier near the active burning regions allows the inner He-convective shell to extend upwards, beyond the limits of the H-exhausted core. This triggers a H flash and the development of a small convective zone (see Figure 5) enriched in carbon that later will be engulfed in the envelope, leading to its metal enrichment. This phenomenon was studied in detail with 1D hydrostatic codes by, e.g., Fujimoto et al. (Reference Fujimoto, Iben and Hollowell1990, Reference Fujimoto, Ikeda and Iben2000), Siess et al. (Reference Siess, Livio and Lattanzio2002), Suda et al. (Reference Suda, Aikawa, Machida, Fujimoto and Iben2004), Campbell & Lattanzio (Reference Campbell and Lattanzio2008), Iwamoto (Reference Iwamoto2009), and Suda & Fujimoto (Reference Suda and Fujimoto2010). However, as described in Woodward et al. (Reference Woodward, Herwig and Lin2015) a correct investigation of these phenomena requires 3D hydrodynamics with high spatial and temporal resolution. Campbell & Lattanzio (Reference Campbell and Lattanzio2008) found that these DSF events occurred for initial masses 0.8 M⊙ ≲ M ZAMS ≲ 1.3 M⊙.
Another PIE occurs at the beginning of the thermally pulsing AGB phase for stars with masses ≳ 1.3 M⊙. In this case, following the development of an early pulse, a convective zone forms in the H-rich shell and extends inward to penetrate into the C-rich layers. This process was analysed by Chieffi et al. (Reference Chieffi, Domínguez, Limongi and Straniero2001), who named it C ingestion. As we saw with the DCF, the nomenclature for these phenomena is quite heterogeneous. In Figure 5, we present the schematic behaviour of convective zones during DSF and C-ingestion episodes and show the different nomenclature used to refer to these phenomena. Note that Campbell & Lattanzio (Reference Campbell and Lattanzio2008) also use the term DSF to refer to PIEs that are initiated during a shell flash in stars of M ZAMS > 1.3 M⊙. It should be noted that more metal-rich low-mass star models with Z = 10−4 have been reported to experience PIEs without the occurrence of dual flashes (Lugaro et al. Reference Lugaro, Karakas, Stancliffe and Rijs2012).
The occurrence of DSF or C-ingestion episodes always leads to surface enrichments up to values Zsurf ∼ 10−4−10−3. As a consequence, thermal pulses become stronger and stellar winds reach values more similar to those of higher metallicity thermally pulsing AGB stars. As an example, Figure 7 shows the evolution of a primordial 3 M⊙ star during the E-AGB and the first six thermal pulses. After a weak He pulse, the star develops four consecutive DSFs that are able to highly enrich the stellar envelope in C, N, and O. Later on, this model star continues its evolution similarly to a higher Z object of the same mass: it experiences the third dredge-up and ends its life as a white dwarf. It must be highlighted that DSFs may occur after the ignition of several mini-pulses or He-burning instabilities, which are too weak to allow for the formation of inner convective shells. This was the case reported by Chieffi et al. (Reference Chieffi, Domínguez, Limongi and Straniero2001) and Siess et al. (Reference Siess, Livio and Lattanzio2002) for their 4 and 5 M⊙ primordial metallicity models, respectively.
First thermal pulses and DSFs of the thermally pulsing AGB phase of the 3 M⊙ primordial model. Lower panel: evolution of the convective envelope (grey) and of inner convective shells (blue), as well as the evolution of the mass of the H-exhausted core (purple). Middle panel: evolution of the luminosities associated with H- and He-burning (LH in blue and LHe in orange, respectively). Upper panel: evolution of surface abundances of C (black), N (orange), and O (blue).
- Efficient third dredge-up:
As reviewed in the previous section, the occurrence of thermal pulses in EMP stars with core mass  $M \gt M_1^*$ depends on the metal content of the envelope. However, the ability of these pulses to drive a third dredge-up episode depends sensitively on the treatment of convective boundaries. The primordial metallicity intermediate-mass models from Chieffi et al. (Reference Chieffi, Domínguez, Limongi and Straniero2001) and Siess et al. (Reference Siess, Livio and Lattanzio2002) were calculated using overshooting. In particular, Siess et al. (Reference Siess, Livio and Lattanzio2002) presented results with difussive overshooting, as proposed in Freytag, Ludwig, & Steffen (Reference Freytag, Ludwig and Steffen1996) and Herwig et al. (Reference Herwig, Blöcker, Schönberner and El Eid1997). Chieffi et al. (Reference Chieffi, Domínguez, Limongi and Straniero2001) and Siess et al. (Reference Siess, Livio and Lattanzio2002) reported efficient third dredge-up with positive feedback, which caused even further envelope pollution, stronger thermal pulses, and thus even more efficient third dredge-up. As a consequence, relatively strong stellar winds were expected from their models.
The behaviour at somewhat higher metallicity (Z ∼ 10−6 and Z ∼ 10−5) is also strongly model dependent. Gil-Pons et al. (Reference Gil-Pons, Doherty, Lau, Campbell, Suda, Guilani, Gutiérrez and Lattanzio2013) and Lau et al. (Reference Lau, Stancliffe and Tout2008) obtained efficient third dredge-up without including overshooting. Note however that the Gil-Pons et al. (Reference Gil-Pons, Doherty, Lau, Campbell, Suda, Guilani, Gutiérrez and Lattanzio2013) models use the algorithm devised by Frost & Lattanzio (Reference Frost and Lattanzio1996) to determine the convective boundaries. On the other hand, Suda & Fujimoto (Reference Suda and Fujimoto2010), using the strict Schwarzschild criterion, did not report any third dredge-up between 5 and 7 M⊙ approximately in the same metallicity regime.
- Corrosive second dredge-up and dredge-out:
Primordial to Z = 10−8 stars of initial mass 7 M⊙ ≲ M ZAMS ≲ 9 M⊙ experience a corrosive second dredge-up prior to the thermally pulsing Super-AGB phase, and third dredge-up episodes later on. Therefore their stellar envelopes are enriched in metals (specially C and O) and, again, their evolution is more similar to that of ‘normal’ thermally pulsing Super-AGB stars. Mass-loss rates during the thermally pulsing Super-AGB for stars with M ZAMS ≳ 9 M⊙ are even higher (Ṁ ∼ 10−5 M⊙ yr−1) as a consequence of the dredge-out episode.
3.3.3. The cessation of thermal pulses
The occurrence of the second dredge-up is not enough to ensure a standard thermally pulsing AGB or Super-AGB behaviour in intermediate-mass stars. One of the most interesting and peculiar features of primordial thermally pulsing AGB and Super-AGB stars was presented by Lau et al. (Reference Lau, Stancliffe and Tout2008). These authors described the decrease in the intensity and the eventual disappearance of thermal pulses in primordial 5 and 7 M⊙ models. Their results can be explained by the narrowing of the He-rich intershell, which reduces the amount of fuel, and by the higher temperature of the intershell that increases the contribution of radiation to the total pressure and make in this regime the 3-α reaction rate less dependent on temperature (e.g. Siess Reference Siess2007). As a consequence, the thermal pulses are weaker and the corresponding expansion is much more moderate than for higher metallicity stars [see Yoon, Langer, & van der Sluys (Reference Yoon, Langer and van der Sluys2004), for a detailed analysis of the stability criteria].
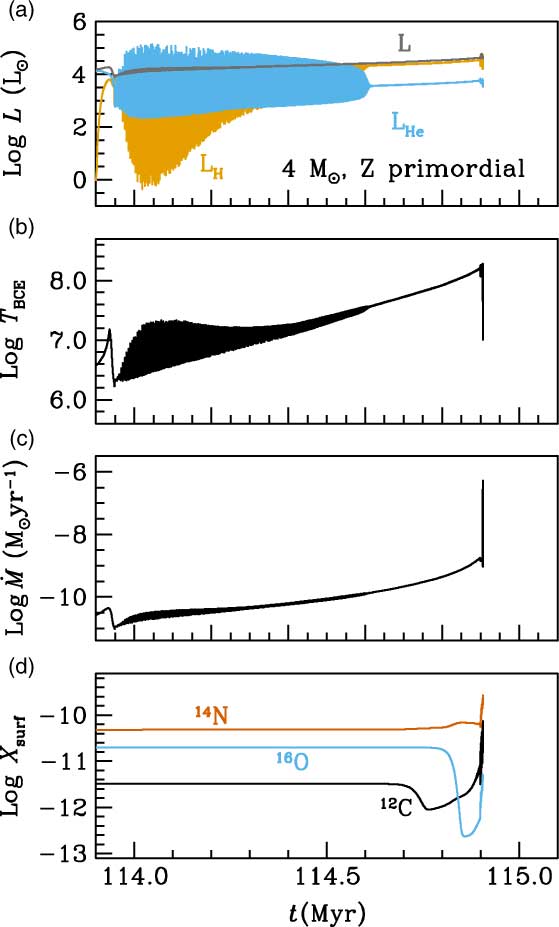
The results for a similar calculation are presented in Figure 8, for a primordial 6.5 M⊙ model, and in Figure 9, for a 4 M⊙ model. In both cases we find, as did Lau et al. (Reference Lau, Stancliffe and Tout2008), that our thermal pulses decrease in intensity and eventually disappear. Later on both H- and He-burning proceed quiescently, but other interesting evolutionary events are encountered (Gutiérrez et al. in preparation): a few 104 years after the disappearance of thermal pulses, when the core mass is ∼1.05 M⊙, the temperature at the base of the convective envelope reaches 100 × 106 K, and the 3α reactions are also activated at the base of the convective envelope, which causes a mild increase of 12C at the stellar surface, even when no third dredge-up is active. This increase in envelope metallicity may eventually boost unstable He-burning and trigger third dredge-up if, as expected by Komiya et al. (Reference Komiya, Suda, Minaguchi, Shigeyama, Aoki and Fujimoto2007), this phenomenon happens above a critical Z. Therefore at this point, the possibility of reaching a critical metallicity, as proposed in Fujimoto et al. (Reference Fujimoto, Iben, Chieffi and Tornambe1984), cannot yet be discarded for models which experience the re-onset of thermal pulses. This might drive a new series of stronger thermal pulses and a significant envelope enrichment in carbon which, itself, might drastically enhance the mass-loss rates. It is interesting to note that the phenomena of the cessation and re-onset of thermal pulsations, with a different anatomy from standard thermally pulsing AGB pulses, is also encountered with the code mesa [see Paxton et al. (Reference Paxton2018) and references therein]. These new thermal pulsations have luminosities which, even at their local maximum values, are about one order of magnitude lower than the luminosity from H-burning, which also develops through pulsations (see Figure 9). According to our calculations, the range of masses for which primordial stars are expected to develop thermal pulses and end (or temporarily halt) them is between ∼4 and ∼7 M⊙, when using the stellar wind prescriptions by either Vassiliadis & Wood (Reference Vassiliadis and Wood1993), or Bloecker (Reference Bloecker1995) with η = 0.01. Stars of Z = 10−8 proceed through the thermally pulsing AGB or Super-AGB phase in a way very similar to that of primordial objects, that is, they also experience the end of thermal pulses, but in a narrower mass range (between ∼5 and ∼7 M⊙).
Left panel: H- and He-burning luminosities (LH in orange, and LHe in blue, respectively) during the thermally pulsing AGB phase of a 6.5 M⊙ star of primordial composition. Right panel shows a zoom of the last thermal pulses represented on the left.
Summary of the evolution during the thermally pulsing AGB phase of the 4 M⊙ primordial metallicity model. Panel a) shows the evolution of H- and He-burning luminosities (LH in orange and LHe in blue, respectively), and the surface luminosity (L) in grey. Panel b) shows the evolution of the temperature at the base of the convective envelope. Panel c) shows the evolution of mass-loss rates, and Panel d) shows the evolution of surface abundances of 12C (black), 14N (orange), and 16O (blue).
3.3.4. Evolution as a function of mass and metallicity
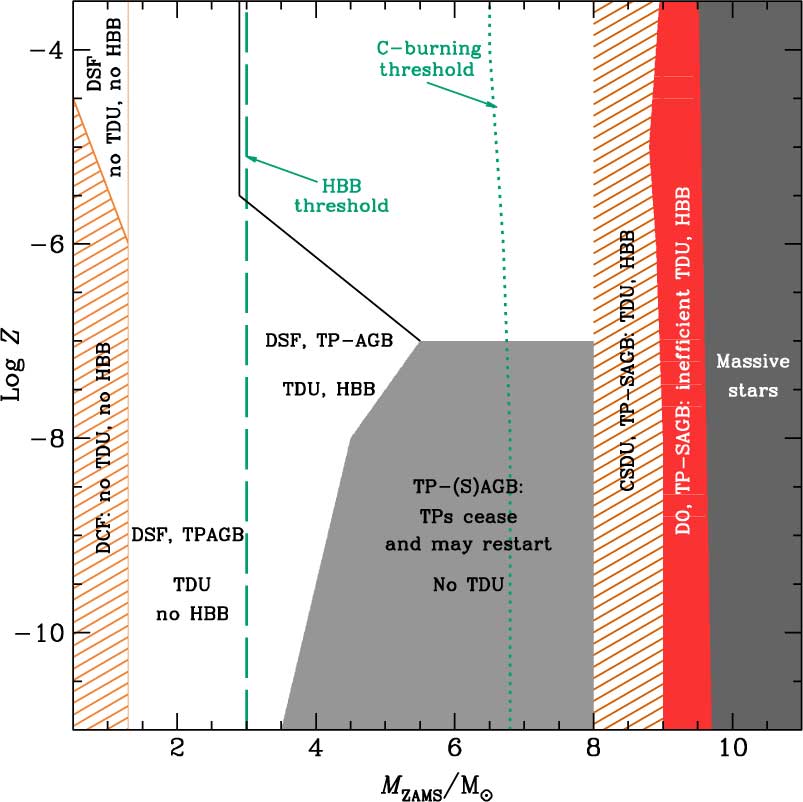
Figure 10 summarizes the expected main characteristics of the late evolutionary stages of stars between 3 and 10 M⊙, from approximately primordial Z to logZ = −3.5. These results correspond to a set of calculations obtained with similar versions of the same code (monstar>) and using similar input physics. It must be noted that the inclusion of different input physics, especially very different mass-loss rates due to stellar winds, different definitions of the convective boundaries, or fast rotation, would alter the locations of the quoted regions. For instance, the limits of the different evolutionary regions proposed by Fujimoto et al. (Reference Fujimoto, Ikeda and Iben2000), Suda et al. (Reference Suda, Aikawa, Machida, Fujimoto and Iben2004), and Suda & Fujimoto (Reference Suda and Fujimoto2010) do not coincide with the ones shown in Figure 10, but the existence of these regions and their dependence on initial mass and metallicity are reproduced. In particular, Suda & Fujimoto (Reference Suda and Fujimoto2010) find a wider initial metallicity interval in which no third dredge-up is occurring, probably because they used the strict Schwarzschild criterion (with no modifications) for their calculations. Even though they did not follow the advanced thermally pulsing AGB or Super-AGB phase, we could expect that such models would end up experiencing a cessation of thermal pulses (our grey region). On the other hand, according to the results from Chieffi et al. (Reference Chieffi, Domínguez, Limongi and Straniero2001) and Siess et al. (Reference Siess, Livio and Lattanzio2002), which implemented overshooting, the grey area corresponding to the cessation of thermal pulses would probably disappear. The reason is that their models experience third dredge-up, stronger thermal pulses, and overall, a thermally pulsing AGB or Super-AGB phase more similar to that of higher Z stars.
Approximate classification of primordial to very metal-poor models in the M ZAMS–log Z plane, according to the main characteristics of their late evolution. Models to the right of the green dotted line experience C-burning. Models to the right of the green dashed line experience HBB. DCF refers to dual core flash, DSF to dual shell flash, DO to dredge-out, TDU to third dredge up, and CSDU to corrosive second dredge-up. See text for further details.
4. The main input physics and model uncertainties
4.1. The efficiency of third dredge-up
The correct determination of convective boundaries is critical in many stages of stellar evolution. Here we focus on the third dredge-up, which is of prime importance for the evolution and fates of the lowest metallicity intermediate-mass stars.
The efficiency of the third dredge-up is a long-standing unknown in thermally pulsing Super-AGB calculations. Regardless of the initial metallicity, the third dredge-up is intimately related to the treatment of convective boundaries. Models which implement the strict Schwarzschild criterion either experience a less-efficient or no third dredge-up at all (Siess Reference Siess2007; Gil-Pons et al. Reference Gil-Pons, Gutiérrez and García-Berro2007; Lau et al. Reference Lau, Stancliffe and Tout2008). On the other hand, models that either implement a modification of the Schwarzschild limit, such as the attempt to search for convective neutrality [see Frost & Lattanzio (Reference Frost and Lattanzio1996) and the discussion at the beginning of Section 3], or overshooting (Herwig, Blöcker, & Schönberner Reference Herwig, Blöcker, Schönberner, Bertre, Lebre and Waelkens1999; Chieffi et al. Reference Chieffi, Domínguez, Limongi and Straniero2001; Siess et al. Reference Siess, Livio and Lattanzio2002) usually find efficient third dredge-up [see, for instance, Herwig (Reference Herwig2000), Herwig (Reference Herwig2004), Cristallo et al. (Reference Cristallo, Piersanti, Straniero, Gallino, Domínguez and Käppeler2009), and Karakas (Reference Karakas2010)].
The efficiency of the third dredge-up also depends on the strength of the thermal pulses, because strong pulses drive further expansion and cooling of the regions below the base of the convective envelope. This cooling increases the opacity and thus produces a deeper inward progression of convection.
At least for relatively low-mass and higher metallicity objects, the effects of the third dredge-up on surface composition can be compared with observations, and thus allow some calibration (e.g. Marigo, Girardi, & Bressan Reference Marigo, Girardi and Bressan1999; Girardi & Marigo Reference Girardi, Marigo, Charbonnel, Schaerer and Meynet2003). In the case of EMP stars, the occurrence of third dredge-up can be derived from the presence of S-process elements in the surface of unevolved C-enhanced EMP stars. The difficulty in reliably determining the third dredge-up efficiency limits our knowledge of the final fates, since the third dredge-up not only alters the metal content of the envelope, but also determines the core growth rate,Footnote f and the mass-loss rates due to stellar winds. Herwig (Reference Herwig2004), Goriely & Siess (Reference Goriely and Siess2004), and Lau et al. (Reference Lau, Stancliffe and Tout2009) reported the occurrence of a ‘hot third dredge-up’, which occurs at envelope temperatures so high that some C may be transformed into N during the process. During a hot third dredge-up the convective envelope is able to erode most of or, in some cases, even the entire intershell, and reach the CO core. Furthermore, the depth of third dredge-up determines the composition of the envelope which determines the local opacity, which feeds back onto the depth of dredge-up. The envelope composition also has a substantial effect on the mass loss. We will consider it in subSection 4.3.
Finally, it is important to recall the relevance of numerics in these evolutionary calculations. As reported by Chieffi et al. (Reference Chieffi, Domínguez, Limongi and Straniero2001), changing the time step or spatial resolution may affect the advance of the convective envelope into C-rich regions.
4.2. The effect of different sources of opacities: molecular opacities and dust
In the low-temperature regime (T ≲ 5000 K), molecules and dust are the main sources of opacity. Low-temperature opacities were traditionally calculated under the assumption of a scaled solar composition [see, for instance, Alexander (Reference Alexander1975) and Ferguson et al. (Reference Ferguson, Alexander, Allard, Barman, Bodnarik, Hauschildt, Heffner-Wong and Tamanai2005)] and thus could not account for the envelope abundance variations caused by the second and third dredge-up episodes and by HBB. This important drawback was alleviated either by interpolating within existing opacity tables to account for the CN molecule (Scalo & Ulrich Reference Scalo and Ulrich1975), or variable C abundances (Bessell et al. Reference Bessell, Brett, Wood and Scholz1989), or by calculating new opacity tables with variable C/O ratios, such as Alexander, Rypma, & Johnson (Reference Alexander, Rypma and Johnson1983) and Lucy, Robertson, & Sharp (Reference Lucy, Robertson and Sharp1986).
The effects of variable composition low-temperature opacities in evolutionary calculations were highlighted by the synthetic models of Marigo (Reference Marigo2002), and then in the detailed AGB models of Cristallo et al. (Reference Cristallo, Straniero, Lederer and Aringer2007), Weiss & Ferguson (Reference Weiss and Ferguson2009), Ventura & Marigo (Reference Ventura and Marigo2009), Ventura & Marigo (Reference Ventura and Marigo2010), Fishlock et al. (Reference Fishlock, Karakas, Lugaro and Yong2014), and Constantino et al. (Reference Constantino, Campbell, Gil-Pons and Lattanzio2014). The latter authors used the opacity tables in aesopus (Lederer & Aringer Reference Lederer and Aringer2009; Marigo & Aringer Reference Marigo and Aringer2009) and concluded that, regardless of their original metallicity, all model calculations of initial mass ≲ 3 M⊙ should include changes in the surface composition and their effect on opacity because, even at very low metallicities, models were able to efficiently dredge up metals to the surface and significantly alter their surface composition. In general the consequences of including variable composition low-temperature effects include higher opacity values, larger radii, lower surface temperatures, and higher mass-loss rates. As a consequence, the thermally pulsing AGB or Super-AGB phase is shorter, the third dredge-up is less efficient (there are fewer thermal pulses), and HBB is less efficient (when it occurs).
Until very recently, dust in the most metal-poor AGB stars was assumed to be practically non-existent (Di Criscienzo et al. Reference Di Criscienzo2013), and thus an almost irrelevant source of opacity compared to molecules. However, recent work by Tashibu, Yasuda, & Kozasa (Reference Tashibu, Yasuda and Kozasa2017) suggests that dust might form after envelope pollution caused by the second dredge-up, by PIEs, and by the third dredge-up. This additional source of opacity would further increase the effects of the composition-dependent molecular opacities as stated above.
It must be noted that for stars with Z ≲ 10−8 and initial masses 5 M⊙ ≲ M ZAMS ≲ 8 M⊙ that neither undergo a very efficient second dredge-up, nor PIEs, nor a third dredge-up, the photosphere is too hot to allow for the formation of carbon dust which, according to Tashibu et al. (Reference Tashibu, Yasuda and Kozasa2017), occurs for T eff ≲ 3850 K.
4.3. Mass-loss rates
A very substantial source of uncertainty, which compromises our knowledge of the final fate of the most metal-poor stars, is represented by stellar winds. It is known that intermediate-mass stars of ‘normal’ metallicity lose their envelopes during their RGB and (super-)AGB phases to become white dwarfs. The exceptions to this general behaviour are the most massive intermediate-mass objects, whose outcome may be either a white dwarf or an EC-SN. The situation is much more uncertain in the case of EMP stars. In general, stellar winds are controlled by different mechanisms, such as radiation, pulsations, and dust formation, or photospheric Alfvén waves, but a clear, self-consistent theory is still lacking. During the RGB, the standard choice was Reimers (Reference Reimers1975) for a long time, but its shortcomings (related to the mechanical energy flux in the envelope, and to its dependence on the chromospheric height) prompted a revision of this prescription, which was addressed by Van Loon et al. (Reference Van Loon, Cioni, Zijlstra and Loup2005), Schröder & Cuntz (Reference Schröder and Cuntz2005), and McDonald & Zijlstra (Reference McDonald and Zijlstra2015). With the new prescription by Schröder & Cuntz (Reference Schröder and Cuntz2005), stellar winds agree with observed RGB mass-loss observations over a wide range of metallicities [see Schröder & Cuntz (Reference Schröder and Cuntz2007)].
The driving mechanism of stellar winds during the E-AGB may still be well described by Schröder & Cuntz (Reference Schröder and Cuntz2005), but when the superwind phase (Ṁ ≳ 10−5 M⊙ yr−1) is reached during the thermally pulsing AGB, then alternative prescriptions based on pulsation-aided dust-driven winds must be considered. Vassiliadis & Wood (Reference Vassiliadis and Wood1993) established a direct relation between mass-loss rate and pulsation period after compiling CO microwave observations of AGB stars. Straniero, Gallino, & Cristallo (Reference Straniero, Gallino and Cristallo2006) proposed a new calibration for the mass-loss period relation, which gave results more similar to the prescription of Reimers (Reference Reimers1975), with a multiplying constant which switched from 0.5 to 5 on the late thermally pulsing AGB. Bloecker (Reference Bloecker1995) presented a prescription based on the atmospheric calculations for Mira stars made by Bowen (Reference Bowen1988). The mass-loss rates derived from these different approaches differ widely, with Bloecker (Reference Bloecker1995) rates being far higher than the rest (by a factor ∼ 100). We note that most calculations which use Bloecker’s prescription (even in works by Bloecker himself) tend to apply a multiplying constant η∼ 0.01 [see, for instance, Ventura & D’Antona (Reference Ventura and D’Antona2010)], or η∼ 0.1, as in Groenewegen & de Jong (Reference Groenewegen and de Jong1994).
Mass-loss rates associated with pulsations in the case of the most metal-poor stars present two main problems. First, according to the traditional perspective, pulsations in AGB and Super-AGB stars are induced by radiation pressure in dust grains which, in principle, are absent (or existing only in small amounts) in the lowest Z cases. Dust around stars can be produced in either carbon-rich or oxygen-rich chromospheres. Carbon is obviously required to form carbonaceous dust. This element can be both primary and produced in AGB stars (although not efficiently in some EMP stars). O, Si, Al, and Fe are required for dust production in O-rich environments, but substantial amounts of Si and Al cannot be produced in the most metal-poor AGB stars. Additionally, dust formation requires relatively low temperatures, whereas the most metal-poor stars are more compact and hotter than their higher Z counterparts. The second reason why mass loss is thought to be reduced at lower metallicity regimes is related to the pulsations themselves. From the theoretical pulsation model predictions from Wood (Reference Wood, Qain, Leung, Zhu and Kwok2011), it is expected that, in EMP AGB stars, the amplitude of stellar pulsations is lower, and hence strong pulsation-driven winds are inhibited.
Interestingly, none of the wind rate prescriptions mentioned above has an explicit dependence on metallicity. Of course, the metallicity indirectly affects the mass-loss rates through its effect on surface luminosity, radius, and effective temperature. Influenced by considerations related to stellar winds of more massive (and hotter) stars, a metallicity scaling (Z surf / Z⊙)α was introduced by Pauldrach, Kudritzi, & Puls (Reference Pauldrach, Kudritzi and Puls1989), where Z surf is the stellar surface abundance, and α is an exponent typically ranging between 0.5 and 0.7. This scaling could account for the lower mass-loss rates expected from the most metal-poor stars, but its original justification was based on line-driven winds, which probably are not relevant for (super-)AGB stars, and limits its use to intermediate-mass stellar models.
As a consequence of the former considerations, the earliest works on advanced evolution of the most metal-poor stars assumed that stellar winds would be practically negligible. This apparently solid hypothesis was first shaken when detailed models showed that various mixing episodes were able to efficiently pollute stellar envelopes over a relatively wide mass range (see Sections 3.2 and 4.1). Later, when the composition-dependent low-temperature opacities were introduced, stellar wind rates were dramatically enhanced, and the late evolutionary stages of intermediate-mass stars in the low-mass range, M ZAMS ≲ 3 M⊙, were shortened [Constantino et al. (Reference Constantino, Campbell, Gil-Pons and Lattanzio2014) and references therein]. Additionally, the possibility of forming dust in these stars also opened the possibility of very strong dust-driven winds as noted by Tashibu et al. (Reference Tashibu, Yasuda and Kozasa2017). These winds might cause the loss of the envelope in stars of initial mass below approximately 5 M⊙.
Finally, because we expect low-temperature opacity effects to be less important in stars with Z ≲ 10−8 and initial masses 5 M⊙ ≲ M ZAMS ≲ 8 M⊙, stellar winds in these objects could still be very low, and thus the characteristic thermally pulsing AGB and Super-AGB evolution described in Section 3.3.3, with a thousand or more thermal pulses and their eventual disappearance is still expected.
4.4. Additional sources of uncertainties
4.4.1. The instability in the late thermally pulsing AGB and Super-AGB phase
Lau et al. (Reference Lau, Gil-Pons, Doherty and Lattanzio2012) analysed the reasons why thermally pulsing AGB and Super-AGB model calculations fail to converge while their stellar envelopes are still relatively massive (M env ∼ 0.1–3 M⊙). A sharp peak in the opacity, due to the presence of Fe-group elements, located near the base of the convective envelope causes an accumulation of energy. This eventually leads to a departure from hydrostatic equilibrium and to the halting of calculations. The consequences of this instability are unclear: either the H-rich envelope might be quickly ejected, or hydrostatic equilibrium might be recovered after a fast envelope expansion. The lower Fe-peak element abundance in EMP stars might delay or hamper the occurrence of the instability, but this effect has not yet been studied in detail.
4.4.2. Nuclear reaction rates
The most important reaction affecting the evolution of Super-AGB stars is 12C(12C, α)20Ne. Straniero, Piersanti, & Cristallo (Reference Straniero, Piersanti and Cristallo2016) recently analysed the effects of taking into account an increase in this reaction rate, attributed to a possible resonance in the 1.3–1.7 MeV range that is expected from extrapolation of experimental data (Spillane et al. Reference Spillane2007). According to Straniero et al. (Reference Straniero, Piersanti and Cristallo2016), the effects of this modified reaction rate would be a decrease of ∼ 2 M⊙ in the lower initial mass threshold for C ignition, and a similar variation in the lower mass threshold for the formation of an iron core leading to a CC SN. As a consequence, and regardless of the initial metallicity, the SN rate would be altered. These authors also analysed the effects of varying the important but highly uncertain rate of the 12C(12α, γ)16O reaction, but did not find significant effects on the mass thresholds mentioned above.
New experimental determinations of the rate of 12C(12C, α)20Ne and 12C(12C, p)23Na by Tumino et al. (Reference Tumino2018) have reported an increase in the rate of ∼ 10 over the standard rates by Caughlan & Fowler (Reference Caughlan and Fowler1988) in the range 0.5−1.2 × 10⁹ K. These new rates, published in the late stages of the writing of this review, may have profound effects on the evolution of Super-AGB and massive stars and change the initial mass thresholds for the different fates of stars.
4.4.3. Rotation
The effects of rotation on the evolution of intermediate-mass metal-poor stars have not been extensively studied, but there is no reason to assume that it is not significant. In fact, metal-poor models are more compact and, thus, probably experience higher rotation rates than their higher metallicity counterparts [see, for instance, Meynet (Reference Meynet2007) and Ekström et al. (Reference Ekström, Meynet, Chiappini, Hirschi and Maeder2008)]. Hydrodynamical instabilities associated with meridional circulation and shear instability are expected to enhance mixing efficiency between the H-exhausted core and the envelope (Heger, Langer, & Woosley Reference Heger, Langer and Woosley2000; Maeder & Meynet Reference Maeder and Meynet2001; Meynet & Maeder Reference Meynet and Maeder2002; Chieffi & Limongi Reference Chieffi and Limongi2013), especially at low metallicities. Therefore, it has important consequences in terms of nucleosynthesis.
In terms of stellar final fates, it is important to consider that rotation may affect mass-loss rates due to stellar winds (Heger et al. Reference Heger, Langer and Woosley2000). Farmer et al. (Reference Farmer, Fields and Timmes2015) found a very limited effect of rotation on the lower initial mass threshold for C ignition (at least when overshooting was included), although their analysis was restricted to solar metallicity models. Decressin et al. (Reference Decressin, Charbonnel, Siess, Palacios, Meynet and Georgy2009) computed intermediate-mass models with rotation in the metallicity range covered by globular clusters. They concluded that rotation favoured CNO surface pollution during dredge-up episodes, and thus higher metallicity ejecta during the thermally pulsing AGB.
Rotation affects many critical processes, such as mass-loss rates and transport of matter within stars. These transport mechanisms certainly interact with those already known to exist even in non-rotating stars. These facts led Chieffi & Limongi (Reference Chieffi and Limongi2013) to point out that a general solution to many discrepancies between observations and theoretical models might be found in a consistent treatment of rotation, rather than in separately tuning the effects of overshooting, or different mass-loss rate prescriptions.
4.4.4. Binarity
Many observed EMP stars belong to, or may be descendants of, stars that experienced binary interactions. Therefore, it is important to highlight that a complete understanding of the evolution and nucleosynthesis of EMP stars should take these interactions into account. However, binarity can completely change the characteristics of the evolution and the fates of stars. Besides, the associated uncertainties add to (and are often entangled with) those of single EMP stars. A complete summary of the effects and uncertainties related to binarity would be a matter for a separate review and will not be discussed here.
5. Final fates of primordial and EMP stars
The fate of stars that enter the thermally pulsing AGB or Super-AGB phase depends on the competing effects of core growth and mass-loss rate by stellar winds. If the core is able to reach M Ch before the envelope is lost, the star will become either an SN I1/2 (Arnett Reference Arnett1969; Iben & Renzini Reference Iben and Renzini1983) if it hosts a CO core, or an EC-SN, if it has an ONe core (Miyaji et al. Reference Miyaji, Nomoto, Yokoi and Sugimoto1980; Nomoto Reference Nomoto1984, Reference Nomoto1987). If M Ch is never reached, the star ends its life as a white dwarf. Both the core growth and mass-loss rates are based on the poorly known input physics described in Section 4, which makes the determination of stellar final fates uncertain, especially at the lowest Z regime.
5.1. The mass limits Mup, Mn, and Mmas as functions of the metallicity
In discussing the final fates of intermediate-mass stars it is convenient to use the standard nomenclature:
M up: the minimum initial mass required to burn carbon sufficiently to develop an associated inner convective shell;
M n: the minimum initial mass that leads to an EC-SN;
M mas: the minimum initial mass that forms a CC SN (see Figure 11).
Approximate regions defining the expected final fates for models of metallicity values between primordial and log Z = −3.5, in the initial mass–metallicity plane. Upper panels show the expected final fates according to Fujimoto et al. (Reference Fujimoto, Iben, Chieffi and Tornambe1984). The middle panel presents the final fates according to the evolution described in Figure 10. The region between the dotted lines represents the possible SN I1/2 region derived from the work of Suda & Fujimoto (Reference Suda and Fujimoto2010). The lower panel presents the predicted final fates under the assumption that actual stellar winds in our models behave as those of ‘normal’ metal-rich stars.
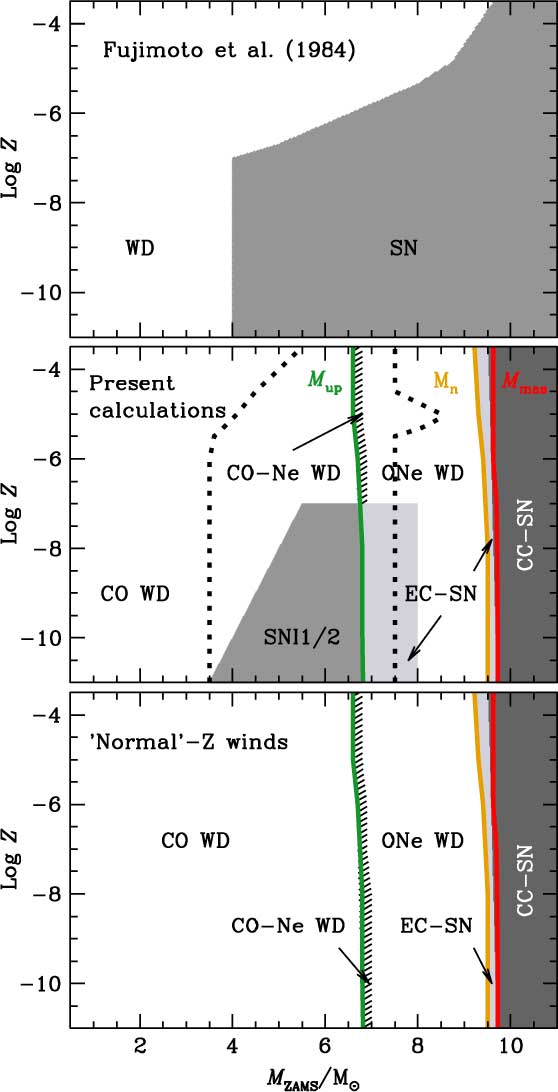
M up is mainly controlled by the maximum size of the convective core during central H-burning and by the efficiency of the second dredge-up. Different calculations, with different input physics and initial metallicities ranging between EMP and solar values, yield M up values ranging between 5 M⊙ (Tornambe & Chieffi Reference Tornambe and Chieffi1986; Cassisi & Castellani Reference Cassisi and Castellani1993; Girardi et al. Reference Girardi, Bressan, Bertelli and Chiosi2000) and 9 M⊙ (Siess Reference Siess2007). The general trend with metallicity is the increase of M up with Z, with a minimum M up between Z = 10−4 (Siess Reference Siess2007) and Z = 10−3 (Becker & Iben Reference Becker and Iben1979; Castellani et al. Reference Castellani, Chieffi, Tornambe and Pulone1985; Umeda et al. Reference Umeda, Nomoto, Yamaoka and Wanajo1999; Girardi et al. Reference Girardi, Bressan, Bertelli and Chiosi2000; Bono et al. Reference Bono, Caputo, Cassisi, Marconi, Piersanti and Tornambe2000; Ibeling & Heger Reference Ibeling and Heger2013; Doherty et al. Reference Doherty, Gil-Pons, Siess, Lattanzio and Lau2015).
As shown in Doherty et al. (Reference Doherty, Siess, Lattanzio and Gil-Pons2010), models that are just above M up ignite carbon in the very external shells of the CO core but the combustion quenches and cannot proceed to the centre. The stellar core then presents an atypical structure with a degenerate CO core surrounded by a thin layer of Ne and O. These failed Super-AGB stars develop so-called hybrid CO–Ne cores and, according to Doherty et al. (Reference Doherty, Gil-Pons, Siess, Lattanzio and Lau2015), lie in a mass interval ∼ 0.1 M⊙ wide above M up. This mass interval can increase to 1.4 M⊙ (Chen et al. Reference Chen, Herwig, Denissenkov and Paxton2014), or even disappear (Brooks et al. Reference Brooks, Schwab, Bildsten, Quataert and Paxton2016), when different treatments of convective boundaries are implemented.
M mas ranges between 8 M⊙ and 11.5 M⊙ (Poelarends et al. Reference Poelarends, Herwig, Langer and Heger2008) and its behavior as a function of metallicity is similar to that of M up. The mass interval between M n and M mas corresponds to the initial mass values over which EC-SNe form, and according to the latest calculations it is about 0.1–0.2 M⊙ wide (Doherty et al. Reference Doherty, Gil-Pons, Siess, Lattanzio and Lau2015). These results are in contrast to those from Poelarends (Reference Poelarends2007), who obtained an increasingly wide initial mass interval with decreasing Z for the occurrence of EC-SNe, and the conclusion that all Super-AGB stars having Z = 10−5 would end their lives as EC-SNe. The reason for these variations is the use of different input physics, especially different prescriptions for the mass-loss rates. Doherty et al. (Reference Doherty, Gil-Pons, Siess, Lattanzio and Lau2015) used the prescription by Vassiliadis & Wood (Reference Vassiliadis and Wood1993) with no additional dependence on the envelope metallicity. In contrast Poelarends (Reference Poelarends2007) used the mass-loss prescription by Van Loon et al. (Reference Van Loon, Cioni, Zijlstra and Loup2005) with the previously discussed metallicity scaling included. In summary, there are large variations in the different determinations of M up, M n, and M mas. This means that there are substantial uncertainties in the initial mass interval for the occurrence of EC-SNe. This reflects the sensitivity of these quantities to uncertainties in the input physics and prescriptions for convection, which are at present unavoidable. Finally it should be noted that, whilst the final fates of stars with Z ≳ 10−4 have been widely explored, only a few models at the lowest Z regimes have been analysed.
5.2. The formation of SNe I1/2
Zijlstra (Reference Zijlstra2004) considered the reasoned assumption that stellar winds in the most metal-poor regime were very weak (Wood Reference Wood, Qain, Leung, Zhu and Kwok2011) and proposed that intermediate-mass stars with M ZAMS < M up, i.e. those hosting CO cores during their thermally pulsing phase, could become SNe I1/2 (Arnett Reference Arnett1969; Iben & Renzini Reference Iben and Renzini1983).
Poelarends (Reference Poelarends2007) performed detailed calculations of intermediate-mass (and a few massive) stars up to the E-AGB and Super-AGB, in order to obtain information about their envelope enrichment just after the second dredge-up and, especially, to get starting masses for their parameterised thermally pulsing phase. This parametric approach was then used to analyse the subsequent model evolution and determine their final fates. The third dredge-up was parameterised as in Karakas, Lattanzio, & Pols (Reference Karakas, Lattanzio and Pols2002) and different prescriptions for mass-loss rates due to stellar winds were used (Vassiliadis & Wood Reference Vassiliadis and Wood1993; Bloecker Reference Bloecker1995; Van Loon et al. Reference Van Loon, Cioni, Zijlstra and Loup2005). Their favoured parameterisation included the mass-loss prescription by Van Loon et al. (Reference Van Loon, Cioni, Zijlstra and Loup2005) with an additional metallicity scaling from Pauldrach et al. (Reference Pauldrach, Kudritzi and Puls1989). Besides the occurrence of EC-SNe for all Super-AGB stars of Z ∼ 10−5 mentioned above, Poelarends (Reference Poelarends2007) concluded that SN I1/2 could form for initial masses between 6 M⊙ and 6.4 M⊙, and that stars with M ZAMS < 6 M⊙ would end up as CO-white dwarfs. These authors did not actually present detailed calculations below Z ≈ 10−5.
Lau et al. (Reference Lau, Stancliffe and Tout2008) presented calculations of the evolution of primordial 5 and 7 M⊙ models, whose thermal pulses lost strength and halted. The 7 M⊙ model had experienced about 1400 pulses (see Section 3.3), and at the time of their cessation, it hosted a very low-metallicity envelope (Z surf ∼ 10−6). During the subsequent evolution, thermal pulses never recovered, and the degenerate core grew up to 1.36 M⊙. At that point the star was still surrounded by a H-rich envelope and the physical conditions at the centre were very similar to those of a white dwarf belonging to a binary system just prior to an SN Ia explosion. By analogy with SNe Ia, C-burning under these conditions is not expected to lead to the formation of an ONe core but instead to the complete destruction of the star. This led the authors to conclude that their model of 7 M⊙ primordial star will produce an SN I1/2.
The cessation of thermal pulses is found by various codes for models with M ZAMS approximately between 4 and 7 M⊙ at primordial Z, and for models with M ZAMS approximately between 5 and 7 M⊙ at Z = 10−8.
Using a parametric model to complement their detailed evolutionary calculations, Lau et al. (Reference Lau, Stancliffe and Tout2008) explored the possible outcomes of their models assuming a constant core growth rate and different mass-loss rate prescriptions: specifically, Reimers (Reference Reimers1975), Bloecker (Reference Bloecker1995), and Schröder & Cuntz (Reference Schröder and Cuntz2005) both with and without metallicity scaling. The final fates of the considered stars were independent of the tested wind prescriptions, but were affected by the Z scaling: a small Z scaling expressed as (Z / Z ⊙)0.5 allowed the model to become an SN I1/2.
The models presented by Suda & Fujimoto (Reference Suda and Fujimoto2010) also showed the existence of a region in the initial mass–initial metallicity plane where third dredge-up does not develop (see Section 3.3.4). This fact together with the absence of a previous efficient second dredge-up allows us to infer that the expected final fate of these models might also be an SN I1/2. The summary for the expected final fates according to different calculations (and input physics assumptions) is shown in Figure 11. It emphasises the huge limitations in our knowledge of the fates of many EMP stars.
It is also important to realise that the calculations of models leading to the cessation of thermal pulses and, eventually, to the formation of SNe I1/2 were performed without including composition-dependent low-temperature opacities. In principle, it should not drastically alter these results, as the envelope metallicity at the onset of thermal pulses is very low (Z surf ∼ 10−6 in stars, Z surf ≲ 10−8 in monstar, and Z surf ≲ 10−7 in mesa). Besides, the recently found phenomenon of the re-onset of thermal pulses (Gutiérrez et al. in preparation) might completely change the picture concerning the occurrence of SNe I1/2. The reason is that, together with the new pulses, significant envelope enrichment and much more efficient winds could develop. This might prevent the core mass from reaching M Ch before the envelope is completely lost.
The comparison between the former models (Lau et al. Reference Lau, Stancliffe and Tout2008, Reference Lau, Stancliffe and Tout2009) and the works by Chieffi et al. (Reference Chieffi, Domínguez, Limongi and Straniero2001) and Siess et al. (Reference Siess, Livio and Lattanzio2002) illustrates the importance of the efficiency of the dredge-up episodes and, ultimately, of the treatment of convective boundaries. Thermally pulsing Super-AGB models of intermediate-mass stars presented by Chieffi et al. (Reference Chieffi, Domínguez, Limongi and Straniero2001) and Siess et al. (Reference Siess, Livio and Lattanzio2002) that implemented diffusive overshooting show somewhat higher envelope metallicity after the second dredge-up and, most importantly, do experience an efficient third dredge-up. Thus they are able to drive stronger thermal pulses and moderately high stellar winds. Even though these authors did not follow the evolution until the end of the thermally pulsing AGB or Super-AGB, one could reasonably expect that their model stars would end their lives as white dwarfs.
In terms of applications of these models, Matteucci & Tornambe (Reference Matteucci and Tornambe1985) considered the effects of taking into account SNe I1/2 in galactic chemical evolution. Tsujimoto & Shigeyama (Reference Tsujimoto and Shigeyama2006) interpreted the composition of low α− and n-capture element EMP stars in terms of the existence of SN I1/2 progenitors (they named these objects SNe IIIa). Suda et al. (Reference Suda2013) investigated the occurrence of SNe I1/2 in their analysis of the transition of the IMF using binary population synthesis.
5.3. The formation of EC-SNe
Super-AGB stars whose ONe cores grow up to M core = 1.37 M⊙ (Miyaji et al. Reference Miyaji, Nomoto, Yokoi and Sugimoto1980; Nomoto Reference Nomoto1984; Nomoto Reference Nomoto1987) reach central densities high enough to make electron capture reactions energetically favourable. In the ONe core, the electrons are captured by 24Mg, 23Na, and 20Ne, and with a reduction of the electron density, the degenerate core loses its pressure support and starts to contract rapidly. Oxygen eventually ignites and the core is converted into a mixture resulting from nuclear statistical equilibrium. The subsequent electron captures on these elements accelerate the collapse and an SN explosion supported by neutrino heating ensues (Kitaura, Janka, & Hillebrandt Reference Kitaura, Janka and Hillebrandt2006). The most massive Super-AGB models are also able to ignite Ne off-centre at the end of the C-burning process. If the Ne-burning flame is quenched before reaching the centre, the star will also probably end its life as an EC-SN. The characteristics of Ne-burning in these peculiar stars strongly depend on the treatment of convective boundaries. The use of some convective boundary mixing may allow the occurrence of Ne-burning through a series of flashes which eventually get stalled and allow the formation of an EC-SN. Models undergoing this type of evolution have been named ‘failed massive’ stars (Jones et al. Reference Jones2013; Jones, Hirschi, & Nomoto Reference Jones, Hirschi and Nomoto2014). On the other hand, when using the strict Schwarzschild criterion, the Ne-burning flame reaches the centre and the star continues its evolution to become a CC SN.
The lower and upper initial mass thresholds for the formation of EC-SNe (M n and M mas, respectively) for metallicities ≥ 10−5 were discussed in detail by Doherty et al. (Reference Doherty, Gil-Pons, Siess and Lattanzio2017). Here we focus on the most metal-poor cases (Z ≲ 10−5). It is interesting to note from the middle panel of Figure 11 that there is a gap in the EC-SN region between 8 M⊙ and M n. That is, white dwarfs are expected to form in this mass range, even at the lowest metallicities.Footnote g This gap in the EC-SN region is caused by the occurrence of the corrosive second dredge-up (see Figure 10), which pollutes the stellar envelope enough to allow for a ‘normal’ thermally pulsing Super-AGB. Thus the occurrence of third dredge-up, moderately strong winds, and final fates as ONe white dwarfs is expected to ensue. The efficiency of third dredge-up, even though highly uncertain, is expected to decrease and become very low in the most massive intermediate-mass stars (in particular when M ZAMS ≳ Mn). As a consequence, stars of initial mass above M n may experience somewhat higher core growth rates on an initially massive core (close to M Ch) and then explode as EC-SNe. Between 6 and 8 M⊙ the absence of thermal pulses combined with a weak mass-loss rate allows the ONe core to reach the critical value of 1.37 M⊙ for an EC-SN.
In any case, the uncertainties in mass-loss rates at these metallicities are such that some exploration of different rates is required. A simple but useful way of doing this is the approach by Siess (Reference Siess2007). This author defined the ζ parameter, the ratio of the average envelope mass-loss rates (Ṁ env) to average effective core growth rates (Ṁ core) during the thermally pulsing Super-AGB phase, i.e.  $\zeta = \left| {\frac{{\langle {{\dot M}_{{\text{env}}}}\rangle }}{{\langle {{\dot M}_{{\text{core}}}}\rangle }}} \right|$. He demonstrated that the values of the critical masses M n and M mas depend only on this parameter and the core mass at the beginning of the thermally pulsing Super-AGB phase. According to the detailed calculations by Gil-Pons et al. (Reference Gil-Pons, Doherty, Lau, Campbell, Suda, Guilani, Gutiérrez and Lattanzio2013) for Z = 10−5, ζ ≈ 73, 75, and 220 for M ZAMS = 7, 8, and 9 M⊙, respectively. The latter value is considerably larger due to the high efficiency of the dredge-out in increasing envelope metallicity and ultimately driving high mass-loss rates. As a reference, considering a typical average core growth rate about 10−7 M⊙ yr−1, values of ζ ≈ 75 and ζ ≈ 220 would correspond to an average mass-loss rate of 7.5 × 10⁻⁶ M⊙ yr−1 and 2.2 × 10⁻⁵ M⊙ yr−1, respectively.
The evolution of M n and M mas as a function of ζ for the primordial and Z = 10−5 cases is illustrated in Figure 12. The interval of initial ZAMS mass that leads to the formation of EC-SNe in the primordial case ranges between 1.4 M⊙ for ζ = 50 (very slow winds) and 0.2 M⊙ for ζ ≳ 150. For the Z = 10−5 models we get wider ZAMS mass ranges, between 2 M⊙ for ζ = 50 and 0.25 M⊙ for ζ ≳ 200. These intervals are similar (although shifted to somewhat lower initial masses) to the ones obtained by Siess (Reference Siess2007). It is important to recall that uncertainties related to the treatment of convective boundaries and mass-loss rates affect the width of the M ZAMS interval for the formation of EC-SNe, regardless of their initial metallicity. We refer the interested reader to Jones et al. (Reference Jones2013) and Doherty et al. (Reference Doherty, Gil-Pons, Siess and Lattanzio2017) for analyses of these effects.
Lower panel: masses of the ONe degenerate cores versus ZAMS masses at the beginning of the thermally pulsing Super-AGB phase for the primordial and Z = 10−5 cases. Siess (Reference Siess2007) results for M n and M mas at Z = 10−5 are shown in black solid and dashed lines, respectively. Upper panels: expected fate versus initial mass for different values of the parameter 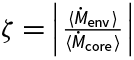 $\zeta = \left| {\frac{{\langle {{\dot M}_{{\text{env}}}}\rangle }}{{\langle {{\dot M}_{{\text{core}}}}\rangle }}} \right|$ for the primordial cases (left) and the Z = 10−5 cases (right).
6. Observations of EMP stars
Uncertainties in nucleosynthetic yields of the most metal-poor stars derive from the unknowns in their evolution which we described in Section 4, and from the difficulties in obtaining observational constraints, at least by comparison with higher metallicity stars. The sample of observed objects at the most metal-poor regime has increased significantly in the last decade. Currently about 500 stars have been detected with [Fe/H]≤ −3. However, the interpretation of these observations is hampered by the need of considering a number of unconfirmed hypotheses in terms of the nature and IMF of ancient stars, of the chemodynamical evolution of the early universe and, as discussed here, in terms of stellar evolution and nucleosynthesis.
Observational information relevant for the understanding of the most metal-poor stars can be gathered from different sources. Galactic archaeology (Freeman & Bland-Hawthorn Reference Freeman and Bland-Hawthorn2002; Cohen et al. Reference Cohen, Christlieb, Beers, Gratton and Carretta2002; Carretta et al. Reference Carretta, Gratton, Cohen, Beers and Christlieb2002) aims to understand the formation and evolution of the Milky Way through systematic study of its stellar populations. Dwarf galaxy archaeology aims for the same goal by considering stellar populations within dwarf galaxies (Frebel & Bromm Reference Frebel and Bromm2012). In both cases the associated stellar database is a treasure trove for understanding the stellar populations themselves, in addition to using them as tools for understanding galaxies. Finally, far-field cosmology of damped Lyα systems provides us with additional information from the high-redshift universe (Cooke & Madau Reference Cooke and Madau2014). Stars with [Fe / H] ≲ −3 (EMP stars) are indeed uncommon and become very rare at the lowest metallicities. Despite the continuous observational efforts made in the last decades, only ∼10 stars are known to have [Fe/H] ≲−4.5, including the latest discoveries of stars with [Fe/H] < ≲5 [see Bonifacio et al. (Reference Bonifacio2018) and Aguado et al. (Reference Aguado, Allende Prieto, González Hernández and Rebolo2018)]. These efforts continue (see Section 1) and will probably provide us with further data down to [Ca/H] about −9.4 (Frebel & Norris Reference Frebel and Norris2015). This value represents the detectability threshold of the CaIIK line, which is the proxy for Fe when it cannot be detected because of its low abundance. The exclusive group of EMP stars display a number of interesting peculiarities. We refer to the recent review by Frebel & Norris (Reference Frebel and Norris2015) for a detailed description of observational data for EMP stars, and here we provide a summary of some of the most salient features. Among these features we find that:
a) EMP stars display a statistically significant abundance scatter (Matsuno et al. Reference Matsuno, Aoki, Beers, Lee and Honda2017). This scatter is larger at the lowest observed [Fe/H].
b) EMP stars display different kinematic and chemical properties depending on whether they belong to the inner or to the outer Galactic Halo (Carollo et al. Reference Carollo2007; Carollo et al. Reference Carollo2012; Lee et al. Reference Lee, Beers, Kim, Placco, Yoon, Carollo, Masseron and Jung2017). The outer Halo has a lower [Fe/H] population than the inner one. The most metal-poor stars of the Galactic bulge also present peculiar characteristics, in particular lower C enrichments than halo components (Howes et al. Reference Howes2015).
c) The Spite Plateau (Spite & Spite Reference Spite and Spite1982), that is, the practically constant Li abundance value (A(Li)=2.05 ± 0.16) measured in warm metal-poor stars, was initially assumed to be representative of the Li produced during Big-Bang nucleosynthesis. This hypothesis had to be discarded mainly for two reasons. First, Big-Bang nucleosynthesis calculations yield Li abundances about 0.4 dex above the Spite Plateau. Second, the Plateau fails at metallicities [Fe/H] ≲ −2.8. Below this value Li abundances show a wide scatter in which the characteristic value of the Spite Plateau becomes just an upper threshold (Ryan et al. Reference Ryan, Beers, Deliyannis and Thorburn1996; Ryan, Norris, & Beers Reference Ryan, Norris and Beers1999; Boesgaard, Stephens, & Deliyannis Reference Boesgaard, Stephens and Deliyannis2005; Asplund et al. Reference Asplund, Lambert, Nissen, Primas and Smith2006; Bonifacio et al. Reference Bonifacio2007; Aoki et al. Reference Aoki, Barklem, Beers, Christlieb, Inoue, García Pérez, Norris and Carollo2009).
d) There is a high occurrence of C-enriched objects, increasingly higher at the lowest metallicities.Footnote h About 30% of stars below [Fe/H] ∼ −3 are C enriched, and this proportion goes up to about 80% for [Fe / H] ≲ −4 (Cohen et al. Reference Cohen2005; Frebel et al. Reference Frebel2005; Lucatello et al. Reference Lucatello, Beers, Christlieb, Barklem, Rossi, Marsteller, Sivarani and Lee2006; Yong et al. Reference Yong2013b; Placco et al. Reference Placco, Frebel, Beers and Stancliffe2014). Their abundance pattern motivated the use of the specific terminology C-enhanced EMP or CEMP stars to refer to them (Beers & Christlieb Reference Beers and Christlieb2005). CEMP stars are further subdivided into CEMP-s (with [Ba/Fe] > 0), CEMP-r (with [Eu/Fe] > 0), CEMP-r/s or CEMP-i, as discussed below (with [Ba/Fe]>0 and [Eu/Fe] > 0), and CEMP-no (neither s- nor r-enriched).
e) CEMP-s stars are very frequent at metallicities −3 ≲ [Fe / H] ≲ −2, but become rarer below these values (Aoki et al. Reference Aoki, Beers, Christlieb, Norris, Ryan and Tsangarides2007)Footnote i Currently the lowest metallicity for CEMP-s stars, discovered by Matsuno et al. (Reference Matsuno, Aoki, Beers, Lee and Honda2017), is around [Fe/H] = ≲3.6.
f) CEMP-no stars seem to show higher O enhancements than CEMP-s stars, and the N content shows a bimodal distribution with two distinct groups characterised by a high and low N enrichment (Frebel & Norris Reference Frebel and Norris2015). There might be a correlation between 12C/13C and [C/N] in CEMP-no stars (Norris et al. Reference Norris2013).
g) In contrast to C-normal stars, CEMP-no stars display large spreads (∼2 dex) in light elements (Na, Mg, and Al). They also show a moderate spread in Si, while the spread is small in heavier elements such as Ti and Ca [see Aoki et al. (Reference Aoki, Matsuno, Honda, Ishigaki, Li, Suda and Bharat Kummar2018) and references therein].
h) NEMP stars are N-enhanced EMP stars (Izzard et al. Reference Izzard, Glebbeek, Stancliffe and Pols2009; Pols et al. Reference Pols, Izzard, Stancliffe and Glebbeek2012), such that [N/Fe] > 1 and [N/C] > 0.5. They appear to be more frequent at [Fe/H]≲ −2.8.
i) EMP stars tend to be α-enhanced, that is with enrichment in 16O, 20Ne, 24Mg, 28Si, etc. up to 40Ca and 48Ti. Note that 48Ti is technically an Fe-peak element, although it behaves like an α element in metal-poor stars (Yong et al. Reference Yong2013b).
j) Finally, it should also be noted that there are a number of EMP stars which do not seem to fit in any of the groups mentioned above (Cohen et al. Reference Cohen, Christlieb, Thompson, McWilliam, Shectman, Reimers, Wisotzki and Kirby2013).
7. Nucleosynthesis in EMP stars
Observations of EMP stars help us constrain our knowledge of the primitive universe and, in particular, the IMF of the first stars, the characteristics of their evolution, their final fates, and their nucleosynthetic yields. In this section we review our current knowledge of EMP nucleosynthesis and relate this information to the observational features described in Section 6. Ultimately, our goal is to understand which observed features of EMP stars may be explained with different stellar models, considering their nucleosynthetic yields and their final fates.
Before we describe the nucleosynthetic signatures of the oldest intermediate-mass stars, we should recall that massive stars are still preferred by many authors as the main, and perhaps the only, genuine ‘first stars’, and thus the first and only polluters of the most primitive universe. All primordial massive star models and, especially, hypernovae (Nakamura et al. Reference Nakamura, Umeda, Iwamoto, Nomoto, Hashimoto, Hix and Thielemann2001b; Nomoto et al. Reference Nomoto, Maeda, Umeda, Nakamura and Vanbeveren2001; Umeda et al. Reference Umeda, Tominaga, Maeda and Nomoto2005) provide the high α enhancements observed in many EMP stars (item i in Section 6) and yield relative Fe-peak element abundances in good agreement with many observed EMP stars. Faint SNe experience extensive fallback of the ejecta and re-accretion onto a central black hole. The part of the ejecta that is not re-accreted (the actual nucleosynthetic yields) is characterised by large [C/Fe] and [Al/Fe] compared to the yields from SNe which do not experience significant fallback (Bonifacio et al. Reference Bonifacio, Limongi and Chieffi2003; Limongi et al. Reference Limongi, Chieffi and Bonifacio2003; Umeda & Nomoto Reference Umeda and Nomoto2003; Umeda & Nomoto Reference Umeda and Nomoto2005; Tominaga et al. Reference Tominaga, Iwamoto and Nomoto2014). These yields are consistent with the abundances of some observed CEMP-no stars (items d, f, and g of Section 6).
Spinstars or fast rotating massive stars were probably frequent among low-Z objects because of their compactness. As a consequence of enhanced mixing due to rotation, they produce large amounts of primary 13C, 14N, and 22Ne (Meynet & Maeder Reference Meynet and Maeder2005; Meynet Reference Meynet2007; Hirschi Reference Hirschi2007; Ekström et al. Reference Ekström, Meynet, Chiappini, Hirschi and Maeder2008; Cescutti et al. Reference Cescutti, Chiappini, Hirschi, Meynet and Frischknecht2013) and have been proposed as promising candidates to explore the trend of increasing N/O at lower metallicities in EMP stars (item h of Section 6). Rotating massive star models have even been proposed as sites for the formation of s-process elements [see e.g. Frischknecht et al. (Reference Frischknecht2016) and references therein]. For a detailed review of yields from massive stars, the interested reader is referred to Nomoto, Kobayashi, & Tominaga (Reference Nomoto, Kobayashi and Tominaga2013).
The possible contribution of an early population of intermediate-mass stars to the chemical evolution of the ancient universe was addressed by Vangioni et al. (Reference Vangioni, Silk, Olive and Fields2011). Based on comparisons between theoretical yields and observations, these authors concluded that the influence of intermediate-mass metal-poor stars would probably be restricted to a limited fraction of the total baryon content of the universe. However their use of yields [from van den Hoek & Groenewegen (Reference van den Hoek and Groenewegen1997)] for relatively high metallicities of Z ≳ 0.001 neglects the nucleosynthetic peculiarities of the most metal-poor stars Z ≲ 10−6, as described later in this section. This suggests that an account of more recent low-Z data is required. Besides considering the contribution to the baryon inventory, it would be interesting to consider timescales for chemical enrichment by intermediate-mass stars provided by galactic chemical evolution models. However, the lack of consistent detailed yields for these intermediate-mass models at the lowest metallicity regimes also limits the assessment of their contribution which we can derive from chemical evolution models.
The scatter in metal abundances at the lowest [Fe/H] stars mentioned in item a of Section 6 can be interpreted in terms of differences in the environment where the oldest stars formed. These environments were primitive gas clouds only polluted by one or a few stars, which might have different masses in different clouds and, therefore, experienced different nucleosynthetic processes [see, e.g., Bonifacio et al. (Reference Bonifacio, Limongi and Chieffi2003) and Limongi et al. (Reference Limongi, Chieffi and Bonifacio2003)]. Item b is telling us about the complexity of structure formation in the Milky Way. Items c and j are some of the strongest evidences of our incomplete knowledge of the physics of stars (at the lowest Z regime). We now describe relevant nucleosynthetic sites in low-Z and intermediate-mass stars, and try to explain the remaining items of Section 6.
7.1. Dual flash/C-ingestion nucleosynthesis
The evolution through core and shell flashes and proton ingestion was briefly summarised in Sections 3.2 and 3.3. These mixing events occur in EMP models of initial mass M ZAMS ≲ 4 M⊙, at different locations inside the star and at different evolutionary stages, depending on the initial mass and metallicity. They all involve the entrainment of proton-rich matter into a He-burning convective region. Stellar models [see, e.g., Fujimoto et al. (Reference Fujimoto, Ikeda and Iben2000), Schlattl et al. (Reference Schlattl, Salaris, Cassisi and Weiss2002), Picardi et al. (Reference Picardi, Chieffi, Limongi, Pisanti, Miele, Mangano and Imbriani2004), Campbell & Lattanzio (Reference Campbell and Lattanzio2008), and Suda & Fujimoto (Reference Suda and Fujimoto2010)] indicate that dual flashes lead to a significant enrichment of the envelope in carbon and nitrogen. The detailed nucleosynthesis associated with this process was studied by Campbell, Lugaro, & Karakas (Reference Karakas2010) and Cruz et al. (Reference Cruz, Serenelli and Weiss2013). Cristallo et al. (Reference Cristallo, Piersanti, Straniero, Gallino, Domínguez and Käppeler2009, Reference Cristallo, Karinkuzhi, Goswami, Piersanti and Gobrecht2016) also analysed PIEs at [Fe/H] = ≲2.85.
As a consequence of a PIE, relatively high amounts of 13C form and lead to a large release of neutrons via the 13C(α,n)16O reaction and to the production of heavy s-elements like Sr, Ba, and Pb. Simultaneously, high amounts of 14N are produced during these PIEs. This isotope acts as a neutron poison via 14N(n, p)14C and may effectively halt s-process nucleosynthesis (Cruz et al. Reference Cruz, Serenelli and Weiss2013).
Neutron-capture nucleosynthesis at the lowest metallicities, although critical, is still incomplete and part of the reason is due to our limited understanding of the physics of these PIEs. Further investigations using multidimensional hydrodynamical models (for instance, as in Stancliffe et al. (Reference Stancliffe, Dearborn, Lattanzio, Heap and Campbell2011), Herwig et al. (Reference Herwig, Pignatari, Woodward, Porter, Rockefeller, Fryer, Bennett and Hirschi2011), Woodward et al. (Reference Woodward, Herwig and Lin2015), and references therein) and considering the effects of convective overshooting, extra-mixing, and rotationally induced mixing should be carried out. Observationally, many CEMP stars show s-process enrichment (i.e. they are class CEMP-s, see items d and e in Section 6). We have seen that a significant number of objects show both r- and s-enrichment (CEMP-r/s) stars (see Section 7). This is puzzling because r- and s-processes are supposed to occur in very different nucleosynthetic sites. The intermediate i-process (Cowan & Rose Reference Cowan and Rose1977), occurring at neutron density regimes between the s- and the r-process might be a key to interpreting CEMP-r/s [see Abate, Stancliffe, & Liu (Reference Abate, Stancliffe and Liu2016), and references therein, for different scenarios for the formation of CEMP-r/s stars]. A good understanding of the i-process and the interpretation of surface abundances of CEMP-r/s stars probably involves the necessity of 3D hydrodynamical codes to properly account for the transport of processed matter (Dardelet et al. Reference Dardelet2014). Nevertheless, some interesting results concerning i-process nucleosynthesis were presented by Hampel et al. (Reference Hampel, Stancliffe, Lugaro and Meyer2016). They performed detailed nucleosynthesis for high neutron densities characteristic of PIEs in CEMP stars. Although their analysis was not self-consistent, in the sense that it did not involve evolutionary model calculations, these authors found a remarkable agreement between their parametric i-process calculations and the abundances of CEMP-r/s stars, even suggesting that they be called CEMP-i stars in future.
7.2. Nucleosynthesis in models leading to SN I1/2
We have seen in Sections 3 and 5 that some intermediate-mass stars (4 M⊙ ≲ M ZAMS ≲ 7 M⊙) of initial metallicity Z ZAMS ≲ 10−8 experience weak envelope pollution and might end their lives as SNe I1/2.
In the absence of significant mass ejection prior to the SN explosion, and if thermal pulses do not re-ignite (Lau et al. Reference Lau, Stancliffe and Tout2008), one expects the yields of these stars to be very similar to those of thermonuclear SNe Ia (Tsujimoto & Shigeyama Reference Tsujimoto and Shigeyama2006) with a contribution from HBB nucleosynthesis. Explosive nucleosynthesis would lead to large amounts of 56Ni and other Fe-peak elements, with ratios similar to those of a standard SN Ia (Nomoto, Thielemann, & Yokoi Reference Nomoto, Thielemann and Yokoi1984; Nomoto et al. Reference Nomoto, Kobayashi and Tominaga2013). Nucleosynthesis above the CO core after the SN explosion does not seem likely, because, by analogy with SNe Ia, the combustion flame is expected to be extinguished before it reaches the H-rich envelope, and thus explosive nucleosynthesis would remain confined to the core. As in SNe Ia, explosive nucleosynthetic yields of SNe I1/2 will be significantly affected by the details of the explosion mechanism [see e.g. Mazzali et al. (Reference Mazzali, Röpke, Benetti and Hillebrandt2007) and references therein]. It is also important to note the presence of high amounts of H from the relatively massive envelope existing at the moment of the explosion would also be present in the SN I1/2 spectrum, and thus make it more similar to that of type-II SN in this respect.
The relevance of HBB nucleosynthesis is model dependent. The primordial 5 and 7 M⊙ stars from Lau et al. (Reference Lau, Stancliffe and Tout2008) showed a relatively mild HBB, leading to X surf(14N) / X surf(12C)∼ 5 at the end of thermal pulses, whereas the same models computed with overshooting led to X surf(14N) / X surf(12C)∼ 100 at the end of calculations (Lau et al. Reference Lau, Stancliffe and Tout2009). The surface abundances of the primordial 4 M⊙ model in Figure 9 do not show any effect of HBB until after the cessation of thermal pulses. However, when this process occurs, it develops as a very hot HBB. The nucleosynthetic signatures of such extreme HBB are primarily a large production of He but also 12,13C, 14N, and even of some O isotopes. Additionally, although no s-process elements are dredged up during the AGB phase of these stars, they are produced in the intershell (via 22Ne neutron source). The products processed during pre-SN evolution could either be expelled in the SN I1/2 explosion, adding to the ISM inventory of s-process elements, or destroyed during the explosion itself. Detailed calculations should be performed in order to obtain the detailed nucleosynthetic yields.
SN I1/2 in binary systems have been suggested as possible candidates to explain CEMP-r/s stars (item d of Section 6) by several authors (Zijlstra Reference Zijlstra2004; Wanajo et al. Reference Wanajo, Nomoto, Iwamoto, Ishimaru and Beers2006; Abate et al. Reference Abate, Stancliffe and Liu2016) but these progenitors present a number of problems, e.g. population synthesis studies do not reproduce the observed proportion of CEMP-s to CEMP-r/s stars (Abate et al. Reference Abate, Stancliffe and Liu2016). It should also be noted that many authors consider that the SN I1/2 explosion would destroy the progenitor (Nomoto Reference Nomoto1987), so the resulting CEMP stars would not be detected as binaries. However, Hansen et al. (Reference Hansen, Andersen, Nordström, Beers, Placco, Yoon and Buchhave2016b) showed the existence of single CEMP-s stars and the occurrence of single CEMP-r/s cannot be discarded.
7.3. Nucleosynthesis in EMP stars undergoing ‘normal’ thermally pulsing AGB and Super-AGB evolution
Intermediate-mass primordial models which implement some overshooting below the envelope allow for more or less efficient third dredge-up, envelope pollution, and stellar winds (Chieffi et al. Reference Chieffi, Domínguez, Limongi and Straniero2001; Siess et al. Reference Siess, Livio and Lattanzio2002). The efficiency of the third dredge-up process thus has a strong impact on the yields, and the dependence on the stellar mass was studied by Gil-Pons et al. (Reference Gil-Pons, Doherty, Lau, Campbell, Suda, Guilani, Gutiérrez and Lattanzio2013) in their Z = 10−5 models. These authors, who use the search for neutrality approach to determine the convective boundaries (Frost & Lattanzio Reference Frost and Lattanzio1996), obtain high values of the dredge-up parameter λ Footnote j for model stars up to 7 M⊙, for which λ = 0.78. This value decreases with the stellar mass (λ = 0.48 for the 8 M⊙ model) and becomes very small (λ = 0.05) for the 9 M⊙ model. Together with a thorough analysis of the evolution, Gil-Pons et al. (Reference Gil-Pons, Doherty, Lau, Campbell, Suda, Guilani, Gutiérrez and Lattanzio2013) presented a limited set of nucleosynthetic yields for stars between 4 and 9 M⊙, including 1H, 4He, 12C, 14N, 16O, and Zother, representing all the isotopes beyond 16O.
The nucleosynthetic yields of intermediate-mass and massive stars were computed by Chieffi et al. (Reference Chieffi, Domínguez, Limongi and Straniero2001) and Limongi, Straniero, & Chieffi (Reference Limongi, Straniero and Chieffi2000), respectively. Abia et al. (Reference Abia, Domínguez, Straniero, Limongi, Chieffi and Isern2001) used these existing yields to assess the contribution of intermediate-mass and massive stars to the the pollution of the early intergalactic medium. Campbell & Lattanzio (Reference Campbell and Lattanzio2008) also presented yields of primordial and very low-metallicity stars in the low- and intermediate-mass range, although only up to 3 M⊙. Primordial star yields in the intermediate-mass range are strongly affected by the unknowns in mass-loss rates and dredge-up efficiency during the thermally pulsing AGB phase. Therefore, a detailed study of the effects of different input physics, not only for primordial compositions but also up to initial metallicity Z = 10−5, is badly needed.
Nevertheless, we can attempt to draw some conclusions from the existing literature. As we may expect from the results for primordial stars of M ZAMS ≳ 3 M⊙ that have experienced efficient envelope pollution, the models of 3 M⊙≲ M ZAMS≲ 7 M⊙ by Chieffi et al. (Reference Chieffi, Domínguez, Limongi and Straniero2001) and Siess et al. (Reference Siess, Livio and Lattanzio2002) show efficient HBB. In general, models that experience HBB display an increase in their surface abundances of 4He and 14N at the expense of 12C. However, the very high temperature at which HBB is operating in massive AGB and Super-AGB stars leads to a slight production of 12C. This is also seen in more metal-rich Super-AGB stars of Siess (Reference Siess2010) that do not experience third dredge-up. Besides, 23Na is processed at the expense of 22Ne, and 26Al from 25Mg. The 7Li produced during HBB would be quickly destroyed and thus its contribution to yields would be negligible (Abia et al. Reference Abia, Domínguez, Straniero, Limongi, Chieffi and Isern2001; Siess et al. Reference Siess, Livio and Lattanzio2002). Depending on the efficiency of the third dredge-up, the surface 12C can be strongly affected [see e.g. Doherty et al. (Reference Doherty, Gil-Pons, Lau, Lattanzio, Siess and Campbell2014b)].
Siess & Goriely (Reference Siess and Goriely2003) analysed s-process nucleosynthesis in a primordial 3 M⊙ star. They found that the neutrons released from the 13C(α, n)16O reaction would be captured by isotopes between C and Ne. The heavier species synthesised would then act as seeds to form s-process elements. Once transported to the surface by third dredge-up, these stars are expected to display Pb and Bi enhancements [see also Suda, Yamada, & Fujimoto (Reference Suda, Yamada, Fujimoto, Kubono, Kajino, Nishimura, Isobe, Nagataki, Shima and Takeda2017a)]. Cruz et al. (Reference Cruz, Serenelli and Weiss2013) also computed and analysed s-process nucleosynthesis in 1 M⊙ stars between primordial and Z = 10−7. They emphasised the effects of input physics uncertainties on their yields.
We now illustrate the detailed nucleosynthesis of Z = 10−5 models by showing results computed with monstar and the post-processing nucleosynthesis programme monsoon, e.g. Doherty et al. (Reference Doherty, Gil-Pons, Lau, Lattanzio and Siess2014a). Figure 13 shows a 7 M⊙ model (Gil-Pons et al. 2018, in preparation). The effects of HBB (the average temperature of the base of the convective envelope during the thermally pulsing Super-AGB phase is 114 × 106K) can be seen in the increase in 14N, 13C, and 17O and, to a lesser extent, in 21Ne and 26Mg, together with a decrease of 15N. The onset of the Mg–Al chains results in the depletion of most 24Mg and an increase in 26Al, which at high temperatures captures a proton to give 27Al (Siess & Arnould Reference Siess and Arnould2008), and subsequently 28Si (Ventura, Carini, & D’Antona Reference Ventura, Carini and D’Antona2011). Some of the effects of HBB are suppressed by efficient third dredge-up, which replenishes 12C after each pulse. α captures on 12C in the intershell convective region and subsequent third dredge-up produce surface enhancements in 16O, 20Ne, and 24Mg while 28Si production is mainly due to proton-capture reactions and a leakage from the Mg–Al chain. It is also important to note the 22Ne enhancement, because the occurrence of the 22Ne(α, n)25Mg reaction may be an important source of neutrons and, consequently, relevant for s-process nucleosynthesis in massive AGB and Super-AGB stars.
Evolution of the surface abundances of some selected isotopes for a 7 M⊙ model with Z = 10−5 computed with monstar and monsoon (see text for details).
It has been reported that stars with Z ZAMS ≤ 10−4 and masses above 8 M⊙ experience high envelope pollution caused by corrosive second dredge-up (Gil-Pons et al. Reference Gil-Pons, Doherty, Lau, Campbell, Suda, Guilani, Gutiérrez and Lattanzio2013; Doherty et al. Reference Doherty, Gil-Pons, Lau, Lattanzio, Siess and Campbell2014b). The large amount of 12C dredged up during this event increases the molecular opacities in the envelope and then drives stellar winds similar to those of a higher Z object. These low-Z Super-AGB stars also present very efficient HBB, but their low third dredge-up efficiency together with the thinness of the intershell regions hampers the possibility of a strong s-enhancement in models with M ZAMS ≳ 8 M⊙. Their nucleosynthesis is similar to that of their slightly lower mass HBB counterparts. The yields of all the models computed by Gil-Pons et al. (Reference Gil-Pons, Doherty, Lau, Campbell, Suda, Guilani, Gutiérrez and Lattanzio2013) and, in particular, for their 8 and 9 M⊙ models have [C/Fe] ≥ 2. If this feature is maintained at the lowest metallicities (Z < 10−5), 8–9 M⊙ stars of the first (few?) generation(s) would then have the same properties as some CEMP-no stars, making them potential progenitor candidates. According to the present IMF this mass range does not account for a significant number of stars, but given that the primitive IMF might be biased to higher masses, their contribution might be relevant. These models might also help to explain some NEMP stars, described in item h of Section 6, as polluters of the gas clouds in which they formed.
Meynet & Maeder (Reference Meynet and Maeder2002) investigated the evolution of rotating Z = 10−5 models and obtained high 12C and 14N surface enrichments in their intermediate-mass stars. However, these authors only computed a few thermal pulses and therefore no complete nucleosynthetic yields were provided.
The most massive Super-AGB stars, which experience a dredge-out process, have been suggested as a site for the formation of neutron-capture elements and, in particular, for the occurrence of the i-process (Petermann et al. Reference Petermann, Doherty, Lugaro, Campbell, Lau and Stancliffe2014; Doherty et al. Reference Doherty, Gil-Pons, Siess, Lattanzio and Lau2015; Jones et al. Reference Jones, Ritter, Herwig, Fryer, Pignatari, Bertolli and Paxton2016). This intriguing hypothesis is still to be demonstrated and carefully analysed, probably requiring 3D hydrodynamical techniques.
The low- and intermediate-mass EMP stars considered in this section are also likely to have a binary companion. Actually binarity has been a key to some of the most successful scenarios to interpret EMP stars [see, e.g., Starkenburg et al. (Reference Starkenburg, Shetrone, McConnachie and Venn2014) and references therein]. If a star undergoing a dual flash, or simply third dredge-up of s-process elements, is the primary component (initially the more massive star) of an interacting binary system, then the s-process elements synthetised by the primary can be transferred to its companion. If such a companion has a mass M ZAMS about 0.8 M⊙, it can survive to the present day and be detected as a CEMP-s star, as referred to in items d and e. Note that high amounts of C are expected to be dredged up, together with the s-process elements. This binary scenario for the formation of CEMP stars [e.g. Suda et al. (Reference Suda, Aikawa, Machida, Fujimoto and Iben2004)] was in agreement with the radial velocity data of CEMP-s stars, which was consistent with all of them being members of binary systems (Lucatello et al. Reference Lucatello, Tsangarides, Beers, Carretta, Gratton and Ryan2005; Starkenburg et al. Reference Starkenburg, Shetrone, McConnachie and Venn2014). However, updated results of radial velocity monitoring of CEMP stars show that not all CEMP-s stars are in binary systems (Hansen et al. Reference Hansen, Andersen, Nordström, Beers, Placco, Yoon and Buchhave2016b), although the percentage of CEMP-s in binaries is still considerably higher than in normal metal-poor stars.
7.4. Cautionary remarks
One should be cautious when interpreting EMP abundances using nucleosynthetic yields of model stars. To begin with, if the observed object is a giant, it may have undergone internal pollution as a consequence of evolutionary processes. Additionally, even dwarf stars may experience mixing processes such as thermohaline mixing (Stancliffe et al. Reference Stancliffe, Dearborn, Lattanzio, Heap and Campbell2011), gravitational settling (Richard,Michaud, & Richer Reference Richard, Michaud and Richer2002; MacDonald et al. Reference MacDonald, Lawlor, Anilmis and Rufo2013), radiative levitation (Matrozis & Stancliffe Reference Matrozis and Stancliffe2016), mixing induced by rotation or gravity waves (e.g. Talon Reference Talon, Charbonnel and Zahn2008), or accretion from the ISM (Yoshii Reference Yoshii1981; Iben Reference Iben1983; Komiya et al. Reference Komiya, Suda and Fujimoto2015). All these processes may alter surface abundances after accretion from a more evolved companion star and must be disentangled if we are to understand the stellar nucleosynthesis.
The problem of interpreting the abundances of individual EMP stars is complicated because some of these stars may originate from a second stellar generation. This second generation probably formed in mini-halos [see e.g. Schneider et al. (Reference Schneider, Omukai, Bianchi and Valiante2012); Chiaki Yoshida, & Kitayama (Reference Chiaki, Yoshida and Kitayama2013); Ji, Frebel, & Bromm (Reference Ji, Frebel and Bromm2015)], as we think Pop III stars did, in a cloud polluted by gas from a few SN explosions, which was partially retained and partially ejected from the mini-halo. Some of the ejected gas could have been re-accreted and then mixed with original pristine gas and matter from nearby SNe. Therefore nucleosynthetic yield information should be complemented with chemical evolution models that take into account mixing and turbulence (Ritter et al. Reference Ritter, Sluder, Safranek-Shrader, Milosavljević and Bromm2015).
8. Summary and discussion
8.1. Summary
The birth, evolution, fate, and nucleosynthetic yields of the first generations of stars remain, in many senses, enigmatic. We have seen that the solution to this puzzle is hampered by the specific computational problems that plague the evolution of the most metal-poor stars (such as violent thermonuclear runaways, thousands of thermal pulses, or unexpected instabilities), by the high sensitivity of results to the details of very uncertain input physics (in particular to opacities, mass-loss rates, convection and mixing, as well as some key nuclear reaction rates), and by the difficulties in obtaining constraints from observational data.
The occurrence of primordial low- and intermediate-mass stars, strongly debated during the last few decades, is supported by recent high resolution 3D hydrodynamical calculations of primordial star formation. In terms of the final fates of intermediate-mass stars, different authors agree (except for the precise mass threshold) that primordial to Z ∼ 10−7 stars of initial mass M ZAMS ≲ 4 M⊙ experience efficient mixing episodes (Campbell & Lattanzio Reference Campbell and Lattanzio2008; Lau et al. Reference Lau, Stancliffe and Tout2009; Suda & Fujimoto Reference Suda and Fujimoto2010; and references therein), either prior to or during the first pulses of their thermally pulsing AGB phase. These processes enrich the stellar envelopes in metals and permit later evolution to take place in a way that is very similar to that of higher Z stars. Thus we expect these stars to form white dwarfs. In the low-metallicity range considered in this review, the same fate is expected for stars in the mass range 8 M⊙ ≲ M ZAMS ≲ 9.5 M⊙. On the other hand, the fate of Z ≲ 10−7 stars between ∼ 4 and ∼ 7 M⊙ is more intriguing, and whether they end as white dwarfs or SNe strongly depends on the choice of input physics. The use of different algorithms to determine convective boundaries may lead to the occurrence of SNe I1/2 (Gil-Pons, Gutierrez, & Garcia-Berro Reference Gil-Pons, Gutierrez, Garcia-Berro, O’shea and Heger2008; Lau, Stancliffe, & Tout Reference Lau, Stancliffe and Tout2008), whereas the inclusion of overshooting would probably lead to the formation of white dwarfs (Chieffi et al. Reference Chieffi, Domínguez, Limongi and Straniero2001; Siess et al. Reference Siess, Livio and Lattanzio2002). We find that the mass range for EC-SNe is relatively narrow, of the order of ∼0.2 M⊙ between ∼9.2−9.5 M⊙ and ∼9.7−9.9 M⊙ for the Z = 10−5 and primordial cases, respectively.
The nature, evolution, and fate of models of ancient stars must be tested by comparing nucleosynthetic yields with observations of the most metal-poor objects. The sample of metal-poor stars has significantly increased during the last decade, but the interpretation of the surface abundances remains difficult because of internal mixing processes, potential pollution by the ISM, and because the chemodynamical evolution of their parental clouds is not well understood. Many observational features may be reproduced by rotating massive stars (Maeder & Meynet Reference Maeder and Meynet2015) and SN models (Umeda & Nomoto Reference Umeda and Nomoto2003; Tominaga et al. Reference Tominaga, Iwamoto and Nomoto2014) or by low- and intermediate-mass models in binary stars (Suda et al. Reference Suda, Aikawa, Machida, Fujimoto and Iben2004). Traditionally, CEMP-no stars were interpreted as second-generation stars formed from a mixture of pristine material and ejecta from massive Pop III stars, while the CEMP-s stars were thought of as the low-mass primordial (or second generation) companion of an intermediate-mass star that went through its thermally pulsing AGB phase and then polluted its low-mass partner with s-elements. We show in this work that primordial intermediate-mass model stars might also help to explain some cases of the heterogeneous CEMP-no group, and that massive star models including rotation may account for some s-process enhancement (Cescutti et al. Reference Cescutti, Chiappini, Hirschi, Meynet and Frischknecht2013; Frischknecht et al. Reference Frischknecht2016; Choplin et al. Reference Choplin, Hirschi, Meynet and Ekström2017), and thus for the formation of some CEMP-s stars. The present classification of observations, albeit useful, might mask the nucleosynthetic contributions of stars over a continuous mass and metallicity range.
Finally, it is important to note that the relatively restricted sample of observed EMP stars is not the only limitation. An understanding of the existing observational results will probably remain incomplete until modelling the entire evolution of intermediate-mass EMP stars with reasonably precise input physics is possible.
8.2. Present open questions
In spite of the wealth of interesting results obtained during the last decades, both from the theoretical and the observational point of view, many questions related to EMP stars remain unanswered.
i) Do low- and intermediate-mass stars exist at all Z, or is there a critical metallicity below which they cannot form? If such a limit exists, it is important to know if its value is closer to 10−8 or 10−6. Stars born with the former metallicity behave similarly to primordial objects and, for instance, might allow the formation of SNe I1/2, whereas the general behaviour of Z = 10−6 objects more resembles that of ‘normal’ metallicity stars, at least in terms of their final fates.
ii) Did SNe I1/2 ever explode? If they have existed there might be interesting observational consequences. They would synthesise large amounts of Fe-peak elements and thus might provide a substantial increase in the injection of Fe-group elements much earlier than that provided by SN Ia explosions. The problem is that early Fe should also be significantly produced in primordial hypernovae, and thus the actual origin of this element in the primitive universe will not be easy to disentangle, unless additional isotopes of intermediate-mass and heavy metals are considered. Stars which are simultaneously very old and relatively metal-rich might be detected by using asteroseismology techniques applied to Galactic archeology, as proposed by Miglio et al. (Reference Miglio2013). Additionally, Bergemann et al. (Reference Bergemann2016) presented a new method to determine ages of red giant stars, for [Fe/H] ≤ −2. However, it is critical to highlight that the huge uncertainties in models of EMP stars may considerably complicate age determinations. A fruitful application of either age-determination method or, eventually, the assessment of the contribution of SNe I1/2 to the chemical evolution of the universe should, in any case, use detailed nucleosynthetic yields of models leading to these SNe. In relation to possible descendants of SN I1/2, it is interesting to consider stars from the Galactic bulge. According to cosmological models [see, for instance, White & Springel (Reference White, Springel, Weiss, Abel and Hill2000) and Tumlinson (Reference Tumlinson2010)], the Bulge should host the oldest stars in the galaxy. However, observations show that the average metallicity of bulge stars is higher than those from the Halo. Besides, metal-poor stars detected in the bulge present intriguing peculiarities, such as the absence of C enhancement, and large α element scatter (Howes et al. Reference Howes2014, Reference Howes2016). The interpretation of these peculiarities will shed light on our understanding of the oldest stars and, perhaps, on SN I1/2. The latter explosions might actually appear in the high-redshift transient records of new generation telescopes. However, given the relatively low brightness expected for SN I1/2, a more promising possibility might be to look for them among the SNe discovered in gravitational lenses (Quimby et al. Reference Quimby2013; Kelly et al. Reference Kelly2015; Goobar et al. Reference Goobar2017), as brightness magnifications of up to × 2000 have been observed (Kelly et al. Reference Kelly2018). While the SN brightness could be affected by microlensing due to individual objects in the lensing galaxy (Dobler & Keeton Reference Dobler and Keeton2006), their spectra would be unaffected and could become an effective way to classify the observed SNe.
iii) What are the roles of overshooting, extra-mixing processes, and rotation in the evolution of EMP stars? This question is related to item ii, as we have seen that the inclusion of overshooting may avoid the formation of SNe I1/2. Additional mixing induced by rotation might lead to effects similar to those of overshooting.
iv) If low-mass (M ZAMS ≲ 0.8 M⊙) primordial stars ever formed, could they be unambiguously detected? The possibility that Fe-deprived objects might remain as such is another matter of debate. Frebel, Johnson, & Bromm (Reference Frebel, Johnson and Bromm2009) performed kinematical analysis on extensive samples of metal-poor stars and concluded that ISM pollution was practically negligible. If this is the case, the absence of detection of Fe-deprived objects would be a direct consequence of the fact that they do not exist, at least for initial masses M ZAMS ≲ 0.8 M⊙. Tanaka et al. (Reference Tanaka, Chiaki, Tominaga and Susa2017) and Suzuki (Reference Suzuki2018) performed magnetohydrodynamical simulations for stellar winds driven by Alfvén waves and also determined that ISM accretion on primordial low-mass stars should be negligible. On the other hand, Komiya et al. (Reference Komiya, Suda and Fujimoto2015) concluded, on the basis of chemical evolution studies, that accretion from the ISM might lead to primordial envelope pollution values as high as [Fe/H] ∼−5.
v) Could CEMP-no stars form from low- and intermediate-mass objects? CEMP-no stars are traditionally assumed to have formed from a previous generation of massive stars from which they inherited their chemical peculiarities, but doubts have been cast on this hypothesis. Considering the continuity of the [Ba/C] distribution as a function of [Fe/H] in CEMP-s and CEMP-no stars, Abate et al. (Reference Abate, Pols, Izzard and Karakas2015a) and Suda et al. (Reference Suda, Yamada, Fujimoto, Kubono, Kajino, Nishimura, Isobe, Nagataki, Shima and Takeda2017a) suggested that CEMP-s and (some) CEMP-no objects might have a common origin involving binarity. Observational studies that analysed the binary fraction of different subclasses of CEMP stars support this hypothesis (Starkenburg et al. Reference Starkenburg, Shetrone, McConnachie and Venn2014; Hansen et al. Reference Hansen, Andersen, Nordström, Beers, Placco, Yoon and Buchhave2016a). Similar ideas are discussed in terms of carbon abundances in CEMP-no stars. Bonifacio et al. (Reference Bonifacio2015) define two groups of CEMP stars, namely high- and low-carbon band stars. They insist that high-carbon band stars, consisting of almost all the CEMP-s stars and some CEMP-no stars, are in binaries. On the other hand, the classification of CEMP stars by Yoon et al. (Reference Yoon2016) leads to a different conclusion. They consider that the carbon enhancement of CEMP-no stars is intrinsic, due to the enrichment of their natal clouds by high-mass progenitor stars.
vi) Could CEMP-s stars be the offspring of massive stars? The standard scenario for the formation of CEMP-s stars involves a binary. However, recent studies (Hansen et al. Reference Hansen, Andersen, Nordström, Beers, Placco, Yoon and Buchhave2016b) revealed the existence of isolated CEMP-s stars. The fact that massive star models with different rotation rates can reproduce the observed [Sr/Ba] spread in CEMP stars (Cescutti et al. Reference Cescutti, Chiappini, Hirschi, Meynet and Frischknecht2013; Frischknecht et al. Reference Frischknecht2016) provides additional support to this scenario which was recently re-investigated by Choplin et al. (Reference Choplin, Hirschi, Meynet and Ekström2017).
8.3. Future topics of research
Below we discuss some bottlenecks in our understanding of EMP stars, and also areas that may provide promising avenues for further research.
i) As is always the case, a better understanding of convection and, in particular, of convective boundaries is a significant barrier to more reliable models. When dealing with stars at the most metal-poor regimes, we have little insights into how to model convection and its borders. We are forced to extrapolate or adapt the existing observational and theoretical information from higher Z objects, and we must be aware of the possibility (and high probability) of introducing substantial errors. In spite of these uncertainties, there is a reasonable consensus on the evolution and fates of the less massive intermediate-mass objects at the lowest Z. On the other hand, our knowledge of the final fates of the most metal-poor stars (Z ≲ 10−7) of masses between ∼ 4 M⊙ and 8 M⊙ is very poorly constrained. Work is proceeding to improve the physics on the treatment of convection and convective boundaries beyond the Mixing Length Theory (MLT) [see e.g. Arnett et al. (Reference Arnett, Meakin, Viallet, Campbell, Lattanzio and Mocák2015); Campbell et al. (Reference Campbell2016); Arnett & Moravveji (Reference Arnett and Moravveji2017)].
ii) A better understanding of low-temperature opacities and mass-loss rates is crucial. Recent improvements in opacity tables by Lederer & Aringer (Reference Lederer and Aringer2009) and Marigo & Aringer (Reference Marigo and Aringer2009) have been implemented in models and their important consequences in terms of stellar wind enhancements have been reported, for instance, in Constantino et al. (Reference Constantino, Campbell, Gil-Pons and Lattanzio2014). The effects of dust in low-temperature opacities might be even more significant (Tashibu et al. Reference Tashibu, Yasuda and Kozasa2017). Intermediate-mass models with compositions from primordial to Z = 10−7 should be constructed considering these effects, although the high effective temperature and almost pristine composition of these stars suggest that their evolution would be less sensitive to these changes.
iii) The phenomenon of thermal pulses ceasing and then re-starting is not understood and is ripe for investigation. We need a consistent set of calculations with different ‘reasonable’ input physics for these models. The envelope pollution and increase of mass-loss rates associated with the re-onset of thermal pulses might eventually hamper the formation of SNe I1/2.
iv) Many CEMP-s and some CEMP-no stars have a binary companion. Addressing the problem of their evolution, including mass transfer via wind accretion, should also be a priority (Bisterzo et al. Reference Bisterzo, Gallino, Straniero, Cristallo and Käppeler2011; Abate et al. Reference Abate, Pols, Karakas and Izzard2015b).
v) Improvement in our knowledge of the former issues will help us to obtain better evolutionary models and nucleosynthetic yields, including full n-capture nucleosynthesis. Ultimately we want to combine these yields with sophisticated chemical evolution models, in order to get a more realistic approach to the interpretation of EMP abundances (e.g. Ritter et al. Reference Ritter, Sluder, Safranek-Shrader, Milosavljević and Bromm2015; Hirai et al. Reference Hirai, Saitoh, Ishimaru and Wanajo2018). Dwarf galaxies seem to be promising tools because their formation history is not as complicated as that of the Milky Way.
The current revolution in stellar spectroscopy is changing the landscape. The development of very large telescopes, enormous surveys, and machine learning is driving this revolution. These will allow us to get further information from medium resolution data, so that dwarf galaxies can be analysed (Kirby et al. Reference Kirby2015). Komiya, Suda, & Fujimoto (Reference Komiya, Suda and Fujimoto2016) proposed that Pop III stars freed from their massive companions and undergoing an SN explosion could be detected by large-scale giant surveys in the outskirts of the Milky Way. Magg et al. (Reference Magg, Hartwig, Agarwal, Frebel, Glover, Griffen and Klessen2018) also calculated the probability of finding Pop III survivors. Their results were compatible with the absence of detection in the Milky Way, but yielded somewhat more promising results for its dwarf satellites. However only giants are expected to be observed in them, which reduces the detection probability.
The faintness of ancient stars is indeed a challenge for their detection. However, if the end of the lives of some of these stars is marked by SN I1/2 explosions, their luminosity might allow detection with new generation telescopes such as the James Webb Space Telescope [see de Souza et al. (Reference de Souza, Ishida, Whalen, Johnson and Ferrara2014), and references therein]. Detecting and identifying SN I1/2 explosions would provide us with key information about the primordial IMF and the evolution of the most ancient stars.
Acknowledgements
The authors thank George Angelou, Takuma Suda, and the anonymous referees for their useful comments. This work was supported by Spanish MINECO grant AYA2015-71091-P. This work was supported in part by the National Science Foundation under Grant No. PHY-1430152 (JINA Center for the Evolution of the Elements). CD acknowledges support from the Lendulet-2014 Programme of the Hungarian Academy of Sciences. SWC acknowledges federal funding from the Australian Research Council through the Future Fellowship grant entitled Where are the Convective Boundaries in Stars? (FT160100046).