

1. Introduction
The way to the understanding of temperature conditions in large ice masses was opened by Reference RobinRobin’s (1955) discovery of the thermal effects of ice motion, but the complexity of the problem has delayed its complete solution. Most analytical studies had to impose the restriction of steady-state conditions (Reference BogoslovskiyBogoslovskiy, 1958; Reference WexlerWexler, 1959) or to disregard the finite ice thickness and the decrease with depth in the vertical velocity of the ice (Reference RadokRadok, 1959; Reference WexlerWexler, 1961). The first attack on the problem by digital computer methods (Reference Jenssen and RadokJenssen and Radok, 1961) allowed for variations in thermal diffusivity, for the effects of surface warming and accumulation, and for the geothermal heat flux into the ice from below, but had to disregard the steady reduction with time in the ice thickness. This “shrinkage” is the direct cause of the surface warming in what might be termed the “Robin process” and must be included in any satisfactory treatment of the thermal conditions in large ice sheets.
The new treatment presented here starts from an arbitrary ice thickness profile and prescribed rates of surface accumulation as a function of the horizontal coordinate. The horizontal motion of a vertical ice column (assumed to remain vertical throughout) is then governed by mass-continuity considerations. The ice velocity in turn determines the rate of thinning (and hence the rate of surface warming), the frictional heat which must be added to the geothermal heat flux, and finally the temperature profile of the ice as function of time or distance. An alternative sequence of steps which has greater physical interest will be indicated in the final section.
2. Theory
For block flow in a moving coordinate system with the z-axis pointing downward and the x-axis pointing horizontally downstream, the equation of heat conduction in an ice sheet has the form

where vz is the vertical velocity of the ice and Kz is the thermal diffusivity (= k/ρc, where k is the conductivity, ρ the density, and c the specific heat, 0.49 cal./g. °C.), at depth z below the surface. The finite difference equivalent of (1) which can be made computationally stable and hence suitable for numerical integration of (1) was shown (Reference Jenssen and RadokJenssen and Radok, 1961) to be

For computational stability the time increment Δt and grid interval Δz must satisfy the relation

which, for К z max~ 40 m.2/yr., can be written
The vertical velocity vz will be assumed to vary linearly between the surface (strictly the level of annual mean temperature), where it has its largest value v 0 and the lower ice boundary, where it is zero. The magnitude of v 0 is determined by the rate of surface accumulation or ablation A (m./yr., positive for accumulation), the surface slope of the ice ξ 0, and the horizontal velocity U (assumed constant with depth), as
while the horizontal velocity, the ice thickness H, and the accumulation are related by the continuity equation
If basal melting at the rate M (m./yr.) is taking place in addition to the surface accumulation A (m./yr.) equation (4) must be modified to
In the earlier computer treatment of the heat conduction in ice sheets, a constant surface warming rate was used, with the implication that
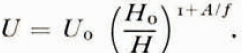
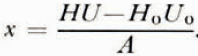
It is shown in an appendix to this paper that (5) and (4) together imply a definite thickness profile of the ice sheet, viz.
where U 0 and H 0 are the horizontal velocity and thickness at t = x = 0. equation (6) in general corresponds to a concave shape of the surface of the ice sheet and the condition therefore cannot be used for other than short horizontal distances.
The present treatment starts from an arbitrary realistic thickness profile H(x) for which the derivative dH/dx and hence, from (4), the horizontal velocity U(x) and the shrinkage rate dH(x)/dt = U dH(x)/dx can be computed at any time step, given their values at the previous time step. The shrinkage rate when multiplied by the vertical temperature gradient along the surface of the ice sheet (taken throughout as 1° C./100 m.) gives the surface warming rate. Following Reference RobinRobin (1955), the velocity U provides a direct measure of the basal heating due to friction, which equals the geothermal heat flux (assumed constant at 38 cal./cm.2 yr.) for each 18 m./yr. of horizontal velocity (assuming a basal shear stress of 0.88 bar).
For the results presented in section 4 the bottom of the ice has been assumed to be a plane horizontal surface and the ice thickness to be given by the parabolic relation
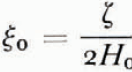
where L is the total length of the ice sheet and ζ is related to its surface slope ξ by
so that for x = 0
Given the values of H, U, and ξ at time t−1 the following quantities have to be computed for time t before the temperature profile can be determined by means of equation (2):
-
i. The ice thickness
(10)
-
ii. The surface temperature
(11) -
iii. The horizontal velocity (cf. equation (4))
(12) -
iv. The horizontal coordinate
(13) -
v. The surface slope
(14) -
vi. The temperature at the lower ice boundary, T B , is determined by the condition that the vertical temperature gradient there must correspond to the combined geothermal and frictional heat fluxes, or
(15)where Γ (=1° C./44 m.) is the average temperature gradient associated with the geothermal heat flux. However, the level where T B and γ apply is moving all the time towards the ice sheet surface at a rate which depends not merely on the shrinkage rate dH/dt but also on the occurrence or non-occurrence of basal melting. The lower boundary in fact represents the hard core of the present problem and its treatment is the subject of the next section.
3. The Lower Ice Boundary
In order to establish the temperature at the lower boundary of the ice sheet, the bottom section of the temperature profile is replaced by a fourth order polynomial. Originally this polynomial was made to agree with the temperatures of the two lowest intact grid points, with the slopes of the temperature profile at these grid points, and with the gradient γ (of equation (15)) at the actual boundary level (for the effects of melting cf. below). However, with this procedure computational instability occurred whenever the boundary moved sufficiently close to a grid point for the stability criterion (3) to be violated. The presence of this region of instability was not detected for some time; it became manifest only when the shrinkage rate was low enough to produce instability over three or four time steps.
The difficulty was finally overcome by fitting the polynomial to an auxiliary set of grid points located one and two grid intervals above the momentary boundary level. This arrangement is shown schematically in Figure 1 where the unprimed symbols refer to the fixed grid and the primed symbols to the auxiliary grid, with the boundary a fraction h of one grid interval below the lowest intact grid point.
The fourth order polynomial
The determination of the temperature al the lower ice boundary. For details see text

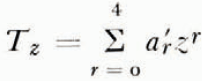
is fitted to the temperatures T′ B−1 and T′ B−2 so as to have the slopes α and β at the corresponding depths and slope γ as given by (15) at the lower boundary. With the origin at the level of T′ B−1 and a r = a′ r Δz r the following set of equations results from (16):

Eliminating the a r and solving for T B yields
where the gradients α and β have been replaced by their finite difference forms
The primed temperatures in (18) are found from the unprimed temperatures by a linear interpolation of the form
and the heat conduction equation (2) is then applied to the points (B−1)′, (B−2)′, and (B−3)′, giving the corresponding temperatures and, by (18), the temperature at the lower boundary, T B .
Whenever the boundary temperature T B rises above the melting pointFootnote * an additional calculation becomes necessary. This is illustrated schematically in Figure 2, where the heat conduction during the time step just completed has moved the temperature T B across the zero isotherm. The heat Q which must be used for melting is proportional to the shaded area F which can be approximated either by
The determination of the melt rate at the lower ice boundary. For details see text

or by
Here the first expression which slightly underestimates the heat available for melting will be used. Then
where c is the specific heat of ice (0.49 cal./g. ° C.), and on division by the heat of fusion (80 cal./g.) the melt rate M′ (m./time step) is obtained as
In the machine calculation the boundary temperature T B is then restored to zero. This leads to a modified boundary temperature gradient γ′ which will be larger or smaller than γ depending broadly on whether M′ exceeds, or remains less than (hΔ z−δ). Thus the heat flux into the ice from below is modified by the amount of melting during the previous time step and this in turn will effect a change in the next melt rate. In this way the proper balance is established between the proportions of geothermal and frictional heat used for melting and conduction upward into the ice, respectively.
4. Some Typical Results
The calculations outlined in the preceding sections have been programmed and performed on CSIRAC, a single-address binary digital computer with a command time of 2.2 msec. and a high-speed storage capacity of 768 words each containing 20 digits. The speed actually achieved corresponded to 15·5 (Δt/n) × 103 yr. of heat conduction per hour of computation, where Δt is the length of the time step in years and n is the average number of grid points used. With a time step of 25 yr. computational stability required a grid spacing of 50 m. (cf. equation (3a)); hence one hour of computation for an ice sheet initially 3,000 m. thick covered 7,800 yr. of heat conduction. For H 0 = 1,000 m. and a time step of 5 yr. (corresponding to fringe conditions), 3,700 yr. of conduction could be achieved in one hour.
For the first case to be presented here a parabolic profile of the form
was used. The calculation was started with 60 grid points (59 grid intervals of 50 m. each); this gave an initial thickness of 2,950 m., corresponding to initial values of x ~ 100 km. and ζ = 5.08 × 10⁻⁴. The initial velocity U 0 was assumed arbitrarily as 20 m./yr. in all cases. Figure 3 shows a portion of the ice sheet surface (23) together with the horizontal velocity profiles resulting from different surface accumulation rates in view of equation (4a), which allows for basal melting. The time scale for each accumulation rate is indicated along its velocity curve. It is seen that the combined effects of shrinkage and melting accomplish in 10,000 yr. with a surface accumulation of 80 cm./yr. the same as almost 40,000 yr. of conduction with an accumulation rate of 5 cm./yr. The former accumulation figure is of the right order of magnitude for central Greenland and the latter for the interior of Antarctica.
Surface profile and ice velocities for different accumulation rates—central ice sheet. Each velocity Curve carries the appropriate time scale (in thousands of years)

The ice temperature profiles for the three accumulation rates are shown in Figure 4. For greater clarity all the surface temperatures fall on a common axis; the lower end of each temperature profile refers to the bottom of the ice at the time in question. In each case the starting temperatures correspond to steady-state heat conduction and were determined numerically, with Reference RobinRobin’s (1955) theoretical steady-state solution for constant thermal diffusivity as initial guess. The main result of the ice motion is the familiar negative temperature gradient near the surface; in the case of the lowest accumulation rate this takes 30,000 yr. of movement to form. In this case basal melting occurs under steady-state conditions and is accentuated by the movement. For the larger accumulation rates melting sets in after a few thousand years of motion, although the steady-state profiles have temperatures well below the melting point at the lower ice boundary. Thus basal melting can occur under less stringent conditions of ice thickness and accumulation than have been employed hitherto (Reference WexlerWexler, 1961; Reference ZotikovZotikov, 1961). It will be seen below that close to the edge of an ice sheet the motion of the ice appears to have the opposite effect.
Ice temperature profiles for the ice sheet and accumulation rates in Figure 3. The initial temperature profiles (broken curves) correspond to steady-state heat conduction

The melt rate can be found from equation (4a) as
For the case of 80 cm. annual accumulation the melt rate ranged from zero after 4,000 yr. (when the melting point was reached at the lower boundary) to an average rate of 12 cm./yr. during the final thousand years of the calculation (from 10,000 to 11,000 yr.). For the case of 5 cm. annual accumulation the maximum melt rate was found to be 7.3 mm./yr. (average for the 5,000 yr. from 35,000 to 40,000 yr.). The smaller of these estimates is in good agreement with Reference ZotikovZotikov’s (1961) estimate for steady-state conduction in the central part of Antarctica. In both cases the melt rate remains a small fraction of the surface accumulation.Footnote *
The second case to be discussed corresponds to conditions near the edge of an ice sheet and uses a surface profile of the form
Surface profile and ice velocities for different accumulation rates—edge of ice sheet. Each velocity curve carries the appropriate time scale (in hundreds of years)

with a thickness of 10,000 m. and a slope of 10−2 at x = 0, 50 km. from the end of the ice sheet. Figure 5 shows the shape of the latter together with velocity profiles for the three accumulation rates previously used and for the case of ablation at the rate of 20 cm./yr. following an accumulation of 5 cm./yr. during the initial 200 yr. of movement. The last combination is broadly representative of conditions in the Mawson region (Reference MellorMellor, 1959) and brings out the marked effect of ablation on the terminal velocity of the ice.
The temperature profiles for the different accumulation rates are shown in Figures 6 and 7, where the initial temperatures again correspond to steady-state heat conduction. Evidently this assumption is not as good an initial condition here as in the central regions of an ice sheet, and a variety of other starting profiles remain to be tried at the edge. Figures 6 and 7 show that at the edge of the ice sheet motion tends to lower the basal temperature, except for the highest accumulation rate where T B remains constant. Evidently the temperatures of the ice as a whole show an increasing lag to the surface temperature, which rises rapidly during this final stage of the ice motion.
Ice temperature profiles for the ice sheet and accumulation rates in Figure 5. The initial temperature profiles (broken curves) correspond to steady-state heat conduction

The effect of ablation on the temperature profile. The initial profile (broken curve) is that for 200 yr., 0.05 m./yr., in Fig. 6, the intermediate curves show the profiles after 6 × 10² yr. of ablation or accumulation and the final curves (marked 10) show the profiles after 10 × 102 yr.

The effect of ablation is brought out by the unbroken curves in Figure 7, where for comparison the temperature profiles for A = 0.05 m./yr. are also reproduced; the initial temperatures in this case are given by the 200 yr. profile in Figure 6, A = 0.05 m./yr. It is clear that the ablation temperature profiles are in better accord with observations (e.g. Reference Shumskiy and TreshnikovShumskiy, 1960); nevertheless in regions with large accumulation right down to sea-level the curves of Figure 6 must be broadly valid.
5. Conclusion and Outlook
The motion of ice sheets represents only one of the processes affecting their temperatures; the analysis of its effects serves for explaining observed temperatures or for deciding as to whether climatic changes must be invoked in addition to the Robin process to explain the observations. Beyond this direct application, the numerical modelling of the heat conduction in thinning ice sheets opens the way to the combined treatment of thermal and dynamic processes of the ice sheet. In place of starting from a given thickness profile, one might base the calculations on a flow law for the ice, together with suitable initial temperatures and accumulation values as functions of distance. The parameters in the flow law will be functions of temperature so that in this case the horizontal velocity must be derived at the end of each time step after the temperature profile has been computed. Continuity considerations would then give the increments of surface slope and thickness and hence the boundary values needed for the next step in the heat conduction process. In this way both the temperatures and the thickness profile of the ice sheet would be obtained as results of the calculations.
Evidently this approach will require a variety of flow Iaws which might be judged in the light of the thickness profiles they produce. The demand on the computer will be rather larger than that made by the more schematic calculation here presented; however, with the representation of the thinning process now available, no major difficulties are anticipated in this next stage, even though it presents a task of a different order of magnitude.
A further extension of the present treatment is needed to cope with the very important case of ice shelves. The thinning of these probably can be handled as in section 3, but the heat flux into the ice from below no longer depends on the ice motion but must be established from oceanographic arguments (Reference WexlerWexler, 1960). The temperature of an ice shelf appears to play an even more crucial rôle (Reference RobinRobin, 1958) than is the case for land-based ice sheets, and the study of the relevant heat conduction processes can therefore be expected to contribute much to the understanding of ice shelves and their rôle in the Antarctic mass balance.
Acknowledgement
We are indebted to Judith Martin for the representations of the results used in this paper.
The Ice Thickness Profile for a Constant Thinning Rate
Mass continuity implies (cf. equation (4) of this paper) that
where H and U are the thickness and horizontal velocity respectively (both functions of x) and A is a constant accumulation rate.
If H = H 0−ft, so that dH/dt = −f, a constant, then from (1)
so that

Integrating

or
Now (1) may be written as
or
from which
Substituting for U from (3)

Rearranging we find that


