


Introduction
The southern Central Graben, located in the southern North Sea, is an important hydrocarbon province of both The Netherlands and Denmark (Pletsch et al., Reference Pletsch, Appel, Botor, Clayton, Duin, Faber, Górecki, Kombrink, Kosakowski, Kuper, Kus, Lutz, Mathiesen, Ostertag-Henning, Papiernek, Van Bergen, Doornenbal and Stevenson2010). Jurassic and Lower Cretaceous rocks are important as source and reservoir rocks for the hydrocarbon systems in the region. The bulk of the hydrocarbons originates from Lower Jurassic to Lower Cretaceous source rocks, of which the Lower Jurassic Posidonia Shale Formation (offshore The Netherlands) and the Upper Jurassic to Lower Cretaceous Bo Member (offshore Denmark) of the Farsund Formation are the most significant and prolific ones (Lott et al., Reference Lott, Wong, Dusar, Andsbjerg, Mönnig, Feldman-Olszewska, Verreussel, Doornenbal and Stevenson2010). It is assumed that some of the locally present hydrocarbons originate from secondary Jurassic source rocks, e.g. Lower Jurassic marine claystones from the Aalburg Formation and Middle Jurassic coals from the Central Graben Subgroup (De Jager & Geluk, Reference de Jager, Geluk, Wong, Batjes and de Jager2007; Wong, Reference Wong, Wong, Batjes and De Jager2007; Müller et al., Reference Müller, Arfai, Jaehne-Klingberg, Bense and Weniger2020). Middle Jurassic sandstones of the Central Graben Subgroup also constitute reservoir rocks, e.g. the oil and condensate field F03-FB in the northern Dutch Central Graben. The southern Central Graben is a Mesozoic rift system that was most active from the Middle Jurassic to the Early Cretaceous. Its tectonostratigraphic evolution is accompanied by significant proportion of halokinesis and halotectonics. The salt tectonics had a great impact on the basin evolution and sedimentation (ten Veen et al., Reference ten Veen, van Gessel and den Dulk2012; Jackson & Hudec, Reference Jackson and Hudec2017; Bouroullec et al., Reference Bouroullec, Verreussel, Geel, De Bruin, Zijp, Kőrösi, Munsterman, Janssen and Kerstholt-Boegehold2018). Re-active diapirism, salt redistribution and diapir growth, combined with active rifting, induced the segmentation of the basin into several subbasins (Arfai et al., Reference Arfai, Jähne, Lutz, Franke, Gaedicke and Kley2014). Sedimentation again reciprocally influenced salt mobilisation by differential loading.
Due to the close relationship between rifting, salt tectonics and sedimentation, research that links these three aspects is crucial to understand the sedimentary system of the Graben and to fully assess the economic potential of the area, regarding hydrocarbon exploitation or carbon capture and storage (CCS). A tectonostratigraphic approach that studies the relationship between stratigraphic successions and the influence of tectonic processes is therefore an appropriate procedure to investigate such an environment as the southern Central Graben.
Different authors attended to the sedimentary and tectonic evolution of the Danish Central Graben (Andsbjerg, Reference Andsbjerg2003; Andsbjerg and Dybkjaer, Reference Andsbjerg and Dybkjær2003; Michelsen et al., Reference Michelsen, Nielsen, Johannessen, Andsbjerg and Surlyk2003; Coward et al., Reference Coward, Dewey, Hempton and Holroyd2003; Zanella et al., Reference Zanella, Coward, Evans, Graham, Armour and Bathurst2003; Johannessen et al., Reference Johannessen, Dybkjær, Andersen, Kristensen, Hovikoski and Vosgerau2010; Weibel et al., Reference Weibel, Friis, Kazerouni, Svendsen, Stokkendal and Poulsen2010; Mellere et al., Reference Mellere, Mannie, Longhitano, Mazur, Kulausa, Brough and Cotton2017; Verreussel et al., Reference Verreussel, Bouroullec, Munsterman, Dybkjær, Geel, Houben, Johannessen and Kerstholt-Boegehold2018; Ineson et al., Reference Ineson, Sheldon, Dybkjær, Andersen, Alsen and Jakobsen2022). Andsbjerg and Dybkjaer (Reference Andsbjerg and Dybkjær2003) established a sequence stratigraphic framework for the Jurassic of the Danish Central Graben. Michelsen et al. (Reference Michelsen, Nielsen, Johannessen, Andsbjerg and Surlyk2003) examined the lithostratigraphy and the distribution of the depositional systems in the Jurassic and Early Cretaceous of the Danish Central Graben. Møller and Rasmussen (Reference Møller and Rasmussen2003) did research on the tectonic evolution of the Danish Central Graben, which they differentiated into several tectonic pulses. Duffy et al. (Reference Duffy, Gawthorpe, Docherty and Brocklehurst2013) integrated the consideration of salt tectonic processes into basin evolution concepts and investigated how they influenced the structural style and the tectonostratigraphy of the Danish Central Graben. Verreussel et al. (Reference Verreussel, Bouroullec, Munsterman, Dybkjær, Geel, Houben, Johannessen and Kerstholt-Boegehold2018) developed a tectonostratigraphic model for the southern Central Graben that included both the Danish and the Dutch sectors. For the Dutch Central Graben, most papers focused on the general geology and stratigraphy (Abbink et al., Reference Abbink, Mijnlieff, Munsterman and Verreussel2006; Wong, Reference Wong, Wong, Batjes and De Jager2007). Bouroullec et al. (Reference Bouroullec, Verreussel, Geel, De Bruin, Zijp, Kőrösi, Munsterman, Janssen and Kerstholt-Boegehold2018) presented a detailed analysis of the tectonostratigraphic evolution of the basin, including the influence of salt tectonics. This paper builds on their work by adopting their concept of four tectonostratigraphic mega-sequences in the graben evolution (Bouroullec et al., Reference Bouroullec, Verreussel, Geel, De Bruin, Zijp, Kőrösi, Munsterman, Janssen and Kerstholt-Boegehold2018). We will complement the missing link of the German Central Graben for more consistent tectonostratigraphic correlation of basin evolution of the NNW-SSE trending Danish Central Graben and the NNE-SSW trending Dutch Central Graben (Fig. 1). For this we take a closer look to changes of sedimentation patterns over time, where erosion took place, how rifting and salt tectonics influenced sedimentation and how these influences changed in different tectonic phases. To answer these questions, we used seismic interpretation as well as well log correlation.
(a) Structural map of the southern North Sea including the southern Central Graben (blue-grey), adjacent basins and highs, and faults (red) (modified from Jakobsen et al. (2020a). (b) Structural map of the study area of the paper, including adjacent basins and highs, salt structures, and the MBF (red). Profile A and Profile B show geological interpretations of exemplary seismic sections (Fig. 4 and Fig. 5).

Geological Evolution
Tectonic and sedimentary evolution
The southern Central Graben, in its narrow definition without the Step Graben system, is an about 250 km long and on average about 50 km wide half-graben (Fig. 1). It is limited to its east by its eastern main bounding faults (MBF), the Coffee Soil Fault system for the Danish part and the Schillgrund Fault system for the German and Dutch part of the graben (Thöle et al., Reference Thöle, Jähne-Klingberg, Doornenbal, den Dulk, Britze and Jakobsen2021). It comprises the NNE-SSW trending Dutch Central Graben, the NNW-SSE trending Danish Central Graben to the Norwegian border and in between the German Central Graben. Within the German Central Graben, the Mid Central Graben Transverse Zone (MCGTZ) is located, which is also known as Thor Transverse zone (Wride, Reference Wride1995) and divides the study area roughly in half into a northern and southern part (Thöle et al., Reference Thöle, Jähne-Klingberg, Doornenbal, den Dulk, Britze and Jakobsen2021; Fig. 1). The MCGTZ is a complex structural strike slip zone that transects the German Central Graben at the change of strike from the Danish to the Dutch Central Graben.
The here investigated part of the southern Central Graben is located in the northwestern part of the Southern Permian Basin in transition to the East and Mid North Sea Highs. The Southern Permian Basin (SPB) is an ESE-WNW trending intracontinental basin that started to subside during the late Early Permian (Bachmann & Grosse, Reference Bachmann and Grosse1989; Bachmann & Hoffmann, Reference Bachmann and Hoffmann1997). During the Late Permian, cyclic deposition of marine evaporites of the Upper Permian Zechstein group took place in the basin (Geluk, Reference Geluk, Wong, Batjes and de Jager2007; Stollhofen et al., Reference Stollhofen, Bachmann, Barnasch, Bayer, Beutler, Franz, Kästner, Legler, Mutterlose, Radies, Littke, Bayer, Gajewski and Nelskamp2008).
The supercontinent Pangaea broke up from the Triassic to the Early Cretaceous along a roughly SW-NE-trending line, the Arctic-North Atlantic mega-rift system, with rifting between Greenland and the Baltic Shield towards the Central Atlantic domain (Ziegler, Reference Ziegler1992; Coward et al., Reference Coward, Dewey, Hempton and Holroyd2003; Zanella et al., Reference Zanella, Coward, Evans, Graham, Armour and Bathurst2003; Pharaoh et al., Reference Pharaoh, Dusar, Geluk, Kockel, Krawczyk, Krzywiec, Scheck- Wenderoth, Thybo, Vejbæk, Van Wees, Doornenbal and Stevenson2010). A southeastern part of the mega-rift system is the triple junction of the North Sea Rift System. It consists of the Viking Graben, the Moray Firth-Witch Ground graben and the Central Graben as its southern arm, which showed first major tectonic activity in the Late Triassic (Ziegler, Reference Ziegler1992; Jähne-Klingberg et al., Reference Jähne-Klingberg, Bense and Warsitzka2018). The development of the Central Graben is closely connected with the break-up of Pangea from the Triassic to the Early Cretaceous (de Jager, Reference de Jager, Wong, Batjes and de Jager2007), Nevertheless, the Central Graben presumably rests on structural precursors present during the time of Rotliegend sedimentation (Stemmerik et al., Reference Stemmerik, Ineson and Mitchell2000). First prominent tectonic activity with moderate rifting, though, started not until the Middle Triassic for the German part of the Graben (Jähne-Klingberg et al., Reference Jähne-Klingberg, Bense and Warsitzka2018) During the Mid Triassic, a roughly E-W-oriented extensional stress field developed in the region that persisted until the Late Jurassic (Sippel, Reference Sippel2009).
The southern North Sea area of the Latest Triassic (Rhaetian) and the Early Jurassic was dominated by a shallow epicontinental sea in a time of relative tectonic quiescence (Pharaoh et al., Reference Pharaoh, Dusar, Geluk, Kockel, Krawczyk, Krzywiec, Scheck- Wenderoth, Thybo, Vejbæk, Van Wees, Doornenbal and Stevenson2010), except for the larger approximately N-S striking Glückstadt-Graben, Horn-Graben and to a lesser extent the Central Graben. This resulted in the wide-scale deposition of fine-grained mudstones, such as the Posidonia Shale Formation, during a time of stagnant water stratification (Lott et al., Reference Lott, Wong, Dusar, Andsbjerg, Mönnig, Feldman-Olszewska, Verreussel, Doornenbal and Stevenson2010; Fig. 2). This depositional system ended in the Middle Jurassic with the emergence of the Central North Sea thermal dome at the centre of the triple junction (Graversen, Reference Graversen2006; Quirie et al., Reference Quirie, Schofield, Hartley, Hole, Archer, Underhill, Watson and Holford2019, Reference Quirie, Schofield, Jolley, Archer, Hole, Hartley, Watson, Burgess, Pugsley, Underhill and Holford2020). The uplift resulted in erosion of Jurassic and Triassic sediments on the platforms and marginal areas, represented by the regional Mid-Cimmerian Unconformity, while deposition continued only in the Central basin areas like the Central Graben (Underhill & Partington, Reference Underhill and Partington1993). After the collapse of the thermal dome in the late Middle Jurassic, subsidence resumed, evidenced by the deposition of continental and paralic sediments and subsequently of marine claystones (Wong, Reference Wong, Wong, Batjes and De Jager2007; Fig. 2). During the Late Jurassic, rifting increased and halotectonics intensified, which resulted in a complex system of intra basin platforms, highs and subbasins in the southern Central Graben (Japsen et al., Reference Japsen, Britze and Andersen2003; Arfai et al., Reference Arfai, Jähne, Lutz, Franke, Gaedicke and Kley2014).
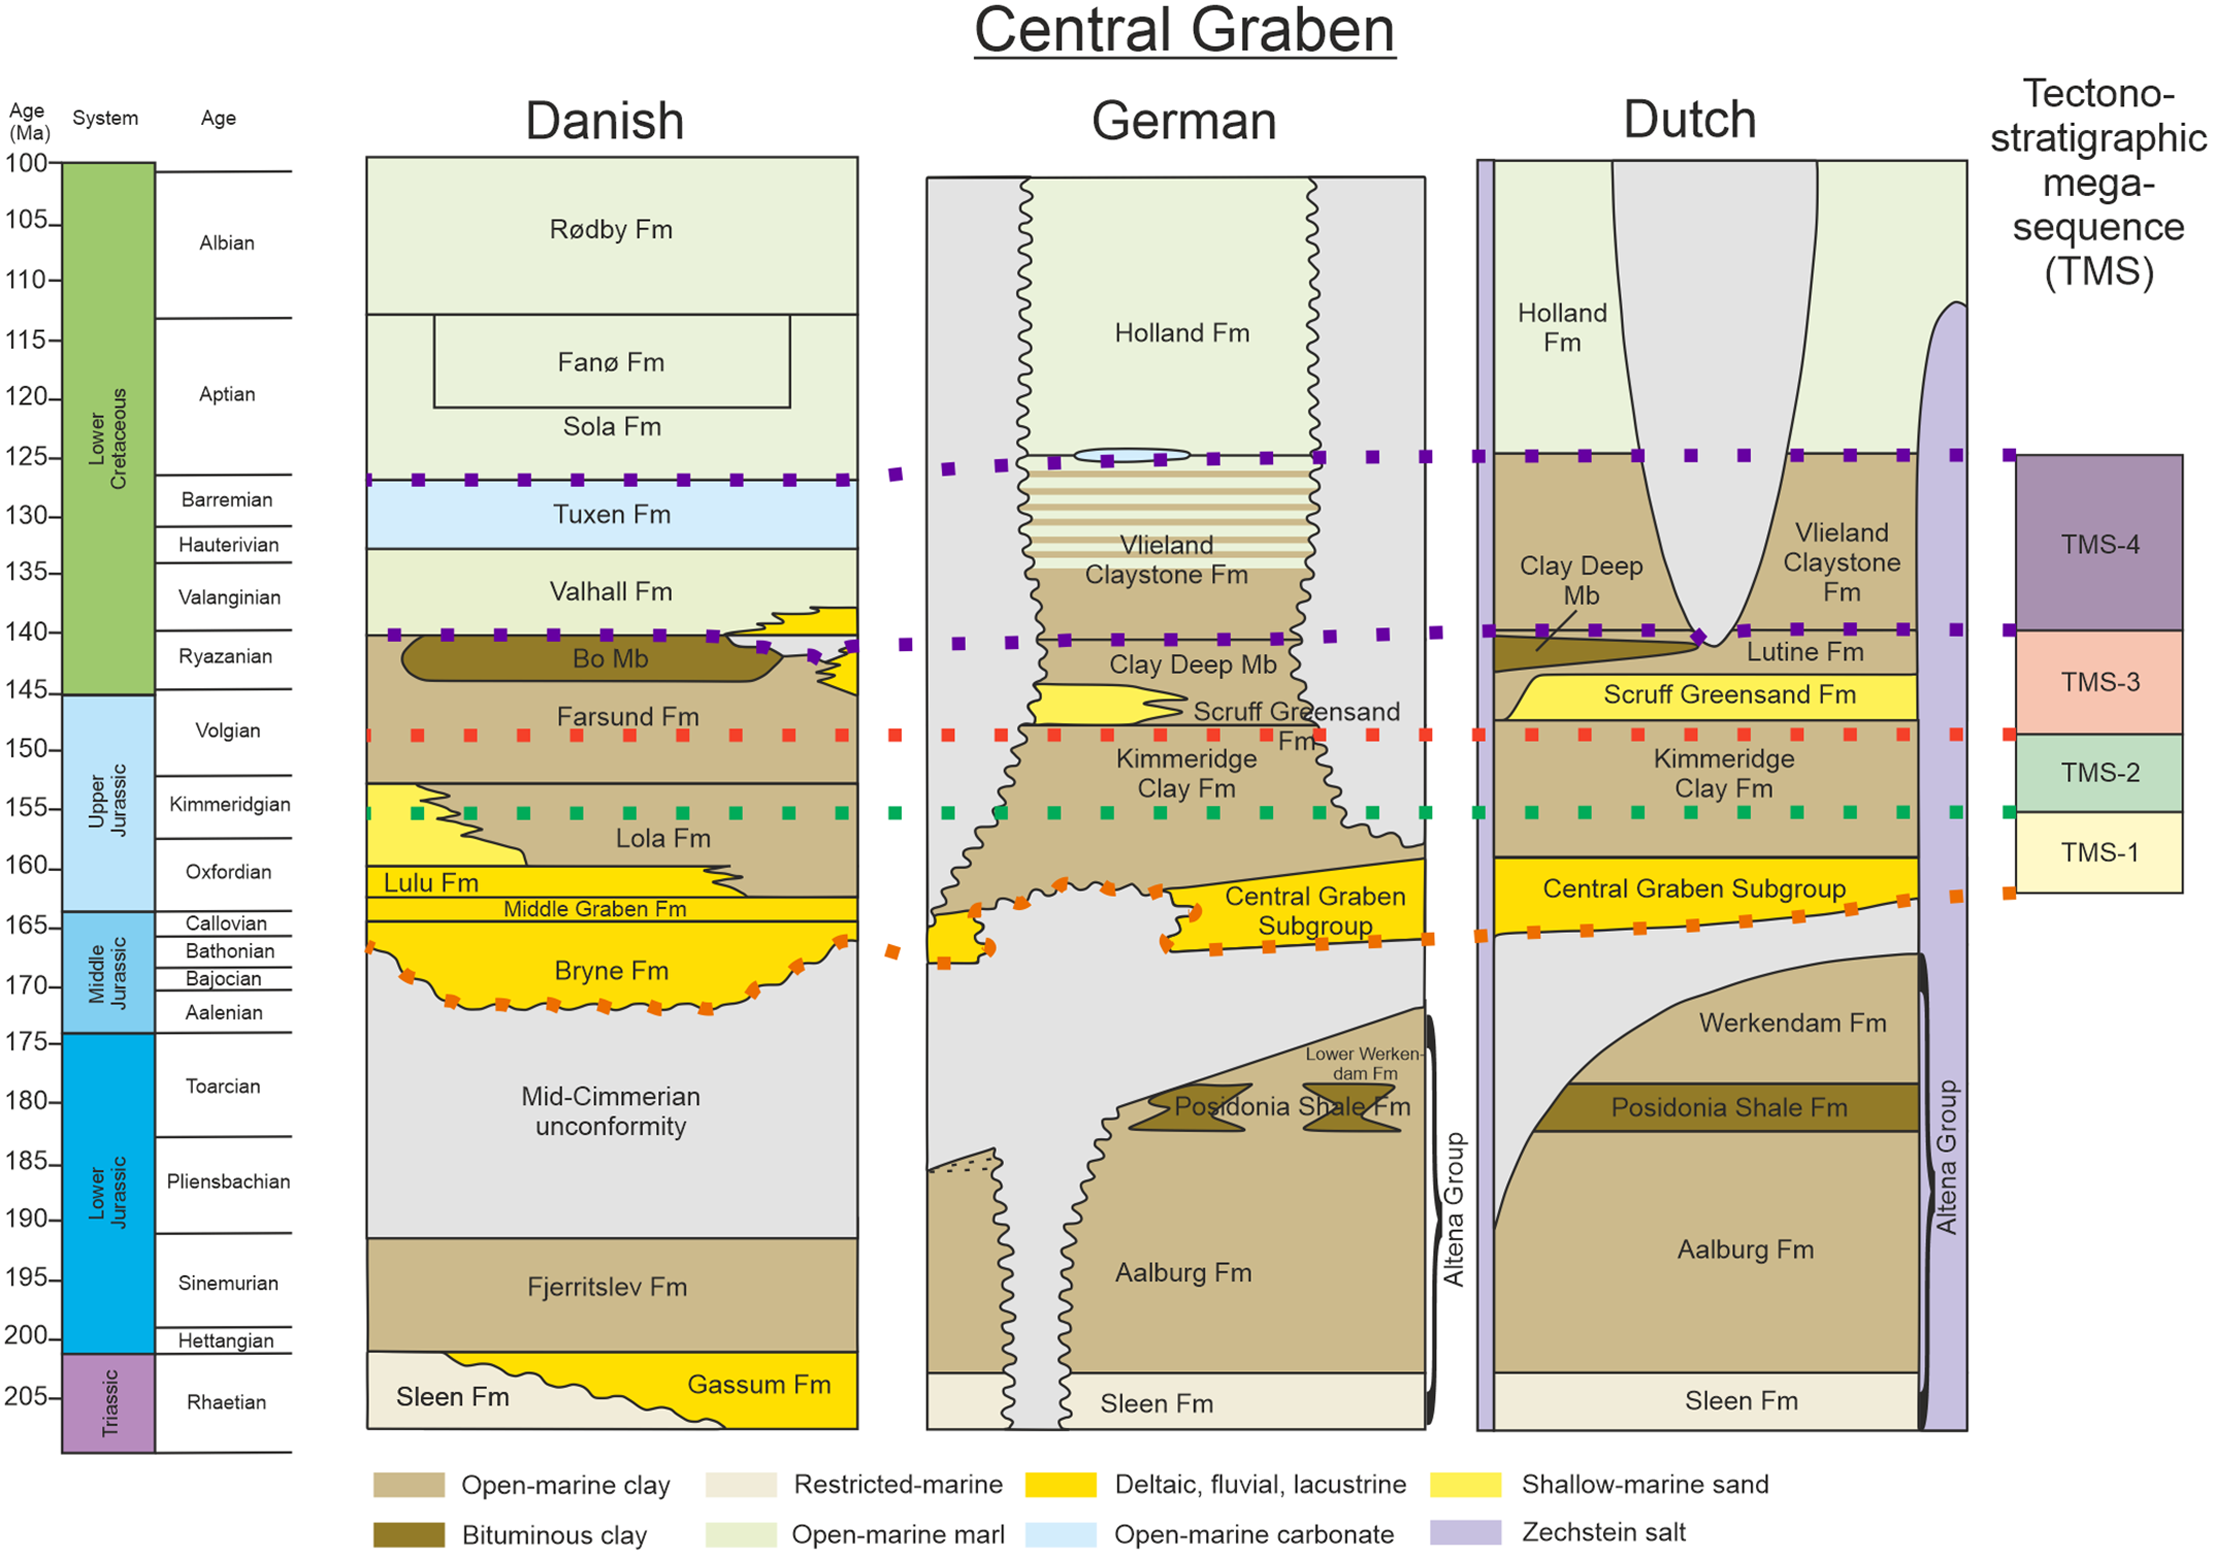
Lithostratigraphy of the Danish, German, and Dutch Central Graben, covering the study period with tectonostratigraphic mega-sequences (TMS) from the Late Triassic to the Early Cretaceous including the most active phase of rifting and halotectonics. Differences between the national lithostratigraphies are the result of a diachronous development of the graben, as well as of different national research histories. Modified from Jakobsen et al. (2020b).
Rifting stopped in the late Early Cretaceous and sedimentation was more evenly distributed in the following post-rift thermal sag phase (Wong, Reference Wong, Wong, Batjes and De Jager2007). A long-term transgression in the Early Cretaceous led to the deposition of at first open-marine clay and then marl (Herngreen & Wong, Reference Herngreen, Wong, Wong, Batjes and De Jager2007). Over-regional NE/NNE compressional stresses as an effect of the Africa-Iberia-Europe convergence resulted in structural inversion of parts of the Central Graben, parallel to ongoing transgression to the deposition of shallow marine carbonates (Vejbæk & Andersen, Reference Vejbæk, Andersen and Ziegler1987; De Jager, Reference De Jager2003, Reference de Jager, Wong, Batjes and de Jager2007; Kley and Voigt, Reference Kley and Voigt2008; Rasmussen, Reference Rasmussen2009; Van Buchem et al., Reference Van Buchem, Smit, Buijs, Trudgill and Larsen2018). Compression ceased in the Paleocene and an intracontinental sag basin developed in the southern North Sea, which does not or only inconspicuously trace pre-existing structures, reaching its present-day state in the Eocene (Huuse & Clausen, Reference Huuse and Clausen2001; Walter, Reference Walter2007).
The Uppermost Triassic to Lower Cretaceous lithostratigraphy of the southern Danish, German and Dutch parts of the Central Graben is illustrated in Fig. 2. The apparent differences of the national sections originate from the diachronous development of the southern Central Graben as well as of decades of development of separate national tectonostratigraphies – which focus on different national specificities without cross-border harmonization. Denmark and The Netherlands use different national terms for lithologies from the same or a related depositional setting, e.g. Lower Jurassic open-marine clays (Fig. 2). In the following, we call these related lithostratigraphic terms ‘equivalents’.
Jurassic sequence and tectonostratigraphy in the southern Central Graben
Danish Central Graben
Andsbjerg and Dybkjaer (Reference Andsbjerg and Dybkjær2003) established a sequence stratigraphic framework for the Danish Central Graben on the basis of the analysis of well logs, sedimentological core logs, lithology logs and biostratigraphic data. They differentiated the Jurassic and Lower Cretaceous succession into 20 sequences, which are assigned to seven rifting phases. These phases range from a pre-rift stage, uplift and erosion due to the Mid-North Sea Dome, rift initiation and rift climax finally to the beginning of a post-rift stage with uniform subsidence (Table 1). Møller and Rasmussen (Reference Møller and Rasmussen2003) distinguished between three tectonic pulses that formed the Danish Central Graben. The first pulse lasted from the Callovian to the Early Oxfordian and concentrated along pre-existing N-S-trending faults. The second tectonic pulse, from the Late Kimmeridgian to the Early Volgian, created new NNW-SSE striking faults. During this pulse, salt tectonics intensified and controlled the location of depocenters away from the eastern main boundary fault (MBF; Coffee Soil Fault) of the Central Graben. The last tectonic pulse took place in the mid-Ryazanian.
Correlation of the TMS of the Dutch Central Graben from Verreussel et al. (Reference Verreussel, Bouroullec, Munsterman, Dybkjær, Geel, Houben, Johannessen and Kerstholt-Boegehold2018) and the rift phases of the Danish Central Graben according to Andsbjerg and Dybkjaer (Reference Andsbjerg and Dybkjær2003) and Møller and Rasmussen (Reference Møller and Rasmussen2003).

Dutch Central Graben
Abbink et al. (Reference Abbink, Mijnlieff, Munsterman and Verreussel2006) differentiated the Middle Jurassic to Lower Cretaceous stratigraphy of the Dutch Central Graben into four large-scale stratigraphic sequences. Verreussel et al. (Reference Verreussel, Bouroullec, Munsterman, Dybkjær, Geel, Houben, Johannessen and Kerstholt-Boegehold2018) and Bouroullec et al. (Reference Bouroullec, Verreussel, Geel, De Bruin, Zijp, Kőrösi, Munsterman, Janssen and Kerstholt-Boegehold2018) then developed the concept further into a new tectonostratigraphic model. They defined four tectonostratigraphic mega-sequences (TMS) based on palynological, geochemical, sedimentological analyses as well as seismic and well log interpretation. The TMS are defined as main phases of the basin evolution that are governed by changes in the tectonic regime (Verreussel et al., Reference Verreussel, Bouroullec, Munsterman, Dybkjær, Geel, Houben, Johannessen and Kerstholt-Boegehold2018). TMS-1 is of Bathonian to Early Kimmeridgian age, when sedimentation was limited to the axis of the graben. The sediments of TMS-2 were deposited during the Late Kimmeridgian to the Late Volgian. TMS-2 is characterised by active faulting and salt movement and sedimentation on basins and plateaus adjacent to the graben axis. During the sedimentation of TMS-3 (Volgian to Ryazanian) fault activity ceased and sedimentation occurred also on the adjacent plateaus. The sediments of TMS-4 lasted during the Valanginian to the Barremian, when the rift phase ended, and the entire southern North Sea was subject to thermal subsidence.
Data and Methods
Seismic interpretation
Seismic analysis was carried out on three 3D seismic reflection surveys and several 2D seismic reflection lines from different surveys, which were selected to cover the study area. The study area comprises the area of the central parts of the German Central Graben and adjacent areas of the northern Dutch Central Graben and of the southern Salt Dome Province of the Danish Central Graben. The 3D seismic survey ‘Entenschnabel 2002’(Fig. 3) covers the Dutch part, most of the German part of the study area and originally parts of the Danish North Sea. However, for this study, the data were only available as two separate Dutch (publically available as ‘3D Seismic Z3FUG2002A’ on www.nlog.nl) and German parts, without the Danish part. Therefore, 2D seismic reflection lines were used in the Danish sector (Fig. 3). Seismic analysis was carried out with Schlumberger’s GeoFrame software. Seismic interpretation of the horizons was performed in the time domain. The horizons were subsequently depth converted using Paradigm’s SeisEarth (v.2018/2019) and SkuaGocad (v.2019) software. The depth conversion based on a harmonised v0-k seismic velocity modelling approach for the Central Graben area carried out as part of the GeoERA 3DGEO-EU project (Doornenbal et al., Reference Doornenbal, den Dulk, Thöle, Jähne-Klingberg, Britze and Jakobsen2021a; Thöle et al., Reference Thöle, Jähne-Klingberg, Doornenbal, den Dulk, Britze and Jakobsen2021).
Data used in the present study: Two 3D reflection seismic surveys for the German Central Graben, one 3D reflection seismic survey for the northern Dutch Central Graben, several 2D reflection seismic lines from different surveys for the southeastern part of the Salt Dome Province of the Danish Central Graben, as well as eight wells within or adjacent the study) area for well correlation. The 2D seismic profile from Bouroullec et al. (Reference Bouroullec, Verreussel, Geel, De Bruin, Zijp, Kőrösi, Munsterman, Janssen and Kerstholt-Boegehold2018) was the initial point for the seismic interpretation.

In a first step, we adopted the tectonostratigraphic concept of Verreussel et al. (Reference Verreussel, Bouroullec, Munsterman, Dybkjær, Geel, Houben, Johannessen and Kerstholt-Boegehold2018) and Bouroullec et al. (Reference Bouroullec, Verreussel, Geel, De Bruin, Zijp, Kőrösi, Munsterman, Janssen and Kerstholt-Boegehold2018) from the Dutch Central Graben and applied it to the study area. Starting point of our seismic interpretation was a 2D seismic section (profile D from Bouroullec et al., Reference Bouroullec, Verreussel, Geel, De Bruin, Zijp, Kőrösi, Munsterman, Janssen and Kerstholt-Boegehold2018; Fig. 3) that intersects the northernmost part of the Dutch Central Graben approximately perpendicular to the graben axis and parallel to the Dutch-German border. Coming from this profile, we extended the interpretation of the base horizons of TMS-1, TMS-2, TMS-3 and TMS-4, as well as an intra-TMS-1 erosional surface to the northern Dutch Central Graben, the German Central Graben without its most northwestern extension, the Mads Graben and to the south-eastern part of the Salt Dome Province of the Danish Central Graben (Fig. 2). To investigate the tectonostratigraphic evolution of the Jurassic and Lower Cretaceous of the study area in more detail, we further subdivided the tectonostratigraphic mega-sequences regarding prominent regional seismic horizons (base TMS-1.3 intra Kimmeridge Clay Formation) or prominent lithological changes (base TMS-1.2 base Kimmeridge Clay Formation, TMS-3.2 base “Hot Shale”) that can be correlated between wells. These subdivisions of the tectonostratigraphic mega-sequences in this paper are not identical with the subdivisions (TS) from Bouroullec et al. (Reference Bouroullec, Verreussel, Geel, De Bruin, Zijp, Kőrösi, Munsterman, Janssen and Kerstholt-Boegehold2018) and Verreussel et al. (Reference Verreussel, Bouroullec, Munsterman, Dybkjær, Geel, Houben, Johannessen and Kerstholt-Boegehold2018), which are based on palynological data. Additionally, we mapped the base of the Lower Cretaceous Holland Formation, representing the part of the Lower Cretaceous after TMS-4, and used existing seismic interpretation data (Arfai et al., Reference Arfai, Jähne, Lutz, Franke, Gaedicke and Kley2014) of the base of the Altena Group (Sleen, Aalburg, Posidonia Shale and Werkendam Formation in the German and Dutch nomenclature and Sleen and Fjerritslev Formation in the Danish nomenclature) as a combined pre-rift horizon (Fig. 4 to Fig. 7). The base of local to regional depocenters is highlighted in reflection seismic profiles perpendicular to the main structures of the study region (Fig. 4 to Fig. 7). Interpolated lines between the maximum of local depocenters highlight the lateral shift of depocenters over time. A vertical line between local depocenters often highlights thermal subsidence as the main driver (e.g. Lower to Mid Triassic, Lower Jurassic). A vertical ‘indicator’ line close to a diapir highlights diapiric growth without a major impact of regional tectonics on the depocenters (e.g. Paleogene). Oblique lines indicate rifting (e.g. Mid- to Upper Triassic, Middle Jurassic to Upper Jurassic) or contraction (Late Cretaceous). A decrease in slope of the ‘indicator line’ is an indicator for the intensity of rifting or uplift. An increasing step away of the depocenter indicates a steadily increasing local to regional uplift (e.g. Late Cretaceous to Paleocene).
Interpreted depth converted 2D seismic profile in the south of the study area. The seismic section starts on the Step Graben (the strongly dissected half-graben shoulder of the Central Graben) in the west and crosses the salt structure “B17-SOUTH1”, the northern Dutch Central Graben, the salt structure “Clara” in top of the Coffee-Soil fault and ends at the Schillgrund High outside the Central Graben. Eye-catching are the Late Jurassic depocenters in the center of the northern Dutch Central Graben and at the western flank of “Clara” in the hanging wall of the Coffee Soil fault, which shift steadily from TMS-1 to TMS-2 towards the salt structures, indicating an increasing influence of halotectonics during the Later Jurassic. Interpolated lines (white dashed line) between the maximum of local depocenter (black crosses) highlight the lateral shift of depocenters over time. Former topographic lows and depocenters of TMS-2 to the Lower Cretaceous in the Dutch Central Graben were structurally inverted during Late Cretaceous compression and formed an impressive turtle structure. The profile is five times vertically exaggerated.

Interpreted 2D seismic profile in the center of the study area. The seismic section starts at the western graben shoulder in the Step Graben System (the strongly dissected half-graben shoulder of the Central Graben), crosses the northern part of the Johannes Graben, the salt structure “Belinda”, the John Graben, then the Clemens Basin and ends at the Schillgrund High in the east outside the graben. Eye-catching is the shift of the depocenter in the John Graben east of “Belinda” from the graben center towards the salt structure, indicating a decreasing influence of rifting that was dominating from TMS-1.1 to TMS-1.2 in favor of an increasing influence of halotectonics in the subsequent TMS. Interpolated lines (white dashed line) between the maximum of local depocenter (black crosses) highlight the lateral shift of depocenters over time. The erosion of Triassic and Lower Jurassic Altena Group strata and the absence of TMS-1.1 in the Clemens Basin indicates that the basin was a structural high during the emergence of the Mid North Sea Dome in the Middle Jurassic. Preservation of Lower Jurassic strata and depocenters of TMS-1 along the MBF at the eastern margin of the Central Graben indicates a main rift phase in TMS-1. The rift activity decreases then steadily beginning from TMS-1.3 to TMS-4.

Close-up of the Jurassic to Lower Cretaceous strata of the refection seismic profile of Fig. 5. Figure (a) shows the interpreted section from the base of the Lower Jurassic Altena Group to the base of the Lower Cretaceous Holland Group in the John Graben of the German Central Graben. Figure (b) shows the same section but without an interpretation overlay, only with arrows indicating the reflections of the interpreted horizons to illustrate their reflection characteristic.

Interpreted 2D seismic composite profile crossing studied well locations in the study area. The composite line runs roughly from SW to NE sub-parallel and close to the Coffee Soil Fault from the Dutch North Sea sector in in the SW crossing the German offshore sector towards the Danish sector in the NW. The line bypasses the salt structures of the region which are shown for example in Figs. 4 and 5. With the exception of the Clemens Graben and parts of the Profile in the Danish sector the profile crosses the structures predominantly at an unfavorable angle for structural interpretation. Along this composite line greates thicknesses of Lower Cretaceous are achieved in the Dutch Central Graben and the Clemens Graben both strongly reactivated during Late Cretaceous structural inversion. From the Dutch Central Graben towards the Clemens Graben in the German sector all of the investigated Jurassic to Cretaceous formations are preserved. Further north, on the other hand, some of the Upper Jurassic sub-formation are not distributed and large parts of the Middle and Lower Jurassic are eroded by Upper Jurassic unconformities. As in the Clemens Graben, the Danish part of the profile shows strongly increased thicknesses of the Oxfordian to Kimmeridgian (TMS-1.2 & TMS-1.3). Within the Clemens Graben, depending on the investigated seismic line, indications for a Middle and Lower Jurassic distribution can be found. No distribution is shown for this area in thickness and subsidence maps (Fig. 7) due to large uncertainties and lack of drilling evidence. North of well Thor-1 the composite line crosses the MCGTZ, which can be interpreted in this view as a complex up to 10 km wide wrench fault system.

Thickness and subsidence maps
The presented thickness and subsidence maps were created with Skua/Gocad (v.2019). On the base of horizon grids, originating from seismic interpretation, closed grids were created with grid mathematics to receive for every interpreted unit a top and base grid. Gridding artefacts and overlaps of the horizon grids were also finally eliminated by grid mathematic. However, especially in highly faulted areas and regions with steep dipping layers (e.g. diapir flanks), in some cases, generalisations were unavoidable. Among others, for 2D-Grid generation horizons with multi-Z-values were gridded along salt structures corresponding to neighbouring areas without multi-Z-values. In addition, because of less data quality and additional effects of interpretational bias, in structurally complex areas picking of horizons often did not have the necessary resolution to consistently map the structural complexity of the region with the same confidence level as areas with horizontally bedded sediments. In these cases, an interpretive gap closure was chosen that was as geologically consistent as possible but at the same time as easy to implement as possible. Furthermore, it has to be taken into account that a regional velocity model (Doornenbal et al., Reference Doornenbal, den Dulk, Thöle, Jähne-Klingberg, Britze and Jakobsen2021a) was used for the time to depth transformation, which is strongly smoothed in structurally complex areas to avoid artefacts in the depth model. This also leads to uncertainties in the determination of formation thicknesses in these regions if no well is available. All these influences on the imaging fidelity of the deeper subsurface were considered in the subsequent interpretation of the thickness distribution of studied formations.
Subsidence maps were created by including ages of the tectonostratigraphic mega-sequences from Bouroullec et al. (Reference Bouroullec, Verreussel, Geel, De Bruin, Zijp, Kőrösi, Munsterman, Janssen and Kerstholt-Boegehold2018). The calculation of the subsidence values is based on simplified assumptions (today’s thicknesses as reference, no 2D or 3D back-stripping). Compaction of sedimentary successions was not taken into account, which means that the calculated subsidence values often tend to be too low. Furthermore, the average was taken over the respective period of the considered tectonostratigraphic cycles. Thus, higher subsidence rates may have been achieved at times within the respective TMS-cycles. Areas of partial erosion were highlighted by putting eroded areas of the next sequence on top of the particular map (Figs. 8 and 9).
Thickness and subsidence maps reconstructed from the seismic interpretation. The gridded and depth converted results focus on important phases of the graben development. During the pre-rift phase (Altena Group) sediment distribution was rather uniform. Possibly local highs like the later Clemens basin area were later partly removed by the Mid-Cimmerian erosion. Rifting resulted in sedimentation close to the MBF and the basin axis (TMS-1.1 – TMS-1.2). But increasing halotectonics and decreasing rifting changed subsidence patterns to a more mini-basin-controlled style. During TMS-2, the northern Dutch Central Graben was the object of increased sedimentation.

Thickness and subsidence maps reconstructed from the seismic interpretation and gridding. The dominance of the northern Dutch Central Graben on sedimentation decreases in TMS-3. Halotectonics now replaced rifting as the dominating factor on deposition. The influence of salt tectonics increases during TMS-3 and still plays a role in TMS-4.1, until again a rather planar depositional system driven by thermal subsidence is established in the post-rift phase of TMS-4.2.

Well log correlation
The evident differences in the stratigraphic charts of the Dutch, German and Danish part of the southern Central Graben originate in a diachronous development of the Central Graben, in which Jurassic rifting started in the north and continued to the south. These locally different stages of basin evolution, as well as basin compartmentalisation due to salt tectonics and lateral differences in rifting history, resulted in lateral variations and changes in lithofacies. Therefore, we correlated wells from structural different locations within the Central Graben (Fig. 11).
Pillar maps of the study area. Figure (a) illustrates the distribution of sediments of the pre-rift phase of the Altena Group and of the early rift phase of TMS-1.1 as well as erosion due to the emergence of the Mid North Sea Dome (Mid Cimmerian Unconformity). Figure (b) illustrates the distribution of sediments of the rift phase from TMS-1.2 to TMS-2 and erosion / non-deposition due to local or regional uplift. The uplift is often related to halotectonics around the salt structures and to Late Cretaceous erosion. Figure (c) illustrates Uppermost Jurassic to Lower Cretaceous sediment distribution and corresponding erosion around salt structures due to either continuous diapirism during the Early Cretaceous or due reactivated halotectonics during the Late Cretaceous. (d) Map of the position of the study area in the southern North Sea.

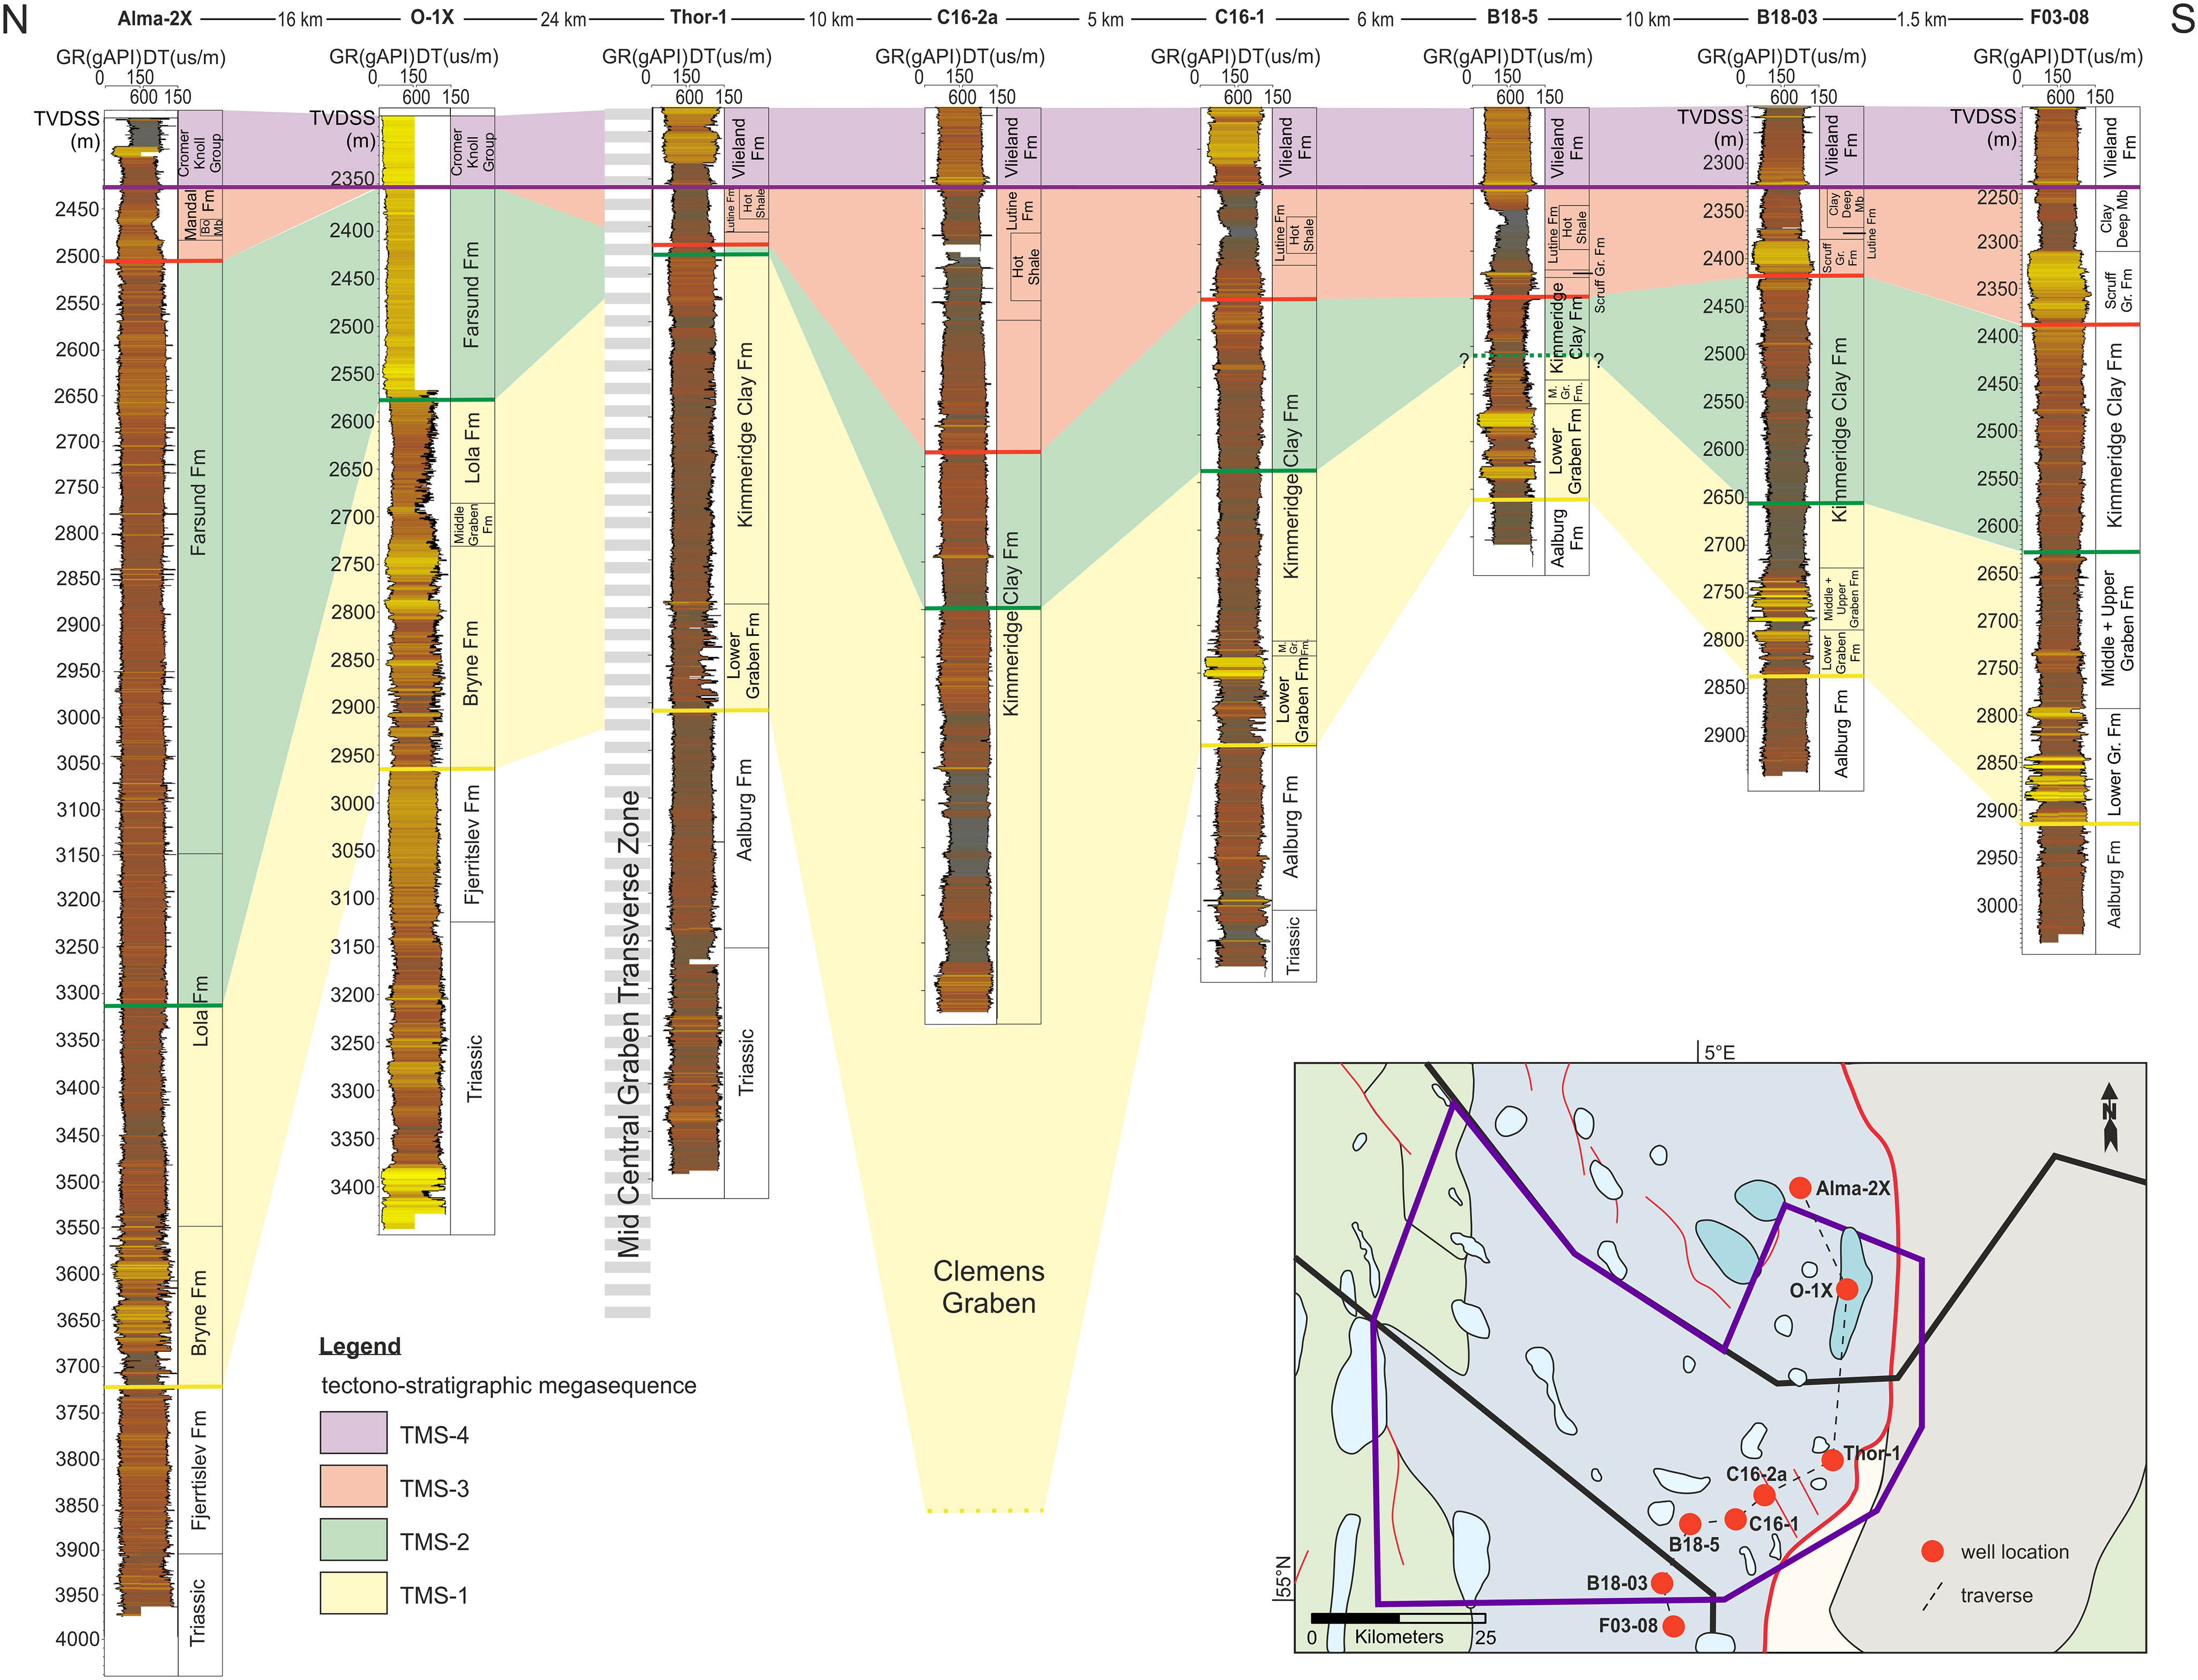
Well log correlation of two Danish, four German, and two Dutch wells within or near the study area (modified after Jakobsen et al., Reference Jakobsen, Britze, Thöle, Jähne-Klingberg, Doornenbal, Bouroullec and Verreussel2020a). The wells are leveled at the base of TMS-4. TMS-1 comprises the Danish Bryne and Lola Formation, the Dutch / German equivalents Lower, Middle, and Upper Graben Group, and the lower part of the Kimmeridge Clay Formation. It reaches its maximum thickness along the traverse in the area between the German wells Thor-1 and C16-2a. TMS-2 comprises the upper part of the Lola Formation and the Farsund Formation, respectively the upper part of the Kimmeridge Clay Formation. It is almost absent at the location of Thor-1 but significantly increases in thickness towards the north of the Danish part of the study area. At the base of TMS-3, The Scruff Greensand Formation is present in the northern Dutch Central Graben but flattens out in the southern German Central Graben. Also, the “Hot Shale” is prominent in the northern Dutch Central Graben, but its radioactivity, and thereby probably its organic content, diminishes towards the Danish-German border. At the Danish well O-1 it is absent, probably because of its location on a salt structure, but reappears again at the well Alma-2. For the legend of the overview map, see Fig. 1.
The palynological information (dinoflagellate cyst zonation) that was essential for the age determination of the TMS in the Dutch offshore was used to correlate the tectonostratigraphy of the Dutch Central Graben to the sequence stratigraphy of the Danish Central Graben by Jakobsen et al. (Reference Jakobsen, Britze, Thöle, Jähne-Klingberg, Doornenbal, Bouroullec and Verreussel2020a) (Table 2). The integration of both approaches revealed a close correlation between the Danish sequence and the Dutch tectonostratigraphic subdivisions.
Correlation of the sequence boundaries of Andsbjerg and Dybkjaer (Reference Andsbjerg and Dybkjær2003) of the Danish Central Graben with the tectonostratigraphy of Verreussel et al. (Reference Verreussel, Bouroullec, Munsterman, Dybkjær, Geel, Houben, Johannessen and Kerstholt-Boegehold2018) and Bouroullec et al. (Reference Bouroullec, Verreussel, Geel, De Bruin, Zijp, Kőrösi, Munsterman, Janssen and Kerstholt-Boegehold2018). The correlation is based on LOD (last occurrence datum) Dinocyt events determined in these studies and modified from Jakobsen et al. (Reference Jakobsen, Britze, Thöle, Jähne-Klingberg, Doornenbal, Bouroullec and Verreussel2020a).

Based on the comparison of the depositional units of the Dutch and the Danish Central Graben, the Dutch tectonostratigraphic nomenclature could be assigned approximately to the Danish sequence boundaries. The lower boundary of the Bat-1 sequence and of TMS-1, the base of the Kimm-2 sequence and the top of TMS-1, as well as the top of the sequence Ryaz-1 and of the base of TMS-4 correlate well based on the dinocyst events (Table 2). However, the base of TMS-3 correlates to the middle to upper part of sequence Volg-4, which is evidenced by the LOD of Egmontodinium polyplacophorum (approximately base TMS-3) and the LOD of Dichadogonyaulax pannea (approximately top TMS-2). Thus, the correlation between TMS-3 and the sequence Volg-4 has a higher uncertainty. Neither palynological data nor a detailed stratigraphy is available for offshore Germany.
Eight wells, each one presented by a GR and a DT log, were chosen for well log correlation. The eight wells extend from the northern Dutch Central Graben in the south (F03-08 and B18-03), across the German Central Graben (B-18-5, C-16-1, C-16-2a and Thor-1) and into the Salt Dome Province of the southern Danish Central Graben in the North (O-1X, Alma-2X, at which Alma-2X is located outside of the area of investigation (Fig. 3). To transfer the results of the mapping of the tectonostratigraphic mega-sequences to the well logs, synthetic seismograms based on gamma ray (GR) and sonic (DT) logs were used. In some cases, also available density logs were used.
Results
Seismic interpretation and gridding
The mapping of nine Jurassic to Lower Cretaceous horizons illustrates the tectonic and sedimentary evolution of the German Central Graben and adjacent areas. The mapped horizons include the base and top horizons of the defined tectonostratigraphic mega-sequences. We created two geological cross-sections based on depth converted seismic transects (Fig. 4 to Fig. 7) that cover the south and the centre of the study area. Twelve thickness maps were constructed that comprise the pre-rift state of the Lower Jurassic Altena Group to the post-rift state of the Lower Cretaceous Holland Group (Figs. 8 and 9). The results that are shown in these figures are described and interpreted in this section.
Pre-rift (Altena Group)
Description
The pre-rift Altena Group consists of marine claystones of the Sleen Formation, the Aalburg Formation, the Posidonia Formation and the Werkendam Formation or their Danish equivalents. Its thickness is relatively constant in the areas of the John Graben, the Johannes Graben and along the Schillgrund Fault or the Coffee Soil fault, respectively, with thicknesses of about 400 m (Fig. 8). In the northern Dutch Central Graben, the thickness increases towards the centre of the graben and reaches up to 800 m. The subsidence rates commonly range between 5 and 10 m/Ma, with the highest subsidence rates in the northern Dutch Central Graben and along the MBF (Fig. 8). Sediments of the Altena Group are absent around the Clemens Graben and in most of the Clemens Basin, as well as in the west of the Dutch part of the study area. The thickness of the group decreases towards the study area.
Interpretation
The relatively constant thicknesses in large parts of the study area are due to the uniform depositional environment and relative tectonic quiescence during the deposition of the Altena Group (Pharaoh et al., Reference Pharaoh, Dusar, Geluk, Kockel, Krawczyk, Krzywiec, Scheck- Wenderoth, Thybo, Vejbæk, Van Wees, Doornenbal and Stevenson2010). However, the symmetrical style of the depocenter at the centre of the northern Dutch Central Graben indicates salt withdrawal to the margins in this phase (Figs. 4 and 8). The asymmetric thickness pattern in the John Graben and increased thicknesses and subsidence along the MBF indicates fault activity. Primary thicknesses are preserved in the deeper parts of the later Central Graben, namely the northern Dutch Central Graben, the Johannes Graben, the John Graben and areas at the eastern MBF of the Central Graben. Absence or thinning of the Altena Group is the result of later erosion due to the emergence of the Mid North Sea Dome, the rise of salt structures or Cretaceous structural inversion. Proven occurrences of the Posidonia Shale Formation are described from the northern Dutch Central Graben, whereas the presence of the Posidonia Shale Formation is assumed for the southern part of the German Central Graben (Müller et al., Reference Müller, Arfai, Jaehne-Klingberg, Bense and Weniger2020). There are no obvious indications for the diapirism and the development of basins related to diapiric growth in the German part of the Central Graben before Mid-Jurassic.
TMS-1
Description
The subsidence map of TMS-1 Total integrates the subsidence rates of the subsections TMS-1, namely TMS-1.1 (Central Graben Subgroup), TMS-1.2 (Lower Kimmeridge Clay Formation) and of TMS-1.3 (intra Kimmeridge Clay Formation) (Fig. 8). The subsidence rates in the study area are significantly higher than those of the Altena Group, with the highest subsidence rates up to max. 150 m/Ma in the northern Dutch Central Graben, the John Graben, along the eastern MBF of the Central Graben and within the Clemens Graben and Basin. The MCGTZ separates the area into a northern part with the John Graben, the Clemens Basin and the southern Salt Dome Province as depocenters and a southern part with the Clemens. Graben and the northern Dutch Central Graben and along the Schillgrund Fault as depocenters. Subsidence rates and sediment thicknesses are generally higher north of the MCGTZ. Sediments of TMS-1.1 are absent in the western part of the study area within the Step Graben (Fig. 5), at large parts of the border area of the German and Dutch Central Graben and around the later Clemens Graben and Clemens Basin (Fig. 8). Depocenters of TMS-1.1 are the northern Dutch Central Graben and the centre of the John Graben with thicknesses up to 800 m. The Johannes Graben connects the Dutch Central Graben with the northern German part of the study area. The depositional pattern changed during TMS-1.2. The northern Dutch Central Graben and the John Graben, as well as the areas along the eastern MBF of the Central Graben, remained depocenters. New depocenters emerged in the Clemens Graben and Clemens Basin along NNW-SSE trending faults and the Danish Central Graben experienced increased sedimentation. In TMS-1.3, sediments in the transition from the northern Dutch Central Graben towards the John Graben along the Johannes Graben are absent, as well as sediments along the line “Belinda” to “Carola” in the centre of the study area. The relative thickness of sediments along the eastern MBF of the Central Graben decreases. Depocenters remained the northern Dutch Central Graben, the John Graben and the Clemens Graben and Basin and its extension in the Danish Salt Dome Province.
Interpretation
The depocenters of TMS-1 are predominantly determined by rifting and fault activity. They are either located along the eastern MBF or along roughly NNW-SSE trending faults that exist in the pre-Zechstein basement. TMS-1-1 represents the first sediments in the area after the collapse of the Mid North Sea Dome and after the initiation of the main rift activity. The sediments are restricted to the deeper parts of the former paleo-topography that are determined by the activity of the Schillgrund and Coffee Soil Fault at the eastern boundary of the Central Graben and by the activity of NNW-SSE trending faults of the John Graben, the Johannes Graben and other sections of the northern Dutch Central Graben. The areas around the later Clemens Graben and Basin and north-east of the Dutch Central Graben were probably topographic highs and no sediment accumulation took place. The coastline and deposition of marine sediments advanced from north to south along the Johannes Graben that formed a connection between the Danish-German and the Dutch part of the Central Graben (Fig. 8). In TMS-1.2, fully marine conditions were established in most of the study area and the Clemens Graben and the Clemens Basin appeared as depocenters due to continuing N-S trending fault activity. The Clemens Graben presumably developed as a kind of pull-apart basin between the Mid-Central Graben Transverse Zone and the MBF. During the deposition of TMS-1.2, rifting of the Central Graben climaxed, which is indicated by relatively high sediment thickness and high subsidence rates along the MBF as well as by decreasing thicknesses within TMS-1.3. Also, fault activity along the John Graben and the Clemens graben climaxed during TMS-1.2 and TMS-1.3, resulting in increased thicknesses. Even though rifting was the main factor for the creation of accommodation space during TMS-1, the increasing influence of salt withdrawal and the growth of salt structures is evident. From TMS-1.1 to TMS-1.3, the depocenters of the northern Dutch Central Graben and the John Graben shifted towards the salt structures on their western flanks, sedimentation around the Danish salt structures increased, and a salt pillow developed offshore Denmark between the salt structures on its western and the Coffee Soil Fault on its eastern flank. depocenters related to salt structures developed in the Danish part of the study area in TMS-1.2 and there are subtle indications around the Barbara and Belinda salt structures. The syntectonic, persistent or reoccurring fault activity was probably the main cause of salt movement and the redistribution of the salt. The salt structures ‘Belinda’, ‘Britta’, ‘Barbara’, ‘Carola’ developed probably along a major strike-slip to oblique fault (Mid Central Graben Transverse Zone; MCGTZ), in some places at crossing points with other normal faults, e.g. at the location of the salt structure ‘Carola’. Withdrawal of salt from underneath of a potential former high in the Clemens Basin area, triggered by the renewed tectonic activity, possibly led to the development of the Clemens Basin. Besides the obvious relation between basement faults and salt redistribution, the faults are mostly not traceable. The German Central Graben is divided by the MCGTZ and the Johannes Fault into a northern and a southern part. The division is expressed by higher subsidence rates and sediment thickness, both within the sub-basins and in general, north of the MCGTZ (8). This northern part includes the John Basin, the Clemens Graben and the southern part of the Tail End Graben and belongs geologically rather to the Danish Central Graben. The southern part is characterised by lower subsidence rates and a lower sediment thickness during TMS-1.2 and TMS-1.3. It comprises the northern Dutch Central Graben, the Clemens Graben and the areas along the Schillgrund Fault. Geologically, it rather belongs to the Dutch Central Graben.
TMS-2
Description
Most of the sedimentation during TMS-2 occurred in the northern Dutch Central Graben, with thicknesses up to 1600m in most part of the sub-basin, whereas in the rest of the investigated area thicknesses are rarely higher than 200 m (Fig. 8). The subsidence in the northern Dutch Central Graben is very high with up to 200 m/Ma, compared to mostly less than 50 m/Ma in the remaining study area (Fig. 4). There was only slightly increased subsidence in the John Graben and along the MBF. The depocenter offshore The Netherlands shifted towards the NW and loops around the salt wall B17-SOUTH1. Increased sediment thicknesses are also recorded around the salt structures ‘Britta’ and ‘Belinda’, the Clemens Graben and Basin and the John Graben with thicknesses around 300 m. In most other parts of the study area, e.g. along the MBF, the sediment thickness is relatively low with about 100 m. Sediments in the area between the John Graben and the Mads Graben as well as the Danish Rosa Graben are absent.
Interpretation
The NW-SE trending depocenters of the northern Dutch Central Graben, the John Graben and the study area’s extension of the Mads Graben are probably related to NNW-SSE trending faults in the pre-Zechstein basement. Decreased thicknesses along the MBF, however, indicate a ceasing activity of the MBF. The high subsidence rates in the Dutch Central Graben in comparison with the relatively low subsidence rates in the German and Danish part of the graben indicate an independent development of southern and northern Central Graben during this period. Increased thicknesses around salt structures indicates an increase of salt remobilisation and of diapirism (Figs. 4 and 5) and the developing of rim synclines. With begin of the deposition of TMS_3, halotectonics seem to have a greater impact than rifting on the position of the depocenters near the salt structures B17-South1 and Belinda North.
TMS-3
Description
The dominance of the northern Dutch Central Graben as the main depocenter of the study area declined significantly during the deposition of TMS-3.1 and even further during the deposition of TMS-3.2 but remains the area with the thickest TMS-3.1 succession (Fig. 9). The subsidence in the northern Dutch Central Graben is increased around the salt structure ‘B17-SOUTH1’ in a NW-SE direction; however, the highest subsidence rates occur south of the salt structure ‘Carola’. Other sites of deposition were the John Graben, where the depocenter moved further towards the salt structure ‘Belinda’, the Clemens Graben and Clemens Basin are, as well as the western flank of Belinda (North and South), the southern flank of Barbara, the area between salt domes, namely between Birgit and Belinda North (Johannes Graben), between Belinda South and Britta, between Britta and Barbara and between the two southern Danish salt domes. Sediment thicknesses along the MBF are not increased and sediment thicknesses in general are low in comparison with the previous TMS-2. The subsidence rate in the study area decreased from TMS-2 to TMS-3, within the northern Dutch Central Graben even significantly from max. 200 m/Ma to max. ∼60 m/Ma.
Interpretation
Within TMS-3, the influence of rifting on the subsidence pattern further decreased in favour of salt tectonics, which is indicated by the location of the depocenters in the close vicinity of salt structures. Fault activity seems to have been low, except for the MCGTZ and the faults of the Clemens Graben. Subsidence within the Clemens Basin, however, seems to relate to salt withdrawal towards ‘Bruni’ and towards the southern Danish salt structures. Low sediment thicknesses along the MBF fault also indicate a further decrease in rifting activity. Deposition around salt structures or salt anticlines as well as erosion on local highs dominate the study area, resulting in a complex subsidence and thickness pattern.
TMS-4 and Holland Formation (Lower Cretaceous)
Description
The depocenters of TMS-4 are mainly located around the salt structures, except for the Clemens Graben. The main centres of subsidence are two roughly NNW-SSE trending areas: One from the salt structure ‘Belinda’ to the Dutch Central Graben and the other stretch from the two southern Danish salt domes ‘Tove’ and ‘Vagn’ to the Clemens Graben. The subsidence rates, though, decreased significantly to max. 16 m/Ma. In contrast to TMS-3, former areas of erosion or non-deposition, like parts of the Dutch Step Graben in the west of the salt wall B17-SOUTH1, areas west and north of Belinda and parts of the Schillgrund High became now covered by sediments (Fig. 5). The thicknesses of the subsequent Holland Formation are relatively uniform, with exception of increased thicknesses up to 160 m in the northern Dutch Central Graben. The average thickness of the Holland Formation is relatively low (less than 40 m).
Interpretation
The influence of salt tectonics on subsidence remained dominant in TMS-4, indicated by the depocenters around the salt structures, but ceased in the Early Cretaceous and thermal contraction and compaction became the main drivers of subsidence. Except for the faults of the Clemens Graben and potentially the MCGTZ, there are no apparent signs of fault activity. Sedimentation on former highs outside the main rift like in the west of the Dutch salt wall B17-SOUTH1 indicates a further decrease or cease in rift activity (Fig. 4). The main control on the depocenter in the northern Dutch Central Graben, oriented WNW-ESE, seems to have been salt withdrawal towards the salt structures. The sustained folding of the northern Dutch depocenter around the salt structure B17-SOUTH1 indicates its progressive growth and impact. The thereby developed depocenter ruptures the trend of the Johannes Fault and its Dutch extension. Influence from fault activity, e.g. the prolongated Johannes Fault or the MCGTZ is minor but still can be determined by a lateral shift of the depocenter over the time interval (Fig. 4). During the deposition of the Holland Formation salt tectonics considerably ceased. Subsidence was now mainly driven by thermal subsidence, replacing the earlier differentiated system with the main impacts of rifting and salt tectonics. Salt structure related depocenters east of ‘Belinda’ or along the Johannes Fault were still active during TMS-4 but ceased mainly during deposition of the Holland Formation.
Pillar maps
Pillar maps were created by superimposing chronologically successive horizons that illustrate the structural evolution regarding preservation, non-deposition and erosion in the study area. We provide maps of the pre-rift, syn-rift and main post-rift phase. The map of the pre-rift phase compiles the maps of the Lower Jurassic Altena Group and of TMS-1.1 (Fig. 10). It shows that deep subsided areas at the axis of the graben, like the John and Johannes Graben and the Dutch Central Graben, but also areas in the hanging wall of the MBF fault, were unaffected by erosion. Areas in the footwall of the MBF, outside the graben axis and the area of the Clemens Graben and Clemens Basin, though, were eroded. The erosional event that significantly affected the Altena Group was the emergence of the Mid North Sea Dome in the central North Sea that resulted in the Mid Cimmerian Unconformity. However, the relief of the study area was presumably differentiated with former lows and highs like the later Clemens Graben and Basin, where potentially erosion took place. The sediments of TMS-1.1 were deposited after the collapse of the Mid North Sea Dome. Fig. 10b compiles the maps of TMS-1.2, TMS-1.3 and TMS-2. It illustrates the deposition and preservation of marine claystones of the Kimmeridge Clay formation and equivalents during the main rift phase. During this phase, sediments were mainly deposited in the graben centre and less on the shoulders of the graben system. Fig. 10c compiles the maps of TMS-3.2, TMS-4 and of the Holland Formation. It shows that areas around the salt domes were subject to erosion. Either due to ongoing diapirism in the Early Cretaceous or due to regional uplift and renewed diapirism during the Late Cretaceous structural inversion (grey, orange and green areas in Fig. 10c). Areas especially at the western Central Graben boundary in transition to the Step Graben system, but also along the Coffee Soil Fault in the east, show strong erosion and re-distribution of sediments probably during the Late Cretaceous structural inversion.
Well log correlation
Well-log correlation with tectonostratigraphic units provides lithologic control (Fig. 11). Differences in lithology within the same sequence were identified and visualised in a time-stratigraphic panel (Fig. 12).
Time-stratigraphic panel of the study area along the cross section shown in Fig. 9 (modified after Jakobsen et al., Reference Jakobsen, Britze, Thöle, Jähne-Klingberg, Doornenbal, Bouroullec and Verreussel2020a). The figure visualizes the TMS cycles and the associated Dutch, German, and Danish lithostratigraphy.

Each well is presented by a GR and a DT log. The national lithostratigraphic nomenclature is used in each panel (Jakobsen et al., Reference Jakobsen, Britze, Thöle, Jähne-Klingberg, Doornenbal and Vis2020b), and the wells were correlated using the tectonostratigraphic nomenclature of Bouroullec et al. (Reference Bouroullec, Verreussel, Geel, De Bruin, Zijp, Kőrösi, Munsterman, Janssen and Kerstholt-Boegehold2018) and Verreussel et al. (Reference Verreussel, Bouroullec, Munsterman, Dybkjær, Geel, Houben, Johannessen and Kerstholt-Boegehold2018).
Within the Danish Salt Dome Province, represented by the wells Alma-2X and O-1X, the lower part of TMS-1 comprises the upper half of the Bryne Formation (Fig. 11). The Bryne Formation was deposited in an estuarine and fluvial environment and consists of interbedded sand- and mudstones (Andsbjerg, Reference Andsbjerg2003; Michelsen et al., Reference Michelsen, Nielsen, Johannessen, Andsbjerg and Surlyk2003; Mellere et al., Reference Mellere, Mannie, Longhitano, Mazur, Kulausa, Brough and Cotton2017; Fig. 2). The different lithologies can be identified by their log response. Sandstones feature considerably lower gamma-ray responses than the mudstones. A few (rare) intercalated coal beds are represented by a distinctly low velocity in combination with a low gamma-ray response (e.g. at the top of the Bryne Formation at well Alma-2X). In the northern well, Alma-2X, the Bryne Formation is overlain by the Lola Formation, which lower half forms the upper part of TMS-1 around the well (Fig. 2). The Lola formation consists of open marine mudstones, which are recognised as relatively constant and high gamma-ray responses and low velocity sonic responses, rarely intermitted by low gamma-ray and low velocity log responses of interbedded dolomites or limestones. In the southern part of the Salt Dome Province, represented by well O-1, the Bryne Formation is overlain by the Middle Graben Formation, which was deposited in a coastal swamp environment (Michelsen et al., Reference Michelsen, Nielsen, Johannessen, Andsbjerg and Surlyk2003; Fig. 2). It consists mostly of mudstones that are interbedded with coarser grained sediments. Again, the Lola Formation, which thickness is significantly reduced, forms the upper part of TMS-1. In the German wells (Thor-1, C16-1 and B18-5), the Lower Graben formation forms the lower part of TMS-1. The Lower Graben Formation represents the onset of sedimentation after the Mid Cimmerian Unconformity with alluvial plain deposits (Herngreen et al., Reference Herngreen, Kouwe and Wong2003). Its log characteristic and interpreted lithology alters from north to south. In the north, represented by well Thor-1, the gamma-ray response of the Lower Graben Formation is relatively constant and high with a few lower gamma-ray peaks. The sonic log, though, is rather diversified with distinct high and low velocity peaks. The corresponding lithology is interpreted as mudstone, interbedded with siltstones and sandstones, e.g. at the upper boundary to the Kimmeridge Clay Formation, and coal beds. To the south, visible in well C-16-1 and B18-5, the sand volume and the thickness of sandstones increases significantly. These sandstone bodies are shown as low gamma-ray and relatively high velocity log responses. In both wells, the Lower Graben Formation is overlain by the Middle Graben Formation, which shows a spiky gamma-ray and sonic log pattern, which is interpreted as an alternation of thin mud-, silt- and sandstones, interbedded with coal beds. The Middle Graben Formation reflects a shift to a lake- and swamp-dominated depositional environment (Herngreen et al., Reference Herngreen, Kouwe and Wong2003; Verreussel et al., Reference Verreussel, Bouroullec, Munsterman, Dybkjær, Geel, Houben, Johannessen and Kerstholt-Boegehold2018). In the Dutch Central Graben (B18-03), the Lower and Middle Graben Formation is accompanied by the Upper Graben Formation, which was formed in a coastal environment (Herngreen et al., Reference Herngreen, Kouwe and Wong2003). In this area, the three formations that form the Central Graben Subgroup consist of an alternation of mud- and sandstones of various thicknesses, whereas the Middle Graben Formation almost completely consists of mudstone. These interbedded mud- and sandstones are characterised by relatively high and low gamma-ray and velocity log responses. The upper part of TMS-1 in the German as well as in the Dutch Central Graben area is formed by the lower part of the Kimmeridge Clay Formation, which shows a rather constant relatively high gamma-ray and low velocity log response (Figs. 2 and 11). Rare, thin low gamma-ray / high velocity log response peaks are interpreted as intercalated dolomite or sandstone beds with calcareous cementation.
TMS-2 starts in the Danish Central Graben with the upper half of the Lola Formation (Alma-2X), whereas in the south it starts with the younger Farsund Formation (O-1X) (Fig. 11). The Farsund Formation was deposited in a deep marine environment and mainly consists of calcareous claystones (Fig. 2). In Alma-2, the Farsund Formation is interbedded with thin dolomite or limestone beds, which appear as thin low gamma-ray and high velocity log responses in an otherwise relatively high gamma-ray and relatively low velocity log response background (Fig. 11). The dolomite-spikes are missing in the other wells, presumably due to a location nearer to the basin margin. In the German and Dutch Central Graben, TMS-2 is exclusively composed of the above mentioned Kimmeridge Clay Formation, which mainly consists of mudstones with a few interbedded dolomites or sandstones, as e.g. at the top of TMS-2 of well B-18-05. Notable is the significant thickness reduction in the well Thor-1 (Fig. 11).
In Alma-2 of the Danish Central Graben, TMS-3 consists of mudstones of the uppermost Farsund Formation, in which the high gamma-ray mudstones of the Bo Member occur (Figs. 2 and 11). Further in the south of the Salt Dome Province, in well O-1X, TMS-3 is not present due to erosion that is caused by salt tectonics. In the German Central Graben, TMS-3 includes the uppermost Kimmeridge Clay Formation and the Lutine Formation with its Hot Shale section. The high gamma-ray response of the Hot Shale (Lutine Formation) increases steadily and significantly from the north to the south into the Dutch Central Graben (Fig. 11). TMS-3 reaches its greatest thickness with about 250 m in the Clemens Graben (well C-16-2a). In the Dutch offshore, at the base of TMS-3, the Scruff Greensand Formation is present, which consists of thick sandstones that features a blocky, low gamma ray and high velocity log response (Fig. 11). The sandstones are overlain by the high gamma ray Hot Shale (“Clay Deep Member” in the Dutch nomenclature) of the Lutine Formation (Figs. 2 and 12). The thickness of the Scruff Greensand Formation decreases significantly to the north inside the German Central Graben. Only a thin succession of the Scruff Greensand (about 10 m) is present in well B-18-05 and none in well C-16-01 (Fig. 11). However, low gamma ray and high velocity log responses near the base of TMS-3 and around the Hot Shale section of the Lutine Formation of well C-16-2a in the Clemens Basin are interpreted as a thin (less than 10 m) sandstone body.
The Lower Cretaceous sediments of the wells consist of mudstones of the Vlieland Claystone Formation or the Cromer Knoll Group, respectively.
Discussion
Up to now, various national lithostratigraphic (Van Adrichem Boogaert & Kouwe, Reference van Adrichem Boogaert and Kouwe1993; Michelsen et al., Reference Michelsen, Nielsen, Johannessen, Andsbjerg and Surlyk2003), tectonotratigraphic (Bouroullec et al., Reference Bouroullec, Verreussel, Geel, De Bruin, Zijp, Kőrösi, Munsterman, Janssen and Kerstholt-Boegehold2018; Verreussel et al., Reference Verreussel, Bouroullec, Munsterman, Dybkjær, Geel, Houben, Johannessen and Kerstholt-Boegehold2018) and sequence stratigraphic (Andsbjerg & Dybkjaer, Reference Andsbjerg and Dybkjær2003) concepts exist for the Dutch and Danish parts of the Central Graben that hampers basin-wide correlation of sedimentary successions, especially because not much research on the fill and evolution of the German Central Graben has been carried out so far. For offshore Germany, traditionally a different chrono- or allostratigraphic approach is used (e.g. Arfai & Lutz, Reference Arfai and Lutz2017). In the following, we will bring together different approaches from the Dutch and Danish Central Graben and integrate our results. Additionally, we will discuss the interdependent role of rifting and salt tectonics for the evolution of the southern Central Graben as well as the influence of tectonics on the (litho-)stratigraphy in the study area.
Pre-rift (Altena Group)
The Early Jurassic has been commonly described as a period of relative tectonic quiescence, between rifting events in the Triassic and the Middle to Late Jurassic (Cartwright, Reference Cartwright1991; Coward et al., Reference Coward, Dewey, Hempton and Holroyd2003; Husmo et al., Reference Husmo, Hamar, Høiland, Johannessen, Rømuld, Spencer and Bathurst2003). Wong (Reference Wong, Wong, Batjes and De Jager2007) pictures the Early Jurassic sedimentation as a very uniform blanket and Andsbjerg & Dybkjaer (Reference Andsbjerg and Dybkjær2003) regard the relatively homogenous thickness of the Lower Jurassic successions recorded in Danish wells as an indication for a uniform subsidence history for most of the Early Jurassic within the Danish Central Graben. In a tectonically quiet depositional environment without significant differential subsidence, we would assume an approximately constant original thicknesses (without erosion). During the Middle to Late Jurassic transition, significant erosion took place in the area of the Central Graben, caused by the Mid North Sea Doming event (Underhill & Partington, Reference Underhill and Partington1993), as it is also apparent in the pillar map of the Lower Jurassic pre-rift sediment distribution (Fig. 10a). However, there are considerable thickness differences in areas that were unaffected by the Mid Cimmerian erosion, e.g. the parts of the northern Dutch Central Graben and areas along the MBF (Figs. 8 and 10). Our observation of thickness variations is in accordance with Van Winden et al. (Reference van Winden, de Jager, Jaarsma and Bouroullec2018), who noticed a thickening of the Lower Jurassic Altena Group towards the centre of the Dutch Central Graben. These variations in thickness may result from differential tectonic activity in the Early Jurassic. The Central Graben already experienced a first phase of major tectonic activity in the Late Triassic (Jähne-Klingberg et al., Reference Jähne-Klingberg, Bense and Warsitzka2018). Also, we presume that the Clemens Basin and Clemens Graben constituted a topographic high in the Early Jurassic, indicated by the absence of Lower Jurassic sediments and erosional truncation of the Upper Triassic sediments in the area (Fig. 5 to Fig. 7). This high was then inverted to a topographic low in the Late Jurassic because of fault activity and salt withdrawal (Figs. 13 and 14). The division of the study area by the MCGTZ may also have a significant influence on the stratigraphy and petroleum geology (Fig. 13). Confirmed and prolific deposits of the Posidonia Shale Formation occur in the northern Dutch Central Graben and potentially in the southern German Central Graben (Ineson et al., Reference Ineson, Bojesen-Koefoed, Dybkjær and Nielsen2003; Müller et al., Reference Müller, Arfai, Jaehne-Klingberg, Bense and Weniger2020). The presence of the most important source rock for hydrocarbons in the southern Central Graben, the Posidonia Shale Formation, is limited to areas south of the MCGTZ, in areas with the highest subsidence rates of the Altena Group. However, the subsidence rates are rather low, compared to the subsequent investigated intervals of TMS-1 and TMS-2. (Fig. 8). North of the MCGTZ, there is no known Posidonia Shale Formation. It was assumed to have been eroded during the Mid-Cimmerian uplift (Damtoft et al., Reference Damtoft, Andersen, Thomsen, Brooks and Glennie1987). However, the pillar maps show clearly that large areas around the John Graben and in the Danish part of the study area were unaffected by later erosion (Fig. 10). Also, there are no indications for erosion, or the presence of the Posidonia Shale Formation on the reflection seismic data (see John Graben in Figs. 5 and 6). This may be the result of a hiatus that is not resolvable. Other explanations are that the anoxic conditions were restricted to the areas south of the MCGTZ or that in the areas north of the MCGTZ an increased terrestrial and siliciclastic input attenuated the marine organic matter in the formation.
Illustrates the depocenters and most prominent faults within or in the vicinity of the study area for the TMS. During deposition of TMS-1 N-S trending faults were active and sediment depocenters were located at the axis of the graben structures and along the main eastern boundary fault of the Central Graben. During deposition of TMS-2, NNW-SSE trending faults were active and depocenters were oriented along these faults but also shifted towards the rising salt structures. The main eastern boundary fault of the Central Graben became less significant for the subsidence in the study area. In TMS-3 and TMS-4 rifting decreased and salt tectonics dominated subsidence. A roughly W-E trending strike-slip fault with normal fault tendencies (MCGTZ) was probably active during deposition of TMS-1 to TMS-4. The figure is compiled and modified from Cartwright (Reference Cartwright1987), Møller and Rasmussen (Reference Møller and Rasmussen2003), Arfai et al. (Reference Arfai, Jähne, Lutz, Franke, Gaedicke and Kley2014).

(a) Interpolation of the initial Zechstein salt thickness in and around the study area. Modeled from data from Smith et al., (1993) and ten Veen et al. (Reference ten Veen, van Gessel and den Dulk2012). The presumed initial thickness of the salt reaches a maximum thickness of around 1000m in the area of the German and the northern Dutch Central Graben and decreases towards the Danish graben part. (b) Today’s thickness of the Zechstein salt in and around the study area (based on Thöle et al., Reference Thöle, Jähne-Klingberg, Doornenbal, den Dulk, Britze and Jakobsen2021). Salt thicknesses of up to 6000 m are reached in the diapirs of the region.

TMS-1
At the transition from the Aalenian to the Bajocian, sedimentation recurred to the Central Graben, propagating from the north to the south due to the renewed rifting following the thermal doming in the early Middle Jurassic (Andsbjerg & Dybkjaer, Reference Andsbjerg and Dybkjær2003). At first, a terrestrially dominated environment developed with fluvial deposits of the Bryne Formation in the Danish Central Graben (Michelsen et al., Reference Michelsen, Nielsen, Johannessen, Andsbjerg and Surlyk2003; Mellere et al., Reference Mellere, Mannie, Longhitano, Mazur, Kulausa, Brough and Cotton2017). Its base is the equivalent of the base of TMS-1 offshore Denmark. This period of the initiation of syn-rift subsidence corresponds to phase 3 of basin evolution of Andsbjerg and Dybkjaer (Reference Andsbjerg and Dybkjær2003). Rifting of the Dutch Central Graben started again a few million years later in the Late Callovian and is expressed by the deposition of fluvial and deltaic sediments of the Lower Graben Formation (Figs. 2, 11, and 12). Younger sedimentary equivalents were deposited further south of the Dutch Central Graben, outside our study area, in form of the Friese Front Formation. Estuarine and lacustrine deposits of the Middle Graben Formation follow the fluvial deposits. Subsequently, marine conditions re-established in the southern Central Graben, starting with shoreface and lagoonal deposits of the Danish Lulu Formation in the Callovian and of marginal marine sediments of the Dutch Upper Graben Formation at the earliest Late Oxfordian (Michelsen et al., Reference Michelsen, Nielsen, Johannessen, Andsbjerg and Surlyk2003; Bouroullec et al., Reference Bouroullec, Verreussel, Geel, De Bruin, Zijp, Kőrösi, Munsterman, Janssen and Kerstholt-Boegehold2018; Verreussel et al., Reference Verreussel, Bouroullec, Munsterman, Dybkjær, Geel, Houben, Johannessen and Kerstholt-Boegehold2018). The results of our mapping (TMS1-1 thickness map) indicate that the transgression propagated from the Danish to the Dutch Central Graben along the axis Rosa Basin – John Basin – Johannes Basin – northern Dutch Central Graben (Fig. 8). At the top of TMS-1, fully marine conditions existed in large areas of the Danish Central Graben at the Callovian-Oxfordian transition (Lola Formation; Andsbjerg & Dybkjaer, Reference Andsbjerg and Dybkjær2003). This transgression is attributed to another rift-pulse (phase 4 of Andsbjerg and Dybkjaer, Reference Andsbjerg and Dybkjær2003; Table 2). Open marine conditions reached the Dutch Central Graben at the Late Oxfordian – Early Kimmeridgian, which is expressed by the deposition of the Kimmeridge Clay Formation (Fig. 11).
In the study area, TMS-1 and its subdivisions reflect this sedimentary development. Terrestrial and marginal marine sediments of the Bryne and Middle Graben Formations in the Danish Salt Dome Province and of the Lower, Middle, and Upper Graben Formations in the German and Dutch Central Graben are overlain by marine mudstones of the Lola and Farsund Formation in the Danish and by marine mudstones of the Kimmeridge Clay Formation in the German and Dutch Central Graben (Fig. 11).
The depocenters in this period were in the vicinity of the MBF, as well as in the centre of the sub-basins, e.g. the John Graben, the Clemens Basin and the Clemens Graben (Figs. 8 and 13). These depocenters, as well as the development of the Clemens Graben and Basin, indicate the dominance of rifting on subsidence patterns. However, the influence of salt tectonics increased steadily from TMS-1.1 to TMS-1.3, which can be recognised by increasing subsidence around salt domes, e.g. around the Johannes Basin and within the southern Salt Dome Province (Fig. 8). The decreasing sediment thickness from TMS-1.2 to TMS-1.3 along the MBF of the eastern Central Graben margin as well as the decreasing thickness trend of TMS-1.3 along the MBF indicate that the shift from rift-dominated subsidence towards salt-dominated subsidence, in combination with local uplift and erosion, took place within this time (Fig. 8). The subdivision of the German Central Graben by the MCGTZ into a southern part, rather belonging to the Dutch Central Graben, and a northern part, rather belonging to the Danish Central Graben is expressed by differences in subsidence rates and sediment thicknesses. In the Dutch Central Graben, the deposition of TMS-1 is rather limited to the graben axis (Bouroullec et al., Reference Bouroullec, Verreussel, Geel, De Bruin, Zijp, Kőrösi, Munsterman, Janssen and Kerstholt-Boegehold2018; Verreussel et al., Reference Verreussel, Bouroullec, Munsterman, Dybkjær, Geel, Houben, Johannessen and Kerstholt-Boegehold2018; Fig. 13). This depositional pattern is likely related to salt withdrawal beneath the basin axis, where elongated salt structures developed (Van Winden et al., Reference van Winden, de Jager, Jaarsma and Bouroullec2018; Fig. 14). While the northern Dutch Central Graben conforms to this pattern, the depocenters along the MBF correspond to the generally asymmetric half-graben style of the Central Graben (Fig. 13). Single sub-basins as the Clemens Graben south and the Clemens Basin north of the MCGTZ are developed rather symmetrically (Figs. 8 and 13). The depocenters in the Danish Central Graben are strongly associated with faults. Either along the Coffee Soil Fault, emphasising the asymmetric half-graben nature of the Danish Central Graben, or along N-S striking faults like the bounding fault of the Rosa basin, which extension into the German Central Graben is represented by the John Basin (separated by a transversing structure) (Fig. 13). These N-S striking faults were reactivated during the first tectonic pulse during the Callovian to Early Oxfordian (Møller and Rasmussen, Reference Møller and Rasmussen2003). N-S trending faults are probably also related to depocenters of TMS-1 in the German as well as in the Dutch part of the study area (Fig. 13). It is also likely that the N-S trending Clemens Graben and Clemens Basin developed due to this tectonic pulse. The Clemens Graben and Clemens Basin area were probably a topographic high during the Late Triassic and Early Jurassic, which changed to a topographic low due to salt mobilisation and rifting (see thickness map of TMS-1.2 in Fig. 8). Faults in the Mesozoic to Cenozoic are mostly soft-linked to thin-skinned coupled to the basement faults, the faults mostly do not cross the Zechstein salt but clearly stimulated the salt flow (Fig. 4 to Fig. 7; ten Veen et al., Reference ten Veen, van Gessel and den Dulk2012).The subdivision of the German Central Graben by the MCGTZ may have had consequences for the development of the local (litho-)stratigraphy. Higher subsidence rates during TMS-1.1 in the northern Dutch Central Graben resulted in the deposition of thick sediments of the Central Graben Subgroup. Intercalated coal seams may have locally produced gaseous hydrocarbons (Herngreen et al., Reference Herngreen, Kouwe and Wong2003; de Jager and Geluk, Reference de Jager, Geluk, Wong, Batjes and de Jager2007). But the Central Graben Subgroup is economically more important as reservoir rocks for oil, condensate and gas that are predominantly sourced from the Lower Jurassic Posidonia Shale Formation in the northern Dutch Central Graben (de Jager and Geluk, Reference de Jager, Geluk, Wong, Batjes and de Jager2007). In the northern Danish Central Graben, equivalent coal-bearing deposits from the Bryne Formation have sourced gas and condensate fields (Petersen and Hertle, Reference Petersen and Hertle2018; Petersen et al., Reference Petersen, Andsbjerg, Bojesen-Koefoed and Nytoft2000). Coaly liquids are even found within the salt dome province in the Alma field and the Tove-1 well within or near the Danish part of our study area (see Figs. 1b and 3 for location). In the northern part of the study area, north of the MCGTZ, gaseous or liquid hydrocarbons from coals within TMS-1.1 may have been generated in minor quantities, as this interval lies at the present within a hydrocarbon generating temperature and depth window (Petersen and Hertle, Reference Petersen and Hertle2018; Müller et al., Reference Müller, Arfai, Jaehne-Klingberg, Bense and Weniger2020). However, hydrocarbons in significant accumulations, e.g. in chalk fields, probably migrated into the area from the northern part of the Danish Central Graben due to the significantly lower thickness of TMS-1.1 in the study area compared to the northern Dutch (Central Graben Subgroup) or Danish Central Graben (Bryne Formation). The marine mudstones of TMS-1.2 and TMS-1.3 consist of the lower parts of the Kimmeridge Formation, the Lola Formation, and the Farsund Formation, respectively. In the Danish Central Graben, the kerogen quality of these formations decreases towards their lower parts, which may be the result of more oxic depositional conditions and a larger input of terrestrial organic matter (Petersen et al., Reference Petersen, Hertle and Sulsbrück2017). The marine influence increased towards the top of the formation. The ratio of siliciclastics to clay minerals is possibly higher in areas with higher subsidence rates, e.g. the John Graben area.
TMS-2
As outlined before, the MCGTZ plays an important role for the local tectonostratigraphy and subdivides the study area in a northern part with relatively low subsidence rates and a southern part with significantly higher subsidence rates. The main depocenter during TMS-2 was in the northern Dutch Central Graben (Figs. 8 and 13). Comparable or even greater sediment thicknesses only occur in the Tail End Graben north of the Salt Dome Province in the Danish Central Graben (Møller & Rasmussen, Reference Møller and Rasmussen2003). Sediment thicknesses in the remaining study area are significantly lower, indicating that the bounding faults in the area of the Dutch Central Graben were longer active than those in the rest of the study area. A distinctive feature of TMS-2 is the initiation of subsidence in adjacent basins outside of the axis of the Central Graben. Our study area, though, does not record this development, because it mainly comprises the Central Graben. Adjacent basins and plateaus like the Terschelling Basin offshore The Netherlands, the Outer Rough Basin or the Heno and Gertrud Plateau offshore Denmark were affected by the initiation of active faulting along NW-SE trending faults due to the change in the direction of the extensional regime (Zanella et al., Reference Zanella, Coward, Evans, Graham, Armour and Bathurst2003; Coward et al., Reference Coward, Dewey, Hempton and Holroyd2003; Verreussel et al., Reference Verreussel, Bouroullec, Munsterman, Dybkjær, Geel, Houben, Johannessen and Kerstholt-Boegehold2018). Verreussel et al. (Reference Verreussel, Bouroullec, Munsterman, Dybkjær, Geel, Houben, Johannessen and Kerstholt-Boegehold2018) and Bouroullec et al. (Reference Bouroullec, Verreussel, Geel, De Bruin, Zijp, Kőrösi, Munsterman, Janssen and Kerstholt-Boegehold2018) therefore further subdivided TMS-2 into four tectonostratigraphic sequences related to the opening of different adjacent regions. Subsidence along the MBF mainly ceased (Figs. 8 and 13). Fault activity influenced sediment thickness in the study area mainly in the Clemens Graben and potentially in the northern Dutch Central Graben (Fig. 8). In the Central Graben as a whole, the tectonic regime changed, and older roughly NW-SE trending faults were reactivated or newly created, along which depocenters in the Danish Central Graben are oriented (Møller & Rasmussen, Reference Møller and Rasmussen2003; Verreussel et al., Reference Verreussel, Bouroullec, Munsterman, Dybkjær, Geel, Houben, Johannessen and Kerstholt-Boegehold2018; Fig. 13). A roughly NW-SE trending fault also influenced the development of the depocenters of the German John Graben, at least by ultimately separating it from the Danish Rosa Graben and the northern Dutch Central Graben (Fig. 13). However, the influence of salt tectonics on subsidence can be noticed clearly during deposition of TMS-2 in the study area, which is located within the area of maximum presumed initial Zechstein salt thicknesses, with up to 1000 m (Fig. 14a). In the northern Dutch Central Graben, however, TMS-2 reaches thicknesses of up to 1600 m. This implies that salt withdrawal, even if dominating in the German part, is not the single driving force for subsidence. At least in the Dutch part of the Central Graben, there must have been also a strong fault-driven or thermal component. The geometry of deposits offshore Denmark is still asymmetric, with the depocenter close to the Coffee Soil Fault, indicating continuous activity of the NW-SE trending section of the MBF in the northern Danish Central Graben (Møller & Rasmussen, Reference Møller and Rasmussen2003; Fig. 6). The area of the Danish Central Graben and the southwestern German Central Graben were affected by salt withdrawal and evolution of salt structure related depocenters (Fig. 4 to Fig. 7). From the northern Dutch Central Graben to the Danish Salt Dome Province, sedimentation of marine mudstones of the Kimmeridge Clay Formation or the Lola and Farsund Formation, respectively, continued unchanged from TMS-1 to TMS-2 (Fig. 11). These predominantly deep marine sediments covered most areas of the southern Central Graben. Basin floor sands, dolomites and terrestrial sediments of the Main Friese Front Member were deposited in the southern Dutch Central Graben and the Terschelling Basin (Bouroullec et al., Reference Bouroullec, Verreussel, Geel, De Bruin, Zijp, Kőrösi, Munsterman, Janssen and Kerstholt-Boegehold2018). Despite the apparent uniformity of the marine clays of TMS-2, we believe that tectonics influenced the local lithostratigraphy. The subsidence and thickness map of TMS-2 show that most of the study area, especially north of the MCGTZ, constituted a topographic high in contrast to the deeper subsided northern Dutch Central Graben (Fig. 8). This structural high extended further north into the Danish Central Graben (Thöle et al., Reference Thöle, Jähne-Klingberg, Doornenbal, den Dulk, Britze and Jakobsen2021). In general, the upper parts of the Farsund Formation contain more organic matter with predominantly oil-prone Type II kerogen of marine origin (Ponsaing et al., Reference Ponsaing, Bojesen-Koefoed, Thomsen and Stemmerik2018). However, the kerogen quality decreases significantly in the Danish Central Graben towards the south in the Salt Dome Province and changes from predominantly type II to type III kerogen (Damtoft et al., Reference Damtoft, Andersen, Thomsen, Brooks and Glennie1987). The decrease in kerogen quality possibly relates to a location with higher terrestrial input which possibly resulted in increased rations of siliciclastics and inert organic matter. Also, lower subsidence rates may have led to a rather shallow marine depositional setting with potentially higher carbonate contents of the shales in contrast to a presumably rather deep marine setting within the northern Dutch Central Graben. A higher portion of marine organic material is known from the deeper, northern parts of the Danish Central Graben and we presume a similar composition of the upper Kimmeridge Formation also for the deeper subsided parts of the northern Dutch Central Graben (Damtoft et al., Reference Damtoft, Andersen, Thomsen, Brooks and Glennie1987).
TMS-3 and Lower Cretaceous
During TMS-3 sediments of the Scruff Greensand Formation and the Hot Shales were deposited in the study area. They are embedded within the mudstones of the Lutine Formation in The Netherlands (Clay Deep Member) and within the mudstones of the Mandal Formation in Denmark (Bo Member) (Figs. 2 and 12).
The occurrence of the shallow marine sandstones of the Scruff Greensand Formation is mostly restricted to the area of the northern Dutch Central Graben (Fig. 12). Only thin deposits extend into the southernmost German Central Graben (see well B18-5 in Fig. 11). The Hot Shales were mostly deposited in a hemipelagic environment with anoxic bottom water conditions (Ineson et al., Reference Ineson, Bojesen-Koefoed, Dybkjær and Nielsen2003). They are present in the Central Graben over the entire area from the Danish Central Graben into the northern Dutch Central Graben (Müller et al., Reference Müller, Arfai, Jaehne-Klingberg, Bense and Weniger2020). The Hot Shales form part of TS-3.2 of Bouroullec et al. (Reference Bouroullec, Verreussel, Geel, De Bruin, Zijp, Kőrösi, Munsterman, Janssen and Kerstholt-Boegehold2018) and Verreussel et al. (Reference Verreussel, Bouroullec, Munsterman, Dybkjær, Geel, Houben, Johannessen and Kerstholt-Boegehold2018) and correspond to phase seven of basin development defined by Andsbjerg and Dybkjaer (Reference Andsbjerg and Dybkjær2003). They replace or overly the sandstones of the Scruff Greensand Formation and were deposited during the Late Cimmerian II pulse (Wong, Reference Wong, Wong, Batjes and De Jager2007). The typical high gamma-ray (GR) reading, which closely correlates with the content of organic material, thickness and maturity of the Hot Shales varies greatly within its area of distribution (Fig. 11). The distribution of TMS-3.2 and the Hot Shale demonstrate again the impact of tectonics (especially the MCGTZ) on stratigraphy. The Hot Shale reaches the highest thickness in the northern Dutch Central Graben and in the northern Danish Tail End Graben with up to 100 (Ineson et al., Reference Ineson, Bojesen-Koefoed, Dybkjær and Nielsen2003). While the GR-readings and probably the organic content is well developed in the northern Dutch Central Graben, they decrease further north across the German Central Graben. The GR-readings increase again in the Danish Salt Dome Province (Fig. 11). While they form a prolific source rock in the Danish Tail End Graben, the Hot Shales are mostly thermally immature to early mature in the German part of the Central Graben. (Ponsaing et al., Reference Ponsaing, Bojesen-Koefoed, Thomsen and Stemmerik2018; Müller et al., Reference Müller, Arfai, Jaehne-Klingberg, Bense and Weniger2020). The subsidence pattern of TMS-3 is rather complex and local tectonics may have caused significantly more local hiatuses and variations in siliciclastic content (Fig. 9).
Tectonically, the southern Central Graben reached an early post-rift stage (Andsbjerg & Dybkjaer, Reference Andsbjerg and Dybkjær2003) and TMS-3 corresponds to a phase of tectonic quiescence between the tectonic pulses 2 and 3 of Møller and Rasmussen (Reference Møller and Rasmussen2003). During this phase the organic rich Hot Shales were deposited. Subsidence rates strongly decreased in the second half of the Volgian, which is recorded by the reconstructed subsidence rates and subsidence pattern of the northern Dutch Central Graben from TMS-2 to TMS-3 (Figs. 8 and 9). But even if subsidence in total began to fade, subsidence affected not only the graben axis and adjacent basin but also the entire region (Andsbjerg & Dybkjaer, Reference Andsbjerg and Dybkjær2003; Verreussel et al., Reference Verreussel, Bouroullec, Munsterman, Dybkjær, Geel, Houben, Johannessen and Kerstholt-Boegehold2018). Activity of the MBF ceased, while the influence of salt tectonics on sedimentation climaxed, expressed by the formation of depocenters close to salt structures (Figs. 9 and 13).
During the Early Cretaceous, rifting as well as salt tectonics ceased while regional thermal subsidence became important, resulting in a regional transgression and the deposition of the Vlieland Claystone Formation (TMS-4) and the Holland Formation (Herngreen & Wong, Reference Herngreen, Wong, Wong, Batjes and De Jager2007). This deposition followed the third tectonic pulse according to Møller and Rasmussen (Reference Møller and Rasmussen2003). The transgressive sediments were originally deposited in large areas of the southern North Sea but were partly eroded during the Late Cretaceous inversion of the southern Central Graben (Herngreen & Wong, Reference Herngreen, Wong, Wong, Batjes and De Jager2007). Our thickness maps show that the influence of salt tectonics was still significant during the deposition of the Vlieland Claystone Formation (TMS-4), while a tectonic influence at the MBF was minor (Figs. 9 and 13). In comparison to the Vlieland Claystone Formation, the distribution of the Holland Formation is more uniform, reflecting the decrease in differential subsidence and salt tectonics. The low subsidence rates in the marine setting may have produced a relative homogenous distribution of the lithofacies. Increased thicknesses at the basin axis of the northern Dutch Central Graben may indicate continuous activity of sub-salt faults in this area.
Influence of supra-regional tectonics
Initial salt mobilisation in the Central Graben is probably connected to first rifting pulses during the break-up of Pangaea (Stollhofen et al., Reference Stollhofen, Bachmann, Barnasch, Bayer, Beutler, Franz, Kästner, Legler, Mutterlose, Radies, Littke, Bayer, Gajewski and Nelskamp2008; Maystrenko et al., Reference Maystrenko, Bayer and Scheck-Wenderoth2013). In the process, the study area was not uniformly deformed, resulting in a dichotomy in the structural pattern. Salt structures south of and within the MCGTZ, including the Dutch Central Graben, started to form in the Middle to Late Triassic (van Winden et al., Reference van Winden, de Jager, Jaarsma and Bouroullec2018; Warsitzka et al., Reference Warsitzka, Jähne-Klingberg, Kley and Kukowski2018). During this period, initial salt mobilisation concentrated on major fault zones and graben structures as the Dutch Central Graben, the Horn Graben and the Glückstadt Graben (Grassmann et al., Reference Grassmann, Cramer, Delisle, Messner and Winsemann2005; Warsitzka et al., Reference Warsitzka, Jähne-Klingberg, Kley and Kukowski2018). The rifting pulses led to differential gravitational unloading of the Zechstein salt due to the extension of its overburden, in combination with differential loading due to accelerated subsidence in the evolving grabens (Scheck-Wenderoth et al., Reference Scheck-Wenderoth, Maystrenko, Hübscher, Hansen, Mazur, Littke, Bayer, Gajewski and Nelskamp2008; Warsitzka et al., Reference Warsitzka, Jähne-Klingberg, Kley and Kukowski2018). Salt movement north of the MCGTZ, in the German Central Graben and the Danish Salt Dome Province, initiated in the Late Triassic (Warsitzka et al., Reference Warsitzka, Jähne-Klingberg, Kley and Kukowski2018). It was the Triassic main phase of salt mobilisation in the Southern Permian Basin and affected also structurally higher areas (Warsitzka et al., Reference Warsitzka, Jähne-Klingberg, Kley and Kukowski2018). The SPB is dominated by two structural trends, a roughly N-S and a roughly NW-SE orientation of basement faults and depocenters (Kley et al., Reference Kley, Franzke, Jähne, Krawczyk, Lohr, Reicherter, Scheck-Wenderoth, Sippel, Tanner, Van Gent, Littke, Bayer, Gajewski and Nelskamp2008). These two main structural patterns are also reflected in the pattern of the salt structures (Kley et al., Reference Kley, Franzke, Jähne, Krawczyk, Lohr, Reicherter, Scheck-Wenderoth, Sippel, Tanner, Van Gent, Littke, Bayer, Gajewski and Nelskamp2008; Scheck-Wenderoth et al., Reference Scheck-Wenderoth, Maystrenko, Hübscher, Hansen, Mazur, Littke, Bayer, Gajewski and Nelskamp2008). Many elongated salt structures follow the roughly N-S striking structural trend that is dominant for the Dutch Central Graben, e.g. B17-SOUTH1 (Fig. 1b). Directly after the collapse of the Mid North Sea Dome, roughly N-S trending faults were active during the deposition of TMS-1, potentially resulting from reactivation of older structures (Fig. 13; Pharaoh et al., Reference Pharaoh, Dusar, Geluk, Kockel, Krawczyk, Krzywiec, Scheck- Wenderoth, Thybo, Vejbæk, Van Wees, Doornenbal and Stevenson2010). The trend of these faults conforms to the general E-W extension of the area, as well as the Viking Graben and the Dutch Central Graben, but cross-cuts the roughly NW-SE trend of the Danish Central Graben. NW-SE elongated salt structures developed over pre-Zechstein basement faults mainly in the eastern SPB. These structures were reactivated during the Late Jurassic to the Early Cretaceous (Scheck-Wenderoth et al., Reference Scheck-Wenderoth, Maystrenko, Hübscher, Hansen, Mazur, Littke, Bayer, Gajewski and Nelskamp2008), which may be reflected in the change from roughly N-S to NW-SE oriented faults from TMS-1 to TMS-2 in the German and Danish part of the Central Graben (Fig. 13). This structural trend is common in the wider area, e.g. the Broad Fourteens Basin offshore The Netherlands, the Polish Trough and the Lower Saxony Basin onshore Germany (Kley et al., Reference Kley, Franzke, Jähne, Krawczyk, Lohr, Reicherter, Scheck-Wenderoth, Sippel, Tanner, Van Gent, Littke, Bayer, Gajewski and Nelskamp2008). The Central Graben is located at the collision triangle of three terranes, Laurentia in the northwest, Baltica in the northeast, Avalonia in the south (Maystrenko et al., Reference Maystrenko, Bayer, Brink, Littke, Littke, Bayer, Gajewski and Nelskamp2008; Smit et al., Reference Smit, van Wees and Cloetingh2016; Fig. 15). Despite the general E-W direction of extension the trend of the Danish Central Graben is roughly NW-SE oriented. We suggest that the graben follows roughly a deep-seated zone of crustal weakness, the Thor suture that separates the two terranes Avalonia and Baltica (Smit et al., Reference Smit, van Wees and Cloetingh2016; Fig. 15). A similar relation of a Mesozoic sub-basin to deep-seated crustal structure is presumed for the Polish Trough in the east of the SPB, whose roughly NW-SE striking structural trend follows the Teisseyre-Tornquist-Zone (TTZ), a major geologic structure and zone of deformation (Narkiewicz et al., Reference Narkiewicz, Maksym, Malinowski, Grad, Guterch, Petecki and Jankowski2015; Grad & Polkowski, Reference Grad and Polkowski2016). Especially the NW-SE trending part of the Central Graben in German and Danish offshore which cut the Mid North Sea High and Ringköbing-Fyn High show several ENE-WSW striking transverse zones (Cartwright, Reference Cartwright1987; Wride, Reference Wride1995). The MCGTZ is the furthest south of this sequence of transverse zones (Wride, Reference Wride1995) and shows clear evidence for influencing the Jurassic tectonostratigraphy in the study area. It is possible that the transverse zones follow precursors in the crust. However, they may also be a consequence of the influence of a E-W directed supra-regional extension on an already existing NW-SE striking graben segment. The main activity of salt tectonics in the German and Dutch Central Graben was in the Late Jurassic to Early Cretaceous (e.g. ten Veen et al., Reference ten Veen, van Gessel and den Dulk2012; Arfai et al., Reference Arfai, Jähne, Lutz, Franke, Gaedicke and Kley2014), in contrast to other grabens of the SPB, e.g. the Gückstadt Graben, where the main activity was in the Late Triassic (Grassmann et al., Reference Grassmann, Cramer, Delisle, Messner and Winsemann2005; Warsitzka et al., Reference Warsitzka, Kley, Jähne-Klingberg and Kukowski2016). This corresponds with our results, which imply that during the deposition of TMS-2 to TMS-3 the influence of salt tectonics dominated the depositional pattern (Figs. 8 and 9). Salt tectonics ceased during the Lower Cretaceous and some of the salt structures have in parts already formed welds. Due to Late Cretaceous to Paleocene compressional tectonics, salt mobilisation was renewed in the study area as well as in other parts of the SPB (e.g. Mazur et al., Reference Mazur, Scheck-Wenderoth and Krzywiec2005; Ahlrichs et al., Reference Ahlrichs, Noack, Hübscher, Seidel, Warwel and Kley2022). The accompanying structural deformation partly complicates the analysis of the Jurassic to Early Cretaceous tectonostratigraphy in the study area.
Simplified structural overview map of the North Sea area during the Middle Jurassic. The area is affected by the ongoing break-up of the supercontinent Pangea which led to roughly NW-SE extension in the Arctic-North Atlantic mega-rift-system and to roughly E-W extension in the Central Graben. The Central Graben is located at the triple collision zone of the terranes Laurentia in the northwest, Baltica in the northeast, and Avalonia in the south. It cuts the transition of Laurentia to Avalonia and follows roughly the margin of Avalonia. The figure is compiled and modified from Lyngsie & Thybo., (2007), Pharaoh et al. (Reference Pharaoh, Dusar, Geluk, Kockel, Krawczyk, Krzywiec, Scheck- Wenderoth, Thybo, Vejbæk, Van Wees, Doornenbal and Stevenson2010), and Smit et al. (Reference Smit, van Wees and Cloetingh2016).

Conclusions
-
Rift tectonics controlled subsidence in the study area predominantly during the deposition of TMS-1. Subsidence took place along N-S and NW-SE trending faults. The influence of re-active salt tectonics increased steadily until it dominated subsidence pattern during the deposition of TMS-2. Locally, salt tectonics remained the dominating factor of subsidence during deposition of TMS-3 and TMS-4.
-
The paleo-topography of the Early Jurassic Central Graben area was more differentiated than assumed, with lows like the northern Dutch central Graben and highs like the Clemens Graben and Basin area.
-
The German Central Graben is subdivided by the Mid Central Graben Transverse Zone (MCGTZ), a fault zone with a prominent present-day sinistral offset. Regarding their tectonostratigraphic development from the Altena Group to TMS-3, the northern part belongs rather to the Danish Central Graben and the southern / southeastern part rather to the Dutch Central Graben
-
During deposition of TMS-2, the subdivision of the study area into a high-subsidence area (Dutch Central Graben) and a comparatively low-subsidence area (German and Danish Central Graben) is most pronounced.
-
Active faulting and salt tectonics had a significant impact on the regional (litho-)stratigraphic evolution of the Lower Jurassic to the Lower Cretaceous sedimentary successions. For example, the distribution of the Posidonia Shale Formation and of the high-GR Clay Deep Member is probably restricted to areas south and partly east of the MCGTZ.
-
Major parts of the German Central Graben and of the Danish Salt Dome Province constituted a topographic high during deposition of TMS-1 to TMS-3 in comparison to the Dutch Central Graben in the south and the Danish Tail End Graben in the north. The elevated location presumably influenced lithology and source rock quality regarding its organic matter, siliciclastic and carbonate contents.
Acknowledgements
The presented research was done in the projects “Tieferer Untergrund Norddeutsches Becken (TUNB) and ‘Establishing the European geological surveys research area to deliver a geological service for Europe (GeoERA)’ at the Federal Institute for Geosciences and Natural Resources of Germany (BGR). We thank aspentech (former Emerson) for providing Paradigm Software Package licenses via the Academic Software Program (https://www.pdgm.com/affiliations/academic-software-programs/) to support the national geological services in their non-profit work for the public and education. This enabled us to develop presented map calculations (SKUA-GOCAD), log correlation (StratEarth) and seismic profile interpretations (SeisEarth). We thank our colleagues Jashar Arfai, Dieter Franke, Lutz Reinhardt, Rüdiger Lutz, Stefan Ladage and Heidrun Stück who provided expertise that greatly assisted the research. We also want to acknowledge the support from Franziska- Sabine Müller, Felix Müller and Tilda Müller-Thiel, which was invaluable.


 Open access