


Introduction
The melilite group of minerals with the general formula X 2T1(T2)2O7 (Bindi et al., Reference Bindi, Bonazzi and Fitton2001), where: X = □, Na, K, Ca, Ba and Sr; T1 = B, Be, Mg, Fe2+, Zn, Fe3+, Al and Si; and T2 = Si, Al, B and Be, currently consists of nine species (Supplementary Table S1). All members are tetragonal (P  $\overline4$21m), with the structure consisting of alternating layers formed by eightfold-coordinated cations at the X site and layers formed by tetrahedrally coordinated cations at the T1 and T2 sites. The presence of (T2)2O7 dimers formed by the linkage of two T2 tetrahedra is a characteristic feature of this structure type (Bindi et al., Reference Bindi, Bonazzi and Fitton2001).
Ferroåkermanite, Ca2FeSi2O7, is a new mineral of this group found in coarse-grained kirschsteinite-bearing paralava in the Hatrurim Basin outcrop between the Zohar and Halamish Wadies belonging to the Hatrurim Complex in Israel (31°10′30′′N, 35°17′23′′E). Ferroåkermanite is an Fe2+-analogue of åkermanite, Ca2MgSi2O7 (Vogt, Reference Vogt1890) and the second member of the melilite group, which contains divalent Fe at the T1 site, after bennesherite, Ba2FeSi2O7 (Krzątała et al., Reference Krzątała, Krüger, Galuskina, Vapnik and Galuskin2022).
Ferroåkermanite, also known as ferro-åkermanite or Fe2+-melilite in the literature, has been reported previously from several occurrences worldwide. It has been found in refractory inclusions of the Bali Carbonaceous Chondrite meteorite in the Central African Republic (Hoinkes and Kurat, Reference Hoinkes and Kurat1975). Ferroåkermanite close to end-member composition occurs in cavities in coarse-grained ijolite pegmatoidal segregations in melilite nephelinite from the Podhorní Hill in western Bohemia (Ulrych et al., Reference Ulrych, Pivec, Lang and Lloyd2000, Reference Ulrych, Novak, Lloyd, Balogh and Buda2002). As a component of the solid-solution series between åkermanite–gehlenite–ferroåkermanite, it was distinguished in nephelinitic lavas of Mount Etinde in Cameroon (Ntoumbé et al., Reference Ntoumbé, Déruelle, Mbowou and Ngounouno2016) and also in mineral assemblages of calc-silicate xenoliths from the Merapi volcano in Indonesia (Whitley et al., Reference Whitley, Halama, Gertisser, Preece, Deegan and Troll2020). In the latter case, however, the chemical composition suggests that it is only Fe-rich åkermanite (<10 mol.% of Fåk). More recently, ferroåkermanite has been described in association with other melilites such as gehlenite, alumoåkermanite, bennesherite and the Sr-dominant analogue of bennesherite (Sr2FeSi2O7) from the carbonate–silicate xenoliths of the Bellerberg volcano in Germany (Juroszek and Ternes, Reference Juroszek and Ternes2022). The chemical diversity observed in the composition of various melilite-group minerals and the significant substitution at the X site (Ca, Ba and Sr) indicate the presence of the triple solid-solution series Ca2FeSi2O7–Ba2FeSi2O7–Sr2FeSi2O7 in the samples analysed from this locality. Moreover, Fe2+-bearing åkermanite is a typical phase found in slag samples that are products of pyrometallurgical processes (Vanaecker et al., Reference Vanaecker, Courtin-Nomade, Bril, Laureyns and Lenain2014). In turn, synthetic melilites of the åkermanite–iron-åkermanite series Ca2(Mg,Fe)Si2O7 were analysed to examine commensurate–incommensurate phase transition at various temperatures and depending on composition (Seifert et al., Reference Seifert, Czank, Simons and Schmahl1987; Iishi et al., Reference Iishi, Mizota, Fujino and Furukawa1991).
The name ferroåkermanite is chosen for its chemical composition, i.e. the dominance of divalent iron at the T1 crystallographic site and by analogy with the related Mg-analogue: åkermanite. Furthermore, the name ferroåkermanite has been firmly established in the research literature to describe the Fe2+-rich natural and synthetic åkermanite counterparts. The new mineral (IMA2024-080, Juroszek et al., Reference Juroszek, Krüger, Vapnik and Galuskin2025), its proposed name and symbol (Fåk) were approved by the Commission on New Minerals, Nomenclature and Classification (CNMNC) of the International Mineralogical Association (IMA). The holotype material with ferroåkermanite is deposited in the Natural History Museum Mainz, State Collection for Natural History Rhineland-Palatinate, Reichklarstrasse 10, D-55116 Mainz, Germany, with inventory number M_202400054.
The following work includes a description of the new mineral ferroåkermanite, found in kirschsteinite-bearing paralava from the Hatrurim Complex, together with chemical, structural and spectroscopic data. The results and detailed analyses presented in this paper are compared and discussed with previously reported data. The origin of ferroåkermanite and its relationship to the members of the melilite group are also provided here.
Methods
Petrographic thin sections and polished fragments of paralava samples were examined using a Leica DM2700P optical microscope under transmitted light. Semiquantitative chemical compositions of ferroåkermanite and associated minerals, as well as the textural relationships and crystal morphology, were determined using a Phenom XL scanning electron microscope (SEM) equipped with an EDS (energy dispersive X-ray spectroscopy) detector (Institute of Earth Sciences, Faculty of Natural Sciences, University of Silesia, Sosnowiec, Poland). The EDS analyses were performed in a high-vacuum regime with a beam voltage of 15 kV and a working distance of 6 mm.
In turn, quantitative electron probe microanalyses (EPMA) were performed using a CAMECA SXFiveFE instrument (Micro-Area Analysis Laboratory, Polish Geological Institute, National Research Institute, Warsaw, Poland) operating in WDS mode (wavelength dispersive X-ray spectroscopy) with a 15 kV acceleration voltage, 20 nA beam current and a spot size of ∼1 μm. The following lines and standards were used during the measurements: SiKα, CaKα – diopside; AlKα, KKα – orthoclase; NaKα – albite; MgKα – MgO; FeKα – Fe2O3; SrLα – SrSO4; BaLβ – BaSO4.
Single-crystal X-ray studies of ferroåkermanite were carried out on a two-circle IPDS Stoe diffractometer equipped with an Image Plate detector (Institute of Mineralogy and Petrography, University of Innsbruck, Austria). The measurement was performed under ambient conditions (293 K), and the data were collected using MoKα radiation (λ = 0.71073 Å). The determination of unit-cell parameters and data reduction was done using X-Area software (STOE & Cie GmbH). Sections of reciprocal space were analysed and no additional reflections were observed that would implicate a modulated structure. The structure refinement was performed using the SHELXL-2018/3 program (Sheldrick, Reference Sheldrick2015). Starting values for the structural coordinates were taken from Ca2MgSi2O7 (Kimata and Ii, Reference Kimata and Ii1980). Further details concerning data collection and crystal-structure refinement are given in Table 1. In turn, atom coordinates, site occupancies, anisotropic displacement parameters and main interatomic distances are listed in the ‘Crystal structure’ section as well as in the CIF (Crystallographic Information File) reported in the Supplementary Materials. In addition, powder X-ray diffraction data were calculated from the results of the single-crystal structure refinement and given in Table S2.
Crystal data, data-collection information and refinement details for ferroåkermanite

* wR 2 (Weighting scheme): w = 1/[σ2(Fo2) + 2.5115P) where P = (Fo2+2Fc2)/3
The Raman spectrum of ferroåkermanite was recorded on a WITec alpha 300R Confocal Raman Microscope (Institute of Earth Sciences, Faculty of Natural Sciences, University of Silesia, Sosnowiec, Poland), equipped with an air-cooled solid state laser (λ = 532 nm) and a CCD camera operating at –61°C. The laser beam was coupled to the microscope via a single-mode optical fibre with a diameter of 3.5 μm. A Zeiss air objective (LD EC Epiplan-Neofluar DIC-100/0.75NA) was used. The Raman scattered light was focused by an effective pinhole diameter of ∼30 μm and a monochromator with a 600 mm–1 grating, calibrated by a Raman scattering line of a silicon plate (520.7 cm–1). The power of the laser at the sample position was 42 mW, with an integration time of 10 s and an accumulation of 15 scans over 3 cm–1 resolution. The signal was recorded between 75 and 3800 cm–1 in a 180° back-scatter geometry. The spectrum was processed using the Spectracalc software package GRAMS (Galactic Industries Corporation, NH, USA), and the Raman bands were fitted using a Gauss-Lorentz cross-product function.
Geological setting
Ferroåkermanite has been found in coarse-grained kirschsteinite-bearing paralava in the Hatrurim Basin between the Zohar and Halamish Wadies in Israel (31°10′30′′ N, 35°17′23′′ E) (Fig. 1a,b). The Hatrurim Basin is a well-known region where nearly 50 new minerals have been discovered in metamorphic rocks (e.g. Galuskina et al., Reference Galuskina, Galuskin, Pakhomova, Widmer, Armbruster, Krüger, Grew, Vapnik, Dzierażanowski and Murashko2017; Britvin et al., Reference Britvin, Murashko, Vapnik, Polekhovsky, Krivovichev, Vereshchagin, Shilovskikh and Krzhizhanovskaya2020; Krüger et al., Reference Krüger, Galuskin, Galuskina, Krüger and Vapnik2021; Sharygin et al., Reference Sharygin, Britvin, Kaminsky, Wirth, Nigmatulina, Yakovlev, Novoselov and Murashko2021; Juroszek et al., Reference Juroszek, Galuskina, Krüger, Krüger, Vapnik, Kahlenberg and Galuskin2023). The Hatrurim Basin itself is one of the largest outcrops of the Hatrurim Complex (Mottled Zone) – a geological unit composed of high-temperature, low-pressure metamorphic rocks, distributed on both sides of the Dead Sea Transform Fault in Israel, Palestine (West Bank), and Jordan (Fig. 1a,b) (Gross, Reference Gross1977; Burg et al., Reference Burg, Starinsky, Bartov and Kolodny1991; Geller et al., Reference Geller, Burg, Halicz and Kolodny2012; Novikov et al., Reference Novikov, Vapnik and Safonova2013). The most widespread rocks of the Hatrurim Complex, represented by spurrite marbles and larnite- and gehlenite-bearing rocks, are similar in composition to Portland clinker formed under oxidizing conditions (Gross, Reference Gross1977; Geller et al., Reference Geller, Burg, Halicz and Kolodny2012; Novikov et al., Reference Novikov, Vapnik and Safonova2013; Sokol et al., Reference Sokol, Kokh, Sharygin, Danilovsky, Seryotkin, Liferovich, Deviatiiarova, Nigmatulina and Karmanov2019). It was assumed that these rocks are a product of combustion metamorphism (pyrometamorphism), occurring under sanidinite-facies conditions (Grapes, Reference Grapes2006). High-temperature pyrometamorphic rocks are gradually altered by the late hydrothermal and weathering processes, evidenced by the presence of numerous cavities, veins, and cracks usually filled with low-temperature and secondary minerals (Gross, Reference Gross1977; Burg et al., Reference Burg, Starinsky, Bartov and Kolodny1991; Novikov et al., Reference Novikov, Vapnik and Safonova2013; Kolodny et al., Reference Kolodny, Burg, Geller, Halicz and Zakon2014).
(a) Schematic map of the Middle East with the Hatrurim Complex outcrops along the Israel-Jordan border; the fragment outlined by black frame is magnified in Fig. 1b. (b) The Hatrurim Basin outcrop with marked locality (red dot) of the ferroåkermanite sampling. (c) Samples of kirschsteinite-bearing paralava containing ferroåkermanite within the host wollastonite–gehlenite paralava. (d) Thin-section (sample GF1-16) of altered wollastonite–gehlenite paralava with lense-like bodies of kirschsteinite paralava with yellow ferroåkermanite crystals; the framed section is rotated and magnified in Fig. 2a,b. Drawn using CrystalMaker software.

Within the rocks of the Hatrurim Complex, mainly gehlenite hornfelses, unusual paralavas characterised by various mineral compositions and that exhibit fluid vesicular textures, occur as lenses or dyke-like bodies of various sizes (Sokol et al., Reference Sokol, Novikov, Vapnik and Sharygin2007; Vapnik et al., Reference Vapnik, Sharygin, Sokol and Shagam2007; Novikov et al., Reference Novikov, Vapnik and Safonova2013; Krzątała et al., Reference Krzątała, Krüger, Galuskina, Vapnik and Galuskin2020). The formation of paralava is determined by the temperature and protolith composition, and their presence in the host rock indicates local intensification of combustion processes that cause partial or complete melting of protolith rocks (Sokol et al., Reference Sokol, Novikov, Vapnik and Sharygin2007, Reference Sokol, Novikov, Zateeva, Vapnik, Shagam and Kozmenko2010; Vapnik et al., Reference Vapnik, Sharygin, Sokol and Shagam2007; Grapes, Reference Grapes2010).
The origin of the Hatrurim Complex is still uncertain, despite many years of research on this geological unit. The common hypothesis assumes the formation of pyrometamorphic rocks due to the combustion process of abundant dispersed organic matter in the sedimentary protolith (Matthews and Gross, Reference Matthews and Gross1980; Burg et al., Reference Burg, Starinsky, Bartov and Kolodny1991; Geller et al., Reference Geller, Burg, Halicz and Kolodny2012). A more recent hypothesis related to the mud volcanism activity assumes metamorphic alteration due to the combustion of methane originating from the tectonically active zone of the Dead Sea Rift (Sokol et al., Reference Sokol, Novikov, Zateeva, Vapnik, Shagam and Kozmenko2010; Novikov et al., Reference Novikov, Vapnik and Safonova2013). More detailed information on the geological setting and the main hypotheses of the Hatrurim Complex formation can be found in previous publications (Sokol et al., Reference Sokol, Novikov, Zateeva, Vapnik, Shagam and Kozmenko2010; Geller et al., Reference Geller, Burg, Halicz and Kolodny2012; Novikov et al., Reference Novikov, Vapnik and Safonova2013; Galuskina et al., Reference Galuskina, Vapnik, Lazic, Armbruster, Murashko and Galuskin2014).
Results
Mineral associations and physical and optical properties of ferroåkermanite
Lense-like bodies of kirschsteinite-bearing paralava with light-yellow crystals of ferroåkermanite were found within the host rock represented by a different type of dark-grey paralava (Fig. 1c,d). This host rock is weakly altered and consists of long-prismatic poikilitic wollastonite crystals embedded in the fine-grained crystalline groundmass of gehlenite. Wollastonite, in rare cases, is replaced by rankinite and cuspidine. Accessory phases are represented by perovskite and chromite. In addition, the altered host rock contains an abundance of iron hydroxides and oxides substituting for sulfides (pyrrhotite) and even native iron, schreibersite and cohenite. The detailed description of host rock was given in the paper of the Fe-free uvarovite, recently described from the same paralava samples (Futrzyński et al., Reference Futrzyński, Juroszek, Skrzyńska, Vapnik and Galuskin2023). The coarse-grained paralava bodies in which ferroåkermanite occurs, are composed mainly of kirschsteinite, rankinite, kalsilite, cuspidine, fluorapatite and minerals of the gehlenite–ferroåkermanite–alumoåkermanite series. Kirschsteinite, CaFeSiO4, an olivine group member, usually forms large transparent crystals. Accessory minerals are represented by perovskite, chromite, baryte, pyrrhotite, zadovite, ulvöspinel, djerfisherite, alforsite, bennesherite and walstromite.
In the holotype specimen, ferroåkermanite rarely forms single subhedral crystals up to 30–50 μm across with a prismatic habit (Fig. 2a–d). The most common are irregular grains, aggregates and intergrowths with gehlenite, or ferroåkermanite crystals with perovskite inclusions not exceeding 100 μm in size (Fig. 2c,d). The mineral forms light-yellow crystals with vitreous lustre and white streak (Fig. 2a,b). It shows distinct cleavage on (001); nonetheless, neither parting nor twinning was observed. The tenacity is brittle, and the fracture is conchoidal.
(a,b) Optical microscopy images of a paralava vein filled with light-yellow crystals of ferroåkermanite and dark-yellow aggregates of ferroåkermanite–gehlenite intergrowths (a – plane polarized light; b – crossed polarizers). (c,d) BSE (back-scattered electron) images of ferroåkermanite and associated minerals in holotype paralava specimens. Mineral-name abbreviations: Fåk – ferroåkermanite; Gh – gehlenite; Kir – kirschsteinite; Kls – kalsilite; Prv – perovskite; Rnk – rankinite.

Optically, ferroåkermanite is uniaxial (–), with ω = 1.652(3) and ε = 1.643(3) (λ = 589 nm). In transmitted light, light yellow crystals, chemically related to ferroåkermanite, and slightly darker yellow crystals, which correspond to gehlenite–ferroåkermanite intergrowths, were distinguished (Fig. 2a). Ferroåkermanite exhibits a visible pleochroism from light yellow (ω) to intense yellow (ε). Under crossed polarisers, strong anisotropy and parallel extinction were observed (Fig. 2b).
Micro-hardness indentation of ferroåkermanite crystals was carried out using a load of 50×g, which gave a mean value for the VHN (Vickers Hardness Number) of 537.9 kg/mm3 (range from 504 to 561 kg/mm3, based on 16 measurements). The result obtained corresponds to a hardness of 4.5–5 on the Mohs scale. The calculated density based on the empirical formula and single-crystal unit-cell parameters is 3.20 g/cm3. The Gladstone–Dale compatibility index (Mandarino, Reference Mandarino1989) for the calculated formula of the holotype ferroåkermanite is 1 – (Kp/Kc) = ±0.004 (superior).
Chemical composition
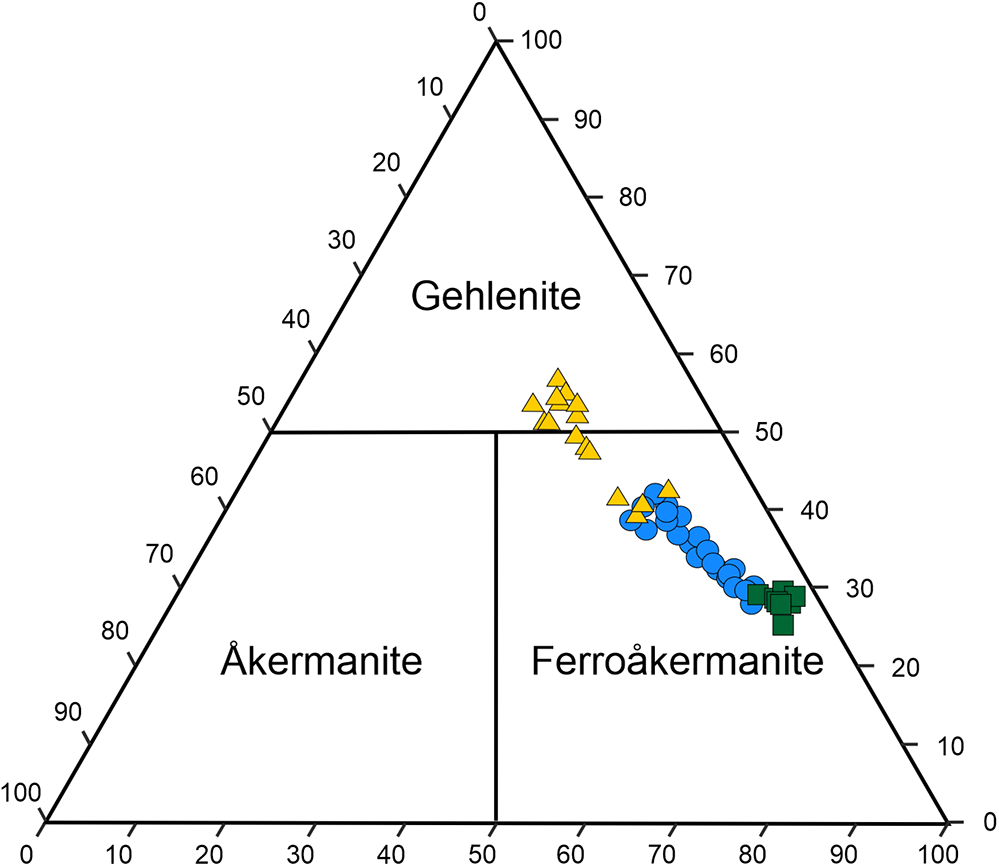
Preliminary semiquantitative analyses performed using SEM-EDS revealed a significant variation in the iron and aluminium contents in the chemical composition of melilite crystals within the holotype specimen. Therefore, two series of EPMA measurements were carried out on different melilites with various Fe/Al ratios. The calculated results of the electron microprobe analyses of holotype ferroåkermanite and crystals exhibiting the composition of ferroåkermanite–gehlenite series are given in Table 2 and presented in a ternary diagram (Fig. 3).
Ternary plot of the T1 site contents (apfu) of melilites according to the results obtained from EMP analyses; yellow triangles correspond to the 1st measurement series; green squares (holotype composition) and blue circles represent the 2nd measurement series.

Chemical data (wt.%) for ferroåkermanite and the ferroåkermanite–gehlenite series detected in the holotype sample

Notes:S.D. = 1σ = standard deviation; n = number of analyses
* – 1st measurement series
† – 2nd measurement series
As ferroåkermanite crystals are not abundant, analyses of the most ferrous grains were included in the average holotype chemical composition of a new mineral based on nine spot analyses (Table 2). The empirical formula of ferroåkermanite calculated on the basis of seven anions (O atoms) is (Ca1.77Na0.18Sr0.02Ba0.02K0.02)Σ2.01(Fe2+0.68Al0.28Mg0.04)Σ1.00(Si1.93Al0.07)Σ2.00O7, which leads to the following simplified formula: (Ca,Na)2(Fe2+,Al)[(Si,Al)2O7]. The ideal end-member formula Ca2FeSi2O7 corresponds to 36.87 wt.% of CaO, 23.62 wt.% of FeO, and 39.51 wt.% of SiO2. Note that the calculated data show the prevalence of Fe at the T1 site, and the partial Al substitution is balanced by the presence of monovalent cations at the X site. In turn, the T2 site occupied by Si is only slightly substituted by Al (Table 2). Moreover, the chemical composition indicates that the holotype ferroåkermanite can be represented by a complex solid solution, which can be divided clearly into the following end-members: 66% of ferroåkermanite, 20% of ‘soda-melilite’, 8% of gehlenite, 4% of åkermanite and 1% of bennesherite and Sr-bennesherite each.
The remaining analyses and results presented in Table 2 were performed on heterogeneous grains represented by gehlenite–ferroåkermanite intergrowths or crystals characterised by gehlenite core and ferroåkermanite rims (Fig. 2d). Certain dependencies can be observed by correlating these data and considering the proportion of specific constituents in a selected site. In all analyses, the X site mainly occupied by Ca2+ is partially substituted by monovalent Na and K, while their content is similar, ∼0.2 apfu (atoms per formula unit). This substitution allows the maintenance of the charge balance related to partial Al substitution at the T1 site. The amount of remaining divalent Ba and Sr cations is insignificant, with the greatest found for the holotype composition (Table 2). There are clear differences in the amount of Fe2+ and Al3+ at the T1 site. The observed decrease in FeO content from holotype ferroåkermanite, through ferroåkermanite from inhomogeneous grains and intergrowths to gehlenite, correlates with the simultaneous increase in Al2O3 content (Table 2). The largest FeO content, ∼17 wt.%, was recorded for the holotype ferroåkermanite, and the smallest for gehlenite, ∼7 wt.% (Table 2). In the case of Al2O3, this ratio is reversed from ∼18 wt.% in gehlenite to ∼5.5 wt.% in ferroåkermanite. For ferroåkermanite from inhomogeneous grains and intergrowths, these contents average ∼13.43 wt.% FeO and 9.30 wt.% Al2O3, respectively (Table 2). The average empirical formula for these ferroåkermanite grains is (Ca1.77Na0.16K0.03Sr0.01Ba0.01)Σ1.98(Fe2+0.55Al0.37Mg0.09)Σ1.01(Si1.84Al0.16)Σ2.00O7. Furthermore, the decrease in SiO2 is noted as the Al2O3 content increases (Fig. 3). It is related to the gehlenite structure, where Al substitutes part of Si tetrahedra in the T2 site. In the results obtained, the amount of SiO2 for gehlenite is ∼35 wt.% while for ferroåkermanite, this is almost 39 wt.% (Table 2), and the average empirical formula for measured gehlenite grains is presented as (Ca1.82Na0.14K0.03Sr0.01)Σ2.00(Al0.51Fe2+0.34Mg0.15)Σ1.00(Si1.65Al0.35)Σ2.00O7. A similar dependence is observed for the MgO content, which is greatest for analyses calculated as gehlenite (Table 2, Fig. 3). In view of the above observation, the data attained confirm the presence of a ferroåkermanite–gehlenite solid-solution in the specimen analysed.
Crystal structure of ferroåkermanite
Ferroåkermanite is a sorosilicate isostructural with other members of the melilite group with the general formula X 2T1(T2)2O7 (Table S1). The crystal structure of the new mineral has been refined to R = 0.0617 in the space group P  $\overline4$21m with the following unit-cell parameters a = 7.7813(7) Å, c = 5.0114(5) Å, V = 303.43(6) Å3 and Z = 2. The atom coordinates, site occupancies, anisotropic displacement parameters and main interatomic distances are listed in Tables 3, 4 and 5.
Atom coordinates, equivalent displacement parameters (U eq, Å2) and site occupancies of ferroåkermanite

Anisotropic displacement parameters (Å2) of ferroåkermanite

Selected interatomic distances (Å) of ferroåkermanite

The structure of ferroåkermanite consists of layers extending parallel to the ab plane, composed of corner-sharing Fe2+O4 and SiO4 tetrahedra combined into Si2O7 disilicate units, linked by large eightfold-coordinated Ca atoms (Fig. 4a). In a projection along the c axis the Fe2+O4 tetrahedra and Si2O7 units are linked to form the five-membered heterocyclic rings with Ca atoms in the centre (Fig. 4b).
Ferroåkermanite structure: (a) layers of corner-sharing Fe2+O4 tetrahedra (brown) and SiO4 tetrahedra (blue) combined into Si2O7 units, connected by large eightfold-coordinated Ca atoms (grey) in a form of square antiprism – projection along [100]. (b) Five-membered heterocyclic rings consisting of two Fe2+O4 and three SiO4 tetrahedra with Ca atoms in the centre – projection along [001]. The unit-cell is outlined with a dotted line. Drawn using CrystalMaker software.

In the ferroåkermanite structure obtained, both the X and T1 sites show mixed occupancy. The X site occupied by Ca2+ is partially substituted by Na+, and the occupancy refinement converges to Ca0.96(3)Na0.04(3) (Table 3). The interatomic distances for the square antiprism (CaO8) range from 2.452(13) Å to 2.749(12) Å, with an average of 2.589 Å (Table 5). A similar observation is made for the T1 site when the partial substitution of Fe2+ by Al3+ is considered. For this tetrahedrally-coordinated site, the refined site occupancy is Fe2+0.63(3)Al0.37(3) (Table 3). The larger Fe2+O4 tetrahedra are regular with four equal Fe–O bonds of 1.848(10), whereas the smaller SiO4 tetrahedra of Si2O7 units are highly irregular with the Si–O bond varying from 1.562(11) Å to 1.627(7) Å (Table 5).
Raman spectroscopy data
The Raman spectrum of ferroåkermanite (Fig. 5) shows similarities with the spectra of natural and synthetic phases with the melilite-type structure (Sharma et al., Reference Sharma, Yoder and Matson1988; Hanuza et al., Reference Hanuza, Ptak, Mączka, Hermanowicz, Lorenc and Kaminskii2012). However, in comparison with the published data, the larger or smaller number of Raman bands noted in the spectrum obtained may be mainly related to the deconvolution and curve fitting (Gaussian–Lorentzian functions) of the component bands or low-intensity and random degeneration. According to previous Raman studies and the available knowledge, the following Raman band assignment is proposed for ferroåkermanite. The high-frequency region (1100–600 cm–1) includes Raman bands corresponding predominantly to the stretching vibrations of the bonds in the (Fe2+O4)6– tetrahedra and (Si2O7)6– groups at the T1 and T2 sites. The most intense bands centred at 620 cm–1 and 664 cm–1 with a shoulder at 702 cm–1 are related to symmetric stretching vibrations (νs) of (Fe2+O4)6– and Si–O–Si modes of Si2O7 unit, respectively. Asymmetric stretching vibrations of the disilicate unit (νas of Si–O–Si) are observed above 1000 cm–1 with two Raman bands at 1053 and 1072 cm–1. Symmetric stretching vibrations of (SiO3) non-bridging oxygen of (SiO4)4– tetrahedra occur in the spectral range between 870 and 1000 cm–1. The presence of the Raman band at 836 cm–1 assigned to the symmetric stretching vibrations (νs) of (AlO4)5– could indicate and confirm the partial substitution at the tetrahedral site.
Raman spectrum of ferroåkermanite.

The spectral region between 400 and 500 cm–1 in melilite-group minerals is correlated with different types of deformation (δ) and translation (Т) modes of cations and large structural units (Sharma et al., Reference Sharma, Yoder and Matson1988; Ogorodova et al., Reference Ogorodova, Gritsenko, Vigasina, Bychkov, Ksenofontov and Melchakova2018). Raman bands in the ferroåkermanite spectrum placed at 434 and 478 cm–1 are assigned to the asymmetric (νas) bending vibrations of Si–O–Si. In turn, several Raman bands with variable intensities at 245, 289, 309 and 371 cm–1 are assigned to the rocking (ρ) vibrations of lateral (SiO3). The Ca–O and lattice vibrations are recorded below 200 cm–1 in the spectrum of ferroåkermanite.
Discussion
Ferroåkermanite is a new and ninth member of the melilite group with the following general formula X 2T1(T2)2O7, which comprises isostructural sorosilicate minerals (Supplementary Table S1). Recently, another member of this group, bennesherite Ba2FeSi2O7, was described in the paralava samples from the Hatrurim Complex in Israel (Krzątała et al., Reference Krzątała, Krüger, Galuskina, Vapnik and Galuskin2022). Ferroåkermanite, similar to its Ba-analogue, is a ferrous melilite in which Fe2+ ions mostly occupy the tetrahedral T1 site. Ferrous iron has also been detected in the chemical composition of other melilite-group members, such as alumoåkermanite (Wiedenmann et al., Reference Wiedenmann, Zaitsev, Britvin, Krivovichev and Keller2009), åkermanite (Deer et al., Reference Deer, Howie and Zussman1986) and hydroxylgugiaite (Grice et al., Reference Grice, Kristiansen, Friis, Rowe, Cooper, Poirier, Yang and Weller2017). However, in the latter, the Fe2+ was allocated to the X site during the calculation of the chemical composition.
As shown in Table 2, the calculation of the stoichiometric formula (based on 7 O) from microprobe data analyses of ferroåkermanite indicates that almost all of the Fe is divalent. As iron is the only element with a variable oxidation state, the Fe2+/Fe3+ ratio can be calculated from the charge balance. More than 50 analyses were performed on grains from the paralava specimen. The Fe2+/Fe3+ ratio calculation showed that the Fe3+ content is insignificant, <0.1 apfu and is absent in most analyses (Table 2, Fig. 3). Considering the structural aspect, all oxygen positions around the T1 and T2 sites, are fully occupied. Furthermore, the average Si–O distance is 1.61 Å (Table 5) which confirms that the T2 site is almost fully occupied by Si4+, which is only possible in melilite members with stoichiometry X 2T12+Si2O7. Moreover, the unit-cell parameters of ferroåkermanite a = b = 7.7813(7) Å, c = 5.0114(5) Å are similar to those of hardystonite and åkermanite (a = b = 7.83 Å, c = 5.01 Å for both, Table S1) (Louisnathan, Reference Louisnathan1969; Swainson et al., Reference Swainson, Dove, Schmahl and Putnis1992), which have Zn2+ and Mg2+ allocated at the T1 site. The ionic radii of both cations (Zn2+ = 0.60 Å and Mg2+ = 0.57 Å) are similar to the radius of divalent Fe (0.63 Å). In addition, the presence of other Fe2+-bearing minerals in the paralava studied, such as kirschsteinite CaFeSiO4, chromite FeCr2O4, ulvöspinel TiFe2O4, and bennesherite Ba2FeSi2O7 indicates conditions favouring the predominance of ferrous Fe in the composition of ferroåkermanite.
Where Fe3+ is the dominant cation at the T1 site, with occupancy (Fe3+0.63Al0.37), half of the T2 site would be substituted by trivalent Al or Fe cations to maintain the charge balance. Moreover, the increase in Fe3+ in the åkermanite structure would be accompanied by an increase in c and a decrease in the a and b parameters. This was shown as an example of åkermanite with 44% Fe3+ (a = b = 7.80 Å and c = 5.05 Å) by Hamada and Akasaka (Reference Hamada and Akasaka2013). The natural ‘ferrigehlenite’ with chemical formula (Ca2.00Na0.02)Σ2.02(Fe3+0.67Al0.21Mg0.09Zn0.02)Σ0.99(Si1.17Al0.83)Σ2.00O7 was detected in oxidised paralava from the Hatrurim Complex, with unit-cell parameters a = b = 7.76 Å and c = 5.08 Å (unpublished data belonging to the present authors). Its structural analysis indicated that Fe3+ occupied both tetrahedral sites T1 and T2 equally.
The cation-site populations were used to calculate the weighted bond valence sum (BVS) using the coefficient parameters given by Gagné and Hawthorne (Reference Gagné and Hawthorne2015). The results of the BVS calculations for ferroåkermanite and other selected members of the melilite group are correlated in Tables 6 and 7, respectively. The very low BVS(X) = 1.538 vu is an effect of 6+2 coordination and long bond lengths, especially to O2 and O3 atoms. The same bonds also influence the lower BVS of the O2 atom. Considering Pauling’s rule, the radius ratios R(Ca2+)/R(O2–) = 0.708 and R(Na+)/R(O2–) = 0.728 are <0.732, showing that the expected coordination for the Ca-atom is 6 and for Na on the very limit between 6 and 8. The relatively high BVS for the T1 site, as well as the low BVS for the X site, are related to the four-fold coordination atypical of Fe2+. The thermal ellipsoid of T1 is strongly elongated in the (001) direction, which indicates significant displacement variations and/or the presence of cations with significantly different radii and charges. A similar feature has been noted for bennesherite, which also has divalent Fe at the T1 site (Krzątała et al., Reference Krzątała, Krüger, Galuskina, Vapnik and Galuskin2022). The calculated BVS(T1) for ferroåkermanite is 2.502 vu, which is close to the charge of 2.4 calculated from the empirical formula. The observed difference is related to the mixed T1 site occupancy, and 37% of Al leads to the increase of BVS at this site. Such deviations are typical of minerals with a melilite-type structure (Table 7), which is an incommensurate structure caused by the mismatch between the tetrahedral [Fe2+Si2O7]4– sheets and the Ca2+ ions (Seifert et al., Reference Seifert, Czank, Simons and Schmahl1987). Studies of the stability of synthetic ferroåkermanite have revealed the following behaviour: the Ca₂Fe2⁺Si₂O₇ phase is unstable at compositions between ∼82 and 100%. Below 70%, however, the phase becomes stable again. Within the intermediate range of 70–82%, the structure becomes more complex, marked by a doubling of the c lattice parameter. In the lowest compositional range, depending on temperature, the crystal structure may be either commensurate or incommensurate (Seifert et al., Reference Seifert, Czank, Simons and Schmahl1987).
Detailed bond valence sum (BVS) calculations in valence unit (vu) for ferroåkermanite

Results of weighted bond valence sum (BVS) calculations in valence unit (vu) for different compounds with melilite-type structure

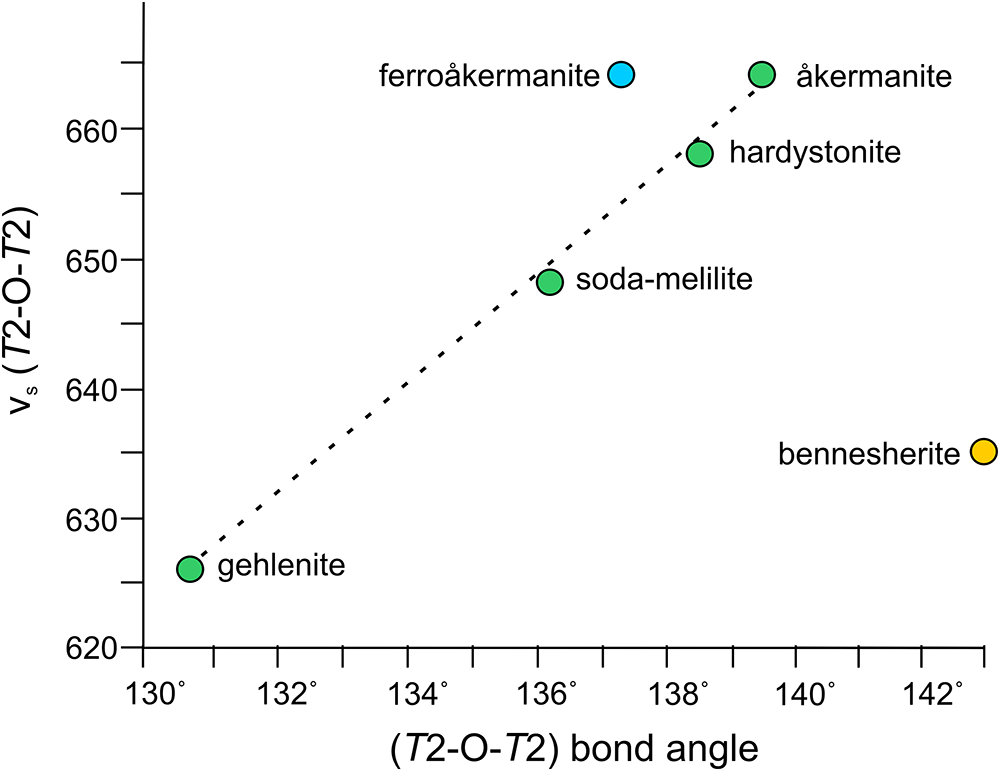
The description of the Raman band-ranges assignment for the ferroåkermanite spectrum is in good agreement with the spectroscopic reports of the melilite-group minerals given in many previous publications (Sharma et al., Reference Sharma, Simons and Yoder1983, Reference Sharma, Yoder and Matson1988; Dowty, Reference Dowty1987; Hanuza et al., Reference Hanuza, Ptak, Mączka, Hermanowicz, Lorenc and Kaminskii2012; Ogorodova et al., Reference Ogorodova, Gritsenko, Vigasina, Bychkov, Ksenofontov and Melchakova2018). It is not surprising that the similarities are noted, especially for such melilites as åkermanite Ca2MgSi2O7, hardystonite Ca2ZnSi2O7, soda-melilite NaCaAl(Si2O7), and gehlenite Ca2Al(SiAlO7), all Ca-dominant phases. For the mentioned melilites, it was shown that the frequencies of the band related to the symmetric stretching vibrations (T2–O–T2) of the Si2O7 group have a linear dependence with bridging T2–O–T2 angle, i.e. the greater the T2–O–T2 angle of the Si2O7 unit, the higher the frequencies of Raman bands attributed to the νs (T2–O–T2) modes (Sharma et al., Reference Sharma, Yoder and Matson1988). For ferroåkermanite, the band frequency is the same as for åkermanite, ∼664 cm–1; however, the Si–O–Si angle is smaller, 137.2°, with ∼139.5° for åkermanite (Fig.6) (Sharma et al., Reference Sharma, Yoder and Matson1988). For other Ca-bearing melilites, the frequencies of the Raman bands assigned to the νs (T2–O–T2) as well as T2–O–T2 angles decrease from hardystonite 658 cm–1/138.5° to gehlenite 626 cm–1/130.6° (Sharma et al., Reference Sharma, Yoder and Matson1988).
Dependence of νs (T2–O–T2) band frequency of melilites (cm–1) on the T2–O–T2 bond angle in the (T2)2O7 units (modified after Sharma et al., Reference Sharma, Yoder and Matson1988).

However, for the natural melilite with Fe2+ at the T1 site – bennesherite Ba2FeSi2O7, the spectroscopic results are slightly different (Juroszek and Ternes, Reference Juroszek and Ternes2022; Krzątała et al., Reference Krzątała, Krüger, Galuskina, Vapnik and Galuskin2022). As observed, most of the Raman bands in selected spectral regions were shifted to lower wavenumbers. For example, the prominent peak assigned to νs (T2–O–T2) lies at 635 cm–1 in the Raman spectrum of bennesherite from the Hatrurim Complex in Israel (Krzątała et al., Reference Krzątała, Krüger, Galuskina, Vapnik and Galuskin2022) and even lower at 618 cm–1 in the spectrum of bennesherite from the Bellerberg volcano in Germany (Juroszek and Ternes, Reference Juroszek and Ternes2022). In addition, bands related to the νs (FeO4)6– appear at 585 cm–1 for the Israeli sample and 589 cm–1 for the German specimen, respectively (Juroszek and Ternes, Reference Juroszek and Ternes2022; Krzątała et al., Reference Krzątała, Krüger, Galuskina, Vapnik and Galuskin2022). It confirms that the heavy Ba atom, which occupies the X site in the crystal structure of bennesherite, plays a significant role in reduction of the Raman band frequencies despite the value of the T2–O–T2 angle being the largest reported for melilite (142.9°; Fig. 6) (Krzątała et al., Reference Krzątała, Krüger, Galuskina, Vapnik and Galuskin2022).
Spurrite and larnite-bearing pyrometamorphic rocks, as well as gehlenite hornfelses, are the most widespread pyrometamorphic rocks of the Hatrurim Complex (Gross, Reference Gross1977; Grapes, Reference Grapes2006; Vapnik et al., Reference Vapnik, Sharygin, Sokol and Shagam2007; Sokol et al., Reference Sokol, Novikov, Zateeva, Vapnik, Shagam and Kozmenko2010; Novikov et al., Reference Novikov, Vapnik and Safonova2013; Kolodny et al., Reference Kolodny, Burg, Geller, Halicz and Zakon2014). Within the latter, small lens- and dyke-like bodies of paralava can be found (Vapnik et al., Reference Vapnik, Sharygin, Sokol and Shagam2007). Usually, hornfelses and paralava are high-temperature products of metamorphism of the same metasedimentary protolith (Sokol et al., Reference Sokol, Novikov, Vapnik and Sharygin2007; Vapnik et al., Reference Vapnik, Sharygin, Sokol and Shagam2007). However, paralava is the product of total melting, as indicated by its fluid and coarse-grained (pegmatoid) texture and common veining and rarely cross-veining in host rocks (Burg et al., Reference Burg, Starinsky, Bartov and Kolodny1991; Sokol et al., Reference Sokol, Novikov, Vapnik and Sharygin2007; Vapnik et al., Reference Vapnik, Sharygin, Sokol and Shagam2007). In the case of the absence of significant compositional differences between hornfelses and paralava, melting processes were probably mainly controlled by local and enhanced variation in heat source rather than protolith composition (Vapnik et al., Reference Vapnik, Sharygin, Sokol and Shagam2007). In the Hatrurim Complex, examples of coarse-grained, high-temperature paralava assemblages are common (Sharygin et al., Reference Sharygin, Vapnik, Sokol, Kamenetsky and Shagam2006a, Reference Sharygin, Vapnik, Sokol and Shagam2006b; Vapnik et al., Reference Vapnik, Sharygin, Sokol and Shagam2007; Krzątała et al., Reference Krzątała, Krüger, Galuskina, Vapnik and Galuskin2020; Galuskin et al., Reference Galuskin, Galuskina, Kamenetsky, Vapnik, Kusz and Zieliński2022; Futrzyński et al., Reference Futrzyński, Juroszek, Skrzyńska, Vapnik and Galuskin2023).
The host wollastonite–gehlenite paralava analysed was generated under reducing conditions at low pressures and high temperatures, which could locally (near gas channels) reach 1500°C. Such an assumption could be confirmed by the presence of native iron droplets in the rock samples analysed (Galuskin et al., Reference Galuskin, Galuskina, Kamenetsky, Vapnik, Kusz and Zieliński2022; Futrzyński et al., Reference Futrzyński, Juroszek, Skrzyńska, Vapnik and Galuskin2023). However, the presence of wollastonite indicates that the temperature during crystallization did not exceed 1125°C (Seryotkin et al., Reference Seryotkin, Sokol and Kokh2012; Galuskin et al., Reference Galuskin, Galuskina, Kamenetsky, Vapnik, Kusz and Zieliński2022, Reference Galuskin, Kusz, Galuskina, Książek, Vapnik and Zieliński2023; Futrzyński et al., Reference Futrzyński, Juroszek, Skrzyńska, Vapnik and Galuskin2023). The shape of a lens-like kirschsteinite-bearing paralava within the wollastonite–gehlenite rock may indicate that it formed in a gaseous channel after partial solidification of the host rock. Furthermore, it is not obvious whether this is an additional segregation of melt or the rest of the material from the host rock enriched in some constituents (Fe, Si, Ti, K, Ba) due to its alteration during pyrometamorphism.
However, the formation of the olivine member, kirschsteinite, at >1100°C has been confirmed previously (Wyderko and Mazanek, Reference Wyderko and Mazanek1968; Mukhopadhyay and Lindsley, Reference Mukhopadhyay and Lindsley1983; Folco and Mellini, Reference Folco and Mellini1997). In addition, associated rock-forming minerals such as gehlenite or rankinite suggest that this paralava formed under high-temperature conditions, confirming that the new mineral ferroåkermanite is indeed a high-temperature phase. The temperature of melt-inclusion formation (T >1200°C) associated with paralava has also been established previously (Sharygin et al., Reference Sharygin, Vapnik, Sokol, Kamenetsky and Shagam2006a). Furthermore, the presence of Fe2+-bearing phases, such as kirschsteinite, ferroåkermanite, chromite, ulvöspinel and bennesherite indicates the occurrence of reduced conditions (Futrzyński et al., Reference Futrzyński, Juroszek, Skrzyńska, Vapnik and Galuskin2023).
Supplementary material
The supplementary materials include cif and check-cif files of the holotype ferroåkermanite; Table S1: Comparison of physical properties of ferroåkermanite with members of the melilite group minerals; and Table S2: The calculated X-ray powder diffraction data for ferroåkermanite. The supplementary material for this article can be found at https://doi.org/10.1180/mgm.2025.10120.
Acknowledgements
We thank Oleg Siidra and two anonymous reviewers for their insightful and supportive comments, which helped to improve the manuscript.
Financial statement
The investigation was co-financed by the Polish National Agency for Academic Exchange BPN/BAT/2023/1/00019/U/00001 and OeAD Project: Scientific & Technological Cooperation Austria-Poland, Project PL 11/2024, and partially supported by the National Science Centre (NCN) of Poland Grant 2021/41/B/ST10/00130.
Competing interests
The authors declare none.


 Open access