


1. Introduction
Active galactic nuclei (AGN) are powered by the accretion of gas onto supermassive black holes located at the centres of galaxies (Lynden-Bell Reference Lynden-Bell1969). Since AGN are fuelled by gas inflow to the black hole, there should be a significant amount of gas present in the host galaxies that can flow to the centre or be supplied from nearby interacting galaxies. This process leads to triggering AGN. As a result, AGN release two strong, ferocious jets in opposite directions. These jets play a crucial role in shaping the surrounding environment and influencing galaxy evolution.
AGN play a critical role in the evolution of galaxies as we presently understand it – the host galaxies have an intertwined evolution. They are one of the main channels for star-formation shut-down through the feedback of inflow of the circumgalactic medium (Oh, Oh, & Yi Reference Oh, Oh and Yi2012). However, some evidence also hints towards the positive feedback from AGN, inducing star-formation by over-compressing cold dense gas (Zubovas, Wynn, & Gualandris Reference Zubovas, Wynn and Gualandris2013; Silk Reference Silk2013; Feain et al. Reference Feain, Papadopoulos, Ekers and Middelberg2007).
However, triggering the active phase of AGN remains a topic of debate. In order to supply gas to the central black hole, the gas must lose angular momentum. The suspicion has long been that galaxy collisions (or interactions) provide the requisite torque to bring that gas into the nucleus (e.g. Hong et al. Reference Hong, Im, Kim and Ho2015; Dietrich et al. Reference Dietrich2018; Gao et al. Reference Gao2020; Marian et al. Reference Marian2020). On the other hand, the role of interactions in forming AGN is hotly debated (e.g. McKernan, Ford, & Reynolds Reference McKernan, Ford and Reynolds2010; Marian et al. Reference Marian2019; Stone et al. Reference Stone2021; Wethers et al. Reference Wethers2022a; Stone et al. Reference Stone2023). This debate arises because while mergers are often assumed to be the primary mechanisms for AGN activity, the presence of AGN in isolated galaxies suggests other processes, such as bars and disks, may also contribute significantly (Alonso, Coldwell, & Lambas Reference Alonso, Coldwell and Lambas2013; Oh et al. Reference Oh, Oh and Yi2012; Kocevski et al. Reference Kocevski, Brightman, Koekemoer and Nandra2015). Secular processes funnel gas towards the central region of a galaxy, triggering AGN activity in the absence of mergers or external interactions (Martini et al. Reference Martini, Regan, Mulchaey and Pogge2003; Oh et al. Reference Oh, Oh and Yi2012; Alonso et al. Reference Alonso, Coldwell and Lambas2013; Alonso et al. Reference Alonso, Vera-Rueda, Coldwell, Duplancic and Mesa2024; Galloway et al. Reference Galloway2015). Although these secular processes can operate independently of the large-scale environment, external environmental factors such as tidal forces can exhibit stronger bars and enhance internal instabilities, which could strengthen gas inflows and fuel AGN (Łokas et al. Reference Łokas2016; Peschken & Łokas Reference Peschken and Łokas2019). The relationship between the environment and secular processes is not mutually exclusive, but they may accompany each other to fuel AGN. The question remains: how important is the environment in triggering or feeding the AGN? Although other processes can indeed provide a viable argument for AGN activity, in this study, we focus only on the environmental effects of AGN.
Studies have explored possible environmental effects on AGN (e.g. Best et al. Reference Best2005; Kewley et al. Reference Kewley, Groves, Kauffmann and Heckman2006; Kauffmann et al. Reference Kauffmann2003; Lopes, Ribeiro, & Rembold Reference Lopes, Ribeiro and Rembold2017; Argudo-Fernández et al. Reference Argudo-Fernández2016; Pimbblet et al. Reference Pimbblet, Shabala, Haines, Fraser-McKelvie and Floyd2013).The role of environment on the AGN fraction has been highlighted by a similar or higher fraction of AGN in cluster galaxies, depending on the discovery wavelength and viewing angle (Gilmour et al. Reference Gilmour2007; Martini et al. Reference Martini, Kelson, Mulchaey and Trager2002; Martini, Mulchaey, & Kelson Reference Martini, Mulchaey and Kelson2007; Kocevski et al. Reference Kocevski2009). For example, at high redshift, (Shah et al. Reference Shah2024) finds that the optical AGN fraction rises from $1.9^{+0.4}_{-0.3}\%$
in coeval field regions (
$1.9^{+0.4}_{-0.3}\%$
in coeval field regions ( ${\sigma}_{\delta} \lt 2$
) to
${\sigma}_{\delta} \lt 2$
) to $10.9^{+3.6}_{-2.3}\%$
in highly overdense environments (
$10.9^{+3.6}_{-2.3}\%$
in highly overdense environments ( ${\sigma}_{\delta} \gt 5$
) at
${\sigma}_{\delta} \gt 5$
) at $2 \lt z \lt 4 $
. Similarly, X-ray AGN studies have also shown that AGN were more prevalent in cluster environments in the past (Martini et al. Reference Martini2013b; Shah et al. Reference Shah2024). Moreover, a study by Bradshaw et al. (Reference Bradshaw2011) shows that both X-ray-selected and radio-loud AGN preferentially reside in overdense environments at
$2 \lt z \lt 4 $
. Similarly, X-ray AGN studies have also shown that AGN were more prevalent in cluster environments in the past (Martini et al. Reference Martini2013b; Shah et al. Reference Shah2024). Moreover, a study by Bradshaw et al. (Reference Bradshaw2011) shows that both X-ray-selected and radio-loud AGN preferentially reside in overdense environments at $1\lt z\lt1.5$
, with radio-loud AGN exhibiting stronger clustering with passive galaxies than X-ray AGN. However, the prevalence of AGN in dense environments varies across cosmic time, especially with optical AGN. For instance, in their study on optical AGN population from cluster members and field galaxies at
$1\lt z\lt1.5$
, with radio-loud AGN exhibiting stronger clustering with passive galaxies than X-ray AGN. However, the prevalence of AGN in dense environments varies across cosmic time, especially with optical AGN. For instance, in their study on optical AGN population from cluster members and field galaxies at $z \sim 0.1$
, Lopes et al. (Reference Lopes, Ribeiro and Rembold2017) find a higher AGN fraction in field galaxies with
$z \sim 0.1$
, Lopes et al. (Reference Lopes, Ribeiro and Rembold2017) find a higher AGN fraction in field galaxies with $\log(M/M_{\odot}) \geq 10.6$
, with the AGN fraction decreasing inwards. A similar investigation by Wethers et al. (Reference Wethers2022a) using GAMA data at
$\log(M/M_{\odot}) \geq 10.6$
, with the AGN fraction decreasing inwards. A similar investigation by Wethers et al. (Reference Wethers2022a) using GAMA data at $0.1\lt z\lt0.35$
finds that low-redshift optical quasars inhabit environments similar to matched galaxies, with a slight preference for group centres, hinting toward the insignificance of environmental dependence, and a similar trend is seen in other optically selected-AGN studies at local Universe (Argudo-Fernández et al. Reference Argudo-Fernández2016; Sabater, Best, & Argudo-Fernández Reference Sabater, Best and Argudo-Fernández2013; Pimbblet et al. Reference Pimbblet, Shabala, Haines, Fraser-McKelvie and Floyd2013). These varying preferences with environmental density across epochs indicate that the mechanisms fuelling AGN may change over cosmic time. In this study, we aim to understand whether AGN activity is driven by specific environments in the cosmic Large-Scale Structure (LSS) in local Universe.
$0.1\lt z\lt0.35$
finds that low-redshift optical quasars inhabit environments similar to matched galaxies, with a slight preference for group centres, hinting toward the insignificance of environmental dependence, and a similar trend is seen in other optically selected-AGN studies at local Universe (Argudo-Fernández et al. Reference Argudo-Fernández2016; Sabater, Best, & Argudo-Fernández Reference Sabater, Best and Argudo-Fernández2013; Pimbblet et al. Reference Pimbblet, Shabala, Haines, Fraser-McKelvie and Floyd2013). These varying preferences with environmental density across epochs indicate that the mechanisms fuelling AGN may change over cosmic time. In this study, we aim to understand whether AGN activity is driven by specific environments in the cosmic Large-Scale Structure (LSS) in local Universe.
The specific influence of the LSS environment–namely, filaments, tendrils, and void– on AGN is less constrained and remains a topic of active research. Fuelling the central black hole requires an inflow of gas. If mergers and gravitational interactions between galaxies induce sufficient gas inflow to the host galaxies, these effects can be prominent in the denser regions of the LSS, such as filaments and tendrils, leading to a higher AGN fraction compared to the void (for more details on LSS, see Alpaslan et al. Reference Alpaslan2014 and Section 2.2). In this study, we investigate the population of narrow-band optical Seyfert II AGN (hereafter Seyferts) population in LSS using a sample of galaxies from the GAMA Large Scale Structure Catalogue (GLSSC) produced by Alpaslan et al. (Reference Alpaslan2014). Many theoretical methods have been introduced to distinguish star-forming galaxies from true optical AGN galaxies, however, in our case, we use the optical nebular lines ratios method [OIII]5007/H $\beta$
vs. [NII]6583/H
$\beta$
vs. [NII]6583/H $\alpha$
called the BPT diagram introduced by Baldwin et al. (Reference Baldwin, Phillips and Terlevich1981). Also, we also use related line ratios methods introduced by Veilleux & Osterbrock (Reference Veilleux and Osterbrock1987) where they replace forbidden [NII] with [SII] and [OI], and a further theoretical framework for categorising star-forming and AGN galaxies is given by Kewley et al. (Reference Kewley, Dopita, Sutherland, Heisler and Trevena2001). In this study, we investigate the dependence of AGN galaxies on their environments in LSS by comparing AGN fractions in each large-scale region using each of three diagnostic line diagrams. In addition, we also report the AGN fraction as a distance from the nearest filament to further understand the environmental dependence.
$\alpha$
called the BPT diagram introduced by Baldwin et al. (Reference Baldwin, Phillips and Terlevich1981). Also, we also use related line ratios methods introduced by Veilleux & Osterbrock (Reference Veilleux and Osterbrock1987) where they replace forbidden [NII] with [SII] and [OI], and a further theoretical framework for categorising star-forming and AGN galaxies is given by Kewley et al. (Reference Kewley, Dopita, Sutherland, Heisler and Trevena2001). In this study, we investigate the dependence of AGN galaxies on their environments in LSS by comparing AGN fractions in each large-scale region using each of three diagnostic line diagrams. In addition, we also report the AGN fraction as a distance from the nearest filament to further understand the environmental dependence.
This paper is organised as follows: Section 2 details the regions of LSS and sample size. In Section 3, we plot the BPT diagrams to identify AGN galaxies from the sample. Finally, Section 4 presents the quantitative results of this study. Throughout this paper, We use $ H_0 = 100\ \mathrm{km \, s^{-1} \, Mpc^{-1}} $
,
$ H_0 = 100\ \mathrm{km \, s^{-1} \, Mpc^{-1}} $
, $ \Omega_M = 0.25 $
,
$ \Omega_M = 0.25 $
, $ \Omega_\Lambda = 0.75 $
, and
$ \Omega_\Lambda = 0.75 $
, and $ h = H_0 / 100\ \mathrm{km\ s^{-1}\ Mpc^{-1}} = 1$
is assumed when calculating absolute magnitudes (same as Alpaslan et al. Reference Alpaslan2014).
$ h = H_0 / 100\ \mathrm{km\ s^{-1}\ Mpc^{-1}} = 1$
is assumed when calculating absolute magnitudes (same as Alpaslan et al. Reference Alpaslan2014).
2. Data
2.1. Gama survey
The parent survey for this study is the Galaxy And Mass Assembly (GAMA) survey (Driver et al. Reference Driver2009; Driver et al. Reference Driver2022b; Liske et al. Reference Liske2015). The GAMA survey consists of five regions: G09, G12, G15, G02, and G23. Three of these – G09 (RA = 9 h, Dec = $+0.5^\circ$
), G12 (RA = 12 h, Dec =
$+0.5^\circ$
), G12 (RA = 12 h, Dec = $-0.5^\circ$
), and G15 (RA = 14.5 h, Dec =
$-0.5^\circ$
), and G15 (RA = 14.5 h, Dec = $-0.5^\circ$
) – are equatorial fields, each spanning approximately 12
$-0.5^\circ$
) – are equatorial fields, each spanning approximately 12 $^\circ$ $\times$
5
$\times$
5 $^\circ$
, and together covering nearly 250 000 galaxies. The equatorial fields form a highly uniform dataset in terms of both photometric and spectroscopic coverage, with spectroscopic completeness exceeding 95% for objects brighter than
$^\circ$
, and together covering nearly 250 000 galaxies. The equatorial fields form a highly uniform dataset in terms of both photometric and spectroscopic coverage, with spectroscopic completeness exceeding 95% for objects brighter than $r \lt 19.3$
. GAMA is a multi-wavelength imaging survey conducted with the intent to investigate large-scale structure (LSS) in the local Universe (
$r \lt 19.3$
. GAMA is a multi-wavelength imaging survey conducted with the intent to investigate large-scale structure (LSS) in the local Universe ( $z \lt 0.6$
) on kpc to Mpc scales (Driver et al. Reference Driver2009; Driver et al. Reference Driver2011; Driver et al. Reference Driver2022b; Baldry et al. Reference Baldry2018). Additional photometric data was collected on each galaxy in 20+ bands (Liske et al. Reference Liske2015; Driver et al. Reference Driver2016; Driver et al. Reference Driver2022b; Baldry et al. Reference Baldry2018) to be used for Spectral Energy Distribution fits (Wright, Driver, & Robotham Reference Wright, Driver and Robotham2018; Driver et al. Reference Driver2018). The photometric imaging used to define the target catalogue is substantially deeper than the spectroscopic limit and therefore does not limit the parent sample (details are presented in Liske et al. Reference Liske2015; Driver & GAMA Team 2016; Driver et al. Reference Driver2022a). This specific study uses GAMA Data Release 4, detailed in Driver et al. (Reference Driver2022b). This highly complete redshift catalogue is ideal to identify smaller groupings of galaxies and local environments (Brough et al. Reference Brough2011; Robotham et al. Reference Robotham2011; Robotham et al. Reference Robotham2014).
$z \lt 0.6$
) on kpc to Mpc scales (Driver et al. Reference Driver2009; Driver et al. Reference Driver2011; Driver et al. Reference Driver2022b; Baldry et al. Reference Baldry2018). Additional photometric data was collected on each galaxy in 20+ bands (Liske et al. Reference Liske2015; Driver et al. Reference Driver2016; Driver et al. Reference Driver2022b; Baldry et al. Reference Baldry2018) to be used for Spectral Energy Distribution fits (Wright, Driver, & Robotham Reference Wright, Driver and Robotham2018; Driver et al. Reference Driver2018). The photometric imaging used to define the target catalogue is substantially deeper than the spectroscopic limit and therefore does not limit the parent sample (details are presented in Liske et al. Reference Liske2015; Driver & GAMA Team 2016; Driver et al. Reference Driver2022a). This specific study uses GAMA Data Release 4, detailed in Driver et al. (Reference Driver2022b). This highly complete redshift catalogue is ideal to identify smaller groupings of galaxies and local environments (Brough et al. Reference Brough2011; Robotham et al. Reference Robotham2011; Robotham et al. Reference Robotham2014).
2.2. Understanding the large-scale cosmic structure
In this section, we present a qualitative understanding of filaments, tendrils, and voids in LSS. Robotham et al. (Reference Robotham2011) constructed the galaxy group and pair catalogue, GroupFindingv06, using a friends-of-friends (FoF) algorithm across the three equatorial regions G09, G12, and G15. Alpaslan et al. (Reference Alpaslan2014) use GroupFindingv06 to divide the grouping galaxy further and examine the regions of filaments, tendrils, and voids. The construction of the LSS in GAMA by Alpaslan et al. (Reference Alpaslan2014) was performed using the FoF, Minimal Spanning Tree (MST), and Scooper algorithms, which apply graph-theoretical methods to classify galaxies into filaments, tendrils, and voids. In Figure 1, we illustrate z as the radial coordinate and RA along the arc for the three equatorial regions covered by GAMA, to display LSS, similar to Figure 9 of Alpaslan et al. (Reference Alpaslan2014).
Sections of the G09, G12, and G15 fields. Galaxies in blue, red, and dark green are filament, tendril, and void galaxies, respectively. Declination is restricted to $-1$
to 1 for clarity.
$-1$
to 1 for clarity.

2.2.1. Filaments
Filament galaxies are part of the most overdense structure within the cosmic web, which forms an extensive network of galaxies and galaxy groups. Filamentary structures are identified using a three-pass approach based on the MST algorithm. Firstly, galaxy groups are linked in co-moving Euclidean space, and galaxies with connections exceeding a separation threshold $b = 5.75 h^{-1}$
Mpc are dropped. This ensures that
$b = 5.75 h^{-1}$
Mpc are dropped. This ensures that $\ge 90 \%$
of luminous galaxies (
$\ge 90 \%$
of luminous galaxies ( ${L}_\star \ge 10^{11}\,\text{L}_\odot$
) are included in filaments. In the second pass, all galaxies within a fixed radial distance
${L}_\star \ge 10^{11}\,\text{L}_\odot$
) are included in filaments. In the second pass, all galaxies within a fixed radial distance $r = 4.12 h^{-1}$
Mpc of these filamentary group structures are associated with filaments. This defines the filament galaxy population and provides a robust identification of galaxies tracing the highest density peaks in the large-scale structure. The remaining galaxies after the first two passes are fed into the third pass to determine the tendril population.
$r = 4.12 h^{-1}$
Mpc of these filamentary group structures are associated with filaments. This defines the filament galaxy population and provides a robust identification of galaxies tracing the highest density peaks in the large-scale structure. The remaining galaxies after the first two passes are fed into the third pass to determine the tendril population.
2.2.2. Tendrils
Tendril galaxies make up intermediately dense substructures that branch off from the filaments and extend into less overdense regions; tendrils are less massive and less dense than the filaments. They are typically linear chains of galaxies that either connect multiple filaments or terminate within voids. Tendril galaxies are identified by applying the MST algorithm to the remaining, non-filament galaxy population. To avoid connecting galaxies across large voids, edges or links greater than a threshold distance $q = 4.56\ h^{-1}$
Mpc are pruned, and the residual component is classified as tendrils. Tendril galaxies must have
$q = 4.56\ h^{-1}$
Mpc are pruned, and the residual component is classified as tendrils. Tendril galaxies must have $r \ge 4.12\ h^{-1}$
Mpc away from the nearest filament galaxy and lie within q of a neighbouring tendril galaxy.
$r \ge 4.12\ h^{-1}$
Mpc away from the nearest filament galaxy and lie within q of a neighbouring tendril galaxy.
2.2.3. Voids
Void galaxies are located in the underdense part of the LSS and are isolated from both filamentary and tendril structures. Similar to tendril galaxies, a void galaxy must lie ${q}\ge 4.56\ h^{-1}$
Mpc from the nearest tendril galaxy. Traditional void-finding algorithms – like the one used by Pan et al. (Reference Pan, Vogeley, Hoyle, Choi and Park2012) – define a void by removing overdense environments using some density threshold, then identifying a common empty region that meets specific size and shape. However, Alpaslan et al. (Reference Alpaslan2014) classify void by a residual process that isolates galaxies after removing filament and tendril galaxies, based on fixed physical distances. This method avoids the complexity of defining void boundaries or shapes and isolates truly isolated galaxies.
${q}\ge 4.56\ h^{-1}$
Mpc from the nearest tendril galaxy. Traditional void-finding algorithms – like the one used by Pan et al. (Reference Pan, Vogeley, Hoyle, Choi and Park2012) – define a void by removing overdense environments using some density threshold, then identifying a common empty region that meets specific size and shape. However, Alpaslan et al. (Reference Alpaslan2014) classify void by a residual process that isolates galaxies after removing filament and tendril galaxies, based on fixed physical distances. This method avoids the complexity of defining void boundaries or shapes and isolates truly isolated galaxies.
2.3. Sample
In this paper, our primary sources of data come from catalogues that have been produced using the GAMA survey. The galaxies located in filaments, tendrils, and voids are presented in the GAMA Large-Scale Structure Catalogue (GLSSC), which consists of three sub-catalogues – one for each region – each containing the corresponding galaxies. The optical fluxes were extracted from GaussFitSimplev05 catalogue (Gordon et al. Reference Gordon2017) using SpecLineSFR DMU. Finally, the stellar masses are obtained using the MAGPHYS DR4, computed by the GAMA team (Driver et al. Reference Driver2018). Galaxies from each of the three GLSSC catalogues were matched by their CATAID with the GaussFitSimplev05 and MAGPHYS DR4 catalogues to extract fluxes and masses, which were then used to apply restrictions on our data and perform the necessary analyses.
In our sample, a total of 20 200, 10 195, and 1 275 galaxies were recorded for filament, tendril, and void spaces, respectively. We apply $\text{S/N} \geq 3$
on all optical emission lines of interest: H
$\text{S/N} \geq 3$
on all optical emission lines of interest: H $\alpha$
, H
$\alpha$
, H $\beta$
, [SII]6731, [NII]6583, [OI]6300, and [OIII]5007. The S/N criterion is required to accurately classify star-forming and AGN galaxies (Veilleux & Osterbrock Reference Veilleux and Osterbrock1987; Kewley et al. Reference Kewley, Dopita, Sutherland, Heisler and Trevena2001). We also impose a redshift limit of
$\beta$
, [SII]6731, [NII]6583, [OI]6300, and [OIII]5007. The S/N criterion is required to accurately classify star-forming and AGN galaxies (Veilleux & Osterbrock Reference Veilleux and Osterbrock1987; Kewley et al. Reference Kewley, Dopita, Sutherland, Heisler and Trevena2001). We also impose a redshift limit of $0.12 \leq z \leq 0.21$
. The lower redshift limit is adopted to minimise volume and edge effects in LSS construction, which can lead to incomplete environment classification at low redshift. The upper redshift limit reflects the range over which the LSS catalogue is defined by Alpaslan et al. (Reference Alpaslan2014). Finally, the stellar mass limit
$0.12 \leq z \leq 0.21$
. The lower redshift limit is adopted to minimise volume and edge effects in LSS construction, which can lead to incomplete environment classification at low redshift. The upper redshift limit reflects the range over which the LSS catalogue is defined by Alpaslan et al. (Reference Alpaslan2014). Finally, the stellar mass limit $\log(M/M_{\odot}) \geq 9.5$
is also applied. The selected stellar mass restriction is consistent with findings in the existing studies, where there is a strong dependence of AGN in high mass galaxies (
$\log(M/M_{\odot}) \geq 9.5$
is also applied. The selected stellar mass restriction is consistent with findings in the existing studies, where there is a strong dependence of AGN in high mass galaxies ( $\log(M/M_{\odot}$
)
$\log(M/M_{\odot}$
) $\geq 9.5-10$
in the local Universe. The mass cut is imposed to reduce redshift-dependent selection effect inherent to the flux-limited nature of the survey, where low-mass galaxies are underrepresented at higher redshift. In other words, without such a cut, the sample would be biased towards high-mass systems at higher redshift because low-mass galaxies are too faint to be detected with sufficient S/N of their emission lines. To avoid such bias, we calculate the true AGN fraction as the number of true AGN galaxies obtained from the BPT diagrams divided by the total number of galaxies in our restricted sample. After applying the restrictions of
$\geq 9.5-10$
in the local Universe. The mass cut is imposed to reduce redshift-dependent selection effect inherent to the flux-limited nature of the survey, where low-mass galaxies are underrepresented at higher redshift. In other words, without such a cut, the sample would be biased towards high-mass systems at higher redshift because low-mass galaxies are too faint to be detected with sufficient S/N of their emission lines. To avoid such bias, we calculate the true AGN fraction as the number of true AGN galaxies obtained from the BPT diagrams divided by the total number of galaxies in our restricted sample. After applying the restrictions of $\text{S/N} \geq 3$
,
$\text{S/N} \geq 3$
, $0.12 \leq z \leq 0.21$
, and
$0.12 \leq z \leq 0.21$
, and $\log(M/M_{\odot}) \geq {9.5}$
, the sample sizes were reduced to 18 927 for the filament, 9 273 for the tendril, and 1 148 for the void spaces in the fields G09, G12, and G15. In Figure 2, our sample lies between the two vertical lines representing redshift range and above the horizontal line for the stellar mass restriction. It is important to note that the emission line S/N restriction excludes quiescent galaxies with no AGN/LINER present. Since there is a positive correlation between dense environments and the number of quiescent galaxies, the selection may reduce environmental differences in the observed AGN fraction. Therefore, our results apply only to emission-line galaxies and should not be directly generalised to the entire galaxy population across different environments.
$\log(M/M_{\odot}) \geq {9.5}$
, the sample sizes were reduced to 18 927 for the filament, 9 273 for the tendril, and 1 148 for the void spaces in the fields G09, G12, and G15. In Figure 2, our sample lies between the two vertical lines representing redshift range and above the horizontal line for the stellar mass restriction. It is important to note that the emission line S/N restriction excludes quiescent galaxies with no AGN/LINER present. Since there is a positive correlation between dense environments and the number of quiescent galaxies, the selection may reduce environmental differences in the observed AGN fraction. Therefore, our results apply only to emission-line galaxies and should not be directly generalised to the entire galaxy population across different environments.
The restricted sample on which the analysis was conducted. Grey points are the total galaxies observed, whereas blue, green, and orange are filament, tendril, and void galaxies, respectively. The two vertical lines are the redshift restrictions on the sample, and the horizontal line is the stellar mass restriction.

2.3.1. Narrowline AGN bias
It is important to note that great care must be taken when interpreting results in Section 4, which discusses the environmental dependence of AGN fractions, because our AGN sample obtained from the BPT diagrams is intrinsically limited towards narrowline AGN and is not representative of all types of AGN population, i.e. X-ray, IR, or broadline AGN. Broad-line AGN are not identified in this study as their emission lines cannot be robustly measured against their strong nuclear continuum (Baldwin et al. Reference Baldwin, Phillips and Terlevich1981; Veilleux & Osterbrock Reference Veilleux and Osterbrock1987). Also, multi-wavelength selection of AGN, though powerful, is not optimal for our case for a couple of reasons: (1) the GAMA survey we analyse provides high-quality homogeneous optical spectra for a large population of galaxies in LSS, whereas X-ray, infrared (IR), and radio coverage are limited. (2) Multiwavelength approaches target different subsets of the AGN population. For example, X-ray preferentially identifies unobscured, high-luminosity sources; radio selection is often used to study jet-dominated systems. Infrared selection is particularly effective for identifying dust-obscured AGN; however, diagnostics such as the $q_{TIR}$
require robust IR coverage, which is still limited within the GAMA survey.
$q_{TIR}$
require robust IR coverage, which is still limited within the GAMA survey.
Although the BPT diagrams are biased toward the narrow-line AGN population, the classification schemes are consistent across all three regions of the LSS, and therefore the AGN fractions in filaments, tendrils, and voids are comparable.
3. BPT diagrams
BPT diagrams, first introduced by J.A. Baldwin, M. M. Philips, and Roberto Terlevich in 1981 in Baldwin et al. (Reference Baldwin, Phillips and Terlevich1981), are widely used for categorising AGN and star-forming galaxies. We used three BPT diagrams in our analysis: [OIII]5007/H $\beta$
vs. [SII]6731/H
$\beta$
vs. [SII]6731/H $\alpha$
, [OIII]5007/H
$\alpha$
, [OIII]5007/H $\beta$
vs. [NII]6583/H
$\beta$
vs. [NII]6583/H $\alpha$
, and [OIII]5007/H
$\alpha$
, and [OIII]5007/H $\beta$
vs. [OI]6300/H
$\beta$
vs. [OI]6300/H $\alpha$
. These emission lines, obtained from the SpecLineSFR Data Management Unit (DMU) (Gordon et al. Reference Gordon2016), were chosen for their ability to satisfy the selection criteria for diagnostic diagrams (Veilleux & Osterbrock Reference Veilleux and Osterbrock1987). The SpecLineSFR DMU provides spectroscopically derived line fluxes with corrections for stellar absorption and dust extinction, ensuring reliable data for our diagnostic analysis. The [NII]/H
$\alpha$
. These emission lines, obtained from the SpecLineSFR Data Management Unit (DMU) (Gordon et al. Reference Gordon2016), were chosen for their ability to satisfy the selection criteria for diagnostic diagrams (Veilleux & Osterbrock Reference Veilleux and Osterbrock1987). The SpecLineSFR DMU provides spectroscopically derived line fluxes with corrections for stellar absorption and dust extinction, ensuring reliable data for our diagnostic analysis. The [NII]/H $\alpha$
ratio is particularly effective at separating star-forming from AGN-dominated galaxies (Kewley et al. Reference Kewley, Dopita, Sutherland, Heisler and Trevena2001), while [SII]/H
$\alpha$
ratio is particularly effective at separating star-forming from AGN-dominated galaxies (Kewley et al. Reference Kewley, Dopita, Sutherland, Heisler and Trevena2001), while [SII]/H $\alpha$
and [OI]/H
$\alpha$
and [OI]/H $\alpha$
are sensitive to the ionisation state of the gas, allowing for the differentiation between Seyferts and LINERs (Veilleux & Osterbrock Reference Veilleux and Osterbrock1987) (see Veilleux & Osterbrock Reference Veilleux and Osterbrock1987 for a detailed explanation of the chosen emission lines).
$\alpha$
are sensitive to the ionisation state of the gas, allowing for the differentiation between Seyferts and LINERs (Veilleux & Osterbrock Reference Veilleux and Osterbrock1987) (see Veilleux & Osterbrock Reference Veilleux and Osterbrock1987 for a detailed explanation of the chosen emission lines).
In this section, we present the method used in the research to distinguish between an AGN galaxy and a non-AGN galaxy. The classification of AGN galaxies can be made using these curves (Ke01 from Kewley et al. Reference Kewley, Dopita, Sutherland, Heisler and Trevena2001) on the BPT diagrams:
-
• $\text{0.72}/ [\log({[\text{SII}]/\text{H}\alpha})-0.32] + 1.30 \lt \log({[\text{OIII}]/\text{H}\beta}) $
-
•
$\text{0.61}/ [\log({[\text{NII}]/\text{H}\alpha})-0.47] + 1.19 \lt \log({[\text{OIII}]/\text{H}\beta}) $
-
•
$\text{0.73}/ [\log({[\text{OI}]/\text{H}\alpha})+0.59] + 1.33 \lt \log({[\text{OIII}]/\text{H}\beta}) $


These criteria are based on Kewley et al. (Reference Kewley, Dopita, Sutherland, Heisler and Trevena2001). We also use Equation (1) to correct the Balmer lines ( $\text{H}\alpha$
and
$\text{H}\alpha$
and $\text{H}\beta$
) for GAMA spectra, following (Yao et al. Reference Yao2020):
$\text{H}\beta$
) for GAMA spectra, following (Yao et al. Reference Yao2020):
 \begin{equation} F_{\text{corr}} = \left(\frac{\text{EW} + 2.5}{\text{EW}}\right) \times F_{\text{obs}},\end{equation}
where EW is the equivalent width, $F_{\text{obs}}$
is the observed flux, and 2.5 is the correction value required for GAMA spectra (Gunawardhana et al. Reference Gunawardhana2011). In Figure 3, we include the Seyfert-LINER line in black with equations
$F_{\text{obs}}$
is the observed flux, and 2.5 is the correction value required for GAMA spectra (Gunawardhana et al. Reference Gunawardhana2011). In Figure 3, we include the Seyfert-LINER line in black with equations
-
•
$\text{1.89}\log({[\text{SII}]/\text{H}\alpha}) + 0.76 = \log({[\text{OIII}]/\text{H}\beta}) $
-
•
$\text{1.18}\log({[\text{OI}]/\text{H}\alpha}) + 1.30 = \log({[\text{OIII}]/\text{H}\beta}) $


BPT diagrams for filament, tendril, and void spaces are presented in the first, second, and third rows, respectively. For each space, $\text{[SII]}/\text{H}\alpha$
,
$\text{[SII]}/\text{H}\alpha$
, $\text{[NII]}/\text{H}\alpha$
, and
$\text{[NII]}/\text{H}\alpha$
, and $\text{[OI]}/\text{H}\alpha$
are shown in the first, second, and third columns, respectively. The Ke01 line (Kewley et al. Reference Kewley, Dopita, Sutherland, Heisler and Trevena2001), displayed in red, marks the boundary between AGN and non-AGN galaxies. Any galaxy that lies above the Ke01 line is considered to be an AGN galaxy. The Seyfert-LINER line, shown in black, is also included to distinguish between Seyferts and LINERs.
$\text{[OI]}/\text{H}\alpha$
are shown in the first, second, and third columns, respectively. The Ke01 line (Kewley et al. Reference Kewley, Dopita, Sutherland, Heisler and Trevena2001), displayed in red, marks the boundary between AGN and non-AGN galaxies. Any galaxy that lies above the Ke01 line is considered to be an AGN galaxy. The Seyfert-LINER line, shown in black, is also included to distinguish between Seyferts and LINERs.

for $\text{[SII]}/ \text{H}\alpha$
and
$\text{[SII]}/ \text{H}\alpha$
and $\text{[OI]}/ \text{H}\alpha$
ratios (Kewley et al. Reference Kewley, Groves, Kauffmann and Heckman2006) – galaxies located above the Seyfert–LINER demarcation line are classified as Seyferts, while those below are classified as low-ionisation LINERs.
$\text{[OI]}/ \text{H}\alpha$
ratios (Kewley et al. Reference Kewley, Groves, Kauffmann and Heckman2006) – galaxies located above the Seyfert–LINER demarcation line are classified as Seyferts, while those below are classified as low-ionisation LINERs.
Historically, the LINER population has been associated with low-ionisation state AGN activity that is spectroscopically similar to that of Seyfert galaxies (Ferland & Netzer Reference Ferland and Netzer1983; Halpern & Steiner Reference Halpern and Steiner1983; Ho Reference Ho1999) and was assumed to host a low-state nuclear region. However, recent studies find that the LINER population is not always associated with AGN activity, but rather can be a result of emission from AGB stars or shocks, especially at lower redshift (Taniguchi et al. Reference Taniguchi, Yoshino, Ohyama and Nishiura1999; Singh et al. Reference Singh2013; Nemer et al. Reference Nemer, Katkov, Gelfand and Cho2025). In this case, including the LINER population in the AGN sample may overestimate the fraction of true AGN, while excluding LINERs may underestimate it. Therefore, in Section 4, we present our analysis both for galaxies that are more securely classified as AGN (Seyferts) and for a combined Seyfert+LINER sample.
Distribution of AGN classification across filament, tendril, and void regions.

The fraction of galaxies with an AGN according to the BPT diagram using either the [SIIR]/H $\alpha$
, [NIIR]/H
$\alpha$
, [NIIR]/H $\alpha$
, or the [OIR]/H
$\alpha$
, or the [OIR]/H $\alpha$
ratio, in void, tendril, or filament according to the classification by Alpaslan et al. (Reference Alpaslan2014). The left panel shows AGN fractions for the Seyfert-only sample, while the right panel includes both Seyferts and LINERs. Error bars represent 1
$\alpha$
ratio, in void, tendril, or filament according to the classification by Alpaslan et al. (Reference Alpaslan2014). The left panel shows AGN fractions for the Seyfert-only sample, while the right panel includes both Seyferts and LINERs. Error bars represent 1 $\sigma$
binomial uncertainties.
$\sigma$
binomial uncertainties.

In this paper, $\text{[SII]}/ \text{H}\alpha$
and
$\text{[SII]}/ \text{H}\alpha$
and $\text{[OI]}/ \text{H}\alpha$
are treated independently. For instance, if a galaxy meets the criterion for
$\text{[OI]}/ \text{H}\alpha$
are treated independently. For instance, if a galaxy meets the criterion for $\text{[SII]}/\text{H}\alpha$
but not for
$\text{[SII]}/\text{H}\alpha$
but not for $\text{[OI]}/\text{H}\alpha$
, it is classified as an AGN galaxy based on the
$\text{[OI]}/\text{H}\alpha$
, it is classified as an AGN galaxy based on the $\text{[SII]}/\text{H}\alpha$
ratio but not the
$\text{[SII]}/\text{H}\alpha$
ratio but not the $\text{[OI]}/\text{H}\alpha$
ratio. Since there is no theoretical Seyfert–LINER demarcation line for the
$\text{[OI]}/\text{H}\alpha$
ratio. Since there is no theoretical Seyfert–LINER demarcation line for the $\text{[NII]}/ \text{H}\alpha$
BPT diagram, we only consider galaxies that satisfy the
$\text{[NII]}/ \text{H}\alpha$
BPT diagram, we only consider galaxies that satisfy the $\text{[NII]}/ \text{H}\alpha$
(Kewley et al. Reference Kewley, Dopita, Sutherland, Heisler and Trevena2001) criterion and are classified as Seyferts in either the
$\text{[NII]}/ \text{H}\alpha$
(Kewley et al. Reference Kewley, Dopita, Sutherland, Heisler and Trevena2001) criterion and are classified as Seyferts in either the $\text{[SII]}/ \text{H}\alpha$
or
$\text{[SII]}/ \text{H}\alpha$
or $\text{[OI]}/ \text{H}\alpha$
BPT diagrams, and we use the labels [NII]–[SII] and [NII]–[OI] to refer to galaxies that satisfy both the [NII] and [SII] criteria, and the [NII] and [OI] criteria, respectively. For
$\text{[OI]}/ \text{H}\alpha$
BPT diagrams, and we use the labels [NII]–[SII] and [NII]–[OI] to refer to galaxies that satisfy both the [NII] and [SII] criteria, and the [NII] and [OI] criteria, respectively. For $\text{[NII]}/\text{H}\alpha$
, Kauffmann et al. (Reference Kauffmann2003) introduces a new classification scheme, Ka03, which lowers the Ke01 curve to account for low-metallicity AGN. These AGN, which would lie below the Ke01 demarcation, are extremely rare in the local Universe (Groves, Heckman, & Kauffmann Reference Groves, Heckman and Kauffmann2006). Since our sample consists of galaxies within the redshift of
$\text{[NII]}/\text{H}\alpha$
, Kauffmann et al. (Reference Kauffmann2003) introduces a new classification scheme, Ka03, which lowers the Ke01 curve to account for low-metallicity AGN. These AGN, which would lie below the Ke01 demarcation, are extremely rare in the local Universe (Groves, Heckman, & Kauffmann Reference Groves, Heckman and Kauffmann2006). Since our sample consists of galaxies within the redshift of $\text{0.12} \leq z \leq \text{0.231}$
, we exclude composite objects.
$\text{0.12} \leq z \leq \text{0.231}$
, we exclude composite objects.
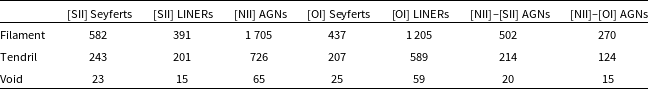
In Figure 3, we illustrate the BPT diagrams, with each row for each region of the LSS and each column for each of the three BPT diagrams. As indicated before, for $\text{[NII]}/ \text{H}\alpha$
diagrams, the AGN galaxies chosen for analysis are coloured either maroon or black. Table 1 reports the number of galaxies classified as Seyferts or LINERs based on
$\text{[NII]}/ \text{H}\alpha$
diagrams, the AGN galaxies chosen for analysis are coloured either maroon or black. Table 1 reports the number of galaxies classified as Seyferts or LINERs based on $\text{[SII]}/\text{H}\alpha$
or
$\text{[SII]}/\text{H}\alpha$
or $\text{[OI]}/\text{H}\alpha$
, as AGN based on
$\text{[OI]}/\text{H}\alpha$
, as AGN based on $\text{[NII]}/\text{H}\alpha$
, and those that satisfy the combined [NII]–[SII] and [NII]–[OI] criteria, across filament, tendril, and void environments.
$\text{[NII]}/\text{H}\alpha$
, and those that satisfy the combined [NII]–[SII] and [NII]–[OI] criteria, across filament, tendril, and void environments.
4. Results
In this section, we present quantitative results on how the fraction of AGN – true Seyfert and Seyfert $+$
LINER – varies with different environments for selected BPT diagrams. Alongside, we also discuss how the AGN fraction varies along the orthogonal distance from the nearest filament centreline. Although we include trends of Seyfert
$+$
LINER – varies with different environments for selected BPT diagrams. Alongside, we also discuss how the AGN fraction varies along the orthogonal distance from the nearest filament centreline. Although we include trends of Seyfert $+$
LINER population in the following subsections, we restrict our discussion solely to ‘true’ AGN, Seyfert galaxies, due to uncertainty in classifying LINERs as AGN or AGB star-driven.
$+$
LINER population in the following subsections, we restrict our discussion solely to ‘true’ AGN, Seyfert galaxies, due to uncertainty in classifying LINERs as AGN or AGB star-driven.
We emphasise that all AGN fractions reported in this section are computed relative to the population of emission-line galaxies, selected via the signal-to-noise requirements necessary for BPT classification. As a result, quiescent galaxies lacking detectable nebular emission are excluded from the denominator when computing $f_{\rm AGN}$
.
$f_{\rm AGN}$
.
This distinction is important because quiescent galaxies are known to preferentially inhabit denser environments, such as groups, clusters, and filaments, particularly at $z \sim 0.2$
(e.g. Yoon, Kim, & Ko Reference Yoon, Kim and Ko2023). In our analysis, the overall fraction of galaxies hosting an AGN among the full galaxy population could be lower in high-density environments, but our analysis probes the AGN fraction conditional on galaxies being active, i.e. systems with ongoing star formation and/or nuclear activity (including LINER-like excitation).
$z \sim 0.2$
(e.g. Yoon, Kim, & Ko Reference Yoon, Kim and Ko2023). In our analysis, the overall fraction of galaxies hosting an AGN among the full galaxy population could be lower in high-density environments, but our analysis probes the AGN fraction conditional on galaxies being active, i.e. systems with ongoing star formation and/or nuclear activity (including LINER-like excitation).
4.1. Environmental dependence of AGN fraction
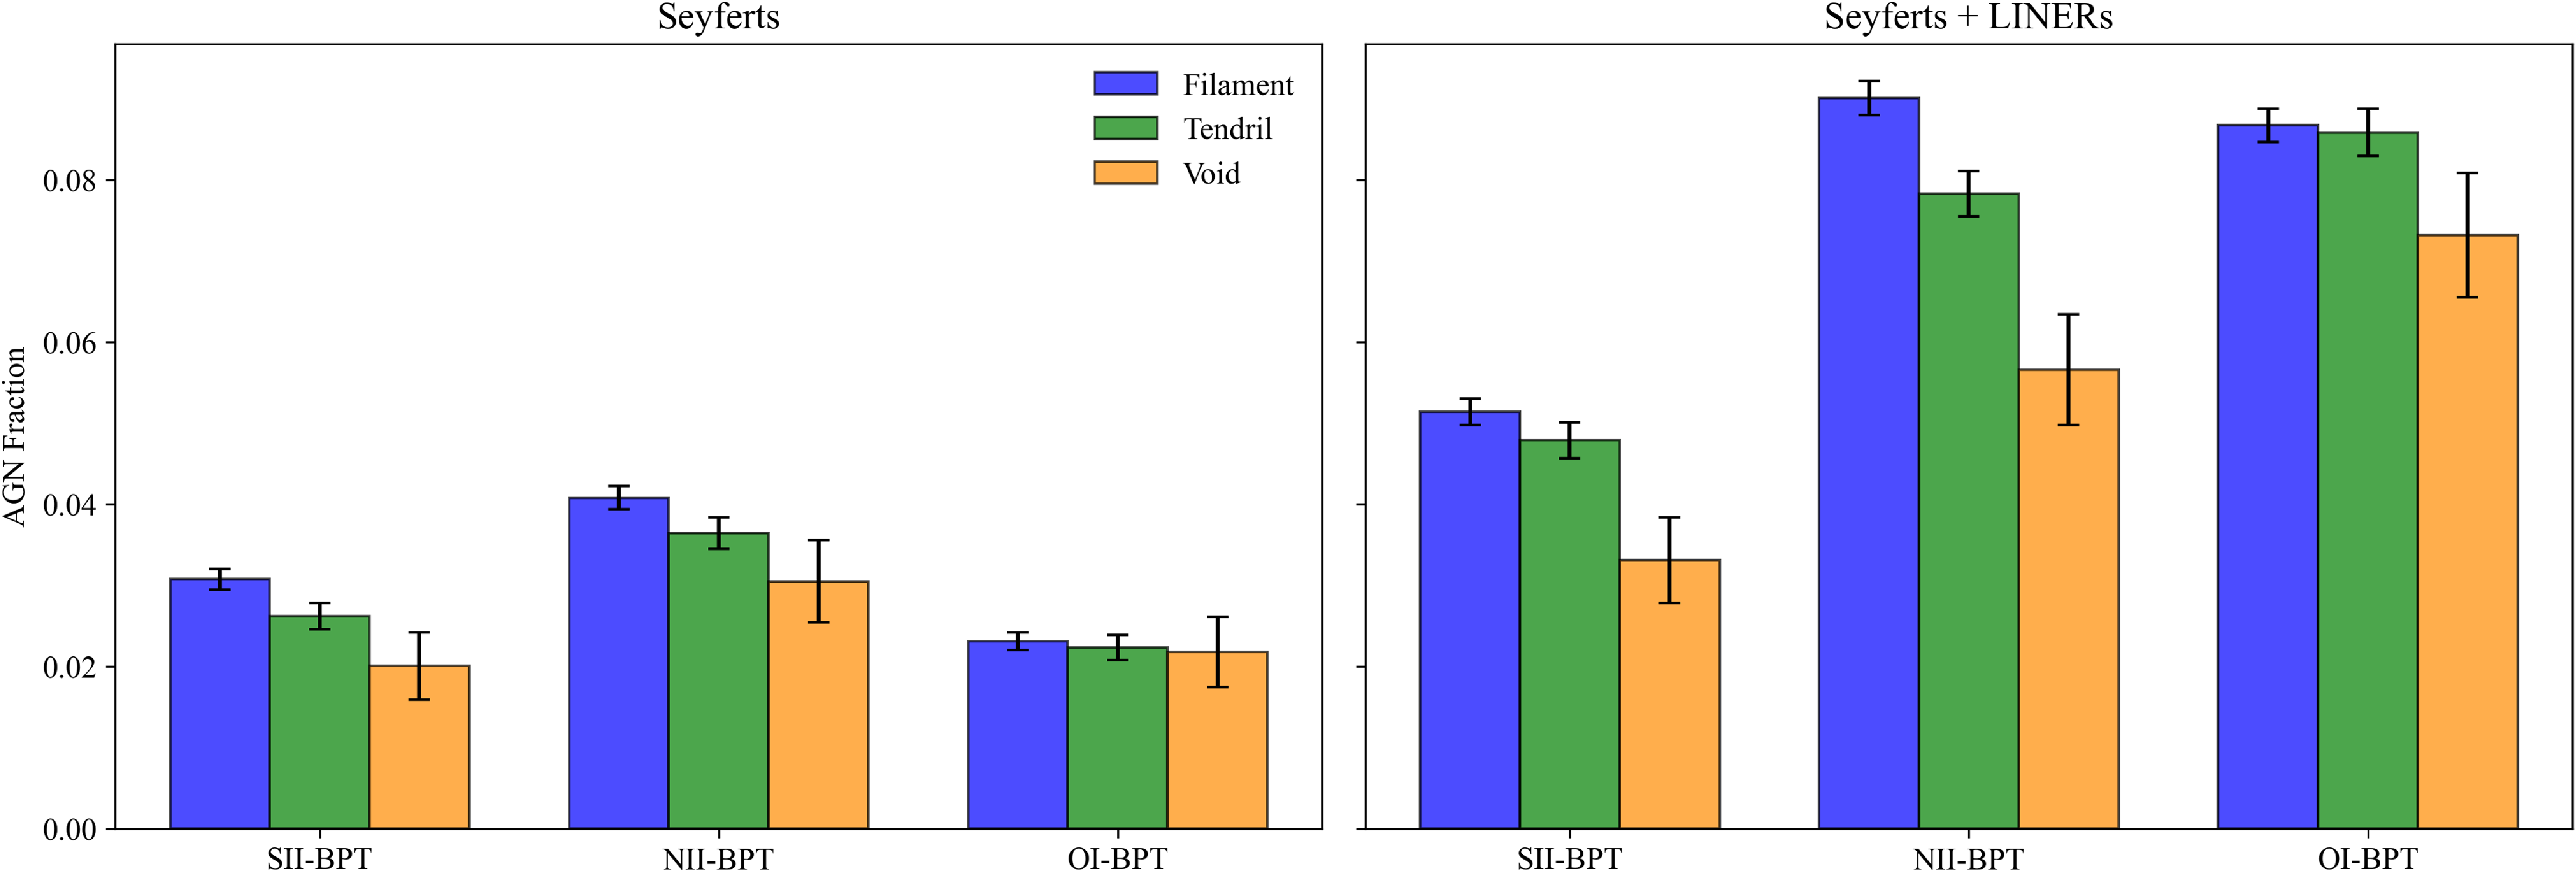
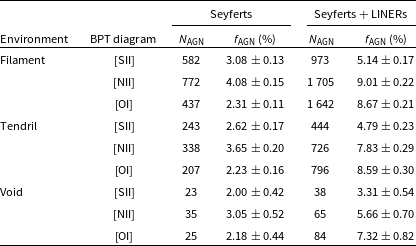
In Figure 4, a two-panelled bar plot illustrates how the Seyfert (shown in the left panel) and Seyfert $+$
LINER (shown in the right panel) population varies with different environments for selected BPT diagrams. The numerical AGN counts, fractions, and associated binomial uncertainties are tabulated in Table 2.
$+$
LINER (shown in the right panel) population varies with different environments for selected BPT diagrams. The numerical AGN counts, fractions, and associated binomial uncertainties are tabulated in Table 2.
The left panel of Figure 4, a clear trend is observed in all diagnostic diagrams of BPT: the AGN fraction is highest in the filament, intermediate in tendril, and lowest in the void. We find that the statistical significance of this difference depends on the diagnostic used. For the [SII] diagram, the excess AGN fraction in filaments relative to voids is $\Delta f \simeq 1.08\%$
, corresponding to a
$\Delta f \simeq 1.08\%$
, corresponding to a $\sim$ $2.5\sigma$
detection. For the [NII] diagram, the excess is
$2.5\sigma$
detection. For the [NII] diagram, the excess is $\Delta f \simeq 1.03\%$
at marginal significance (
$\Delta f \simeq 1.03\%$
at marginal significance ( $\sim$ $2\sigma$
), while the [OI] diagnostic shows no significant environmental difference.
$2\sigma$
), while the [OI] diagnostic shows no significant environmental difference.
Inclusion of the LINER population in our analysis (right panel of Figure 4, despite being low-state nuclear or AGB-driven galaxies, the fractions increase substantially across all environments and diagrams. In filaments, the combined AGN fractions rise to $5.14\%$
([SII]),
$5.14\%$
([SII]), $9.01\%$
([NII]), and
$9.01\%$
([NII]), and $8.67\%$
([OI]), with similarly elevated fractions in tendrils and voids – the relative environmental trend remains unchanged. The statistical significance between filament and void increases when LINERs are included. For the [NII] diagnostic, the filament–void excess grows to
$8.67\%$
([OI]), with similarly elevated fractions in tendrils and voids – the relative environmental trend remains unchanged. The statistical significance between filament and void increases when LINERs are included. For the [NII] diagnostic, the filament–void excess grows to $\Delta f \simeq 3.3\%$
, corresponding to a
$\Delta f \simeq 3.3\%$
, corresponding to a $\gt$
$\gt$ $4\sigma$
detection, while the [OI] diagram shows a filament–void difference of
$4\sigma$
detection, while the [OI] diagram shows a filament–void difference of $\Delta f \simeq 1.4\%$
, significant at the
$\Delta f \simeq 1.4\%$
, significant at the $\sim$ $1.5\sigma$
level.
$1.5\sigma$
level.
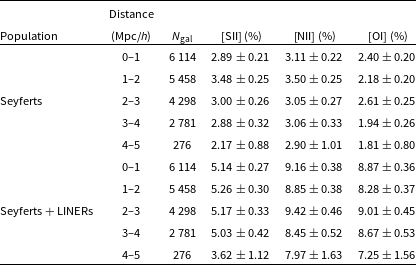
4.2. Radial distribution of AGN fraction in filaments
The GLSSC provides the orthogonal distance of each filament galaxy from the nearest filament centreline. Using this information, Figure 5 and Table 3 present the AGN fraction as a function of distance from the filament for both the Seyfert-only and Seyfert+LINER samples. Uncertainties are estimated using binomial counting statistics.
AGN counts and fractions in filament, tendril, and void environments for different BPT diagnostics. Fractions are computed relative to the total number of emission-line galaxies in each environment ( $N_{\rm fil}=18{\,}927$
,
$N_{\rm fil}=18{\,}927$
, $N_{\rm tend}=9{\,}273$
,
$N_{\rm tend}=9{\,}273$
, $N_{\rm void}=1{\,}148$
). Uncertainties are binomial errors.
$N_{\rm void}=1{\,}148$
). Uncertainties are binomial errors.

Fraction of filament galaxies hosting an AGN as a function of orthogonal distance from the filament centreline, as defined by Alpaslan et al. (Reference Alpaslan2014), using the [SII]/H $\alpha$
, [NII]/H
$\alpha$
, [NII]/H $\alpha$
, and [OI]/H
$\alpha$
, and [OI]/H $\alpha$
BPT diagnostics. The left panel shows AGN fractions for the Seyfert-only sample, while the right panel includes both Seyferts and LINERs. Error bars indicate 1
$\alpha$
BPT diagnostics. The left panel shows AGN fractions for the Seyfert-only sample, while the right panel includes both Seyferts and LINERs. Error bars indicate 1 $\sigma$
binomial uncertainties.
$\sigma$
binomial uncertainties.

For only Seyferts, the AGN fraction shows no monotonic dependence on distance from the filament across all three BPT diagnostics. Although the fractions are marginally higher within the inner $\lesssim 2\,{\rm Mpc}\,h^{-1}$
bins, the variations between adjacent bins are modest and remain within the uncertainties. A similar qualitative trend is observed when the LINER population is included: the overall AGN fractions are higher at all distances for all BPT diagnostics, but the relative variation with distance remains weak.
$\lesssim 2\,{\rm Mpc}\,h^{-1}$
bins, the variations between adjacent bins are modest and remain within the uncertainties. A similar qualitative trend is observed when the LINER population is included: the overall AGN fractions are higher at all distances for all BPT diagnostics, but the relative variation with distance remains weak.
At larger distances, specifically $d \gtrsim 3\,{\rm Mpc}\,h^{-1}$
, a mild decline in the AGN fraction is suggested, notably in [SII]-selected Seyferts. Due to low-count statistics in the outer bins, the corresponding uncertainties are large, and the error bars for neighbouring bins overlap. Overall, the distance-dependent analysis indicates that any enhancement of AGN activity toward filament spines is, at best, mild.
$d \gtrsim 3\,{\rm Mpc}\,h^{-1}$
, a mild decline in the AGN fraction is suggested, notably in [SII]-selected Seyferts. Due to low-count statistics in the outer bins, the corresponding uncertainties are large, and the error bars for neighbouring bins overlap. Overall, the distance-dependent analysis indicates that any enhancement of AGN activity toward filament spines is, at best, mild.
5. Discussion
There are many ways to fuel AGN activity, but we often do not know what the dominant mechanism is for funnelling gas toward an AGN; e.g. merger and interactions (Hong et al. Reference Hong, Im, Kim and Ho2015; Dietrich et al. Reference Dietrich2018; McKernan et al. Reference McKernan, Ford and Reynolds2010; Gao et al. Reference Gao2020; Marian et al. Reference Marian2019; Marian et al. Reference Marian2020), bar torque, or collision or precipitation from hot halo gas (Oh et al. Reference Oh, Oh and Yi2012; Combes Reference Combes2001). The debate, as it is with many galaxy evolutionary effects, is whether nature or nurture is the most important and at which epoch. The environmental dependence on AGN appear to be complex and wavelength-dependent: for example, in the past ( $z \ge 1 $
), the fraction of X-ray AGN was elevated in denser environments such as groups and clusters than in the field (e.g. Pentericci et al. Reference Pentericci2013; Martini, Dicken, & Storchi-Bergmann Reference Martini, Dicken and Storchi-Bergmann2013a), where in relaxed clusters at
$z \ge 1 $
), the fraction of X-ray AGN was elevated in denser environments such as groups and clusters than in the field (e.g. Pentericci et al. Reference Pentericci2013; Martini, Dicken, & Storchi-Bergmann Reference Martini, Dicken and Storchi-Bergmann2013a), where in relaxed clusters at $z \sim 1$
, X-ray AGN found to avoid the central part of the cluster. However, radio AGN tend to prefer massive central galaxies (Magliocchetti et al. Reference Magliocchetti, Popesso, Brusa and Salvato2018; Shen et al. Reference Shen2020). Furthermore, in the local Universe (
$z \sim 1$
, X-ray AGN found to avoid the central part of the cluster. However, radio AGN tend to prefer massive central galaxies (Magliocchetti et al. Reference Magliocchetti, Popesso, Brusa and Salvato2018; Shen et al. Reference Shen2020). Furthermore, in the local Universe ( $z \leq 0.3$
), optical quasar host galaxies favour relatively low-density environments (Wethers et al. Reference Wethers2022a) and do not have a significantly different number of companion galaxies (Stone et al. Reference Stone2023).
$z \leq 0.3$
), optical quasar host galaxies favour relatively low-density environments (Wethers et al. Reference Wethers2022a) and do not have a significantly different number of companion galaxies (Stone et al. Reference Stone2023).
In this study, particularly in Figure 4, we showed that there is a mild correlation between the position of galaxies in the large structure of the Universe and the presence of AGN, especially when [SII] and [NII] line diagnostics are used, since [SII] and [NII] diagnostics are sensitive to broader range of ionising state and may be more responsive to moderate AGN activity. However, we find no significant correlation when using the [OI] diagnostic. This is because [OI] selected AGN trace emission regions that require hard ionising photons but not necessarily strong ionisation overall. This is often associated with LINER-like activity powered by low-accretion or old stellar population (Belfiore & MaNGA Team Reference Belfiore2016), and this explains no significant environmental dependence with [OI]-selected AGN. We interpret the results in Figure 4 as weak environmental dependence on AGN activities. Further, the AGN fraction as a function of distance from the nearest filament also shows weak dependence (Figure 5) towards the filament centreline, where appreciable gas flow could be possible for AGN activity. Suppose local environments are solely responsible for driving the gas towards the centre. In that case, we expect to see a higher difference between filament and void galaxies than what our results suggest. We suspect that there could be underlying intrinsic galactic properties, such as mass and secular processes, that funnel the gas, especially in filament galaxies. Man et al. (Reference Man2019) concludes a similar trend in which they show marginal overdense environmental preference for AGN, and AGN are predominantly driven by secular processes.
Although the results indicate only a weak environmental dependence for narrowline Seyferts, this could not be the entire picture. The classification and detection of AGN galaxies can be influenced by factors, such as the viewing angle, observational wavelength, and intrinsic properties of galaxies. To better understand the influence of LSS, further multiwavelength investigations with stricter samples are required. Multiwavelength studies are essential to capture the full picture of AGN activity in different environments and disentangle the contribution of other processes that are responsible for driving the gas towards the centre.
6. Summary
This paper analyses 18 927 filament galaxies, 9 273 tendril galaxies, and 1 148 void galaxies obtained from the GAMA survey. AGN galaxies were distinguished using the BPT diagram technique outlined by Baldwin et al. (Reference Baldwin, Phillips and Terlevich1981). The boundary line used is the Ke01 line (shown in red in Figure 3), with equations provided by Kewley et al. (Reference Kewley, Dopita, Sutherland, Heisler and Trevena2001). From this study, our findings are as follows:
-
• Among emission-line galaxies, the optically identified AGN fraction shows a weak environmental dependence, with higher fractions in filaments than in tendrils and voids for some BPT diagnostics. These trends depend on the chosen diagnostic and are conditional on galaxies being spectroscopically active.
-
• Within filaments, the AGN fraction exhibits no statistically significant monotonic dependence on distance from the filament centreline. Any apparent enhancement toward smaller distances is marginal and not robust, given the uncertainties.
AGN counts and fractions as a function of orthogonal distance from the nearest filament centreline. Fractions are computed relative to the total number of galaxies in each distance bin. Uncertainties are binomial errors.

Future work on the role of large-scale structure will examine the role of galaxy morphology in the ‘last mile’ transportation of gas to the AGN. For example, galaxies further out from the centreline of the filament with an AGN show a higher bar fraction. Alternatively, one could examine the AGN fraction in the field population of galaxies at higher redshifts to verify if this dependence on filament proximity persists at higher redshifts.
Acknowledgements
We acknowledge the support of the Summer Research Opportunity Program (SROP), the Jones Scholars Program, and the Undergraduate Research Grant (URG) by the University of Louisville’s Office of the Executive Vice President for Research and Innovation (EVPRI).
This research made use of AstroPy, a community-developed core Python package for astronomy (Astropy Collaboration et al. Reference Collaboration2013; Reference Collaboration2018), DR4 of the Galaxy and Mass Assembly Survey (Driver et al. Reference Driver2022b). The authors thank the members of GAMA for their contributions to all the catalogues used in this paper. The authors would also like to thank the anonymous referee for constructive comments and suggestions, which helped improve the quality of this work.
Data availability statement
The data for this project are available from the GAMA DR4 website (http://www.gama-survey.org/dr4/).


 Open access