Our country's national crime is lynching. It is not the creature of an hour, the sudden outburst of uncontrolled fury, or the unspeakable brutality of an insane mob.
Ida B. Wells, Lynch Law in America (1900)
Introduction
A growing literature has documented both the link between ethnic diversity and conflict (Abadie and Gardeazabal Reference Abadie and Gardeazabal2003; Balcells et al. Reference Balcells, Daniels and Escriba-Folch2016; Collier and Hoeffler Reference Collier and Hoeffler2004; Collier and Rohner Reference Collier and Rohner2008; Fearon and Laitin Reference Fearon and Laitin2003; Scacco and Warren Reference Scacco and Warren2016) and the subsequent effects of that conflict on growth. Ethnic fractionalization is often tied to the ethnic conflict that hinders economic development. While violent conflict is a prominent theme in the literature on ethnic fractionalization in developing countries, economics research on the United States has focused more on the relationships between racial/ethnic diversity, the provision of public goods, and the growth of American cities. The relationship between diversity, trust, and economic performance within the United States is mixed. Alesina et al. (Reference Alesina, Baqir and Easterly1999) show that public goods provision is inversely associated with ethnic fractionalization in US cities. Alesina and La Ferrara (Reference Alesina and Ferrara2005) demonstrate that increases in ethnic diversity are associated with lower growth rates, consistent with the Costa and Kahn (Reference Costa and Kahn2003) finding that increasing community heterogeneity is associated with declining levels of social capital in the United States. Recent research also shows that proximity to racial minorities caused higher voter turnout and more conservative voting by whites in US cities (Enos Reference Enos2016). Other studies, however, point to economic benefits of diversity in urban areas (Ottaviano and Peri Reference Ottaviano and Peri2006).
While the economics literature has focused on relationships between racial diversity and public goods provision in the United States, there are large sociology and criminology literatures on the links between segregation and violence in urban areas. Increases in residential segregation tend to increase levels of violent crimes including homicides in both white and nonwhite neighborhoods, although the impacts are greater for black and Hispanic neighborhoods (Krivo et al. Reference Krivo, Peterson and Kuhl2009). The crimes are typically acts of intraracial violence. This literature points to geographical isolation and the concentration of disadvantage as drivers of this relationship between segregation and violence (Litwack, Reference Litwack1998; Peterson and Krivo Reference Peterson and Krivo1993, Reference Peterson and Krivo1999; Shihadeh and Flynn Reference Shihadeh and Flynn1996). In this respect, these studies build on the large literature tracing the historical development of segregation and the concentration of poverty in American cities (Massey and Denton Reference Massey and Denton1993; Wilson Reference Wilson2011).
The history of the role of segregation in ethnic and racial violence in the American past has not been extended to rural areas. Diversity and ethnic tensions in the United States could influence American society not just through the modern political and economic processes in cities highlighted by Alesina et al. (Reference Alesina, Baqir and Easterly1999) and Alesina and La Ferrara (Reference Alesina and Ferrara2005) or the intraracial violence studied by Krivo et al. (Reference Krivo, Peterson and Kuhl2009) and others. But it could also have impacts through the lingering effects of interracial violence more directly related to the literature on ethnic fractionalization and ethnic conflict. Historically, this violence was particularly concentrated in America's rural communities, areas that continue to show complicated links between antiminority attitudes, political attitudes, and intergroup conflict.Footnote 1 A growing literature is uncovering links between past violence specifically in the South and modern outcomes, with historical lynchings correlated with modern homicide rates, lack of compliance with hate laws, and urban segregation patterns (DeFina and Hannon Reference DeFina and Hannon2011; King et al. Reference King, Messner and Baller2009; Messner et al. Reference Messner, Baller and Zevenbergen2005). The shadow cast by historical racial violence could be large and understanding it requires answering the open question of how historical violence was related to historical fractionalization in both urban and rural communities. Our purpose in this article is to investigate the historical link between ethnic diversity and violent conflict within the United States, examining whether residential segregation prevented or contributed to the likelihood of lynchings in South, where interracial conflict was at its most extreme, and where conflict was spread over rural and urban areas. We analyze whether familiarity bred tolerance or contempt between white and black individuals.
The existing social, political, economic, and demographic theories of lynching explicitly hinge on interactions between whites and African Americans over particular spheres of social life. One important missing factor, which would arguably be related to all the spheres, is residential racial segregation. The degree to which whites and African Americans perceived themselves to be in competition with one another over status, economic opportunities, or political power would be related to how, or if, they interacted with one another. A key issue in analyzing the American past is that racial violence was not solely concentrated in densely populated urban areas but was widespread. As such, analysis of the relationship between fractionalization and conflict requires a comprehensive measure of fractionalization. Although intuitively important, it has been difficult to empirically analyze the relationship between residential segregation and lynching. The standard approach in the literature is to use the proportion black in a county. Yet, proportion black tells us little about residential location and segregation, which could occur with large or small African American populations. More generally, the literature on ethnic fractionalization, conflict, and economic development has typically employed fragmentation indices that are a function of the population shares of each ethnic group. They measure the probability that two randomly chosen individuals in an area are of different races but cannot speak to the likelihood that two individuals of different groups will interact with one another, something that crucially depends on the extent to which individuals segregate themselves within a community.
Further complicating the study of residential segregation and lynching is the fact that the number of lynchings in the United States reached their peak in 1892 (Cook Reference Cook2012), far before the rise of urban segregation or significant flows of blacks to urban areas. Analyzing lynching in rural areas requires a measure of segregation that can be consistently applied in rural and urban communities to estimate the relationship without spatial bias. Traditional segregation measures, based on the distribution of population groups across wards or other geographic subunits, are difficult to estimate or interpret for rural counties. The racial proportions used to study residential patterns in rural counties do not necessarily capture levels of social cohesion. Estimating the relationship between residential patterns and lynching necessitates a measure of segregation for rural counties that goes beyond the use of racial proportions.
In this article, we exploit a newly developed measure of segregation to estimate the correlation between racial residential segregation and lynching in the United States. The new segregation measure comes from Logan and Parman (Reference Logan and Parman2017), who use the availability of the complete (100 percent) manuscript pages for the federal census to identify the races of next-door neighbors. They measure segregation by comparing the number of household heads in an area living next to neighbors of a different race to the expected number under complete segregation and under no segregation (random assignment). This measure of segregation is inherently tied to racial dispersion. The measure allows for the distinction between the effects of differences in racial composition and the tendency to segregate given a particular racial composition. A particular advantage is that it can be aggregated to any boundary without losing the underlying properties because it is defined at the household level. Furthermore, the measure is equally applicable to both urban and rural areas. This consistent measure of segregation for rural and urban areas allows us to extend the analysis of lynching to include its relationship with racial segregation. To our knowledge, this is the first study to comprehensively measure the relationship between segregation and lynching in the South.
We begin by reviewing the existing theoretical and empirical work on Southern lynching and incorporate segregation more fully into the most prominent hypotheses regarding lynching. There, we show that the predicted effects of lynching depend critically on whether the motivation for lynching was social, economic, or political. We show that the theories have clear predictions for the relationship between segregation and racial violence. This is in part because all theories of lynching hinge on the determinants and effects of interracial contact. As such, segregation plays a key role in all existing lynching theories, but the theories predict different effects. Ultimately, however, the size, significance, and direction of the correlation between segregation and lynching is an empirical question.
Our task in this article is to estimate the correlation between segregation and Southern lynching and to determine whether the inclusion of segregation alters the relationship between Southern lynching and other measures that have been established in the previous literature. We match the new measure of segregation to the most comprehensive Southern lynching data available and find that segregation was strongly correlated with lynching. Counties that were more segregated were much more likely to experience a lynching. Conditional on having a lynching, more segregated counties were more likely to experience multiple lynchings. Even when controlling for state and regional effects of lynching, the results show the same correlation between segregation and lynching. We show that the result is quite robust to alternative specifications and various sample restrictions. As an additional check, we show that segregation was strongly correlated with black lynchings but uncorrelated with white lynchings. Because most mob violence at this time involved white perpetrators, the lack of a correlation between segregation and white lynchings acts as a placebo check and suggests that residential segregation was strongly correlated with interracial violence but had little effect on intraracial violence. We take this as suggestive evidence that segregation's influence worked through racial isolation as opposed to segregation being a predictor of a generally violent community.
Following our establishment of the relationship between racial segregation and interracial violence, we move to include segregation into the existing empirical literature on lynching. We replicate the most well-known studies of lynching and show that the inclusion of segregation alters some aspects of previous results. At the same time, we establish that racial segregation's impact is not diminished by including additional economic and demographic factors. Further, we show that segregation's correlation remains even when we include executions (legal killings) in the analysis. Next, we provide a variety of robustness checks to establish that the correlation is not simply a proxy for racial animus, antebellum development, or post-Reconstruction factors. In short, the robust correlation that we document is an important contribution to our understanding of how segregation was related to racial conflict in rural and urban areas in the American past.
Our article makes two important contributions to the literature. First, we address a significant gap in the literature by showing that segregation is a related factor in interracial violence in rural communities, which is where three-quarters of the population lived in the South in 1880. The most recent literature on lynching emphasizes regionwide phenomena, and here we see that local variation in racial segregation plays a role in lynching. For example, Wood (Reference Wood2009) and Dray (Reference Dray2003) emphasize regional factors and not within-region variation. That rural social organization, as measured by residential segregation, was related to conflict is a new finding that expands the scope of research on ethnic and racial fractionalization and social conflict to rural areas. Even today, racial and ethnic dynamics in rural areas play a large role in contemporary national politics, public-goods provision, and public policy.
Second, lynching, and violence more generally, has been used as an explanatory variable in a wide literature on the economic development of the South and on economic growth more broadly (Acemoglu and Robinson Reference Acemoglu and Robinson2008; Alston and Ferrie Reference Alston and Ferrie1999; Cook Reference Cook2013; Sundstrom Reference Sundstrom2007). Our analysis shows that residential segregation is a poor predictor of intraracial violence but a good predictor of interracial violence. The continuing influence of those residential patterns could play a large role in violence that occurs in urban and rural areas today. We conclude with a discussion of what the findings imply for the role of social isolation on lynching in particular and racial violence more generally.
Theories of Southern Lynching
Racial segregation has long been viewed as a factor in explaining racial violence. Lynching is commonly viewed as concurrent with the rise of Jim Crow, the erosion of African American political and economic gains from Reconstruction, and a period of intense racial hostility. Bailey et al. (Reference Bailey, Tolnay, Beck and Laird2011) argue that lynching victims were socially isolated and Tolnay and Beck (Reference Tolnay and Beck1992a) argue that racial violence was related to black migration patterns in the early twentieth century. Recent historical scholarship by Loewen (Reference Loewen2013), Jaspin (Reference Jaspin2008), Hagen et al. (Reference Hagen, Makovi and Bearman2013), Beck et al. (Reference Beck, Tolnay and Bailey2016), and Kantrowitz (Reference Kantrowitz2012) argues that lynching was only one small piece of a larger movement of racial violence in the United States during the late nineteenth century. This movement included the ethnic cleansing of entire counties and the prohibition of African American residents in certain towns (known as “sundown towns” as blacks found to be present after dark would be subject to violence). The full quantitative history of these events is still unknown.
The academic study of lynchings extends back to the efforts of Ida B. Wells, the Chicago Tribune, the NAACP, Tuskegee Institute, and others in the late nineteenth and twentieth centuries to document the extent of lynchings and the conditions surrounding them at the turn of the century (National Association for the Advancement of Colored People 1919; Williams Reference Williams1968). Based on these initial data sources describing the characteristics of lynching victims and lynch mobs, theories of lynching as the product of economic conflict emerged. Generally, lynching was viewed as either an aggressive response to economic frustration (Hovland and Sears Reference Hovland and Sears1940) or a deliberate attempt to improve the economic position of whites relative to blacks (Raper Reference Raper1933). The seminal work of Blalock (Reference Blalock1967) on minority-group relations emphasized an alternative framework for understanding conflict between groups as a response to threats to the majority group's power and resources posed by the minority group. Corzine et al. (Reference Corzine, Creech and Corzine1983) provided some of the first tests of Blalock's proposed power-threat hypothesis in the context of lynchings using the lynching data compiled by the NAACP. They found mixed support for the hypothesized positive and concave relationship between minority concentration and lynching, which was first documented by Raper (Reference Raper1933).
With a dramatically improved data set of Southern lynching victims correcting the errors and omissions of the historical data sources, Beck and Tolnay explored additional economic theories of lynching (Tolnay and Beck Reference Tolnay and Beck1990, Reference Tolnay and Beck1992a).Footnote 2 Consistent with earlier empirical studies, Tolnay and Beck's improved data confirmed the positive correlation between the size of the black population and the incidence of lynchings. However, they were also able to demonstrate that lynchings were more prevalent when cotton prices were falling and inflationary pressure was increasing, adding support to an economic theory of lynchings. These findings raised the possibility that lynchings could have been an attempt to reduce competition from black workers for white jobs, either by directly eliminating black workers through migration or through intimidating others thinking about competing for jobs held by white workers. More recently, Hagen et al. (Reference Hagen, Makovi and Bearman2013) and Beck et al. (Reference Beck, Tolnay and Bailey2016) have argued that mob formation, as opposed to successful lynchings, shows that political factors were dominant considerations.
As these various theories of lynchings have evolved, the role of segregation has been noticeably absent from both theoretical discussions and empirical analyses. Both theory and empirical tests have focused on the relative size of the black population in a community, not the extent to which black and white communities were segregated. The reason for this is not that segregation is assumed to be unrelated to interracial conflict, as we show in the following text. Instead, it is the product of a lack of adequate data on residential segregation patterns. There are compelling reasons to believe that, conditional on a given racial composition for a community, the degree of segregation within that community matters a great deal in explaining the nature, likelihood, and potential extent of interracial violence. Extending the concept of fractionalization and segregation to rural communities is required to investigate this issue empirically.
A comprehensive listing of each specific lynching theory would be beyond this work, but it is important to outline the broader conceptual frameworks that motivate our empirical analysis. We begin with a general framework drawing on the general theories of social conflict to describe lynching. We then explore the outlines of existing economic, social, and political theories of Southern lynching to identify the role that racial segregation would have in lynching.
Lynching and Social Conflict
The most general framework for analyzing lynching views it as the product of social conflict. One complication of general theories of ethnic conflict is that they are typically modeled as control over resources, as in Caselli and Coleman (Reference Caselli and Coleman2013). The historical problem for lynching is that lynching was most active after the disenfranchisement of African Americans. Theories focused on conflict as a means of gaining control of resources from another group make little sense when the group being targeted has little economic, social, or political power from the outset. Thus, the economic, social, and political theories specific to lynching have developed to instead focus on mechanisms and channels that would lead to interracial violence given the lack of a need to compete over resources. Segregation plays a role in this social conflict by spatially restricting the potential for groups to interact with each other. Such spatial restrictions could reflect underlying group animosities. More segregated environments would see an increase in interracial violence, and more segregated environments are related to poorer race relations. If segregated environments reflect restrictions on African American mobility and social norms regarding race relations, movements outside of those norms could be met with particularly harsh consequences. However, racial segregation could be related to fewer incidents of racial violence if the geographic separation minimizes the potential for groups to interact in any fashion. Close interaction between racial groups could also be related to racial violence if sustained interracial interaction increases social conflict such that racial violence is likely to result. Familiarity could breed contempt and further inflame racial hostility and racial violence.
Irrespective of its motivation, racial violence could be related to racial segregation through the simple fact that the indirect effects of lynchings were commonly seen as the key force behind the activity. Indeed, under the NAACP definition of lynching, the lynching activity had to have the purpose of upholding tradition or serving justice. This applied, in many cases, not only to the victims of lynching but also to the surrounding community. In a racially segregated environment, lynching may have particularly large externalities for the perpetrators. That is, the public activity of lynching would be more likely to have its desired group effects if the targeted group was more segregated (and therefore in close contact with one another relative to another group). For example, in many lynchings, the bodies of victims were publicly displayed for several days after the lynching and the body parts of victims would be sold and distributed to the mob. Such a public display may have a more chilling effect (larger externalities) in areas where the spatial borders of the black community were less porous. Indeed, such extreme acts could be more effective in such areas, while more integrated environments may decrease the salience and impact of the racial motivations for such attacks. Segregation could also play a role in allowing for greater social acceptability of violence against minority groups. The externality for the white-only audiences that often gathered to witness lynchings with picnics and postcards was the reification of heightened control and reassertion of power. Satyanath et al. (Reference Satyanath, Voigtlaender and Voth2013) show that social capital was related to the rise of Nazis in Germany. If segregation allows for greater social capital among the groups promoting violence against others, the two would be positively related. Ultimately, however, the relationship between segregation and racial violence hinges on the relationship between social isolation and racial aggression.
Economic Theories of Lynching
The theory of labor control, proposed by Tolnay and Beck (Reference Tolnay and Beck1992a), is related to the idea of the use of lynching as a form of social control over black workers. The theory is based on the idea that lynchings are tied to the demand for labor. Lynchings were used as a form of control over the African American labor force. The related economic competition model notes that when Southern whites became more economically disadvantaged as the Southern economy stagnated in the late nineteenth and early twentieth centuries, whites and blacks began to compete for the same jobs, and lynchings occurred as a result (Raper Reference Raper1933). Two hypotheses exist as to why this occurred, the first being the frustration-aggression model (Hovland and Sears Reference Hovland and Sears1940) and the second being lynching used to improve the economic position of whites (Raper Reference Raper1933). In the frustration-aggression model, lynching is used as an aggressive response to economic frustration; it was a vent for labor market competition with blacks. To improve the economic status of whites, it displaces black workers with white workers or keeps them in segments where they do not face competition (Tolnay and Beck Reference Tolnay and Beck1992a; Tolnay et al. Reference Tolnay, Beck and Massey1992).
In these economic theories, segregation is not explicitly stated to play a role in lynching. As a measure of competition, percent black is normally used along with other economic factors that would be related to competition (the share of the labor force in agriculture, for example). As the proportions of African Americans grow, the more competition the whites would have with them. As the size of the African American population increases, the desire to control the African American population increases as it is a more numerous factor in the labor market. As early as Raper (Reference Raper1933), the relationship between the share of the community that was black and lynching was noted, and the general relationship has been confirmed in previous empirical work. At very small and large proportions of the African American population lynching is not as likely, but as the population share grows lynching likelihood increases.Footnote 3
The incorporation of segregation into these types of economic theories of lynching leads to a passive role for residential segregation per se. The role of labor control and competition are not changed by the presence or absence of residential racial segregation. While economic competition is related to occupational segregation, it is unrelated to residential segregation. The economic incentive is driven by the supply and demand for black labor relative to white labor.Footnote 4 While it could be the case that whites would be more likely to view African Americans as a threat in more segregated environments, the essentials of competition and labor control are not directly influenced by segregation unless one would argue that integration would lessen the likelihood of whites viewing African Americans as competing for the same jobs or seeing African Americans as a labor force needing to be controlled.Footnote 5 Because economic competition is relatively silent on the effects of residential segregation, we would predict a passive role for racial residential segregation in economic theories.
Social Theories of Lynching
Social theories of lynching hinge on class relations. In the status competition model of lynching, lynchings are a product of competition between the class status of whites and African Americans. When the white population perceived its class status was threatened, it responded with violence/disenfranchisement of African Americans (Price et al. Reference Price, Darity and Headen2008; Tolnay and Beck Reference Tolnay and Beck1995). Even when white solidarity was threatened not by the black population but by white religious diversity, communities responded through collective violence against black residents (Bailey and Snedker Reference Bailey and Snedker2011). More recently, Smångs (Reference Smångs2016, Reference Smångs2017) has pushed these models further, constructing a framework for understanding lynchings as a means of maintaining symbolic and social racial group boundaries. A key for these models is the fact that lynchings are reactive—they are responses to the perception of a deterioration of white status and used to reinforce a racial hierarchy. Along the same lines, Price et al. (Reference Price, Darity and Headen2008) argue that lynching victims were more likely to be former slaves, and therefore lynching was related to the social stigma of slavery.
Segregation plays a critical role in the status competition model. Segregation is a signal of a racial hierarchy and separation of racial groups. As such, segregated environments by themselves can be used as a signal of white status. The social separation of the groups would act as a complementary factor to alleviate the problems caused by status competition. Unlike the economic theories, the social theories emphasize residential segregation as home and spatial sorting is a key dimension of social distinction (living in one place carries unique social significance as opposed to another). If the social superiority of whites was reinforced using residential segregation, the status competition model predicts that there would be fewer lynchings. By reinforcing racial inequality, segregation would serve as a substitute for interracial violence. Because segregation is a form of social isolation that would serve to reinforce racial inequality, the incorporation of segregation into the theory of status competition leads to the hypothesis that segregation would have a negative correlation with lynching. Highly segregated environments would be less likely to use racial violence to reinforce racial status as segregation already plays that role.
Political Theories of Lynching
Political theories see lynching reflecting fears of greater political participation by blacks. In the power-threat hypothesis, when two groups coexist with unequal access to political/power resources, the dominant group will engage in a wide variety of methods, including lynching, to secure their privileged access to those resources. The larger the political threat of African Americans, the more lynchings that would occur. In the political/power-threat hypothesis, after widespread segregation and disenfranchisement of black voters, lynchings would greatly decline as the dominant group no longer felt threatened by the African American vote (Corzine et al. Reference Corzine, Creech and Corzine1983; Soule Reference Soule1992). Hagen et al. (Reference Hagen, Makovi and Bearman2013) shows that lynching intent, which they proxy with lynch mobs, was more related to local political events as opposed to economic factors. Beck et al. (Reference Beck, Tolnay and Bailey2016) argue that the state intervened to prevent lynchings in places where manufacturing took hold, such that political will to stop lynching was stronger in areas with greater political-economic connections.
A key for the political theory of lynching is that African Americans be viewed as a threat to whites. This competition for resources presumes that African American access to resources would inherently come at the detriment of whites. The role of segregation in the political theory, therefore, is nuanced as it depends on the effect of segregation on perceptions. While segregated environments may be the result of black disenfranchisement, the premise of whites viewing African Americans as a threat presupposes that there is little interaction between the groups that would counteract such perceptions. In integrated environments, the sustained interactions between racial groups could act to obviate the need for racial violence if whites did not view African Americans as a threat because of their social interactions. This could be occupational integration or residential integration but would require regular interactions. Existing work shows that segregation is positively related to ethnic conflict in Ireland but whether this holds historically or in the United States is unknown (Balcells et al. Reference Balcells, Daniels and Escriba-Folch2016). But the opposite could also be true. Sustained interracial interaction could “breed fear” of black political gains if such interactions revealed that African American political power would come at the expense of white political power. Enos (Reference Enos2016), for example, shows that voting by whites was more likely if they were in proximity to blacks, and Scacco and Warren (Reference Scacco and Warren2016) find that social contact does not change perceptions about outside ethnic groups.
As such, the predicted correlation of residential segregation in political theories is indeterminate. The effect of segregation could lead to more racial violence or less. The direction of the effect depends on how whites view the potential outcomes of black political advancement. Most narrative histories suggest that whites held great apprehension of black political advances irrespective of their interaction with blacks. At the same time, whether segregation mediated or enhanced any of those sentiments is unknown, particularly because rural segregation has not received sustained attention in the literature.
While the existing literature on lynchings has emphasized the size of the black population, the theories that have arisen from that literature suggest a role for residential segregation. While previous researchers have not had access to measures of segregation applicable to the rural communities in which lynchings took place, the new availability of complete count census data and new techniques for measuring segregation now make it possible to investigate this relationship between segregation and lynchings. Our purpose is to use the most recent advances in the measurement of segregation to test theories of the relationship between segregation and lynching. Estimates of the impact of residential segregation on the incidence of lynchings will not only shed light on the social and economic forces leading to interracial violence, but they will also allow us to separately identify the effects of the size of the minority population and the extent to which that population is residentially segregated from the majority group, two very distinct concepts that previous empirical studies could not disentangle.
The Logan-Parman Measure of Segregation
The Logan-Parman measure is an intuitive approach to residential segregation. Logan and Parman assert that the location of households in adjacent units can be used to measure the degree of integration or segregation in a community, similar to Schelling's (Reference Schelling1971) classic model of household alignment. Areas that are well integrated will have a greater likelihood of opposite race neighbors that corresponds to the underlying racial proportion of households in the area. The opposite is also true—segregated areas will have a lower likelihood of opposite race neighbors than the racial proportions would predict. The measure relies on the individual-level data available in federal census records. With the 100 percent sample of the federal census available through the Minnesota Population Center's Integrated Public Use Microdata Series (IPUMS), it is possible to identify the races of next-door neighbors. Census enumerators went door to door to record households, meaning that next-door neighbors are adjacent to one another on the census manuscript page. The number of black households with white neighbors in a county can therefore be calculated by looking at the order and races of all household heads on the census manuscript pages.
The measure is based on comparing this number of black households in a community with white neighbors to the number expected under complete integration and under complete segregation. Formally, the measure is calculated as
 $$\begin{equation*}
{\rm{\eta }} = \frac{{{\rm{E}}\left( {\overline {{x_{b,w}}} } \right) - {{\rm{x}}_{{\rm{b}},{\rm{w}}}}}}{{{\rm{E}}\left( {\overline {{x_{b,w}}} } \right) - {\rm{E}}( {\underline {{x_{b,w}}} } )}}
\end{equation*}$$
$$\begin{equation*}
{\rm{\eta }} = \frac{{{\rm{E}}\left( {\overline {{x_{b,w}}} } \right) - {{\rm{x}}_{{\rm{b}},{\rm{w}}}}}}{{{\rm{E}}\left( {\overline {{x_{b,w}}} } \right) - {\rm{E}}( {\underline {{x_{b,w}}} } )}}
\end{equation*}$$
where xb, w is the number of black households with a white next-door neighbor,  ${\rm{E}}( {\overline {{{\rm{x}}_{{\rm{b}},{\rm{w}}}}} } )$ is the expected number of black households with white neighbors under complete integration (household location is independent of race), and ${\rm{E}}( {\underline {{x_{b,w}}} } ){\rm{\ }}$is the expected number of black households with white neighbors under complete segregation (only the black households on either end of the black neighborhood have white neighbors).Footnote 6 This index equals zero for a fully integrated community, increases as black households become more segregated, and equals one in the case of a completely segregated community.
This measure of segregation has two distinct advantages for a study of lynchings. First, lynchings were often a rural phenomenon. Traditional segregation measures such as the index of dissimilarity and index of isolation are difficult to apply to rural areas. These measures rely on comparing racial composition of individual wards in a city to the racial composition of the whole city. Rural communities often lack a comparable geographical subunit, making it difficult to calculate or interpret these traditional measures. The next-door neighbor measure of segregation does not require geographic subunits and can therefore be easily applied and interpreted in rural settings.Footnote 7
The second key advantage is that this next-door neighbor measure is a better proxy for interracial interactions than traditional measures based on racial proportions. Social interaction models of segregation are inherently spatial and assume that proximity is related to social interactions (Echenique and Fryer Reference Echenique and Fryer2007; Reardon et al. Reference Reardon, Matthews, O'Sullivan, Lee, Firebaugh, Farrell and Bischoff2008). Two communities with the same overall black and white populations will have very different levels of interracial interactions depending on how integrated those populations are. This variation is obscured by traditional segregation measures and by the fragmentation index common to studies of ethnic conflict but picked up by the next-door neighbor measure. While the measure is based on residential location and does not directly measure interracial interactions that occur through other work or social settings, it is reasonable to assume that, all other things equal, areas in which more black households live in very close proximity to white households will have higher levels of interracial interaction. A segregation measure that captures this proximity is particularly important to test the social and political theories of lynching that hinge on white perceptions of the black community, perceptions that will be heavily influenced by personal contact with members of that community.
Methods and Approach
Data
Southern Lynching Data
Our data on lynchings come from the Historical American Lynching (HAL) Project and cover the period from 1882 to 1930—this data is identical to the lynching data of Tolnay and Beck. This data set is the most extensively verified, publicly available set of lynchings in the literature (Cook Reference Cook2012). Equally important, the existing empirical knowledge of lynching is closely tied to analysis of the HAL data. The lynchings in the database conform to the NAACP definition of lynchings that requires a murder to meet the following criteria to be counted as a lynching: (1) there must be evidence that someone was killed, (2) the killings must have occurred illegally, (3) three or more persons must have taken part in the killing, and (4) the killers must have claimed to be serving justice or tradition.
The HAL database contains detailed information on 2,805 lynchings including name, race, and gender of the victim; the race of the mob; the stated reason for the lynching; the date of the lynching; and the county in which the lynching took place. Given our interest in the correlation between segregation and lynching, we are primarily interested in lynchings in which the victim and mob have different races. These constitute the majority of the recorded lynchings: 88 percent of victims were black while only 6 percent of the mobs were black. Furthermore, of the 155 black lynch mobs, only 4 targeted white victims. Therefore, a large proportion of the lynching victims were black individuals who were the victims of interracial violence. The white lynching victims were almost entirely victims of intraracial violence. These white lynching victims will help us test whether any observed correlations between residential segregation and lynching work solely through the channel of interracial violence or whether they are instead the product of more general tendencies for a community to resort to mob justice.Footnote 8
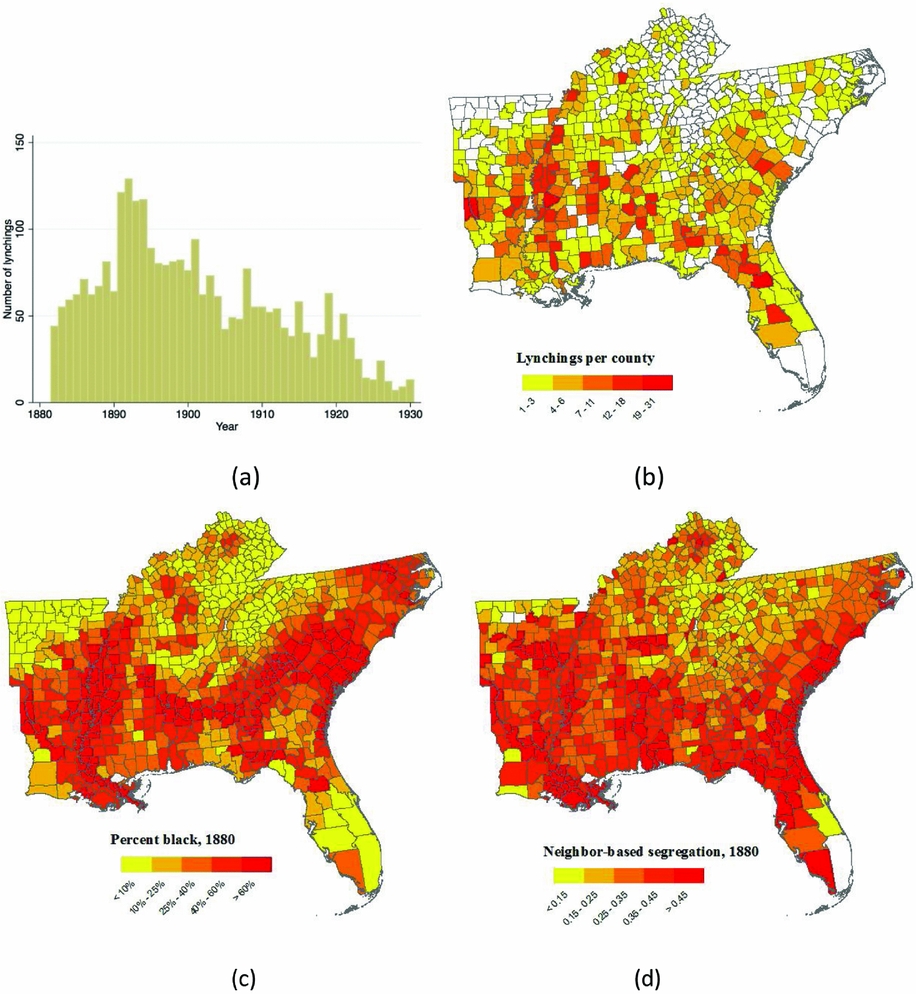
The distribution of lynchings over time is given in figure 1. Consistent with the existing literature on lynchings, the HAL data reveal that lynchings reached their peak in the 1890s, with more than 100 lynchings per year in the middle of that decade. Despite peaking in the 1890s, there remain a sizable number of lynchings each year through 1930, the end of the period covered by the data. The geographical distribution of lynchings across the southern states is also given in figure 1. Two features of this map are worth noting. First, there is substantial variation in the number lynchings across counties within each state. This suggests that we can exploit meaningful variation in lynchings across counties even with the inclusion of state fixed effects. Second, lynchings are not concentrated in urban areas. Instead, they appear to be a rather rural phenomenon.Footnote 9 This underscores the importance of using a measure of segregation that can be meaningfully applied to rural areas to estimate the relationship.Footnote 10
Segregation, lynching, and racial population shares: (a) number of lynchings by year, 1882–1930; (b) lynchings per county, 1882–1930; (c) percent black by county in 1880; and (d) segregation by county in 1880.
Segregation Data
We calculate the Logan-Parman measure of segregation for every county in the United States using the IPUMS 100 percent sample of the 1880 federal census. Consequently, we are measuring segregation prior to the start of the lynchings data and therefore looking at how segregated counties were leading up to the lynchings, not how those levels of segregation changed in response to lynchings. We also calculate the percentage of household heads who are black in each county. The geographical distributions of these two measures of the location of black households are given in figure 1. What is immediately obvious from figure 1 is that residential segregation and the overall racial composition of counties are correlated but not perfectly so. Figure 2 plots the segregation index against percent black for individual counties. While there is a weak, positive correlation between the two, there is substantial heterogeneity in levels of segregation at any given level of percent black. This neighbor-based segregation index provides information on significant variation in residential sorting that is not picked up by percent black; it reveals an important dimension of the residential patterns of communities that prior studies of lynchings could not exploit.
Neighbor-based segregation and percent black by county, 1880.
Table 1 provides state-level summary statistics for lynchings by race, segregation, and racial composition for the South, quantifying several of the patterns visible on the maps. Lynching and segregation vary substantially across states. Georgia and Mississippi have the highest levels of lynching activity. While they also exhibit relatively high levels of segregation, it is Florida and Louisiana that stand out as the most segregated. There is also substantial variation within states, with the standard deviations in percent black and the segregation index within states consistently larger than the standard deviation across states. As with the variation in lynching, the within-state variation in segregation and racial composition makes us hopeful that we can estimate a relationship between segregation and lynching even after controlling for state fixed effects.
Lynchings and segregation in the South
Note: All lynching data are taken from the Project HAL database. Percent black and segregation numbers are from the authors’ calculations based on the 100 percent sample of the 1880 federal census.
Empirical Strategy
We take the county-level estimates of segregation in 1880 and merge them with the lynching data from the HAL project for the number of lynchings by county from 1882 to 1930.Footnote 11 A key strength for this approach is that the measure of segregation comes from 1880, while the lynching data come from 1882 onward. This overcomes concerns about possible reverse causality in the lynching-segregation relationship. Additionally, Logan and Parman (Reference Logan and Parman2017) show that segregation in 1880 is highly correlated with segregation in 1940—communities that were more segregated remained so. Therefore, the potential for lynching (post-1880) to influence future segregation variation is limited because the persistence was quite general. Similarly, measurement at the county level allows us to include controls that could presumably explain the result if the correlation were spurious. Our main specifications explicitly control for the proportion black in the area. We therefore can estimate the correlation between segregation and lynching while controlling for the overall racial composition of the area, state fixed effects, and a host of other factors.
We adopt this approach because the existing empirical literature on lynching has used similar reduced-form approaches. Following that literature, our basic specification is
 $$\begin{equation*}
{{\rm{\lambda }}_{{\rm{i}},{\rm{s}}}} = {\rm{\alpha }} + {{\rm{\beta }}_1}{{\rm{\eta }}_{{\rm{i}},{\rm{s}}}} + {{\rm{\beta }}_2}{\rm{\eta }}_{{\rm{i}},{\rm{s}}}^2 + {{\rm{\beta }}_3}{\rm{PctBlac}}{{\rm{k}}_{{\rm{i}},{\rm{s}}}} + {{\rm{\beta }}_4}{\rm{PctBlack}}_{{\rm{i}},{\rm{s}}}^2 + {\rm{\Gamma }}{{\rm{X}}_{{\rm{i}},{\rm{s}}}} + {{\rm{\theta }}_{\rm{s}}} + {\epsilon _{{\rm{i}},{\rm{s}}}}
\end{equation*}$$
$$\begin{equation*}
{{\rm{\lambda }}_{{\rm{i}},{\rm{s}}}} = {\rm{\alpha }} + {{\rm{\beta }}_1}{{\rm{\eta }}_{{\rm{i}},{\rm{s}}}} + {{\rm{\beta }}_2}{\rm{\eta }}_{{\rm{i}},{\rm{s}}}^2 + {{\rm{\beta }}_3}{\rm{PctBlac}}{{\rm{k}}_{{\rm{i}},{\rm{s}}}} + {{\rm{\beta }}_4}{\rm{PctBlack}}_{{\rm{i}},{\rm{s}}}^2 + {\rm{\Gamma }}{{\rm{X}}_{{\rm{i}},{\rm{s}}}} + {{\rm{\theta }}_{\rm{s}}} + {\epsilon _{{\rm{i}},{\rm{s}}}}
\end{equation*}$$
where λ is the number of lynchings in a county i in state s or the presence of lynching in that county over the entire 1882 to 1930 period, η is the Logan-Parman measure of segregation, and PctBlack is the proportion black in the county. Since at least Raper (Reference Raper1933), the relationship between the percent black of a county and lynching has been known to be nonlinear. For this reason, we include quadratic terms for both percent black and the segregation measure to explore the possibility of nonlinearities in the relationship. To control for common factors that could drive the relationship, a state fixed effect θs is included. Xi, s is a vector including county characteristics that, depending upon the specification, includes measures of migration, agricultural characteristics, and counts of black elected officials. To be clear, the preceding equation estimates the relationship between segregation and lynching exploiting within-state variation in the segregation measure at the county level.Footnote 12
Segregation and Southern Lynching
Table 2 presents the main results, where we regress the number of lynchings per county between 1882 and 1930 on the segregation measure and the percent of households that were black in 1880. Because state fixed effects are included, the estimates exploit the within-state variation in segregation and lynching only. As noted earlier, a key advantage here is that lynchings in the HAL data come from years after the 1880 census used to measure segregation.
The correlation of segregation with number of lynchings per county
Standard errors in brackets.
*p < 0.1. **p < 0.05. ***p < 0.01.
To assess the sensitivity of the relationship to functional form assumptions, we estimate the relationship in four different ways. Following the existing literature, we first estimate the relationship between lynching and segregation using count models. In both the negative binomial and Poisson specifications, we see that increasing segregation was strongly related to the number of lynchings in a county.Footnote 13 In the third set of regressions, we control for the fact that many localities had no lynchings recorded during this period. Still using state fixed effects, we estimate a probit regression where the dependent variable is an indicator for whether a given county experienced a lynching (because some states had no lynchings the inclusion of state fixed effects reduces the sample size). As with the count models, increases in segregation were strongly correlated with whether a lynching occurred in a county. The final set of regressions estimate the relationship using a Tobit model, which is designed to account for the fact that many counties do not experience a lynching and could be modeled as being censored. The results confirm that increases in the segregation measure were strongly related to lynchings per county.
In general, a one standard deviation increase in the segregation measure is correlated with an additional lynching in a county, on average.Footnote 14 This is a large effect given that the mean number of lynchings in a county ranges from 0.13 in Kentucky to 0.58 in South Carolina. The results of table 2 suggest that segregation was strongly related to lynching at both the extensive and intensive margins in the late nineteenth and early twentieth centuries. Furthermore, in all four models the inclusion of segregation reduces the magnitude of the percent black coefficients suggesting that the lack of segregation data for earlier studies led to overestimates of the correlation between racial proportions and lynchings. The difference in the percent black coefficients with and without segregation controls are statistically significant at the 1 percent level in all models. More important, the results show that, conditional on racial composition, segregated environments were more likely to experience lynchings.Footnote 15 In light of the theories discussed earlier, the positive correlation between segregation and lynching is not in keeping with the predictions of two classes of theories. Economic theories predicted a passive role and social theories predicted a negative correlation, both of which are rejected here. The results of table 2 are most consistent with the political theories of lynching in which whites see blacks as a threat to political power. In general, this is consistent with the recent work of Hagen et al. (Reference Hagen, Makovi and Bearman2013), who argue that political events were the primary motivation for lynching.
Black and White Lynching
Because the majority of lynchings were initiated by white mobs, the race of the victim can be used to distinguish whether the lynching was interracial or intraracial. The theories of lynching outlined earlier each involve interracial conflict. As a useful check of the role of segregation in explaining lynching we separate the sample by the race of the lynching victim. Intuitively, if segregation plays a role in lynching it would work through interracial conflict. Segregation would have explanatory power for black lynchings but would not explain white lynching. In other words, racial segregation is thought to have explanatory power in interracial violence, not in intraracial violence. However, segregation could be a proxy for poor social capital and could be related to general levels of violence in an area. If that were the case, segregation would be related to all forms of violence.
In table 3 and table 4 we estimate the correlation between segregation and lynching by race of the victim. The results are striking with respect to segregation. Segregation is highly correlated with black lynching but is uncorrelated with white lynching.Footnote 16 A comparison of the coefficients in table 2 and table 3 shows that the effect of segregation on lynching is slightly stronger when the victim is African American than overall and disappears when looking only at white victims. In figure 3 we graph the predicted number of lynchings from the negative binomial specification against the segregation measure and show the striking difference in predicted number of lynchings by race and overall. As the figure shows, the shape and magnitude of the relationship for all lynchings is driven by black lynching victims. The results suggest that the effect of residential segregation does not work through a channel that is related to all mob violence, but rather a channel that operates through interracial violence. We take these results as suggestive evidence that the measure of segregation is related to interracial violence and that segregation does not appear to be correlated with all violence.
The correlation of segregation with number of black lynchings per county
Standard errors in brackets.
*p < 0.1. **p < 0.05. ***p < 0.01.
The correlation of segregation with number of white lynchings per county
Standard errors in brackets.
*p < 0.1. **p < 0.05. ***p < 0.01.
Neighbor-based segregation and predicted number of lynchings (negative binomial specification).

Incorporating Segregation into Existing Empirical Studies of Lynching
The preceding results show that segregation is well correlated with interracial violence. These reduced form relationships do not consider additional contextual, economic, and demographic factors that have been shown to be related to lynching. Indeed, the observed relationship between segregation and lynching could be attenuated by migration and other factors that would change over time. In this section, we reconsider the most well-known empirical studies of lynching and include the Logan-Parman measure of segregation as a means of (1) exploring the extent to which the inclusion of racial segregation alters previous results, particularly the role of black population share, and (2) assessing whether the reduced form relationship between segregation and lynching found in the previous section still holds when controlling for other explanatory variables used in the previous literature.
The results presented earlier showed the correlation of segregation with the total number of lynchings. While the reduced-form relationship is suggestive that segregation is highly correlated with lynching, the preceding specifications do not incorporate important demographic and economic factors that have been shown to be correlated with lynching. As such, the results presented earlier could be due to the exclusion of these omitted factors. Scholars have noted that lynchings varied over time and that the number of lynchings during a given period could have been related to time-varying factors such as the rise and decline of tenant farming or changes in human capital. Relative lynching activity, however, was time invariant (areas with the most lynching activity continued to be most active even as the number of lynchings declined). Nevertheless, we investigate the degree to which the effect of segregation on lynching is robust to temporal changes in lynching.Footnote 17
To incorporate these economic factors we follow the seminal work of Tolnay and Beck (Reference Tolnay and Beck1992b), where the authors estimate the effects of black migration and differences in black and white illiteracy and tenancy on lynchings per decade. We focus on these factors as lynching may have been related to changes in population and economic conditions that would alter the impact of segregation on lynching. Here, we concentrate on the relationship between black migration, literacy, tenancy, density, and lynching. The focus of the previous literature suggests that lynching was used by whites to control economic or social competition. When net out-migration occurs and blacks leave (or remain in) the area, the likelihood that there is a black lynching will therefore be diminished as previous lynchings have had their desired effect of either restricting black movement or encouraging it, depending on the direction of the effect. The racial difference in farm tenancy and illiteracy attempt to reflect a higher status of whites; a large difference would be predicted to have fewer lynchings, in line with the status competition and economic competition theories described previously.Footnote 18 The absolute percent of black farm tenancy is included on the basis that racial violence might have been more common in areas where blacks were landless, as they may have been more susceptible to racial violence. Both tenant farming measures also serve as proxies for the extent of manufacturing and racial differences in access to manufacturing employment. For example, if manufacturing employment was occupationally segregated, more blacks would be tenant farmers and there would be a larger racial difference in tenant farming as more whites would be employed in manufacturing.Footnote 19
Percent black is predominately used in the majority of the lynching literature as an indirect measure of competition, the idea being the larger the proportion of the black population the higher the perceived threat of the minority group. Population density has commonly been used as a predictor of lynching as lynchings generally occurred in less populated areas. Finally, the absolute black population is included because the larger the black population the higher the likelihood of a black lynching.Footnote 20
We compare specifications where black lynchings by decade (1900–10, 1910–20, and 1920–30) is the dependent variable and covariates include those noted in table 5. As noted earlier, the peak year of lynchings occurred before 1900, yet we find in that variation in segregation was correlated with lynchings after 1900. Areas that were more segregated experienced more lynchings from 1900 to 1910 and 1910 to 1920. The inclusion of segregation intensifies the tenancy effect and lessens the effects of racial differences in illiteracy and tenancy. This suggests that the overall effect of tenancy is downward biased when measures of segregation are excluded from the specification, and that effects of black-white differences in illiteracy and tenancy are upward biased when segregation is excluded from the specification. Indeed, the effect of black farm tenancy share increases by more than 25 percent in all specifications.Footnote 21 For illiteracy differences by race, the effect is reduced by nearly 10 percent across all specifications and ceases to be statistically significant in the 1910–20 specification once segregation is included.
Segregation, black lynching, and contextual factors by decade, 1900–30
Standard errors in brackets.
Note: All specifications estimated with Poisson regression. Dependent variable in each regression: Number of Black Lynchings by decade. Net Migration of Blacks defined as net change in black population over decade. Percent Black Farm Tenancy among Black Farmers, Population Density, Difference between Black–White Illiteracy, Difference between Black–White Tenancy, and Black Population Size defined at end of decade.
*p < 0.1. **p < 0.05. ***p < 0.01.
The results in table 5 imply that segregation not only explains some of the effects attributed to black population shares but to important economic factors as well. Counties with a larger size of the black labor force in tenant farming were at a slightly greater risk of experiencing a lynching in the county once segregation is included. At the same time, inclusion of segregation lessens the effect of human capital differences by race. Even controlling for population density does not alter the effect of segregation on lynching. Given the results of table 5, it appears that the channels through which segregation impacted the number of lynchings were likely nuanced. At a minimum, the results support the contention that segregation is a missing component in the empirical analysis of lynching over time and shows that the inclusion of important economic and demographic factors does not alter the underlying relationship between racial segregation and lynching established in the previous section.
Robustness Checks
Ideally, we would like to exploit a source of exogenous variation in Southern segregation to obtain a causal estimate of the effect of segregation on lynching in an instrumental variable (IV) framework. The IV technique would allow us to estimate the local average treatment effect of residential segregation on lynching. Unfortunately, nearly any conceivable factor that would be related to racial segregation in the South would not satisfy the exclusion restriction required for an IV.Footnote 22 Even without a causal estimate, however, we must still establish that the correlation we have documented is robust. Because finding an instrument that would satisfy the exclusion restriction for Southern areas is highly unlikely, we take the approach of determining whether the most likely factors that would be related to segregation would alter the relationship between segregation and lynching.
Considering these most likely factors directly, we further extend the empirical literature on segregation and racial violence while establishing that the estimated correlation is not driven by a common predetermined factor or other confounder. Because potential confounders would be determined along with or lead to segregation, we focus on antebellum (historical) and political factors that could, presumably, drive the relationship we estimate between segregation and lynching. As such, the correlation we estimate is unlikely to be driven by an omitted variable strongly related to these factors.Footnote 23
Executions
One key issue in the existing lynching literature is the degree to which lynchings were a function of the lack of rule of law because lynchings are, by definition, extrajudicial. If executions reflect more or less crime in a specific area, lynchings could simply be another form of violence in high-crime communities. The previous literature has found that black lynchings were not a substitute for black executions, suggesting that lynchings were not a replacement for rule of law and therefore likely served an alternative purpose. In table 6 we estimate the reduced form relationship between all black executions by decade from 1910 to 1930 using state fixed effects and several determinants used in the previous literature, predominately Tolnay and Beck (Reference Tolnay and Beck1992b) and Tolnay et al. (Reference Tolnay, Beck and Massey1992).Footnote 24 We find that in various specifications segregation is positively related to black executions. Segregation, however, does not change the empirical findings of earlier studies that found lynchings and executions were not statistically related to each other. While more segregated environments did experience more black executions, the inclusion of segregation does not alter the lack of a correlation between black executions and black lynchings.
Segregation, black executions, black lynching, and contextual factors by decade, 1910–30

Standard errors in brackets.
*p < 0.1. **p < 0.05. ***p < 0.01.
Racial Animus
The effect of segregation on lynching could be due to predetermined factors that are related to segregation, but for which segregation is simply a proxy.Footnote 25 One prominent factor would be racial animus. Long-standing racial views could be a factor explaining both segregation and lynching behavior. It is straightforward to see how omitted racial animus would drive both residential segregation and lynching. Recent work in political science and economics has shown that historical factors are related to many measures of racial and ethnic animus and inequality today (Acharya et al. Reference Acharya, Blackwell and Sen2016; Ager Reference Ager2013; Voigtländer and Voth Reference Voigtländer and Voth2012). Failure to control for these antebellum factors would imply that the correlation is driven by omitted racial animus, which could be reflected in slaveholding in 1860.
We address this issue by including several factors that could be related to antebellum development, segregation, and lynching in the same specification. Our goal is twofold. First, to see whether the antebellum factors are correlated with lynching and, second, to see if their inclusion alters the relationship between segregation and lynching. We extend beyond Acharya et al. (Reference Acharya, Blackwell and Sen2016; Ager Reference Ager2013) and the use of percent slave in 1860 and basic inequality measures because, as informed the economic history of slavery, the factors corresponding to larger proportions of slave and wealth are related to other economic and institutional factors (Fogel and Engerman Reference Fogel and Engerman1974; Wade Reference Wade1967). We therefore consider several proxies for antebellum development—the percent of the black population that was free in 1860, the average cash value of farms in a county in 1860, the output of each of the three antebellum cash crops (cotton, sugar, and tobacco) in local agricultural output in 1860, and the fraction of all slaveholders in a county with more than 50 slaves. The first factor relates to the likelihood of greater acceptability of black autonomy in locations with larger shares of free blacks. The second factor is related to antebellum wealth. The third factor is related to agricultural development—slaveholding in the lower South for cotton used a different system of labor organization than other cash crops that would be related to the extent of slavery and drive differences in wealth to the extent that cotton prices were high at the end of the antebellum era. Also, to include the entire South we cover the three most prominent crops because tobacco- and sugar-growing locations also experienced significant numbers of lynchings. The last proxy is a measure of the fraction of farms in the county that were large plantations, but rather than looking over all households, only estimates it as a fraction of the slaveholding class. Because higher percentages slave would be related to large plantations and greater slaveowner wealth, the preceding framework decomposes the effects of slaveholding and inequality into the factors identified in the economic history literature as most salient (Fogel and Engerman Reference Fogel and Engerman1974).Footnote 26
In table 7, we show the results. Some of the antebellum factors do, indeed, have a strong correlation with lynching. For example, sugar and tobacco production in 1860 are strongly correlated with lynching, but cotton production (which is more likely in counties where the slave population would be particularly high) is not. The cash value of farms is also positively correlated with lynching, underscoring the partially economic roots of interracial violence. The percent of the black population that was free is not well correlated with lynching. Most important, however, the inclusion of these antebellum factors does not alter the correlation between segregation and lynching. It is still the case that more segregation counties experienced more lynchings, even after controlling for a host of antebellum factors that would be proxies for racial animus.
Segregation, lynching, and antebellum factors
Standard errors in brackets.
*p < 0.1. **p < 0.05. ***p < 0.01.
Political Backlash
The political involvement of African Americans would play a role in either causing or preventing lynchings. If African Americans had significant political power, it may be difficult to participate in extralegal executions as blacks would, presumably, have more access to legal redress. By contrast, if lynchings were retaliatory, areas that saw black political gains during Reconstruction could have been places where racial intimidation was more likely to occur. If either of these political channels was related to segregation, it is possible that the correlation between segregation and lynching would be biased upward by this omitted political factor.Footnote 27
Beck et al. (Reference Beck, Tolnay and Bailey2016) and Hagen et al. (Reference Hagen, Makovi and Bearman2013) have used contemporaneous measures of voting to control for political factors related to lynching. One issue with such measures is that they could obscure the de facto disenfranchisement of African Americans. To assess this particular channel, we measure black political participation in a novel way—the number of African American officeholders during Reconstruction at the county level. This measure captures black political involvement but is not contaminated with the effects of black disenfranchisement, which occurred during the same period as racial violence. For example, using contemporaneous voting outcomes would not ensure that one was capturing black political involvement if previous political success was related to later racial violence and disenfranchisement. This measure also allows us to assess the robustness of the effect of political participation as the officials can be disaggregated by type of office (federal, state, or local) and branch of government (executive, legislative, or judicial). This count of African American office holders is one of the few quantitative measures of black political involvement and success during Reconstruction.Footnote 28
In table 8 we present the results. Although in each instance the point estimate for the number of officials of each type is negative, the effect is not statistically significant. More important, the inclusion of the number of black officials does not alter the relationship between segregation and lynching. While table 8 shows the results for all officials, state office holders, local office holders, and judicial officials, no other type of official (e.g., executive or legislative) was correlated with black lynching or altered the relationship between segregation and lynching. Similarly, while table 8 shows the results for black lynchings, the same pattern is seen for lynchings over all and for white lynchings. Thus, the results are not predicted by a hypothesis that lynchings were greater in places where blacks were more likely to hold office during Reconstruction, and they are also inconsistent with the hypothesis that black political power during Reconstruction left a lasting effect on racial violence. Most important, the results are inconsistent with the argument that the segregation measure captures an omitted political factor that explains the segregation measure's correlation with lynching.
Segregation, black lynching, and black elected officials

Standard errors in brackets.
*p < 0.1. **p < 0.05. ***p < 0.01.
Discussion
In this article we have used a new measure of segregation from the complete 1880 census, which used the simple criteria of the race of a next-door neighbor to estimate the correlation between residential segregation and Southern lynching. This interracial violence has had lingering effects on levels of trust and the development of the American South. Incorporating segregation into the analysis of lynching offers an opportunity to understand how interracial contact influences conflict. The Logan-Parman measure of segregation, based on the races of next-door neighbors, offers a much stronger proxy for interracial interactions than the racial proportions to which prior studies were restricted. We showed that the correlation between this neighbor-based segregation index and Southern lynching was quite strong and robust, with greater segregation associated with higher levels of lynchings conditional on the overall racial composition of a county. Equally important, this measure allows us to extend the analysis of racial conflict to rural areas, where we show that racial sorting is related to violence in rural areas as well.
This finding is consistent with the growing literature on ethnic conflict and development. Ethnic fractionalization is often tied to ethnic conflict that hinders economic development. In particular, ethnic violence tends to lead to greater distrust that, in turn, hinders economic performance. These impacts on trust are present in the immediate aftermath of conflict, demonstrated by the work of Rohner et al. (Reference Rohner, Thoenig and Zilibotti2013) on Uganda's civil conflict and the Cassar et al. (Reference Cassar, Grosjean and Whitt2013) behavioral experiments after the Tajik civil war but can also persist over several generations. Nunn and Wantchekon (Reference Nunn and Wantchekon2011) find modern trust levels are lower for individuals whose ancestors were more heavily raided during the slave trade, helping explain the negative relationship between the African slave trade and modern economic development (Nunn Reference Nunn2008). Voigtländer and Voth (Reference Voigtländer and Voth2012) find that anti-Semitic attitudes and behaviors from the Black Death in the 1300s persisted into the twentieth century. The memory of ethnic conflict can be quite long with dramatic impacts on trust and economic development.Footnote 29
America's past witnessed violent interracial conflict, and the most prominent example is the history of lynchings in the American South. These acts of interracial violence had profound and lasting impacts on the development of the South. As Alesina and La Ferrara (Reference Alesina and Ferrara2002) note, America has substantial differences in trust levels by race, with black individuals 24 percent less likely to trust others than nonblack individuals. These low trust levels are most pronounced in the states that had high levels of lynchings: Mississippi, Alabama, and Arkansas are all among the five states with the lowest levels of trust today (Alesina and La Ferrara Reference Alesina and Ferrara2002) and experienced some of the highest levels of lynchings in the early twentieth century.Footnote 30 Not only do these states have low trust levels today, but they also have among the lowest income per capita levels and least generous provision of public goods in the United States. This article has shown that segregation is an important factor in that history of racial violence.
The results are most consistent with the hypothesis that segregation was correlated with social conflict to the extent that areas that were more segregated were also areas that experienced more racial violence or where the externalities of lynching are greater in more racially segregated environments. In terms of the specific theories outlined earlier, the results are most consistent with political theory, where whites fear disenfranchisement, and a more general theory of social conflict, where segregation reflects underlying animosity between races. This conclusion is similar to that of Hagen et al. (Reference Hagen, Makovi and Bearman2013) that political events were important in lynching outcomes. While they concentrate on mob formation, our results show that the implication of political theories are consistent with completed lynchings as well. The results are less consistent, however, with status competition and with economic theories of Southern lynching. Rather than being a substitute for racial violence, segregation appears to be a complementary factor. Also, segregation does not play a passive role in lynching, as predicted by economic theories of lynching.
We also considered how the inclusion of segregation alters the existing empirical literature on lynchings. We found that the inclusion of segregation altered some of the previously established relationships between lynchings and black/white differences in economic factors, lessening the impact of human capital differences and increasing the role of racial differences in tenant farming. We found that the inclusion of segregation had no impact on the relationship between lynchings and executions, although executions were more likely to occur in more segregated environments. Most important, we found that it is unlikely that the correlation we estimate between segregation and lynching is driven by omitted factors. We found that including antebellum economic and demographic factors, which have been shown to be related to racial animus, and black political gains during Reconstruction did not alter the correlation between segregation and lynching. Segregation appears to have a large and robust relationship with racial violence in the American past.
At a minimum, this project shows that segregation is an important correlate in the Southern lynching story in the United States that should be investigated. We show that racial sorting is indeed related to interracial conflict in a way that has escaped empirical analysis in the past. The empirical relationship between segregation and racial violence shows that the effects of segregation are not only confined to urban communities but also have strong impacts in rural areas. As we noted earlier, more than three-quarters of the population lived in rural areas in 1880. Given the recent calls to expand the scope of lynching data to incorporate the national trend in lynching over this period (Cook Reference Cook2012), future work can extend this analysis beyond the South and allow us to investigate regional differences in the relationships described here. Also, such analysis would expand the racial coverage of lynching, whose victims included Asian, Hispanic, and Native American men and women. Understanding the relationship between segregation and racial violence in America's past helps us understand the dynamics of segregation in the rural communities that experienced an outflow of black residents during the Great Migration and continue to confront complex issues related to race, trust, political participation, and economic performance to this day.
Appendix
Neighbor-Based Segregation versus Traditional Segregation Measures
The most common measures of segregation—the index of dissimilarity (a measure of evenness) and the index of isolation (a measure of exposure)—are limited in a few respects. The index of dissimilarity is a measure of how similar the distribution of minority residents among geographical units is to the distribution of nonminority residents among those same units. The index compares the percentage of the overall African American population living in each geographical unit to the percentage of white residents living in that same area. As the African American population becomes less evenly spread across geographical units, African American residents will begin to constitute a disproportionately large share of residents in some areas and a disproportionately low share in others, increasing the index of dissimilarity. The index of isolation provides a measure of the exposure of minority residents to other individuals outside of their group. This is a measure of the racial composition of the census tract for the average African American resident, where racial composition is measured as the percentage of the residents in the tract who are African American. If there is little segregation, this measure will approach the percent African American for the city as a whole. If there is extensive segregation (African Americans are highly isolated), this measure will get larger as the tracts containing African American residents become more and more homogeneous.
First, due to their reliance on geographical subunits, these traditional segregation measures are typically applied to cities that have a natural subunit of wards. With this focus on cities, these measures are ill-suited to describe the evolution of segregation over time. For example, in 1870, roughly 90 percent of African Americans lived outside of cities, and by 1940 more than half lived in urban areas. We do not know if increasing segregation in urban areas was related to increases or decreases in rural segregation. Segregation measures focused on cities will fail to capture the experiences of the majority of the Americans in the early twentieth century or the conditions that drove many of them to cities by the mid-twentieth century.
Second, another problem with these traditional measures is that they are intrinsically spatial within the geographical subunits. The Logan-Parman measure exploits the alignment of individual households along a line. In contrast, traditional measures only use population shares within a given area. As a proxy for social interactions, social networks, and interpersonal exchange, these measures are especially noisy. As the level of aggregation increases, within-area segregation is inherently obscured in traditional measures. This problem is heightened for rural areas that have less dense populations that may require larger geographical subunits that are less meaningful proxies for social interactions.
Finally, conventional measures fall short when considering the history and evolution of segregation. Echenique and Fryer (Reference Echenique and Fryer2007) and Lee et al. (Reference Lee, Reardon, Firebaugh, Farrell, Matthews and O'Sullivan2008) note that these measures are highly dependent on the way boundaries of geographical subunits are drawn. What makes this particularly problematic for historical segregation is that political motives when drawing ward boundaries can have nontrivial effects on segregation measures and the inference we draw from those measures. The endogenous nature of political boundaries makes it all but impossible to analyze segregation as the cause or consequence of institutional development using traditional measures. Regardless of the motivations for drawing boundaries, existing measures tell us little about proximity or sorting within any boundary.
For the analysis of segregation and lynching the traditional measures are poorly correlated with lynching. We show the results in table A1, table A2, and table A3. Those results show that, even without the inclusion of the Logan-Parman segregation measure, dissimilarity and isolation are uncorrelated with lynching. This stands in stark contrasts to the neighbor-based segregation measure, which has a robust correlation with lynching.Footnote 31
The correlation of traditional segregation measures with number of lynchings per county
The correlation of traditional segregation measures with number of black lynchings per county
The correlation of traditional segregation measures with number of white lynchings per county
Time series of Southern lynchings