

… fear in turn seeks repressiveness as a source of safety. [1970]
—Ramsey Clark, former Attorney General (1967–1969)I sense there is a tendency to make crime in the streets synonymous with racial threats or the need to control the urban Negro problem. [1968]
—Dr. Kenneth B. Clark, sociologist whose doll studies were instrumental in showing that separate was not equal in Brown v. Board of EducationCivil rights cemented its place on the national agenda with the passage of the Civil Rights Act of 1964, fair housing legislation, federal enforcement of school integration, and the outlawing of discriminatory voting mechanisms in the Voting Rights Act of 1965. Less recognized but no less important, the Second Reconstruction also witnessed one of the most punitive interventions in United States history. The death penalty was reinstated, felon disenfranchisement statutes from the First Reconstruction were revived, and the chain gang returned. State and federal governments revised their criminal codes, effectively abolishing parole, imposing mandatory minimum sentences, and allowing juveniles to be incarcerated in adult prisons. Meanwhile, the Law Enforcement Assistance Act of 1965 gave the federal government an altogether new role in crime control; several subsequent policies, beginning with the Crime Control and Safe Streets Act of 1968 and culminating with the Federal Sentencing Guidelines, ‘war on drugs,’ and extension of capital crimes, significantly altered the approach. These and other developments had an exceptional and long-lasting effect, with imprisonment increasing six-fold between 1973 and the turn of the century.Footnote 1 Certain groups felt the burden of these changes most acutely. As of the last census, fully half of those imprisoned are black and one in three black men between ages 20 and 29 are currently under state supervision. Compared to its advanced industrial counterparts in western Europe, the United States imprisons at least five times more of its citizens per capita.
Imprisonment in the United States, 1925–2002.

I argue that the punitive policy intervention was not merely an exercise in crime fighting; it both responded to and moved the agenda on racial equality. In particular, I present the concept of frontlash—the process by which formerly defeated groups may become dominant issue entrepreneurs in light of the development of a new issue campaign. In the case of criminal justice, several stinging defeats for opponents of civil rights galvanized a powerful elite countermovement. Aided by two prominent focusing events—crime and riots—issue entrepreneurs articulated a problem in a new, ostensibly unrelated domain—the problem of crime. The same actors who had fought vociferously against civil rights legislation, defeated, shifted the “locus of attack” by injecting crime onto the agenda. Fusing crime to anxiety about ghetto revolts, racial disorder—initially defined as a problem of minority disenfranchisement—was redefined as a crime problem, which helped shift debate from social reform to punishment. Thus, policies related to crime were part of a critical episode in race-making and protracted contest over the political agenda. What the literature usually treats as independent trajectories—liberalizing civil rights and more repressive social control in criminal justice—were part of the same political streams and the actors and incentives were components in an unfolding political drama that would alter significantly the federal government's role in crime policy and, more importantly, race in post-civil rights America.
First, I elaborate a framework for understanding how crime came to dominate the domestic agenda. Next, I go deep into the policy changes and the public and private debates that surrounded them. I describe how the pace and direction of federal action on crime changed, tracing the movement of crime policy through initial federal attention to crime, characterized by a focus on fairness in the system and root causes, and ultimately to the emergence of “law and order” policies. In the process, I highlight the possibilities that existed in the early period and the routes that were not followed. I analyze congressional hearings around important criminal justice policies, party platforms, campaign material and speeches, oral histories, key votes, commission reports, media and secondary accounts, presidential messages to Congress, media coverage, and government reports, complimenting these public sources with internal documents from Lyndon Johnson's administration. I focus mainly on the years from 1958 to 1974, paying closest attention to the years from 1965 to 1972, during which time attention to crime and policy change burgeoned.
The Role of Politics in Crime Policy
Two scholars of criminal justice recently observed: “Criminologists and sociologists rarely make the political dimension of crime policy a principal concern, and political scientists almost never do.”Footnote 2 I begin with the selective accounts that have begun to fill the vast lacuna of the political science of punishment. Marie Gottschalk's recent book centralizes the role of early developments and crusades against crime in leading to the building of the “carceral state”; she argues that each of these crime campaigns (and the social movements with which they interacted) left behind institutional residues which would enable later developments.Footnote 3 While race is mentioned, its influence is underwhelming and often completely overlooked. In showing how social movements conditioned the latest crime campaign, the civil rights movement is barely mentioned. While Gottschalk ably puts the lie to the notion that law and order campaigns were a recent phenomenon, this point comes at the cost of underestimating the genuine distinctiveness and importance of the crime policy changes that occurred starting in 1965, which ushered in a truly new scale of imprisonment. Unlike past episodes, the latest crime campaign launched the United States to the world record for incarcerating the largest proportion of its citizens.
David Garland's book also provides a long historical perspective. In this work, social, cultural, and economic developments of “late modernity” greatly weakened the penal-welfare state.Footnote 4 A complex, all-encompassing set of macrohistorical and societal factors—including but not limited to women entering the labor force, modernization of capitalist production, demographic changes and suburbanization, changes in family structure and divorce, and technological advances in the media (particularly the rise of television)—together are responsible for both more crime and more incarceration. Through this oversimplification, the primary actor is society itself and every change that characterized the latter half of the twentieth century; in short, the theory is overdetermined and offers a very loose framework for how social disorganization created insecurity and general anxiety about disorder to the detriment of laying out more proximate mechanisms behind policy change and legislative activism on crime.
Jonathan Simon's recent book, Governing Through Crime, refines the generality of Garland's thesis and is not beset by Gottschalk's failure to recognize the true distinctiveness of the post-1960s crime mobilization. Simon argues that the United States has created a new political order and mode of governance that is structured around crime and the fear of crime; crime has become “a, if not the, defining problem of government.”Footnote 5 Governing through crime has become the dominant mode—whether in managing crime risk, valorizing the victim in political discourse, or in using crime as a legitimate reason for action in other domains. While Simon's focus is different—the consequences of this reordering and transformation for democracy—his account compellingly highlights the political dimension of crime politics and the ways institutions and governance were transformed by the various “wars on crime.” Using original historical counterfactuals, Simon convincingly demonstrates that crime was the path of least resistance for government intervention and innovation and the crime problem actually became a “solution” to the problem of governance left by the New Deal. Through his account, we see how crime legislation during the 1960s was not simply legislation but was critical in the forging of a new governing coalition and in presenting crime as a priority for government. In his words, “That legislation and the metaphoric mapping of American society it promoted remain, I would argue, the dominant interpretive grid on which governable America is known and acted upon by government officials at all levels.”Footnote 6
Several scholars have advanced the idea that crime policy transcends the instrumental logic of reducing crime and is better understood as deeply symbolic. The overarching theme in these accounts is that crime is a symbol for other societal anxieties.Footnote 7 Scheingold argues that crime policy is a “product of political decisions rather than moral or functional imperatives.”Footnote 8 In a similar vein, Morone and Meier argue that crime and drug policy exist in the category of “morality politics,” or “policies that redistribute values rather than income.”Footnote 9 Race is the axiomatic example. Racial motivations take a central place in the crime drama, particularly for Katherine Beckett, Bruce Western, and Naomi Murakawa.Footnote 10 In addition to his economic account of the prison, sociologist Bruce Western argues that “the prison boom was a political project that arose partly because of rising crime but also in response to an upheaval in American race relations in the 1960s.”Footnote 11 Katherine Beckett presents a similar argument: “In short, the creation and construction of the crime issue in the 1950s and 1960s reflect its political utility to conservative opponents of social and racial reform.”Footnote 12 Beckett identifies a relationship between the initiative of elites and the media and changes in public opinion. Natalie Murakawa's research goes even further in theorizing about the connection between crime and race. She posits a “race-laden electoral connection” in which crime policy is developed in a context where parties and legislators have incentives to proffer racial framings of the crime problem, and because the costs of the policies are “racially concentrated,” there are few checks on the “punitive bidding wars” that result. Murakawa's account is a unique contribution of how racial power in the U.S. intersected with electoral incentives to create a durable punitive framework. Unlike other accounts, she presents an aggressive account of why crime policy is tied to race and in locating the importance of how crime was framed in the 1960s, providing a rich description of problem framings and party convergence.
While Murakawa, Beckett, and Western all consider the civil rights era an important moment in the development of punitive crime policy to different degrees and make bold claims about the racially inflected motivations of elites, why that is the case is not altogether clear and there is a mismatch between the scale of their claims and the research to support it, a mix of thick descriptive anecdotes and quantitative analyses that skip over the process of change. Their research contains a similar view of the manner in which crime was framed in congressional legislation during 1960s. Indeed there are symmetries between our accounts and the emphasis we place on critical factors—changing crime discourse, the importance of elites, and the emboldened federal role. The key difference is that while they assert a connection of civil rights agenda to crime, that connection is underspecified.
All pay attention to this historical moment and to how legislative incentives are molded by race, yet the question of “why the 1960s?” remains undertheorized. Why did race come to matter when it did? For instance, Murakawa hypothesizes that “mandatory minimum statutes will increase with the waning political power of civil rights agendas”; however, her quantitative analysis, while quite original, does not bring us near that conclusion, finding only that mandatory minimums are related to the electoral cycle. Simon asserts that civil rights was a very probable issue for “recasting New Deal governance” but that it was “stymied easily when the crime agenda decisively sprinted ahead,” without considering the possibility that these two developments were not merely coincidental.Footnote 13
I contend that these accounts are important first steps in theorizing the role of race in crime policymaking, and their ambiguity is the motivation for a deeper investigation. These accounts highlight the political dimension of crime policy and the role of race, but they hesitate in fully articulating just how and why racial conflict came to matter in shaping criminal justice, at which part of the policy process it came to matter, and the particular mechanisms that are driving the outcomes; without an adequate theory, they fall short of empirically testing their instincts. This article continues in their path by deepening the mechanisms in their accounts and bringing into historical conversation the path of criminal justice and civil rights. Rather than being seen as critical of these accounts though, I use them as stepping stones to further our understanding of the political development of crime policy. I pause longer at the historical moment they identify, and, in so doing, find a more complex and nuanced developmental process.
The idea that conservatives used race and crime in strategic ways is neither novel nor unique to the criminal justice literature; research on the civil rights era oft mentions law and order and Nixon's southern strategy. Although not specifically concerned with explaining criminal justice, several historical accounts and one important recent work acknowledge the linkages between social change in the 1960s and repressive responses.Footnote 14 In his historical account of “law and order,” Michael Flamm centers race and civil rights in the analysis: “For conservatives, black crime would become the means by which to mount a flank attack on the civil rights movement when it was too popular to assault directly.”Footnote 15 Other scholars have shown how crime has become a racial codeword, strategically employed by vote-seeking politicians.Footnote 16 The strong association of crime with blacks leads one scholar to note that, “later discourse about crime is discourse about race.”Footnote 17 However, within political science, racialized framings are treated as simply a rhetorical appeal without lasting policy implications. One must look to other policy domains, particularly welfare, for research on how race has affected the development and politics around policies.Footnote 18
The remainder of the article investigates the process of problem definition and the considerations that went into policy change. But the most obvious explanation for why crime came to the center of the agenda is that crime got much worse. The accounts discussed earlier share a common feature: they dismiss crime outright as a potential explanation, but the grounds on which they refute crime are shaky. Most base their claims on the axiom of criminological research—that there is virtually no empirical correlation between crime trajectories and incarceration or between the incidence of crime and public concern with crime.Footnote 19 While I agree with this thesis, I propose a different explanation for what motivated policy changes. Proponents of the crime-is-not-cause congregation raise a panoply of illustrative evidence. Incarceration steadily increased during the 1970s, 1980s, and 1990s, as the argument goes, regardless of whether crime was rising or falling. Crime was rising long before incarceration started to increase. Moreover, according to this argument, variation in crime among the states does not explain variation in state imprisonment. In showing the crime rate to be largely orthogonal, extant studies have focused on the crime-incarceration and public opinion-crime linkage, not crime-policy change. However, studies where incarceration is not the dependent variable have found an effect of crime; for example, the national budget and congressional activity are responsive to changes in crime.Footnote 20 Other accounts not only challenge the influence of crime, but reject the rise in crime in the 1960s altogether. Evidence for this bold claim is questionable, usually resting on the fact that crime increased steadily after WWII so that the increase during the 1960s continued an upward pattern that was not distinct from the 1950s.Footnote 21
While it is true that criminal justice legislation has not responded mechanically with fluctuations in crime rates, in their eagerness to dismiss crime, they have thrown the baby out with the bathwater. The above points are useful but not to conclude that crime is wholly inconsequential; a more fruitful discussion is to understand why crime came to be politicized in the 1960s and not before and unearth the full quilt of motivations embodied in its being elevated to a the status of major national problem. In other words, in refusing to attribute any role to crime, these studies are forced into the same zero-sum framework they attempt to challenge. As Figure 2 demonstrates, crime rose steeply in the 1960s, particularly property-based offenses. Indeed, as I discuss later, crime statistics were by far not the objective measure of actual crime and were often tweaked. So it is possible that the crime figures were untrustworthy. Setting aside the accuracy problems in gauging crime, crime can matter in a host of other ways and the perception of a crime wave can be even more important than reality. Media can facilitate a fictitious crime rise through biased coverage or highly visible crimes, politicians can signal the importance of the problem by alluding to crime in their campaigns, and the resolution or ascendance of other issues can give disproportionate influence to the issue of crime.
The Crime Rate Overtime by Offense Type, 1960–2001.
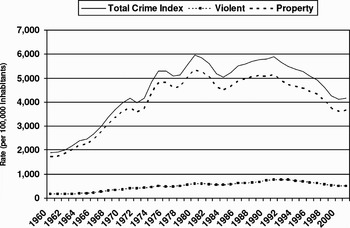
I agree that crime is not the primary explanation; however, I part company with the accounts that argue that its tenuous relationship to punishment is simply because it has no link to incarceration or that the crime problem was overestimated. Crime did rise quite substantially and the homicide rate, by far the most unbiased measure of violent crime, saw a precipitous rise. Demographic changes and technical innovations in crime reporting ensured that even without society becoming more violent, crime would have still been a serious problem. Mine is a different argument—that crime is a partial explanation that cannot fully explain the ways in which the problem was addressed. I do not dismiss crime. Much like the actual presence of Communist affiliates in the anticommunist frontlash against unions and New Deal policies—a case I discuss below—crime was a rising problem in the United States; however, it also operated as a symbol for other motivations. The question is not just whether crime was a rising problem, but what factors best explain the way it was defined and why understandings and approaches changed and subsequently, why the policies to deal with crime departed course. Crime might have been rising, but the primary catalyst was to be found elsewhere. Without elite goals and shift in power, crime and violence were merely objective conditions. Deep investigation into how the issue was framed and negotiated in the political process provides crucial insights into when and under what conditions crime came to be an urgent social problem.
Several factors cast a doubtful shadow on the intrinsic value and singular role of crime in shaping the agenda. First, crime was rising for almost a decade before it was defined as a problem in the machinery of politics, which serves as an important reminder of Blumer's point that social problems are attached to processes of collective definition.Footnote 22 Second, crime can be addressed in a variety of ways—from more prevention to more punishment. The simplistic assumption that increases in crime are behind changes that led to increasing prison populations ignores the politicization of the issue, how target groups were socially constructed, and elite incentives and agency. A crime boom might explain heightened attention to the issue but only goes part of the way in explaining the punitive path and expansion in federal authority. Crime is not divorced from other factors that affect its politicization; only a naïve observer would conclude that other crime campaigns were solely about crime. Would one be comfortable assuming, to draw on a few examples, that Prohibition was only about a rise in alcohol-induced violence, that concern over immigrant crime in the 1920s had nothing to do with anti-immigrant sentiment, or that the scare over cocaine-addicted blacks during the 1920s (or the modern war on drugs) was singularly motivated? Conversely, the historical record is replete with cases when crime rose but was not followed by punitive legislation or a national campaign, including rising crime in the post WWII period.
So while crime does figure in the story, it is not the main character. Crime did rise and it does matter, but two additional factors suggest that it was not the sole motivation: (1) criminals began to receive longer sentences for the same crimes in the United States (2) the risk of incarceration increased steeply.Footnote 23 Therefore, somewhere in the process of policy adoption, legislators decided to punish the same offenses more. I will devote much of the following to exploring the motivations for policy. Mine is an argument not about whether crime rose, but on how it came to be defined and politicized.
To cover the expanse of literature on why punitiveness has become gospel, it would take an encyclopedic treatment, which is not my purpose. This article seeks not to prove existing accounts wrong, but rather to expand them both in theoretical and empirical depth. To do that requires the articulation of a theory that does not isolate crime policy from the political agenda or from other policy domains. In so doing, it becomes clear that existing accounts are not so much wrong as seriously incomplete.
Toward a New Theory
To explain this developmental process in criminal justice, I advance the notion of frontlash, or the process by which losers in a conflict become the architects of a new program, manipulating the issue space and altering the dimension of the conflict in an effort to regain their command of the agenda. Frontlash hinges on the presence of winners and losers of a recent political conflict. In the aftermath, new norms are born and institutionalized, which “involves a shrinkage and rejection of positions that previously had been deemed acceptable.”Footnote 24 But despite the score being settled on one conflict, losers do not disappear once defeated, nor do their ideologies. Rather, the losers seek to “preserve but also perpetuate the distribution of power emanating from those salient [past] political conflicts,” rendering the results of the past conflict fundamentally unstable.Footnote 25 The dissatisfied parties seek openings to mobilize a new issue, alter the dimension of the conflict, or, in the terminology of social movement theorists, “shift the locus of attack.”Footnote 26 Rather than defend the status quo ante then, losers propose new programs of action. By maneuvering into a new issue space and carving a new niche to mobilize around, the disadvantaged/defeated group opens the possibility of reversing its fortunes without violating established norms. If the issue definition is successful, it can manipulate the agenda in a way favorable to the interests of the losers and displace the prominent position of the old agenda issue. In addition to elite incentives catalyzed by defeat, an exogenous shock or dramatically altered environment can assist the mounting of a new issue campaign. Crises can provide opportunities to frame the introduction of a new problem, allowing the defeated group to “propose[s] a new interpretation of events” and “change the intensities of interest” in a problem.Footnote 27 Finally, the losing actors from the previous struggle, though losing issue predominance, might remain in influential positions. Along with the articulation of a new issue problematic, entrepreneurs seek issue dominance by creating a monopoly on the understanding of an issue, associating it with images and symbols while discrediting competing understandings.
If the set of ideas is powerful enough and focusing events enlarge receptivity to it, the issue understanding can gain momentum and diffuse quickly, and frontlash will enter into its last stage—issue capture. Once one party in the conflict develops a monopoly on the understanding of an issue such that continuing opposition is a liability, “strategic pursuit” will usually ensue; in seeking to avoid blame, the disadvantaged side will position themselves nearer rivals despite this being outside their “zone of acceptable outcomes.”Footnote 28 However, strategic pursuit can be a “perilous strategy” because it signals endorsement, narrowing the set of alternatives and discounting early conceptions; thus, it may further instantiate the issue understanding and proscribe policy options.Footnote 29 Once the issue is captured, “secure policy subgovernments can and do build up around particular issues.”Footnote 30
I show how frontlash occurred in crime policy, a critical episode in the development of criminal justice outcomes in the United States. The 1964 Civil Rights Act ended the “world's most developed system of racial servitude” and institutionalized strong norms of racial equality.Footnote 31 As Crow had loosened its clutch, leaders of the old paradigm remained and sought to enlarge and shift the conflict strategically. They mobilized a new form of resistance, shifting to a new policy domain by moving crime and criminal justice to the agenda. Two focusing events—crime and riots—facilitated mobilization of the issue. The violent insurrections that swelled in the mid- to late-1960s created an opportunity to sharpen the connection of civil rights to crime. Strategic policymakers conflated these events, defining racial disorders as criminal, which necessitated crime control and depoliticized the grievance. Although tinged with racial subtext, this causal story did not disturb the newly institutionalized egalitarian precepts. Conservatives pitted toughness on crime against vigorous advocacy of civil rights by building a durable connection between black activism and crime. The liberal social uplift approach atrophied under the weight of this powerful doctrine. Sandwiched between two traps—being soft on crime and excusing riot-related violence—liberals had to forgo their ideal outcomes and moved closer to the conservative position. They engaged in strategic pursuit, emulating the conservative issue understanding, implicitly endorsing the linkages conservatives had drawn. This vindicated the conservative law-and-order doctrine and deepened the association between crime and racial discord, and ultimately, collapsed the liberal alternative for dealing with root causes. Once partisan consensus emerged, the elite countermovement was able to eclipse the dominance of the civil rights issue, assaulting it not from the segregationist platform but where it was weakest. Strategic entrepreneurs thus used the crime issue as a vehicle to advance a racial agenda without violating norms, attaching the outcomes of old conflict (Great Society programs and civil rights legislation) to the causes of the new problem—the breakdown of law and order.
Revisiting the Backlash Narrative
This endeavor is principally geared at understanding the transformation of criminal justice in the United States, but in embarking on that exploration, it became clear that it was part of a much grander dilemma in racial politics in the United States and demanded a revision of traditional stories of race in post-civil rights America. By this point, it is evident that the frontlash framework is a critique of another literature and concept that has become doctrine in accounts of race and American political development.
Backlash is the politically and electorally expressed public resentment that arises from perceived racial advance, intervention, or excess. The backlash term was first used with regularity by journalists, political observers, and academics prior to and in the wake of the 1964 presidential election. Initially, it described the ‘Wallace phenomenon,’ or the strong support George Wallace received in the Democratic primaries of several Midwestern states and Maryland and especially in the major cities of these states.Footnote 32 It referred to working-class whites who shifted support to Wallace; thereafter, the label was applied to whites who deserted the Democratic Party to vote for Barry Goldwater. Later, scholars proffered what became termed as the backlash thesis (not to be confused with the earlier generic backlash label), which quickly became the orthodox view to explain the breakdown of the liberal New Deal consensus during the 1960s.Footnote 33 According to this narrative, liberal excesses in the 1960s caused the middle American voter to snap back, which led to the conservative hegemony.Footnote 34 The steady decline of liberalism in the post-civil rights era is explained by whites who were antagonized by the Democratic Party's espousal of “special interests,” especially minority groups. The “silent majority,” as they came to be referred to, rejected the encroaching racial liberalism.
Despite the great common sense appeal and parsimony of the backlash account, it is more of a descriptive narrative and pseudo-theory for describing anti-black feeling expressed via election outcomes than a specified theory. In other words, there are no accounts that fully theorize the backlash concept, when and under what conditions it occurs, and the distinctions between its varioius forms—policy, electoral, political, and general backlash. It is not clear, for example, where backlash comes from, whether a policy intervention is required, and what threshold of reaction must be passed to be considered a backlash. Much like the ambiguity around its origins and motivation, it is equally unclear what the ultimate aim or target of backlash is—repeal of an advance, desert a party who has gone too far to the extreme, revert to some prior status quo condition, or simply to register anger. One might wonder how backlash is distinct from a moral panic, racial threat, or symbolic racism exploited by elite appeals. The analytic and theoretic components of backlash have not been elucidated; rather, backlash has been volleyed around as a term for describing any negative reaction to a whole host of racial threats, perceived and real. This lack of empirical propositions for what constitutes a backlash has enabled an unspecified range—from withdrawal of support to outright violence—and an uncritical application of the term to a wide variety of groups and contexts—southerners, white ethnics, suburban whites, Midwestern Wallace voters, and working-class whites anxious over competition for jobs. It is therefore unclear which cases of racial conflict, if any, would not fall into this expansive and vague definition. In fact, we are not sure where backlash begins and ends and what the unique characteristics of backlash are.
This lack of clarity makes it a formidable task to distinguish concepts and raises doubts about the use of backlash as a conceptual tool. This can best be seen in the hasty way trends have been labeled backlash, when a case conveniently falls into the pattern of a negative reaction to any type of racial progress, combined with the inability to explain why other cases of racial advance do not fit the pattern. But the backlash account is flawed in another respect: the backlash thesis regards the transformation of politics as a fundamentally populist reaction. As a result, the backlash thesis overstates the degree to which a reactionary white electorate propelled developments verses elites. Based on a bottom-up view of growing disillusionment and inertia, this perspective gives total agency to undefined white masses, removing political initiative from elites and ignoring the incentives and opportunities that existed for an elite countermobilization and the new norms of racial equality they were bound by.Footnote 35 It tacitly assumes that the developments that unfolded were driven by the mass public. Elites are often left out of the backlash story, and when they do appear, as in the Edsalls's account, elites are not formulating discourse or strategizing, they are onlookers with an eye toward anticipating public reaction, and acting accordingly. But why did the specter of racial change elicit such a reaction then and not other times—to the creation of minority majority districts for example? For the answer, we must turn to elites; in the latter example, it was not in the interest of conservative elites to argue against redistricting, because they benefited from it so there was little incentive to reframe the debate. In spite of these critiques, to fully understand frontlash it is useful to expound on the distinctions between frontlash and backlash and situate these concepts in regards to race.
We can think of backlash metaphorically as a bungee cord that snaps when stretched too far. In the more active account, seductive racial appeals catalyze the latent racial resentment of the white electorate. Backlash therefore entails a distinct tipping point; voters withdraw support or become sympathetic to more extreme voices when pushed too far. Backlash is a mass mobilization of white hostility to an intervention or in support of a candidate, the epitomizing case being the white vote for George Wallace in Wisconsin in 1964, or hostility against such policies as affirmative action or racial busing. While backlash came to represent a post-1960s phenomenon, racial backlashes are not specific to the post 1960s era. Based on an admittedly fuzzy definition, earlier examples might include backlash to the Brown decision that engendered the radicalization of southern whites and politicians, immigration reforms of the 1920s, or the 1863 New York draft riots.Footnote 36
The key distinction then between frontlash and backlash consists in both the nature of the political reaction and the actors which carry that reaction to its conclusion. Backlash is reactive in a conservative dimension (aims to preserve the status quo and resist changes through emboldened opposition). Importantly, the main actors of consideration are the masses, the voting population which prompt elites to undertake certain policy positions with race in the foreground. Frontlash is preemptive, innovative, proactive, and, above all, strategic. Here, elites aim to control the agenda and resist changes through the development of a new issue and appropriation and redeployment of an accepted language of norms. The two conceptions also differ in terms of what might be a catalyst for their activation. For backlash, it is sometimes a policy, sometimes a candidate that stokes fears, sometimes broad civil rights developments that progress to uncomfortable levels for portions of the electorate. The catalyst in frontlash is defeat of longstanding political discourse or elite program.
Instead of a bungee cord recoiling when stretched too far, we can think of frontlash as water moving swiftly through a path that eventually comes to an end, forcing the water to seek alternative routes or as a weed that after being killed by weed killer mutates into a new variety, becoming resistant. It is strategic, alive, complex and sophisticated in its reaction. While racial/ethnic conflicts are good candidates because of the strong norms inherent to them, not all racial conflicts would necessarily result in frontlash. For example, the conflict over affirmative action did not result in a frontlash; rather it employed a prevailing norm—colorblind equality—to argue against “racial preferences” and “reverse discrimination.” The fervent anticommunism spawned by union centralization in the 1930s is a prominent example of frontlash. An increasingly activist government sympathetic to unions threatened the interests of business leaders and conservative legislators. This coalition strategically attacked a strong labor movement (and a supportive federal government) by connecting it to a “Red menace” and enlisting the fears of communist subversion, sidestepping issues of economic concern. Charging instead that workers' grievances were based on communist agitation, they argued for a crackdown on radicalism and labor unrest. These charges had some basis in reality; there were pockets of Communist Party affiliation in labor organizations including the CIO. Redefining the issue in terms of subversion rather than legitimate economic demands helped create an image favorable to business and shifted the dimensions of conflict. As the strategy developed, the American Legion, anti-labor business, and politicians on the Right claimed that Roosevelt's New Deal agencies had been infiltrated by Communists, discrediting the popular social programs. The House Un-American Activities Committee (HUAC) was created in 1938 to root out Communist Party influence. “HUAC's anticommunist investigations offered a more effective way to fight the New Deal than opposing its economic and social reforms.”Footnote 37 Ultimately, this strategic issue redefinition and capture weakened the New Deal, liberalism, and labor unions.
By departing from backlash, I do not mean to impose a false dichotomy of terms, but rather, sharpen our view of elite incentives and thereby focus on a neglected history and important part of the conservative strategy. Rather than dismissing the backlash thesis writ large, frontlash revises and elongates the view of post-civil rights developments and brings into view developments that have been treated as merely coincidental. Without frontlash, we would mistakenly attribute the rise in incarceration to the much later war on drugs and fail to see how it developed out of the struggles of the 1960s. By sidestepping consideration of elite incentives, the backlash framework cannot explain the sudden mobilization of the crime issue and its connection to the rights revolution. It can explain why in the hundreds of articles and books on the Civil Rights Movement and its decline, there is comparatively little on its linkages with the issue that replaced it on the agenda and became a cornerstone of the conservative domestic program.
Frontlash adds another dimension to the backlash narrative because it can show how policies that usually are considered separately are actually part of same political history; developments in one domain can and do influence strategic decisions or new developments in another, ostensibly unrelated, sphere. In explaining the sustained shift in criminal justice then, my account unintentionally posits a different view of why the powerful civil rights agenda eroded.
The Political History of Crime Policy: From Great Society to War on Crime
Prior to 1960, federal involvement in crime and law enforcement was limited.Footnote 38 Presidents rarely touched on crime in their public addresses or private messages; party platforms were silent on the issue. The federal government was proscribed from interfering in what was believed to be a state and local concern, only having jurisdiction in cases of treason and espionage, mail fraud, and counterfeit crime. The Department of Justice (DOJ) was a small entity which only prosecuted Internal Revenue Service (IRS) cases with an emaciated budget. Federal Bureau of Investigation (FBI) Director J. Edgar Hoover was the sole voice in this vacuum, fervently speaking about the mounting rate of serious crimes and predicting a further increase. He lamented the public's “submissive attitude,” saying “law enforcement has not yet attained the measure of public support it justly deserves.”Footnote 39 He was partially right; the FBI reports showed that crime was increasing—it increased 66 percent in the 1950s—but there was little concern at the federal level. Rising crime rates in the 1950s, as far as we can take them as fact, were not initially followed by punitive legislation or a coordinated federal attack on crime.Footnote 40 To the contrary, the only anticrime legislation that was passed in this decade concerned specific incidents—gambling and racketeering, crime in planes, obscene mail, and drunk driving.Footnote 41
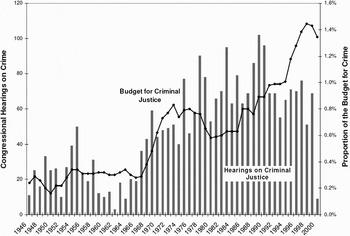
This is not to suggest the federal government had never been involved in crime control. As Gottschalk documents, there were several other highly visible crime campaigns that resulted in “bursts” of federal attention: kidnapping, attention to immigrant crime in the 1920s, prohibition, Kefauver's highly publicized organized crime hearings all over the country, juvenile delinquency in the 1950s, airplane hijackings, and the heightened attention to crime and prostitution during the Progressive Era.Footnote 42 Hoover's Wickersham Commission (formally the National Commission on Law Observance and Enforcement) proposed a national effort to conduct research and improve law enforcement and overhaul criminal procedure. Indeed, many national leaders and presidents employed the crime issue before Goldwater and Nixon, including Teddy Roosevelt, Joseph McCarthy, and Estes Kefauver. However, none of these campaigns resulted in a sustained national program on crime. Gottschalk even notes that “in earlier periods, the state's skeletal criminal justice institutions kept a check on these moral crusades” and that “most of the penal reforms of this era were enacted and implemented by local or state authorities” even if they garnered national attention.Footnote 43 As will become clear below, the 1960s crime campaign is set apart from the others in scope and impact. Figure 3 illustrates dramatic rise in legislative activity and federal financial commitment to crime and criminal justice over time. The scale of federal involvement was of a new magnitude and changes broke entirely new ground, establishing new precedents for federal action. The federal government had waged crime wars before, but never in ways that changed its role or shifted authority away from the state's constitutional powers to police.
Legislative Activity and Budget for Criminal Justice.
The beginning of the next decade continued in the same direction. Hoover called for the adoption of “stiffer laws and a more stern policy” but got instead legislation that expanded the rights of defendants and increased fairness in the system.Footnote 44 Several Supreme Court rulings—Mallory (1957), Mapp (1961), Gideon (1963), Escobedo (1964), and later, Miranda (1966)—had focused attention on the rights of criminal defendants and significantly curtailed the admissibility of evidence and confessions. While these Court decisions were sharply criticized for “handcuffing the police,” bipartisan coalitions supported bail reform, indigent defense, and juvenile rehabilitation. These early priorities of the rights of the accused passed with minimal fanfare or controversy. Indeed, conservative congressional leaders such as Representative Roman Hruska (R–NE) and Senators James Eastland (D–MS), and Sam J. Ervin Jr. (D–NC) signed onto Attorney General Kennedy's Criminal Justice Act in 1964, which established the Office of Criminal Justice to oversee fairness in law enforcement and provided for a public defender system. However, this legislation did not make a significant change to criminal justice and its budget was fairly small. Attorney General Robert Kennedy created a Committee on Poverty and the Administration of Justice; its report found that poverty had a greater impact on crime than was commonly assumed and proposed solutions for improving the handling of poor defendants in court. Several preventative programs aimed at youth crime were begun as well as treatment programs, prisoner reentry, and the creation of Halfway Houses.Footnote 45 Therefore, to the extent that crime was on the national agenda, it was geared toward fairness, rights of the accused, and organized and juvenile crime.
In its first two years, the Johnson administration was similarly indisposed to making crime a federal issue, characterized by a mixture of neglect, fairness, and root causes, with almost equal emphasis on each.Footnote 46 The administration purposefully avoided making crime a federal problem, a responsibility that would put the government in the vulnerable position of making promises it could not keep and priming public demand for swift results. Johnson viewed crime as a problem of urban blight, poverty, and racial discrimination and as a result, placed a strong emphasis on understanding underlying causes. He argued that through a war on poverty, crime would be reduced, and was hesitant to establish a crime program for the national government. In 1964, Johnson aide Jack Valenti wrote a memorandum: “Very frankly, I disagree with … the formation of a Presidential Committee to study violence.”Footnote 47 This passivity characterized the initial disposition of the Johnson administration.
In a striking break with this approach, the very next year, Johnson announced a “War on Crime.” To understand why, we must consider the emergence of the arguments of the crime entrepreneurs in civil rights debates.
Early Arguments against Civil Rights
Three strategies connected crime to racial change. The first variation used by early opponents of civil rights legislation was the argument that the civil rights demonstrations were criminal acts. Southern congressmen had been trying for years to apply criminal charges to civil rights leaders and their followers. A coalition of southern senators (from Mississippi, South Carolina, Virginia, Alabama, Arkansas, and Florida) introduced legislation in 1961 to criminalize freedom rides and sit-ins. They argued that freedom-riders were using interstate commerce to incite riots and should be criminally punished:
As to the so-called freedom riders, it is well known that this trip originated far from the South, and had as its announced purpose a trip through several States where local statutes would be violated … . Instead of being encouraged by groups, and cast into the political arena, to be made a political issue, they should be made a violation of the criminal statutes.Footnote 48
And in some places it was. State legislatures in Mississippi, Tennessee, Virginia, Georgia, and South Carolina implemented statutes with the aim of criminalizing NAACP actions.Footnote 49 Immediately after the lunch counter sit-ins in 1960, states began passing laws with penalties specific to sit-ins and boycotters were brought in on laws that made it illegal to interfere with business.
The second variant to this crime/civil rights linkage was to argue that civil rights and integration would portend a crime wave by bringing violence-prone blacks to white neighborhoods.Footnote 50 Senator Richard Russell's statement in 1960 is representative:
And, Mr. President, I say that the extremely high incidence of crimes of violence among members of the Negro race is one of the major reasons why the great majority of the white people of the South are irrevocably opposed to efforts to bring about enforced association of the races.Footnote 51
Conservative congressmen also blamed “civil rights havens” for the increase in crime; Representative John Bell Williams (D–MS) argued:
This exodus of Negroes from the South, and their influx into the great metropolitan centers of other areas of the Nation, has been accompanied by a wave of crime . … What has civil rights accomplished for these areas? … Segregation is the only answer as most Americans—not the politicians—have realized for hundreds of years.Footnote 52
In the congressional debates over 1964 Civil Rights Act, opponents frequently referred to the fact that crime rates of Southern blacks were much lower compared to their Northern counterparts.Footnote 53 In attempting to break a filibuster of the bill, Senator Jacob Javits (R–NY) contested the strategy to link crime and civil rights: “Another favorite diversion of the bill's opponents consists of alluding to crime rates in major northern cities.”Footnote 54
Finally, as the first major legislative civil rights victories were under way, this argument was refashioned from prediction to explanation to challenge the passage of the Civil Rights Act of 1964. In the summer of 1964, the Harlem and Rochester race riots gave fuel to the familiar argument that had been percolating in the background of civil rights debates since the 1957 Civil Rights Act—that civil rights would engender a crime wave and integration would bring lawlessness. In this version of the argument, several Congressmen campaigned against passage of the Civil Rights Act of 1964 using the riots as testament to the fact that civil rights bred lawlessness. They argued that because the racial unrest happened in northern states with the most progressive social policy and civil rights, then poverty and racial discrimination could not be to blame. Instead, cities like Philadelphia and Rochester were described as being “victims of their own generosity”; by opening their arms to southern blacks, they were repaid with crime-ridden slums and black discontent. According to one of the major sponsors of later crime legislation, Senator John McClellan (D–AR), “The Civil Rights law is calculated to provoke, and is provoking, an attitude that is contrary to the concept of bringing about an understanding and harmony between the races.”Footnote 55
After the 83-day long filibuster led by southern Democrats, the civil rights bill was passed. This passage signified a major turning point in the civil rights conflict. Rather than a mere legislative setback, it marked a successful challenge of the segregationist platform and the establishment of the legal norm of racial equality. But racial contests were far from settled. It was a stinging defeat for conservatives, who now had a lingering incentive to make an end-run around civil rights. Rather than fading, the segregationists' crime-race argument was reframed, with a slightly different veneer, and became the fulcrum of the conservative's proposed agenda on crime. Although initially ineffective, this argument would provide the backbone of the successful campaign for tougher crime policy.
The following case illustrates how a losing group capitalizes on their interest in regaining dominance by enlarging the conflict. First, I show how arguments against civil rights were leaked into crime policy debates. In this, we will see how entrepreneurs leverage focusing events in order to define a problem, associate it with favorable images, and ultimately, secure a monopoly on the policy understanding.
Expanding the Conflict: “Goldwater's Nightmares”
Before 1960, crime was about the drunk, the “mad-dog sex killer,” and the juvenile hoodlum. FBI Director Hoover tried to bring crime to the policy agenda and to public concern, most often proclaiming the link between communism and crime, but before 1960, he was practically alone.Footnote 56 When crime was discussed, there was no explicit and very little implicit connection of crime to blacks.
Despite Hoover's early rumblings about crime rises, the person to succeed in raising the public's awareness of crime and its connection to a wide variety of other social malaise was Barry Goldwater. Goldwater warned voters in 1964:
[C]hoose the way of this present Administration and you have the way of mobs in the street, restrained only by the plea that they [referring to black militants and civil rights demonstrators] wait until after election time to ignite violence once again.Footnote 57
To dramatize this point, the Goldwater campaign designed a television advertisement called “Choice” which depicted the mayhem of the Harlem riots in 1964, later pulled because it was so inflammatory.Footnote 58 It was replaced with an advertisement that began with these words: “Graft! Swindle! Juvenile Delinquency! Crime! Riots!”Footnote 59 The same Goldwater who had opposed Kennedy's proposed National Crime Commission, arguing that it would lead to a national police force,Footnote 60 wanted crime to be a focus of his presidency:
Crime grows faster than population, while those who break the law are accorded more consideration than those who try to enforce the law . … Our wives, all women, feel unsafe on our streets . … Perhaps we are destined to see in this law-loving land people running for office not on their stainless records but on their prison records.Footnote 61
Goldwater is credited in almost folklore like ways with the first intimations of “law and order.” While Goldwater was perhaps the first to vocalize the crime issue in a major political campaign and this is dramatized in most accounts, there is evidence that crime had become an important topic to several southern Democrats prior to Goldwater's orations. In a book about organized crime (the one area federal legislators could get involved in), John McClellan devoted the remaining pages to a new topic on his mind—crime in the streets—singling out the District of Columbia for particular emphasis and calling for “heavier penalties for insidious crimes.”Footnote 62 Goldwater campaign Director of Field Operations (and eventual attorney general in the Nixon administration) Richard Kleindienst has been credited by some as the driving force behind the turn toward law and order.Footnote 63 As already discussed, crime was a favorite theme of southern Democrats in expressing opposition to civil rights and integration.Footnote 64
The potential explosiveness of this issue was not lost on the Johnson administration, and his aides recommended that he “immediately call a White House Law-and-Order Conference” to demonstrate their commitment to quelling violence: “I am convinced that if the president does not call such a conference, Goldwater will.”Footnote 65 Although his candidacy was unsuccessful, Goldwater's spirited attack laid the groundwork for extending the debate over civil rights to a ripe domain. Johnson administration officials produced a memorandum outlining steps for an extensive agenda on “crime and delinquency” shortly thereafter, primarily as a reaction to Goldwater's fevered claims: “Although there are existing Federal programs . … The obvious public concern over this matter during the campaign … warrant a new look.”Footnote 66 In March 1965, Johnson issued his first speech on crime and message to Congress—the first such presidential address specifically on crime—and sent an anti-crime program to Congress with several requests for new legislation. The most important of these, the Law Enforcement Assistance Act (LEAA), provided for a three-year pilot program of federal aid to states and localities for the purpose of innovating their criminal justice systems through training programs and experimental projects. After the bill glided easily through Congress without a negative vote, Johnson signed the LEAA, saying, “This bill puts the federal government in partnership with our states and local communities in performing the first and most important function of government: the preservation of law and order.”Footnote 67
Although it was never budgeted more than $7.5 million annually—a pittance in comparison to the criminal justice system today—”the result was a level of federal action that would have been inconceivable ten years earlier.”Footnote 68 It was the first federal program specifically for the purpose of helping states strengthen their law enforcement capabilities and only the second time to that point that the federal government invested its own resources in the national crime problem.Footnote 69 It was the model for several pieces of subsequent legislation from the Safe Streets Act three years hence to Clinton's omnibus crime control bill three decades later. It established the Office of Law Enforcement Assistance (OLEA) in the Department of Justice. While conceived with the intention of improving local law enforcement and updating practices and researching the nature of crime, it marked the beginning of an expanded federal government intervention in the area of criminal justice and law enforcement, and spawned the creation of the Law Enforcement Assistance Administration in 1968, which would ultimately dole out millions of dollars in federal aid.
However, Johnson remained dedicated to discovering the causes of crime, prevention, alternatives to incarceration, and rehabilitation. It was this end to which he established the Commission on Law Enforcement and Administration of Justice by executive order in 1965 (headed by Attorney General Nicholas Katzenbach) charged with deep investigation into these social conditions. The commission's bestselling report, The Challenge of Crime in a Free Society, blamed poverty and ghetto conditions for crime, saying “crime and recidivism cannot be cured by any correctional system so long as the roots of crime in slum living, poverty, and joblessness are allowed to persist.”Footnote 70 Although the welfare approach was now balanced with a harder criminological line, most of the legislation after Johnson announced his war on crime was still rehabilitative—including civil commitment of drug addicts, prisoner rehabilitation, and juvenile delinquency—and had an intensive research focus based on two commissions to study the causes. The only punishment-based alteration of the criminal code was legislation requested by Johnson to protect civil rights workers from violent attacks. Thus, while the federal role in crime expanded quite significantly, the approach did not.
By introducing this legislation, the Johnson administration believed it was diffusing the issue; in an ironic twist, it actually served to promote it. By responding to Goldwater and endorsing an anti-crime program, the administration inadvertently created a suitable context in which the crime-race argument could be reborn and flourish. The concept of federal aid to state crime programs was not altogether new. The Kennedy administration had implemented a $10 million grant program to aid juvenile delinquency programs as part of the Juvenile Delinquency and Youth Offenses Control Act. The key distinction is that this federal aid was under the auspices of the Department of Health, Education, and Welfare “to avoid the impression of federal usurpation of a traditionally local function,” while OLEA was housed in the Justice Department. Originally Senators Phillip Hart (D–MI) and Jacob Javits (R–NY) had proposed having the OLEA grants being housed under the Department of Health, Education, and Welfare (HEW).
The political arena often deals with problems, but when objective conditions pass a threshold where they become appealing and are rich in content for shifting the debate, they transcend the status to become focusing events. In the next section, I show how two crises became focusing events, opening a critical window of opportunity for issue entrepreneurs to elevate a problem to terms amenable to the defeated framework. Specifically, I show how non-racial conditions were interacted with racial ones to heighten the salience of the crime problem, associate it with racialized images, and ultimately dominate the agenda.
Focusing Events: Riots and Crime
Two crises served to elevate the status of violence as a political issue: crime and riots. Just as the Law Enforcement Assistance Act was being passed, the August 1965 riot in the Watts neighborhood of Los Angeles dealt the first blow to the poverty approach. The most destructive riot in the twentieth century up to that time ended with 36 dead, more than 1,000 injured and 4,000 arrested, nearly 1,000 buildings burned, and 15,000 National Guardsmen deployed. A U.S. News and World Report headline captured well the contention that emerged with force: “Race Friction—Now a Crime Problem? … The turn: away from demonstrations and toward outlawry. For city after city, it's becoming a problem of crime control.”Footnote 71 A series of “long, hot summers” followed the events in Watts, with outbreaks in large cities to small communities, from Elizabethtown to Newark to Omaha. During 1967, 41 percent of cities with populations of more than 100,000 had experienced a racial disturbance, according to a national survey.Footnote 72Figure 4 illustrates the sharp rise in riot activity between 1965 and 1969 and the resulting arrests and injuries.
Riot Incidents, 1954–1975.

Rising black insurgency coincided with another crisis, popular perceptions of the steadily rising crime rate. By virtually every official report, media account, or political speech, crime rose in the 1960s and continued to rise until the mid-1970s. The baby-boomer generation had come of age, adding millions of youth to the population. From 1958 to 1967, the adolescent population (those aged fifteen to twenty-four) went up 42 percent, the age group that is responsible for over half of index crimes, including violent offenses.Footnote 73 One study found that if crime were calculated by taking into account the population in this age bracket and not the total population, the crime rate would have been stable. Simultaneously, increasing urbanization added millions to cities, which have historically experienced more crime. Figure 2 charts the trend in crime. In addition to actual rises in criminal behavior due to these natural demographic changes, there were several technical reasons for the bloated crime rates.
Crime statistics are based on the FBI's Uniform Crime Reports, compiled annually since 1930. The reports rely on thousands of local agencies voluntarily submitting their number of reported crimes (offenses known to the police). many jurisdictions had no systematic approach to reporting these data in place prior to the 1965 legislation's passing, and the proportion of those that did regularly report their crime rates increased steadily throughout the 1960s, which led to increased precision in the reports. Figure 5 charts the number of local agencies that submitted their reported crime to the FBI at least six months during the year; it steadily increases over these years, doubling from 1964 to 1985, and closely tracks the increase in crime. In addition to inconsistent reporting, police departments had incentives not to report poor crime rates, lest they draw the critical eye of J. Edgar Hoover. This incentive to tamper could have the could have had serious effects on crime: “it is doubtful that any large city has continuously participated in the Uniform Crime Reporting [UCR] program since 1930 without there having been some purposeful, major defection from UCR standards at some time during that period.”Footnote 74
Crime Reporting and the Crime Rate, 1964–1985.

In addition to reporting issues, the policy changes taking place in the mid- to late-1960s likely biased the historical trend in crime statistics. First, policy initiatives such as the LEAA aided the crime rate increase by professionalizing police departments, particularly rural jurisdictions, where, not coincidentally, crime rates climbed the fastest. As funds poured into local police departments and as pressure from the FBI increased, local manpower and technology for counting crimes improved dramatically. In addition to more police departments participating, the OLEA grants improved the quality of law enforcement and technologies available to them, increasing public confidence in police departments, which in turn meant that the public became more likely to report crimes during this time period.Footnote 75 Second, these policies had switched the incentives of the now 40,000 police departments. Local police departments now had an incentive to inflate their crime rates because funding was contingent on need (a concern that was frequently voiced in the debates over the legislation); Attorney General John Mitchell later called this the “paper crime wave.”Footnote 76 Therefore, the “official” reports were perhaps just as problematic after the passage of the 1965 Law Enforcement Assistance Act as before, but this time in the direction of overestimating crime.
People also became more likely to report certain crimes that were previously underreported, including rape. Some areas underreported crime more, particularly black neighborhoods and ghetto areas where police were reluctant to respond; greater attention to crime as a national issue and to inner-city riots ensured that a greater number of crimes in ghetto areas were recorded. Another factor contributing to artificial inclines in the rate of crime was the fact that, until 1973, the UCR counted only theft over $50 as “larceny.”Footnote 77 The largest increase in the crime rate in the 1960s was in the category of larceny, which most experts agreed was due to the declining value of the dollar combined with the unchanged $50 that triggered a crime being reported as such. Finally, in deriving its crime statistics, the UCR used outdated census data, which led to spikes in crime at the end of the decade because population counts, the denominator, remained unchanged until the next census.Footnote 78
Taken together, these factors resulted in estimates that were likely biased toward increasing trends, reflecting improvements in crime reporting rather than a scourge of crime. A combination of the vagaries of counting across disparate local law enforcement agencies, professionalizing at different paces, with the demographic realities of increasing urbanization and the baby boomer generation meant that finding the truth about the rise in the crime rate was nearly impossible. However, despite the large statistical nightmare that it presented, the fact of a crime epidemic was no longer disputed by 1965, and a steady flow of reports and journalistic accounts ensured that it was communicated to the public. Paradoxically, in addition to other exogenous factors, LEAA's passage in 1965 ensured the appearance of rising crime rates—the fodder which combined with escalating riot-related violence in the cities was used to call for more, and more draconian, policies.
The convergence of these critical factors altered the opportunity for establishing political advantage; elites leveraged these events to define a new issue, associate it with certain images and ultimately secure a monopoly on the issue understanding. The riots gave a rising crime rate new political currency. Mediated by elite goals, these conditions ripened the possibility of forming a new issue and increased the public receptivity to the original argument voiced in civil rights debates.
Problem Definition: Racializing Crime, Criminalizing Racial Struggle
The frontlash relied on a two-stage maneuver. First, conservatives attached civil rights to lawlessness by arguing that civil disobedience flouted laws and would inevitably lead to more lawless behavior. Thus, nonviolent protest was connected to riots. But then, through a reverse claim, they disconnected the relationship they had just sewn, by arguing that the riots were not connected to legitimate grievances but to “crime in the streets.”
Old habits did die hard; previously confined to debates around civil rights, the arguments linking crime and civil rights were ultimately revived and inserted into debates around crime, but this time with more sophistication and aided by real-world conditions. Early opponents of civil rights legislation had argued that one form of civil rights protest would ultimately lead to more law-breaking and that civil rights and voting rights legislation would reward such lawlessness. The new norm of racial equality required that proponents avoid the explicitly racist justifications of its Jim Crow predecessor. Instead, supporters of punitive crime legislation now argued that civil rights strategies promulgated the idea that laws could be obeyed selectively. With the nation engulfed in violent protests, they reopened this argument to legitimize their attack on the civil rights agenda and initial appeals for heavier handed law enforcement.
The strategy relied on two mutually reinforcing elements: (1) depoliticization and criminalization of racial struggle and (2) racialization of crime. According to this argument, the civil disobedience strategy of movement activists was the major culprit in the crime increase.Footnote 79 This claim was empirically unfounded; though arrests related to collective action protests did increase during this time, it was not of a scale to make the aggregate crime rate increase.Footnote 80 Some academics believe collective action actually had the opposite effect.Footnote 81 But in their advocacy, proponents of the new doctrine championed the view that civil rights demonstrations amounted to violence and created a climate of lawlessness. Senator Richard Russell denounced politicians for condoning them:
The seeds that have been sown by high officials encouraging violations of local law are now producing the crop of violence . … If our highest officials continue to applaud sit-ins, lie-ins, stand-ins, and all other violations of property rights, it can lead us into a state of anarchy.Footnote 82
The argument depended on collapsing the distinction between political protest, which relied on a strategy of nonviolence, with riots; Herman Talmadge (D–GA) concluded that “mob violence such as we have witnessed is a direct outgrowth of the philosophy that people can violate any law they deem to be unjust or immoral or with which they don't agree.”Footnote 83 Senator Russell Long gave a speech explaining where the riots started—“When Martin Luther King was in the Birmingham, Alabama, jail and wrote a letter … to the preachers which said civil disobedience is OK if done in the name of civil rights.”Footnote 84 J. Edgar Hoover also denounced the nonviolent strategy of civil rights activists:
“Civil disobedience,” a seditious slogan of gross irresponsibility, has captured the imagination of citizens … . I am greatly concerned that certain racial leaders are doing the civil rights movement a great disservice by suggesting that citizens need only obey the laws with which they agree. Such an attitude breeds disrespect for the law and even civil disorder and rioting.Footnote 85
One of the most articulate proponents of this idea was the former Supreme Court Justice Charles E. Whittaker, who, since retiring from the Court, traveled across the country giving speeches and often testified before Congress mainly on this point.Footnote 86
Therefore, even though most protest was still nonviolent, by arguing that civil disobedience violated the rule of law and led to more serious lawlessness, it was violent, and thus, criminal. Thus, the counterproject contended that racial struggle, both peaceful and violent, was inherently criminal. But, for racial disorder to successfully be attached to criminality, a second supporting idea was required.
Just as important as what conservative strategists associated with racial discord, is what they disassociated from it. In order to discredit the idea that violent racial struggle was an outcome of social conditions, conservative strategists became preoccupied with showing that racial discord was neither motivated by police brutality nor did its origins emanate from racial discrimination; rather, it was criminality, pure and simple. For example, though looting was a form of protest, usually targeting discriminatory businesses, looters were depicted as criminals who pursued their loot in a “holiday spirit.” Even while the National Commission on Civil Disorders reported findings that most racial disorders were instigated by confrontations between the local community and police and/or alleged excessive police force, many legislators and public commentators construed them as being perpetrated by professional agitators, Communist Party affiliates, and self-serving looters, hoodlums, and criminals. According to one “top authority,” Los Angeles Police Chief William Parker, the “police brutality” allegations were a “terribly vicious canard which is used to conceal Negro criminality … to try to find someone else to blame for their crimes.”Footnote 87 In his statement before the Crime Commission, J. Edgar Hoover, the highest ranked U.S. law enforcement official, dismissed police brutality as part of a communist campaign, stating that the “net effect of the charge of ‘police brutality’ is to provoke and encourage mob action and violence by developing contempt for constituted authority.”Footnote 88 Indeed, Hoover's report on the 1964 riots concluded that, because civil rights agencies had not received formal complaints prior to the riots, they could not have been sparked by racial discrimination or police misconduct and went on to applaud the police for performing very well.Footnote 89
They also refuted arguments that riots were outbreaks against impoverished conditions. If poverty were the cause, they argued, then why were the cities that were the best for blacks being victimized? This sentiment was echoed frequently. As Senator Robert Byrd (D–WV) argued:
So, Mr. President, … [p]overty neither provides a license for laziness nor for lawlessness. We can take the people out of the slums, but we cannot take the slums out of the people. Wherever some people go, the ratholes will follow … . All the housing and all the welfare programs conceivable, will not stop the riots or do away with the slums.Footnote 90
Nor was racial discrimination a factor. After Watts, California Governor Edmund G. Brown declared: “The riot had no connection with whether a Negro has the right to vote or a legal right to any job for which he can qualify. We have established these things in California.”Footnote 91 The McCone Commission, charged with analyzing the causes of the Watts riot, blamed the rioting on blacks, calling it a “formless, quite senseless” explosion and denied any role of the police in the agitation.Footnote 92 According to one Evening Star editorial, “A man who makes a firebomb and throws it through a shop window is not doing it because his grandfather was a slave . … Those who openly advocate wanton acts should be severely punished.”Footnote 93 Others argued that police actions were legitimate responses to the behavior of black residents; for instance, Senator Byrd said that “If they [blacks] conduct themselves in an orderly way, they will not have to worry about police brutality.”Footnote 94 Surveys of public opinion demonstrate that this campaign to disassociate police actions from racial unrest was very successful: a mere 13 percent of the public believed “police brutality” was a cause of the riots.Footnote 95
A third image in the frontlash strategists' toolkit was focused on enlisting popular rights-language to their cause. Politicians counterbalanced civil rights claims with criminal justice. The focus on civil rights had gone too far, the argument went, and was permitting the rights of society from protection against criminals and agitators to be sacrificed. For example, in a letter to President Johnson, Representative L. Mendel Rivers (D–SC) noted: “The Nation cries out for leadership; fear permeates the air; insurrections runs rampant; law and order is on the verge of total collapse. … Now is the time to speak of obligations—not rights.” Footnote 96 Pitting the priorities of crime and civil rights against each other, another advocate, Georgia Governor Lester Maddox, wired the president in 1967:
I advised you on numerous occasions starting in early 1964 that national legislation … would bring waves of violence, burning, looting, injury and violent death … Please do not urge additional legislation that strikes down the right to private property, free enterprise … . Please offer no more programs that are nothing more than attempted bribes to buy law and order and good behavior.Footnote 97
To symbolize the priority of crime over civil rights, Representative Craig Hosmer (R–CA), introduced a proposed constitutional amendment: “The right of society in general and individual persons in particular to be protected from crimes against person and property shall be paramount to other rights.”Footnote 98 In 1968, Richard Nixon would proclaim that the “first civil right” was the “right to be free from violence.”Footnote 99
Politicians linked civil rights and crime through implicit appeals. Although they avoided explicitly racist exhortations about racial integration breeding crime, they associated the problem of crime with racial change, radicalism, and civil rights demonstrations. Republican leader of the House Gerald Ford gave an emphatic statement to the press:
The War at home—the war against crime—is being lost … . The homes and the streets of America are no longer safe for our people. This is a frightful situation … . The Republicans in Congress demand that this Administration take the action required to protect our people in their homes, on the streets, at their jobs … . When a Rap Brown and a Stokely Carmichael are allowed to run loose, to threaten law-abiding Americans with injury and death, it's time to slam the door on them and any like them—and slam it hard!Footnote 100
Seeking issue dominance, conservative entrepreneurs presented a set of ideas around the crime problem favorable to their goals: there was a growing tide of lawlessness; civil disobedience led to violent riots; riots were not a legitimate grievance but were criminal acts; the right of society to be free from criminals was above rights of protesters (who were criminal); therefore, we need more punishment. This issue framing was sanitized from collapsed logics of segregation and superiority, while putting forward a coherent statement of why the old root causes position was part of the new problem.
So, like its antecedent in civil rights debates, crime was linked to civil rights. But this time argument not to oppose civil rights but to proactively call for law enforcement. From 1965 to 1969, nearly 100 pieces of legislation made participating in a riot a federal offense with stiff penalties.Footnote 101 The 1968 Omnibus Crime Control and Safe Streets Act made it a felony to cross state lines with the intent of inciting or taking part in a riot; another provision banned people convicted of a riot-related felony from federal employment and from receiving federal money.Footnote 102 The 1967 District of Columbia Crime Bill also contained an anti-riot provision that gave penalties of up to five years imprisonment and fines of up to $10,000 for engaging in, inciting, or encouraging others to participate in a riot.Footnote 103 In addition to numerous crime-related bills, riot-related penalties and provisions also surfaced as riders to civil rights bills, including the 1966 and 1968 Civil Rights Acts. For example, the liberal open housing law of 1968 contained a tacked on antiriot bill (sponsored by Representatives Strom Thurmond [R–SC] and Frank J. Lausche [D–OH]), or the “H. Rap Brown bill,” as it was termed after the Black Power leader.Footnote 104 Congress included antiriot provisions in several other bills unrelated to crime that banned students and federal employees convicted of riot offenses from receiving federal money. Even a “routine postal salary bill” contained provisions banning from federal employment any person convicted of an offense related to a riot or civil disorder.Footnote 105 Similarly, at least twenty states revised their criminal codes to include riot offenses, with most carrying prison sentences.Footnote 106 In 1969 alone, state legislatures proposed more than 100 separate riot-related bills.Footnote 107
The Liberal Dilemma
The conservative countermovement thus presented a coherent problem definition based on depoliticizing and criminalizing the riots and racializing crime. This set of images created political traps for liberals. As they had in civil rights debates, liberal voices recognized the strategy of linking civil rights agendas to the problem of crime and tried to expose its racial character. The Washington Post headline characterized the allegation of liberals and black leaders: “‘Crime in Streets’ is Called Slogan to Curb Negroes.”Footnote 108 Attorney General Nicholas Katzenbach was wary of the public hysteria that was being created around increasing crime statistics and their implied connection to the violent destruction being depicted on televisions throughout the country:
The [Civil Rights] Act, they say, has encouraged disrespect for the law in other parts of the country. Thus, a link is drawn between demonstrations for civil rights and crime in the streets. Riots in Harlem, or Rochester, or Philadelphia, are tied to rising crime rates.Footnote 109
Presidential candidate Hubert Humphrey similarly argued:
Segregationists and some white conservatives use the riots as an excuse not to take the action for racial justice that they do not support anyway. They are very much afraid we will “reward the rioters,” as they say … . Ever since Watts, and particularly since Detroit and Newark, the discussion of equal rights has been distorted and sometimes even sidetracked by the very different issues of riots and civil disorders, of “crime in the streets' and ‘law and order.” … It is dangerous nonsense to believe that social progress and a respect for law are somehow in opposition to each other.Footnote 110
However, because the new conservative doctrine had worked vociferously to conflate crime and civil disobedience, with its obvious extensions to civil rights, liberals were forced to walk a tightrope. The liberal position was wedged in a trap—either refute the conservative paradigm, arguing that riots were legitimate expressions of deplorable inner-city conditions, which risked the appearance of sanctioning violence and doing permanent damage to the civil rights agenda, or seek to avoid blame for the riots by presenting a strong case for their distinction from civil rights protest. They pursued the latter strategy.
Liberals tried to project the message that riots were not part of a legitimate articulation of racial discrimination, for fear that the violent nature would hurt their civil rights agenda and create a backlash among previously supportive groups of whites. Black leaders submitted a collective statement printed in the New York Times in 1964 distinguishing between rioting and “legitimate protest.”Footnote 111 In 1966, another group of nationally prominent black leaders, including A. Philip Randolph, Dorothy Height, Bayard Rustin, Roy Wilkins, and Whitney Young, Jr. published a statement in the New York Times repudiating violence while endorsing criticism of poor conditions in the ghettos.Footnote 112 LeRoy Collins, formerly the head of the Community Relations Service of the DOJ, also tried to distinguish riots and protest: “We don't want to associate civil rights with this kind of lawlessness.”Footnote 113 And Attorney General Nicholas Katzenbach: “To call them [riots] ‘racial’ problems is not a solution but a slogan. What is worse, it is wrong.”Footnote 114 President Johnson put the point more bluntly: “A rioter with a Molotov cocktail is not fighting for civil rights any more than a Klansman with a sheet on his back and a mask on his face.”Footnote 115 By making these claims, liberals implicitly argued that the urban violence was not part of a larger social ill and that riot participants were common criminals, confirming the conservative claim.
The conservatives had offered an uncompromising position on crime and lawlessness. In contrast, the liberal alternative was to mix the call for law enforcement with more sobering pleas for social uplift. At a meeting called “Order and Justice” in September 1968, one participant characterized the conundrum: “We can't compete with Nixon and Wallace on law and order. But we're going too far on the justice emphasis. Let's emphasize order and justice.”Footnote 116 Ultimately, this emerged as the liberal alternative in an attempt to counter the popular conservative slogan with their own moniker—“law and order with justice,” an ambiguous position that tried to serve two masters. Liberal leaders tread this thin distinction, arguing that while we must act against violence and “put down” riots, there must also be consideration for continued progressive measures toward equality and programs to lessen unemployment and poverty. This message was not easily accessible to the public and stood in stark contrast to the seamless conservative message. The incoherent position left liberals precariously straddled across two sides that were increasingly polarizing. Conservative Republicans and southern Democrats attacked this alternative with the appeal that liberal politicians were permitting criminality to flourish under the guise of poverty and disenfranchisement, camouflaging ordinary crime as dissent, and “pussyfooting” on the issue of crime and riots. Nixon exposed this weakness in his “Toward Freedom from Fear” speech:
There is another attitude that must be discarded if we are to wage an effective national war against this enemy within. That attitude is the socially suicidal tendency—on the part of many public men—to excuse crime and sympathize with criminal because of past grievances the criminal may have against society.Footnote 117
Republicans launched a harsh criticism of the Democrats in their 1968 pamphlet entitled “Crime and Delinquency—A Republican Response.” Among the many criticisms, one of their strongest was against the Great Society approach: “The Johnson-Humphrey Administration has proposed its standard ‘great society’ answer to the problem—Federal money and Federal controls … but too many factors indicate that improved economic and social conditions alone will not reduce crime.”Footnote 118
Had the crime problem not been accompanied by riots and racial unrest, a root causes approach might have been favored, as the direction of the 1950s suggested, and the crime-race argument that racial conservatives employed would have been easily exposed as a racial ruse. Wracked by riots, the terrain had become hostile to the liberal root causes position—or, as Hoover maintained, society was “beginning to gag on the steady sociological diet of excusing the conduct of teenage hoodlums because ‘society has failed them’.”Footnote 119 The Democrats were split between holding fast to this position and moving rightward, while conservatives were unified. As civil rights was increasingly tied to criminality, the costs of defending civil rights and claiming poverty and unemployment as causes of riots was becoming clearly felt. Liberals engaged in strategic agreement, endorsing the conservative issue definition and policy program (see Figure 6).
Democratic Party Agenda on Civil Rights and Crime.

Ultimately, liberals betrayed their early solidaristic calls for social reform and warring on poverty and, by the end of the 1960s, they began downplaying underlying causes, arguing instead for more gun control. Not in small part due to several defeats—Democrats had lost 12 million voters between 1964 and 1968—the early emphasis on poverty and social conditions faded. By 1968, Democrats had aligned themselves with the “law and order” program and were trying desperately to mimic the Republicans. The Democratic platforms during this time period demonstrate how increasingly indistinguishable their position was from the Republicans. The Democratic platform in 1956 contained a mere three sentences on law enforcement; the 1960 platform included only one additional sentence (dealing specifically with organized crime). By the next election, the issue was beginning to rise in importance: “We cannot and will not tolerate lawlessness. We can and will seek to eliminate its economic and social causes.” While crime is no longer ignored, the platform also firmly set out the idea that through eradicating poverty, crime would likewise diminish. The only mention of stricter punishments was focused on the unlawful behavior of employers who discriminate. The 1964 platform highlighted two pieces of legislation—the Juvenile Delinquency and Youth Offenses Control Act of 1961 and the Criminal Justice Act of 1964—that were aimed at preventing youth crime and making sure poor people were adequately represented in court, respectively. By 1968, the Democratic Party was clearly beginning to recognize the costs of being seen as supporting lawbreakers and the root causes commitment had faded. The program included a much fortified discussion on the problem of crime and strong critique of dissenters who use violence and pledged a “vigorous and sustained campaign against lawlessness in all its forms.” Meanwhile, Robert Kennedy campaigned for the Indiana primary by voicing his opposition to crime and Humphrey sought the Minnesota primary on law and order.
By the 1970s, the root causes argument had been eliminated in favor of echoing and reinforcing the connection between crime and civil rights, rendering Democrats virtually indistinguishable from their conservative counterparts. For one example, Senator Ted Kennedy (D–MA) echoed the conservative line: “Along with the civil right to vote, go to school, and have a job is the right not to be mugged, robbed, or assaulted.”Footnote 120 Polls suggest that, by 1970, people viewed the two political parties as roughly equivalent on crime control. In response to one Gallop survey question on the issue—“which party—the Republican or the Democratic—do you think can do the better job of dealing with crime and lawlessness?”—the majority of respondents saw no difference or had no opinion (44 and 11 percent, respectively), while only 4 percent more respondents believed the Republican Party would do a better job on crime than the Democratic Party (24 and 20 percent, respectively).Footnote 121
When policy images are accepted and one side develops a monopoly on the understanding of an issue, they constrain the policy choices available. In the next section, I offer a detailed account of the way the problem definition and process of strategic pursuit manifested itself in crime laws. Not only did the liberal approach begin to come apart at the seams, administration proposals would again and again collide into a conservative-controlled committee. Constrained by public opinion, many liberals in Congress admitted to voting for some legislation to prevent other, more punitive legislation from passing.
Establishing a Monopoly: The Ascendance of Law and Order
After the “long, hot summer” of 1967, where riots occurred in 120 cities, it seemed the “Great Society” had given way to lawlessness. By the end of that summer, there had been at least 150 violent racial disorders spread across 128 cities, resulting in 118 dead, 4,000 injured, about 10,000 arrests, and millions of dollars of property damage.Footnote 122 The National Guard had been mobilized twenty-three times and on one occasion U.S. Army troops were deployed. Many perceived the nation as gripped in a state of rebellion (Figure 7).
At the same time, the public believed they were beleaguered by crime. Crime and lawlessness was the top issue to the public in 1968 for the first time since the 1930s, according to the Gallup poll, and about half of the public believed crime was increasing (compared to only 3 percent who said decreasing).Footnote 123 The next year, 88 percent of people felt that the problem of “crime in the streets” should have a “great deal of attention paid to it (Figure 7).
Law and Order postage stamp.

By the time the National Advisory Commission on Civil Disorders (commonly known as the Kerner Commission) issued its report in 1968, the “end poverty and discrimination” appeal fell on deaf ears. Not only was it no longer an approach to crime and an excuse for permissiveness, some in Congress argued that further aid to ghettoes would capitulate to the riots; many assistance programs were cut including the rent supplement program, or dwindled down like the Model Cities program. The Kerner Report warned that without social reform, the riots would only get uglier and incorporate mainstream blacks.Footnote 125 One of its authors, New York City Mayor John Lindsay warned: “The only certain change will be that next summer, all of it will be worse—more festering, more inflamed, and infinitely more perilous.”Footnote 126 The Kerner Report was heavily criticized for blaming mobs and violence on white racism. Conservatives in the Senate Committee on Government Operations introduced a resolution to conduct their own investigation of “crime and lawlessness” sponsored by John McClellan:
Although the committee recognizes and commends the action taken by the President in appointing a Special Advisory Commission on Civil Disorders, it is the consensus of the Rules Committee members that the spate of riots and civil disturbances which have occurred throughout the Nation during the last few weeks places a corollary responsibility on the Senate to conduct its own investigation.Footnote 127
There were still those who argued that an attack on poverty was the means through which crime should be thwarted, but they were now in the minority. John Sherman Cooper (R–KY) proposed an amendment (which was ultimately rejected) to the Senate resolution to incorporate a “study and investigate the extent to which economic or social causes have bearing on such disorders, the community attitudes toward such causes,” and urging the other senators to “consider also their grievances, their conditions, and that the Congress intends to move urgently to correct them.”Footnote 128 Southerners held key positions on both the District of Columbia Crime Committee and the Judiciary Committee and conservatives dominated the Senate Subcommittee on Criminal Procedure, which was chaired by John McClellan. Ramsey Clark noted that McClellan was “so terribly strategically located”:
He was chairman of the Subcommittee in Judiciary, the second ranking man on the Judiciary, had the complete support of the chairman, Senator Eastland. He was also the chairman of our Appropriations Subcommittee so that literally on occasion we would adjourn a subcommittee meeting on the authorization … and Senator McClellan wouldn't even get up out of his seat.Footnote 129
Realizing that the riots were costing him votes, several of Johnson's advisors pushed the president to “start acting less like a social worker and more like a cop.”Footnote 130 However, they also saw the potentially disastrous consequences of promising the public more than it could deliver on crime and riots: “it is very important not to identify crime as a Presidential problem but as a local problem he is helping Governors and Mayors to solve … . So let's not do anything to raise crime's rating as a national problem.”Footnote 131 Turning his back on recommendations from Warren Christopher and Ramsey Clark, Johnson instructed Joe Califano to include a riot bill in his upcoming crime message.Footnote 132 In the message, he said that the law would “give the federal government the power to act against those who might move around the country, inciting and joining in the terror riots.”Footnote 133 Realizing that he could no longer politically afford to decouple crime and civil rights, Johnson also changed his line dramatically in his 1968 State of the Union speech—“The American people … [h]ave had enough of rising crime and lawlessness”—and the loudest applause from the audience came in parts that attacked crime.Footnote 134 In his message to Congress requesting action on the Safe Streets bill, he had abandoned the poverty approach for more “immediate solutions to the rising crime rate that will help us maintain order.”Footnote 135
The negotiation and passage of two major bills exemplifies the escalating punitiveness. The first “immediate solution” was the Omnibus District of Columbia Crime bill. Efforts to get a bill passed on crime in the District began in 1958. There had been excessive attention to crime in the District for years; described as a “sick city,” it dominated news accounts of crime: “‘latchkey’ kids who know no family restraint roam the midnight streets, yoking (mugging), beating, and gang-raping.”Footnote 136 Ramsey Clark and others believed this attention to have motivations above the crime rate, saying that “people always liked to focus on the nation's capital as a crime center” even though “the statistics never supported it” because “it was really a continuation of the old southern belief that the blacks were incapable of self-government.”Footnote 137
Passed in 1967, it included warrantless arrests for misdemeanors, investigative detention with no charges or Mirandizing (allowing police interrogation of people not charged with a crime), imposed strict mandatory penalties, and prison sentences for inciting to riot. The conservative-dominated District of Columbia crime committees in the House and Senate deleted provisions related to gun control, drug treatment, and rehabilitation, and revised the penal code to include mandatory sentences for certain offenses. This bill attempted to undercut the Supreme Court's Mallory decision by ensuring the admissibility of confessions made in a three-hour investigative detention (the Mallory rule excluded confessions obtained by delaying arraignment). President Johnson vetoed the bill with reservations over detention and the mandatory minimums.
In February 1967, the commission established by Johnson in the 1965 LEAA to study the priorities in criminal justice reform issued its report, The Challenge of Crime in a Free Society. The commission found “far more crime than ever is reported,” and advocated federal aid to local police of “several hundred million dollars annually.” Based on this report and its 200 recommendations, Johnson requested from Congress the “most comprehensive set of anti-crime proposals ever sent by a President to Congress,” which implemented the recommendations of the report and included a mix of expansive federal gun control legislation, provisions for aid to state innovation in criminal justice, and prisoner rehabilitation. Aides had warned against the move to further “federalize” the crime problem; the Director of Johnson's Crime Commission, James Vorenberg, sent a message to Joe Califano where he strongly admonished restraint: “the ‘safe streets’ approach runs the risk of the President and the federal government appearing to take very direct responsibility for eliminating or reducing crime on the streets.”Footnote 138
Although President Johnson's proposed legislation left the House Judiciary Committee with little modification, once on the Floor, the bill was dramatically rewritten by a Republican and Southern Democratic coalition through a series of amendments debated over the course of three days. The Senate did the House one better, foisting even more provisions that were anathema to the president's 22-point program and even attempting to rename the bill. These revisions gave extra funds with the “highest priority” of funds earmarked for riots and civil disorders, reassigned control of funds from the Attorney General to state governors, and expanded the power of electronic surveillance, overriding Johnson's strong belief that wiretapping should only be used in cases related to national security. The two bills were squared in the conference committee, with conservative John McClellan, the Senate sponsor, ultimately triumphing.
The conservatives who controlled crime-related committees influenced nearly every facet of the Safe Streets Act in ways that benefited their aims. One journalist and expert on crime legislation during the 1960s noted that while the conservative coalition usually “exercises negative control, and merely votes down bills, or parts of bills, that it dislikes,” the crime issue provided “an opportunity to exercise positive control, both in the Senate and in the House of Representatives.”Footnote 139 The conservative coalition made sure that the crime legislation would be immune from civil rights challenge and wouldn't get into the hands of those sympathetic to civil rights, teaming up on several key roll call votes.Footnote 140 First, they amended the law to make sure that disbursement of funds was not based on compliance with the condition of the Civil Rights Act in Title VI, which gave the federal government power to withhold funds from agencies that were racially discriminatory.Footnote 141 They also objected to the grants being administered by the attorney general for fear that he would enforce racial guidelines on local governments. In the Senate hearings on the bill, McClellan grilled Ramsey Clark over his potential authority to require recipient agencies to be racially inclusive. When Clark answered that the Civil Rights Act would indeed apply and that discriminatory law enforcement agencies would be in violation, Senator Thurmond interrupted:
I gave you the illustration that now HEW is trying to get schools to haul children from one place to another specifically to bring up the racial balance in schools. I am asking you here under this bill, coupled with Title VI of the civil rights act, would your director have the right to withhold funds if he wanted a racial balance brought into the personnel of the police department … ?Footnote 142
Title I of the resulting act created a three-person LEAA to administer the grants and stipulated that the LEAA could not require that grant recipients had a racially balanced police force. This dictum was not merely symbolic; some states including Alabama and Mississippi still prohibited blacks from being employed as state police.Footnote 143 Second, they changed the federally administered local grants into state block grants, in one of the most controversial and hotly debated provisions of the bill. The administration's bill had originally designed the grants to go directly to cities and local agencies with populations over 50,000 but House Republicans Everett Dirksen (R–IL) and Gerald Ford (R–MI) proposed to change the structure to block grants to be given directly to states. It was understood that if the money went to cities, agencies controlled by liberal Democrats and blacks in city government would administer it. Alternatively, if the money was channeled through at the state level, governors would have discretion over how the money was used and the majority of governors were ideologically conservative.Footnote 144 Republicans and southern Democrats argued vociferously for the block grant amendment, upholding the tradition of attaching local control to federal funding that often resulted in racially discriminatory administration.Footnote 145 Third, the act barred LEAA funds from going to any agency that had ties to the anti-poverty agency, the Office of Economic Opportunity (OEO), an agency criticized for being complicit in the riots.Footnote 146 The above are powerful examples of how the conservative coalition used a pet project—crime—to advance the cornerstones of their prior agenda on civil rights.
Attention to racial disorders figured prominently in the protracted debates around the crime bill:
I do know that our courts and our national leadership has placed too much emphasis on minority rights without regard to the fact that society collectively also has rights … . I am charging the officials at Justice with ignoring their responsibility to society and to the American people in order not to offend certain minority groups.Footnote 147
McClellan and other anti-civil rights legislators had not yet forgiven the Court for disturbing its Jim Crow practices; in a direct example of frontlash, they submitted several provisions to curb the Court. Senator Ted Kennedy implored his colleagues in a close vote on Title II, the provision that would nullify the Court's rulings expanding defendant rights (Miranda, Mallory, and Wade):
For it is these keystones in our tradition of ordered liberty which are threatened here today. They are threatened because other Americans want revenge against a Constitution and a Court which denounced prejudice and discrimination in large segments of American life … . It is ironic that those who rail the loudest about obedience to law as an unshakable absolute, those who inveigh against civil disobedience in all its forms should be in the forefront of an effort to violate the Constitution and rob the Supreme Court of its power …Footnote 148
While the debates on Safe Streets were going on, the House passed a bill to punish people involved in the riots. The bill was introduced by Representative William Cramer (R–FL), who had originally tried to pass riot penalties as an amendment to the failed 1966 Civil Rights Act. Emmanuel Celler (D–NY) proposed to combine the antiriot legislation with another bill that was to ensure protection of civil rights workers, which had originally been part of the Civil Rights Act of 1966.Footnote 149 Despite it being an uncontroversial provision in 1966, the bill ultimately failed after arch-segregationist William Colmer (D–MS) argued against the combination because he believed the civil rights protection would make the riot punishment futile. Some in Congress objected to the racial connotations of the antiriot bill; William F. Ryan (D–NY) believed the legislation was motivated by the same “white backlash” as that that killed the Civil Rights Act of 1966; Frank Thompson Jr. (D–NJ) argued that the bill was for sole purpose of stopping Stokely Carmichael, the black power leader.Footnote 150 Despite the fact that the Commission on Civil Disorders found no evidence of a communist conspiracy, the riots were connected to communism and outside “professional” agitators and antipoverty workers. The DOJ's own video “Riotmakers: The Technology of Social Demolition” explained the riots of the 1960s as being coordinated by professional agitators, which were dubbed “Leninoids.” In his statement for the bill, Cramer presented the accounts of officials in cities that had had riots, which alleged the influence and participation of outside agitators; Colmer also claimed the riots were an “organized conspiracy … . backed by the Communists.”Footnote 151 Many argued that the riots were not disjointed events or spontaneous outbreaks to racial bias and police brutality but were part of a conspiracy. In the hearings on anti-riot provisions, Representative Joel Broyhill (D–VA) argued:
These outbreaks of lawlessness … are conceived in the twisted minds of the hate-mongers, a trained cadre of professional agitators who operate in open defiance of law, order, and decency … . Moving among these people, the dregs of our society, these insidious enemies of our democratic form of government preach a cant of hate and contempt for law and order … . They create fear wherever they go, and feed with delight on this fear … . They train other malcontents in the art of destruction…these vultures of our society carry on their nefarious work on funds provided by the very tax-payers whose lives and property they threaten.Footnote 152
The resulting legislation contained a sprawling definition of a riot; for instance, a riot could consist of a public disturbance of a group of only three people, which effectively meant that large peaceful demonstrations with a scuffle between three bystanders could constitute a riot. This legislation also provided for the prosecution of civil rights leaders.Footnote 153 When Congress passed it, many fully expected it to be overturned by the Supreme Court as an unconstitutional abridgement of the First Amendment protections.
After being debated in committee and Congress for two years and suffering the addition of twenty-five amendments to the original administration proposal, the Safe Streets bill was finally sent to the president to sign on 6 June 1968.Footnote 154 Even opponents of the bill, such as John G. Dow (D–NY) felt compelled by public anxiety over crime and riots to vote for the bill:
This bill, as now amended, I regret exceedingly, and will only vote for it because of the widespread desire of all our people to curb crime and prevent continuation of violence in our land. As the price for this, we are saddled with amendments that threaten our liberties and may remain to haunt us.Footnote 155
Members of Congress referred to the blistering public pressure they faced to crack down. Torrents of constituent mail flowed into their offices, and businesses, nonprofits, and civic organizations lobbied for passage of the crime bill. Democrats had witnessed the departure of several colleagues in the midterm elections in 1966—forty-seven representatives and three senators were voted out of office (in addition to eight governors), some for their vote against a crucial crime bill.Footnote 156 A former member of Congress and the House Judiciary Committee wrote the president urging his veto of Safe Streets: “One of the reasons I am no longer in Congress is because I voted against the D.C. [crime] Bill.”Footnote 157 Now, fourteen liberal Democrats in the Senate were facing an election a few months away where crime was a major campaign theme.
With only seventeen members of the House voting against Safe Streets and only four in the Senate, no federal agency had come out against it, and, with an impending election four months hence, Johnson's hands were tied, even though the bill was unrecognizable from the administration's proposed legislation and did not include any of the recommendations of the crime commission's 18-month study. Although Warren Christopher called the bill “perplexing” and noted that Congress should have given the president a much better bill, he urged the president to “take into account the very large majorities which supported the bill in Congress,” who threatened to override a veto.Footnote 158 Johnson reluctantly signed it five hours before the deadline saying it contained “more good than bad” and with a request that the Congress remove the electronic surveillance provisions.Footnote 159 Most legislators and journalists saw it as a capitulation to public hysteria.Footnote 160 Another aide, Harry McPherson, wrote in a memo to the president that it was “the worst bill you have signed since you took office.”Footnote 161
The resulting law, 134 pages in length, was the “most extensive federal anti-crime measure in the nation's history.”Footnote 162 Safe Streets, which began in a 1965 request from the president for funds for training local law enforcement through categorical grants, gun control, right to privacy (limiting wiretapping), drug control, and agency reorganization, was transformed into a radically different bill before passing in 1968. The 1968 act overturned three major Supreme Court rulings relating to defendants' rights, removed the federal courts' ability to review state court rulings on voluntary confessions, made a huge investment in riot control, and dramatically expanded law enforcement's powers relating to wiretapping.Footnote 163 Much of the gun control legislation requested by Johnson was either not acted on or watered down significantly. In short, this bill had become a “vehicle for ‘law enforcement’ rather than ‘criminal justice’ in its journey through the legislature.”Footnote 164 Street crime and riots were folded into same crime package. It was as much about political dissidents and racial conflict in the cities as it was about ordinary crime, perhaps more so. In the first month, $4 million was disbursed to forty states for riot prevention and control.Footnote 165
Most importantly, under Safe Streets, the federal government would disperse millions of dollars in aid to state law enforcement, the first piece of major legislation to implement block grants and the revenue sharing concept. It was only the second program of federal assistance to the states designated for crime control (with ancestral ties to the first (OLEA), established three years earlier and expired by the passage of Safe Streets). Compared to the 1965 LEAA's appropriation of $10 million, it gave $400 million in the first two years for the state planning grants, with a larger budget in following years.
Despite the accuracy problems of the Uniform Crime Reports, a 1968 effort to create a National Crime Statistics Center failed in Congress.Footnote 166 When Representative Larry Winn, Jr. (R–KS) wrote to the president complimenting his crime package but also voicing the concern that it did not contain anything to “upgrade city and state crime reporting,”Footnote 167 he received a sheepish response from Assistant Attorney General Fred Vinson saying that the Safe Streets Act prohibited the federal government from controlling what the states did with the funds and that it was “in deference to this principle that no positive authorization for crime reporting has been included.”Footnote 168 In 1973, the LEAA initiated the National Crime Survey. Based on victimization rates rather than reported crime, it was designed to get more accurate data on crime. The National Crime Survey actually showed higher crime than the FBI reports (as did most other victim-based reports, including the president's crime commission), but it also demonstrated that the crime rate has been relatively stable over time, whereas the FBI reports showed a rapid increase in crime in the 1960s and early 1970s.Footnote 169
If the support for punishment was unrelated to race, then we should expect conservatives to be pushing for stricter punishments for all types of violence and criminal activity. The near universal support for more aggressive criminal justice from the conservative coalition was not extended in one area. They tried to exclude criminal penalties for violations of federally-protected civil rights on account of race (H.R. 2516 and S. 1362 “Interference with Civil Rights Plus Criminal Legislation”). Thus, criminal justice punitiveness cohered more along racial lines; indeed, as the next section discusses, the racialized crime innovations were also bound up with an attack on civil rights legislation, the poverty programs of the Great Society, and Supreme Court decisions.
The Scapegoat: Civil Rights
Criminal justice policies were not the only arena affected by the fusion of crime and civil rights; several Civil Rights bills suffered defeat on the justification that they would be seen as rewarding riots and criminality. Consider the memo of one Johnson aide passing on the sentiments of Representative Bill Hungate (D–MO), a member of the Judiciary Committee:
[T]he Civil Rights Bill will not pass in anything like its present form; the feeling on the floor is that we have given enough to Civil Rights workers who have just been stirring up trouble; that the bill could not have come to the floor at a worse time.Footnote 170
Indeed, after 1965, Congress' civil rights agenda slowed considerably. More of the Kerner Report's recommendations on law enforcement were implemented than its vast program for reducing deprivation in the cities. Crime became an excuse for not expanding civil rights and social justice. Civil rights and crime were inversely related on agenda; as action on civil rights withered, criminal justice was expanded.
The focus on violence had predictable effects, spilling over into discussions of civil rights. As racial disorders spread throughout cities across the country, civil rights related agencies and court decisions came under attack for being complicit in the disorder, in the strong version, and for indirectly aiding racial disorder by giving in to the early demands of “agitators,” in the more discreet account. In the 1967 debates over extending the Office of Economic Opportunity, one of the primary arguments against it was that poverty programs were connected to black insurgency and lawlessness. Representative Paul Fino (R–NY) maintained:
There is little doubt that the Office of Economic Opportunity has been at the bottom of much of the rioting and troublemaking which we have sadly witnessed in the past few years throughout this country … . It has hired muggers and criminals. It has subsidized revolution and social agitation.Footnote 171
In the 1967 congressional debates over passing the anti-riot act, law enforcement officers from various cities testified that antipoverty workers had participated in the riots; indeed, one accused the OEO of giving a grant of $7,700 to a leader of the riots in Nashville.Footnote 172 Some, such as Representative William Chappell (D–FL), identified the earlier “permissiveness” of the Supreme Court as a key cause behind the riots: “But when the courts ruled that certain disruptive marches were in order because of their own sense of social reform, the destruction and riots that followed must be laid at the judicial doorstep.”Footnote 173
In the final section of this article, I show how the conservative policy monopoly expanded and the new paradigm was further enshrined in crime legislation.
Continuing to Get Tough and “Combat Lawlessness”: The Nixon Years
After the assassination of Martin Luther King, Jr., in April 1968, 142 cities across the U.S. erupted in racial confrontations, resulting in 43 deaths and 27,000 arrests.Footnote 174 The District of Columbia witnessed arguably the most severe violence: property damage included 1,200 buildings and homes torched, while the human toll included 12 dead, 1,200 injured, and 7,600 arrested.Footnote 175 Hoover's monthly crime clocks in the Uniform Crime Reports depicted an epidemic (Figure 8).
Time magazine cartoon from October 4, 1968.
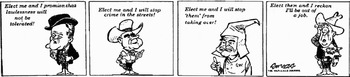
Presidential candidate Richard Nixon launched a frontal assault on Johnson's approach by saying the crime rate would decrease more by doubling convictions than quadrupling the war on poverty and that now was the time to start doing something concrete rather than studying crime with more commissions. Nixon released a position paper titled Toward Freedom from Fear, countering the root causes paradigm: “We cannot explain away crime in this country by charging it off to poverty.”Footnote 176 Law and order was the centerpiece of the Nixon campaign, having learned much from Ronald Reagan's successful deployment of the law and order theme in the 1966 California gubernatorial election. In the course of the 1968 presidential campaign, Nixon dedicated seventeen speeches solely to the topic of law and order. One televised campaign advertisement began with frightening music accompanied by quickly flashing pictures of protesters, violence, bloodied victims, and mayhem. An authoritative voice followed, saying:
It is time for an honest look at the problem of order in the United States. Dissent is a necessary ingredient of change, but in a system of government that provides for peaceful change, there is no cause that justifies resort to violence. Let us recognize that the first right of every American is to be free from domestic violence. So I pledge to you, we shall have order in the United States.
At the end a caption read: “This time … vote like your whole world depended on it . . NIXON.”Footnote 177 While sanitized from the outright racism of the Goldwater and Wallace campaigns, Nixon's strategy was based on the linkages between racial conflict and lawlessness; indeed, in viewing his own campaign ad, he remarked triumphantly that it “hits it right on the nose. It's all about law and order and the damn Negro-Puerto Rican groups out there'.”Footnote 178
Hubert Humphrey's campaign tried to respond, toughening their approach. Humphrey accepted the Democratic party's nomination in 1968 by saying “rioting, burning, sniping, mugging, traffic in narcotics, and disregard for law are the advance guard of anarchy, and they must and they will be stopped.”Footnote 179
With the mandate of the “law and order” election behind him, the Nixon administration submitted twenty pieces of anti-crime legislation (including pretrial detention) and issued a memo declaring the DOJ's right to use electronic surveillance on any subversive group without getting permission from the courts. Nixon continued the tradition of his predecessor to make speeches and messages on crime. However, unlike Johnson, who rarely deplored lawlessness without also mentioning the squalor of poverty in the cities, Nixon blamed crime on permissiveness—of society, of parents, and of the courts. Fear was prominent in his speeches:
If we allow it to happen, then the city jungle will cease to be a metaphor. It will become a barbaric reality, and the brutal society that now flourishes in the core cities of America will annex the affluent suburbs.Footnote 180
In 1969, the National Commission on the Causes and Prevention of Violence (commonly known as the Eisenhower commission) issued their final report To Establish Justice, To Insure Domestic Tranquility. Containing a mixture of solutions, it painted a picture of what the future city would be like if the problem of violent crime continued:
armed citizen volunteers in cars will supplement inadequate police patrols … . High-speed, patrolled expressways will be sanitized corridors connecting safe areas … . Armed guards will “ride shotgun” on all forms of public transportation … . The ghetto slum neighborhoods will be places of terror with widespread crime, perhaps entirely out of police control during night-time hours.Footnote 181
If Johnson took the federal government's role in crime control from zero to a hundred in scale, Nixon took it from one side of spectrum to the other in approach. Crime control during the Nixon administration continued the tradition of expanding federal involvement with more state power over the administration of funds, and both of these along with a more tough orientation to crime, law enforcement, and criminal justice. Based on Nixon's request, Congress quadrupled appropriations for the LEAA, going from $59 million in 1969 to $268 million in 1970.Footnote 182 Nixon declared drug abuse the most important problem in the United States in 1969 and announced a “War on Heroin,” sending several narcotics bills to Congress concentrated on punishment (rejecting the Commission's report recommending decriminalization). Meanwhile, the Controlled Dangerous Substances Act of 1969 set off a contentious debate over jurisdiction between HEW and DOJ officials over whether drug addiction should be an issue for law enforcement or health. In 1970, Nixon formed the Office of Drug Abuse Law Enforcement (ODALE), creating the crime strike forces that greatly increased policing and surveillance in black communities.
The National Commission on the Causes and Prevention of Violence recommended “a national commitment to double our investment in the administration of justice … a modest price to pay to ‘establish justice’ and ‘insure domestic tranquility’ in this complex and volatile age.”Footnote 183 Ultimately the LEAA would be amended six times and was expanded financially and given more authority over criminal justice at lower levels of government. The initial expenditure for the LEAA went from $10 million in 1965 to $850 million in 1973.Footnote 184
By 1970, the riots had subsided but the war on crime campaign was in full swing and showed no sign of abating. During his campaign, Nixon had focused on crime in the District of Columbia, calling it the “crime capitol of the nation” and a “national laboratory” for his proposals. Despite the fact that it ranked twenty-seventh (of fifty-two large cities) on crime, trailing far behind Denver, Chicago, New York, and others, Nixon submitted an anti-crime bill to Congress specifically concerned with Washington, D.C. The District of Columbia crime bill of 1970 was the “most innovative” and expansive of Nixon's proposed legislation. It was so broad that it was opposed vigorously by conservative Representative Sam Ervin—who had usually led the campaign for punitive crime policies in the Senate—because he thought it unconstitutional: “the Nixon Administration's major contribution to the D.C. Crime Bill was a grab bag of some of the most bizarre and repressive crime-control measures ever proposed to the Congress,” warning that “we must be extremely skeptical of the other administration ‘law and order’ proposals which are also advertised as ‘indispensable’ for crime control.”Footnote 185 The bill mandated five-year sentences for anyone convicted of a second armed offense and allowed life sentences for offenders convicted of a third a felony, extended broad wiretapping authority, established “no knock” policies for police (going directly against the Court's search and seizure rulings), reorganized District Courts (which ultimately doubled felony indictments), allowed juveniles to be tried as adults (resulting in 60 percent of youths going to adult courts), eliminated juvenile jury trials, and allowed “preventive detention” (ultimately, overturning the Bail Reform Act of 1966 to allow people to be held without bail).Footnote 186 The preventive detention proposal was the most controversial, allowing some “dangerous” suspects to be detained for sixty days before conviction. Despite a campaign against it in the Senate by civil libertarians, it passed on the eve of the election. More than just a bill for the District, this legislation “also represented the national crime policy of the Nixon Administration.”Footnote 187
The Eisenhower Commission had originally provided a dual emphasis on unemployment and ghetto conditions. Its report argued that “Warring on poverty, inadequate housing and unemployment, is warring on crime. A civil rights law is a law against crime.”Footnote 188 However, this dual focus was not reflected in policy. While law enforcement was expanding, poverty programs were reduced or eliminated altogether. Law enforcement was the only program that escaped cuts, and actually expanded, in Nixon's budget proposals. There was almost no new civil rights legislation. Impact Cities, a law enforcement program, replaced Model Cities.
When Nixon entered the White House, the crime problem that he had helped to fan, awaited his administration; now he would be in the position of having to make the crime rates go down, or in the words of one journalist, “he was being asked to sit down on the chair that he had scattered tacks on.”Footnote 189 Crime had actually gotten worse since Republicans took over, increasing 25 percent from 1968 to 1970. Under the Omnibus Crime Control and Safe Streets Act of 1968, the Attorney General was “to collect, evaluate, publish and disseminate statistics.”Footnote 190 Using this authority, Nixon's Attorney General, John Mitchell, personally submitted the statistics, putting a different spin on crime increases that would have made the “law and order” policies look bad. J. Edgar Hoover's report on crime statistics was rewritten by Mitchell's public relations staff to show that crime had improved during the Nixon administration in comparison to the Democratic administrations that preceded it. One tactic used to make it seem like crime was decreasing and was much worse during the Johnson years was accomplished by using rate of increase instead of the crime rate. Thus, for instance, in the first three months of 1970, the Uniform Crime Reports showed an increase in crime by 13 percent compared to the first three months of 1969. Mitchell's office revised this statement to say “the rate of increase of violent crimes in the first three months of 1970 slowed by 7 percent in the major cities of the nation—and by 3 percent in the nation as a whole.”Footnote 191 If the Nixon administration could show that its harsh policies were working lower, it could use this in the 1972 election: “By 1971, several aides in both the White House and the Office of Management and Budget (OMB) were regularly prodding LEAA to move faster to provide concrete evidence of a federal impact on crime rates.”Footnote 192 In addition, Nixon pointed to the District crime bill as the reason behind crime drops in the nation's capital during his tenure. The “audit,” conducted by a major contributor to his campaign (Ernst and Ernst) found a decrease in crime of 50 percent.Footnote 193 However, an analysis by the Brookings Institution found that the decrease was due to a change in the value of stolen goods, decreasing the number of crimes classified as burglary or larceny.Footnote 194
Former Attorney General Ramsey Clark warned against the drive for more punitiveness:
Those who stimulate prejudices in public opinion, who appeal to base instincts of fear, who protest their willingness—even desire—to sacrifice freedom on the altar of order add immeasurably to the burdens of achieving excellence in the performance of criminal justice agencies.Footnote 195
Those agreeing with Clark were now in the minority; even liberal Democrats did not talk about civil rights without deploring crime. In the 1969 mayoral and 1970 midterm elections, there was a clear attempt to reposition themselves on the crime issue. The law and order stance had been vindicated in the two preceding elections and crime was still the number one issue among voters, competing only with race relations (arguably, part of the same class of issues). Seeking to suspend the charge of being soft on crime and coddling criminals, many posed in campaign photos with police, and threw their support toward anti-crime legislation formulated by the Nixon administration.Footnote 196 New York City Mayor John Lindsay, having been defeated in the Republican primary, continued the campaign as a Liberal party candidate, stressing that he had increased the police force by 5,000 and promised more if reelected. Relatively unknown candidates with law and order platforms upset elections in several mayoral elections from New York to Minneapolis.
Shortly after the D.C. crime bill, the usual law and order suspects—McClellan, Hruska, and Ervin—sponsored yet another bill. The Organized Crime Control bill, despite its title, actually increased penalties for a wide variety of offenses, most of which were not related to organized crime syndicates at all. It changed criminal procedure, establishing mandatory sentence enhancements for habitual offenders. The template for the habitual offender legislation in the 1970s, it allowed judges to enhance the sentence of a convicted criminal by a mandatory thirty years if the offender had two prior convictions or a first-time offender who had committed a crime deemed by the judge to be “a pattern of criminal conduct” or if the criminal was deemed to be a “dangerous special offender.” Senators Philip Hart and Ted Kennedy proposed that it be amended to apply only to organized crime offenses but the amendment failed. The resulting bill passed in the Senate by a vote of 73 to 1.
The policies passed in these few years did not simply augment state crime control efforts or extend a path already traveled in previous eras. This infusion of federal assistance to state systems of crime control was the first of its kind and the change it wrought cannot be overstated. The LEAA, once a small pilot program initiated by Johnson and his desire to root out the causes of crime and debated in Congress on one single day without opposition, had become a mammoth institution to “combat lawlessness” and resulted in the funding and creation of 80,000 state and local projects. Ironically, the same “states rights diehards” that the Johnson administration worried about offending in passing the LEAA in 1965, came to be the main activists in the war on crime. For the first time, the federal government launched a full scale program of aid to the states with appropriations totaling $7.25 billion, which today translates into approximately $28 billion dollars, however, the cost was probably much greater because of the matching funds required by states. Most of the grant money went to suburbs and rural areas rather than cities, and riot control funds went to hardware (including an armored tank in Birmingham), weapons, teargas, and training (i.e. “riot squads”), rather than police-community relations. LEAA's first report showed the breakdown of how federal funds were distributed: 3.5 percent to crime research; less than 5 percent to police relations with the community; 5.5 percent to improving courts; 8.5 percent to rehabilitation; 22 percent to riot control; and the most, 30 percent, to the police.Footnote 197 The LEAA was given a budget twice the size of the FBI and half of the total DOJ budget; it became the “fastest-growing agency in the federal government” in the 1970s.Footnote 198 Once in place, this legislation and the agencies it spawned were extremely durable and the DOJ's role in crime control would remain to the present, but that is another chapter of the historical development of criminal justice.
Alternatives
If reducing crime was primary goal of legislators, policy instruments were available, including the one that had been favored for the existence of the republic—that crime was a problem for local government and federal involvement would constitute a breach of the democratic impulse against a national police state. Actors had to choose to break with past approaches. The characteristics of policies themselves are inconsistent with the interpretation that a break was an inevitable response to crime passing some unacceptable threshold. The policies initiated and ultimately enacted were not logically connected to the goal of crime control; crime was rising fastest in rural areas, the category of crime increasing most was property-based offenses, and the reasons for the increase ranged from demographic changes from the baby boomers to migration. Several components of the legislation discussed here suggest additional motivations and aims.
The coalition behind the legislation strategically twisted legislation in directions that had more to do with racial ideology. Many obvious examples include exempting Safe Streets from provisions of the Civil Rights Act and barring federal crime program funds from going to the OEO. The crime legislation was purposefully designed so that federal funds would be controlled by state governments, who could in turn distribute funds to localities without any fear of civil rights challenges. Positions on the crime policies cohered more along lines of racial ideology; indeed, debates over crime legislation featured significant attention to race and carried significant implications for racial equality (such as block grants to state governments rather than directly to cities with significant populations of blacks). Votes on key provisions bore striking similarity to the vote breakdowns on civil rights legislation. Votes cast in opposition to open housing, busing, the Civil Rights Act and other measures time and again showed the same divisions as votes for amendments to crime bills. Moreover, those members of Congress who voted against civil rights measures proactively designed crime legislation and aggressively fought for their proposals. And this stance was itself inconsistent with motivation that was purely a conservative ideological stance against crime. For example, the same actors who tried to pass criminal penalties for freedom rides and sit-ins were the major initiators of punitive crime legislation; but they also bitterly opposed a bill for penalties for violence against civil rights workers. Moreover, they pursued policies at odds with what their ideology of limited federal government would dictate. The same group that opposed civil rights legislation on the grounds that it should be left to state control were at the helm of passing federal criminal justice legislation that would extend the federal government's authority. Thus, when the goals of the group defeated on civil rights pointed to a stance of more federal power, they abandoned the states-rights argument. Further, crime did not matter to conservatives until it was clear that it could be used as new currency to reestablish political advantage. Even in the 1960 election with Nixon, a time when crime had been rising substantially, crime is not a subject in campaign speeches. Together, these examples highlight a basic conclusion: it wasn't in their interest to push crime except for race.
Until racial disorder was defined as a crime problem, there was no mobilization on the crime issue and very little policy change. In fact, on at least three prior occasions proposals for federal assistance to local law enforcement had been evaluated, first in the Wickersham Commission's report during the Hoover administration, then a federal aid program was considered 1955 at President Eisenhower's request (to give local governments federal aid to help them deal with juvenile crime), and again in 1961 by the Civil Rights Commission's report to Congress. In all these cases, despite strong endorsement from the administration, opposition to a nationalized police force and a longstanding tradition of local jurisdiction was a check on expansion and the recommendations were rejected. Policy change was a likely outcome when a set of factors converged and were catalyzed by elite goals. The coalition of conservatives who now had a stake in the crime problem, now supported a federal intervention and ensured that it “converged with, and sustained, intense southern provisions.”Footnote 199
Current explanations obscure these political interests, made even more urgent by the loss on several significant pieces of civil rights legislation. So for different reasons, then, each of the frameworks (opposed as they are about the role of crime) miss the political dynamics that led to the transformation of policies and each isolates crime from the racial context and distribution of power in which it came to matter politically. Avoiding a myopic focus on crime rates allows a view of the entire body of considerations that went into the design of criminal justice policies. The theory of frontlash argues that crime was used in the service of reacting to racial dislocations, a strategy that was vindicated by the rising crime rate. Without consideration of elites' strategic preferences, these alternative frameworks cannot explain the sudden mobilization of the crime issue, its momentum, and its connection to the rights revolution. They come up short in explaining why policy disputes over criminal justice formed along racial cleavages or why crime became entangled with racial unrest.
Other alternatives deserve mention; the collapse of the rehabilitation approach and the appetite for punishment among the public have become adages used to explain the punitive doctrine in the U.S. both historically and in comparative perspective. Casual observers to experts of criminology frequently attribute the punitive turn in the United States to the collapse of the “rehabilitative ideal” as an approach to crime. According to this account, two highly visible publications are credited with the reversal of course in criminal justice: Robert Martinson's 1974 essay “What Works?” in the Public Interest and James Q. Wilson's bestselling 1975 book, Thinking about Crime. The former argued that there was no evidence that rehabilitation worked in reducing recidivism, while Wilson's book extended this theme the following year, arguing that the approach to crime should be crime-specific and concerned with manipulating the costs of offending. While these manifestos were extremely influential pieces, they were more likely consequences than causes of the punitive policy changes. Published long after Safe Streets, the District of Columbia crime bill, the Organized Crime Control Act, and key critical policy changes, they were part and parcel of the punitive momentum beginning a decade prior to their publication. This is not to say the arguments they advanced were insignificant; much to the contrary, they likely contributed additional ammunition for the punitive problem framing and helped maintain a course that had already been in motion for several years. But the rehabilitative approach to crime did not “collapse” of its own volition.
Another alternative explanation that is also deeply entrenched in thinking about crime and the “get tough” movement is that the public drove the criminal justice crackdown while legislator's merely responded to public hostility to crime. A full examination of public opinion on crime and criminal justice would demand another analysis and is fraught with problems of inconsistent survey measures during the period of interest. However, a simple exploration of the timing of public opinion shifts on crime provides a crude test of this alternative. Figure 7 depicts the proportion of the public choosing crime as the most important problem in the nation over time; the salience of crime remains low until 1966, after the issue was a key theme in the '64 election and indeed after the first legislative proposals were enacted into law. Similarly, a composite measure of public opinion over time shows public preferences on criminal justice were actually decreasing in punitiveness until turning upward in 1967 (see Figure 9).Footnote 200 Several other scholars echo the finding that public concern with crime is the tail to the kite of elite initiative. Beckett's study finds that public concern with crime is correlated with elite attention and appeals around crime, but not with crime.Footnote 201 The public did not register high levels of crime concern until after Goldwater's campaign appeals and particularly his nomination speech.Footnote 202
Crime Salience and Punitive Attitudes Over Time.
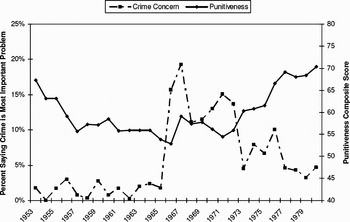
Two scholars located the original output from surveys with crime measures during the 1960s and found that a disturbing number of surveys were blatantly misreported or conflated categories of lawlessness and crime. Moreover, they show how the media selectively reported public polls on crime and surveys were used to manipulate the image that public opinion was favorable. Survey categories represented elite discourse rather than public perception and lumping together categories was an “elite-sponsored social construction.” The concepts of crime and race (civil rights) became related after elite initiative, with the public registering changes after elite discourse. Crime was not the uppermost concern to the public, who until fairly late distinguished race, civil rights, and insurgency from crime; “The press and the public were accustomed to viewing crime in terms of judicial leniency, civilian complaint review boards, interrogation, and capital punishment. They did not understand how crime in the streets and the 1964 summer disorders in Harlem and Philadelphia related to the criminal justice system's lack of financial resources.”Footnote 203
Conclusion
In this article, I have demonstrated the centrality of racial struggle in the political development of criminal justice at the national level. Relying on a rich documentary history, I have shown how the reaction to the success of the civil rights movement became embedded in a separate policy process. Resistance to civil rights was reconstituted in a new policy domain by turning objective conditions into political capital. Changes in the racial status quo, and not simply rising crime, were an important and overlooked factor, and in its strongest version—punitive criminal justice was part of the price of civil rights liberalizations. The transformation of criminal justice was not merely an exercise in crime fighting; it both responded to and moved the agenda on civil rights. Rather than a temporal coincidence, the graveyard of civil rights legislation was the same place where crime bills were born. Much of the legislative activity on crime came out of the same hand that fed the early opposition to civil rights, leaving their mark on public policies long after the riots and demonstrations ended. Through a frontlash, rivals of civil rights progress defined racial discord as criminal and argued that crime legislation would be a panacea to racial unrest. This strategy both imbued crime with race and depoliticized racial struggle, a formula which foreclosed earlier “root causes” alternatives. Viewed in this way, the truism that a crime wave was the cause of legislative activism on penal reform becomes problematic. Punitive crime policies were borne of racial struggle; violence was only one part of a larger, more complex set of factors placing crime on the agenda and ultimately, leading to the passage of policies that would change the nature of punishment. The emergence of crime on the agenda was as durable as it was sudden, molding the path it traveled in the next few decades. The contestation over this issue was not a flash fire that quickly burned out; rather, the paths that were blazed in this moment had a continuing impact on crime policy to the present, though the racialized connection would shift from being a causal argument and implicit rhetorical device to being a tangible outcome once the effects of these policies manifested themselves.


