





Introduction
Public service institutions are fundamental to democratic societies. The judiciary and the police maintain the rule of law, the civil service implements government policy, schools educate young citizens, and universities produce scientific knowledge that underlies societal progress. These institutions can only effectively fulfil their function when they are, by and large, accepted as legitimate by citizens (Rothstein and Teorell, Reference Rothstein and Teorell2008). And, as Rosanvallon (Reference Rosanvallon2011) has argued, the legitimacy of institutions of public service lies in large part in their lack of partiality.
Yet, in democracies around the world, institutions with a neutral function are increasingly accused of political bias and partiality in the public debate. In the so-called ‘impartiality row’, football pundit Gary Lineker was suspended by the public broadcaster BBC after publicly expressing outrage over Britain’s asylum politics, after which the BBC was accused of a conservative bias (Elgot, Reference Elgot2023). In many European countries, the legality of ethnic profiling by law enforcement officers is a controversial issue as police forces around the world are accused of having anti-minority biases. In academia, campaigns against so-called Islamo-gauchisme (France) and ‘critical race theory’ (United States) accused scientists of holding a liberal, progressive bias. In October 2023, the UK Conservative Party vowed to ‘kick woke ideology out of science’ and safeguard science from ‘the steady creep of political correctness’ (Conservatives, 2023). Far-right parties have moreover lamented that schools have become progressive bastions, with the Dutch far-right party Forum for Democracy opening a hotline against ‘left-wing indoctrination’ (De Goede, Reference De Goede2019). While the judiciary in the United States have been accused of a conservative bias, particularly after Roe v. Wade was overturned, the judiciary in the Netherlands was accused of being too progressive after landmark environmental rulings (Wynia, Reference Wynia2022). In other words, despite their impartial functions, the actors of several public service institutions in European countries are frequently portrayed as promoting specific political interests or viewpoints at the cost of others.
Despite ample examples of alleged biases in public service institutions, we know little about the extent to which European citizens believe that these institutions – or the actors working for them – are politically biased, and if that is the case, which factors explain these perceptions. This is an open question that has received surprisingly little attention to date. According to Norris’ (Reference Norris2022, p. 7) typology of institutional trust, citizens’ evaluations of institutions can take two forms: either their trust accurately reflects institutional performance (and trustworthy institutions receive more trust), or their trust is cynical or credulous, shaped by biased judgements or the absence of reliable information. In line with this framework, perceived bias in public service institutions may either accurately reflect existing biases or result from a politicisation of institutions that resonates with citizens’ own political or social identities. Research on institutional legitimacy has found that citizens care about fair procedures (Tyler, Reference Tyler2003), and one could expect citizens to evaluate actual biases they encounter directly or through media reports. At the same time, we know that citizens’ perceptions are driven by their own political identities and viewpoints (Taber and Lodge, Reference Taber and Lodge2006). Adjacent research on perceived media bias suggests that citizens tend to perceive balanced media content as biased against their own (political) in-group – a tendency particularly pronounced among citizens with strong political views (Gunther et al., Reference Gunther, McLaughlin, Gotlieb and Wise2017; Reid, Reference Reid2012). Furthermore, political identity is found to interact with (political) source cues in shaping perceptions of media bias (Gunther et al., Reference Gunther, McLaughlin, Gotlieb and Wise2017; Kim and Grabe, Reference Kim and Grabe2022). Thus, perceiver characteristics, and political positions in particular, are important drivers of the amount and direction of bias that people may perceive.
Our study analyses the nature and scope of institutional bias perceptions among European citizens to answer a threefold research question. First, to what degree and in what direction do citizens perceive political bias among the actors working in public service institutions? Second, which citizens are more likely to perceive political bias? Specifically, we study the effects of political interest as well as socio-demographic factors that may drive feelings of underrepresentation by institutions. And third, how do ideological positions of citizens relate to the ideological direction of perceived bias? Building on expectations from media bias research, we examine whether citizens are more inclined to perceive a hostile bias (i.e. a bias against their own ideological position) than a friendly bias (i.e. in line with their own position).
To answer these research questions, we developed new survey questions and collected original survey data in five European countries (Germany, the United Kingdom, Spain, Poland, and the Netherlands), including items measuring the direction of perceived political bias (towards the left or right) for a range of actors in public service institutions. To be sure, bias perceptions among citizens can exist independently from actual bias, and our study does not intend to evaluate actual biases in institutional outcomes, nor the extent to which citizens’ evaluations are rooted in any objectively existing bias or reflect allegations of bias made in the public debate. Instead, we are interested in whether and to which extent citizens perceive political bias. We therefore measure citizens’ perceptions of ideological bias of the actors within six different public service institutions: scientists, schoolteachers, journalists, judges, police officers, and civil servants.
Our results show that approximately half of our respondents perceive actors in public service institutions to be politically biased. On average, teachers, journalists, and (to a lesser extent) scientists are generally seen as more left-leaning, while judges, police, and civil servants are perceived to be more to the right-wing. These patterns are subject to substantial variation between countries. Perceptions of institutional actors are most widely spread out across the left-right spectrum in the United Kingdom and Spain, moderately so in the Netherlands and Germany, and least in Poland. In terms of the correlates of generalised perceived bias (irrespective of direction), we find that the politically interested and the ideologically extreme perceive more ideological bias in public service institutions, as well as citizens with lower education and income levels. Perceptions of ideological bias are also strongly shaped by citizens’ prior political positions (suggesting the presence of motivated reasoning): left-wing citizens tend to perceive actors in institutions to be more right-wing, whereas right-wing citizens perceive institutions to be more left-wing. This effect is most pronounced for politically interested citizens.
This study makes several important contributions to the literature. First, we develop and test a set of new survey measures of bias perceptions among actors in public service institutions. Second, while citizens’ bias perceptions to date have only rarely been studied for institutions other than the media, we assess the scope of these perceptions by systematically mapping bias perceptions across a set of six different public service institutions in five different European democracies. Finally, we test and confirm various theoretical explanations for these bias perceptions among citizens. In this way, we improve our understanding of the potential threats to the legitimacy of public service institutions, which perform crucial functions in our representative democracies.
Public service institutions and political bias
Political bias, as used in this paper, refers to the perceived promotion of certain political viewpoints or positions over others by actors within public service institutions. Such perceptions are problematic in the context of institutions that are normatively expected to act impartially – such as the judiciary, civil service, or education and media sectors – because impartiality is foundational to their legitimacy and democratic function. Their impartial mandate distinguishes these institutions from political institutions such as the executive, parliament, or political parties, which are designed to be representative of and responsive to citizens’ interests and ideological viewpoints. Simply put, while a governing executive with a left-wing programme can be perfectly legitimate if it represents the majority’s demands, having a left-wing agenda would be normatively problematic for a university or court, and potentially detrimental to its legitimacy in the eyes of citizens. For theorists Rothstein and Teorell (Reference Rothstein and Teorell2008), the quality of democratic government cannot be solely based on equal democratic access to public authority but equally lies in the impartial exercise of public authority by the relevant institutions. Hence, where popular rule for all constitutes the ‘input side’ of democratic government, impartial governance by public service institutions refers to the procedures through which policy output is realised. To cite Cupit, impartiality refers to being ‘unmoved by certain sorts of considerations – such as special relationships and personal preferences. It is to treat people alike irrespective of personal relationships and personal likes and dislikes’ (Cupit, in Rothstein and Teorell, Reference Rothstein and Teorell2008, p. 170). This is not to say that the policy output of all public service institutions, such as the bureaucracy, is politically neutral. Rather, it refers to the principle that when political actors decide a course of action, its implementation follows the axiom of impartiality. In short, the quality of public service institutions is defined precisely by their impartiality and objectivity, and thus by the absence of political bias. This criterion applies to a wide range of public institutions with various functions, among which are order institutions such as the police and the judicial system, executive institutions such as the civil service, and also institutions involved in the production and transmission of knowledge, such as (public) media, public schools, and universities.
Conceptually, it is important to distinguish two levels at which bias can be perceived: regarding the functioning and outcomes of a given institution and regarding the ideological positions and preferences of actors working in the institution. While the two forms of political bias perception may overlap and are often conflated in the public debate, they have different implications. In the former, impartiality is violated in the exercise of authority. From a normative perspective, this form of bias in public service institutions is inherently problematic, as equal treatment and objectivity are fundamental to their functioning. In the latter, a sizeable group of actors professionally active in a given institution shares a certain political leaning, which is not necessarily normatively problematic as long as their views do not influence their actions.
However, even though actors and outcomes are theoretically separate, whether an institution can do its work fully impartially when its actors are ideologically one-sided is subject to a recurring debate in relation to different institutions. This – ultimately empirical – question has been tackled most extensively in studies on judging, which find systematic evidence that judges of different social and political backgrounds take different decisions (Harris and Sen, Reference Harris and Sen2019; Sunstein et al., Reference Sunstein, Schkade, Ellman and Sawicki2006), leading scholars to call for ideologically balanced judicial panels (Miles and Sunstein, Reference Miles and Sunstein2008; Schanzenbach and Tiller, Reference Schanzenbach and Tiller2007). The ideological leaning of scientists has also been scrutinised empirically (Gross and Fosse, Reference Gross and Fosse2012; Van de Werfhorst, Reference Van de Werfhorst2020), with some scholars arguing that more political diversity in academia will lead to better and more objective scientific output (Duarte et al., Reference Duarte, Crawford, Stern, Haidt, Jussim and Tetlock2015; Williams, Reference Williams2016). For civil servants, it has been suggested that their political views skew public policy, for instance, towards more public spending (Jensen et al., Reference Jensen, Sum and Flynn2009). The literature on representative bureaucracy has underscored that a more representative civil service will lead to fairer outcomes (Mosher, Reference Mosher1982). Hence, while there is no inextricable link between actors’ ideological leaning and institutional outcomes, there is evidence across different types of institutions that the first may influence the latter.
In public debates across Europe, accusations of political bias in institutions primarily focus on actors. While comparative longitudinal data on bias accusations in public debates is lacking, we highlight the debates surrounding different institutions here. Next to the predominant focus on actors, we note that bias accusations primarily concern supposed political bias of the actors involved in the institutions, as opposed to other potential forms of biases related to the descriptive make-up of such institutions in terms of demographic, socio-economic, and ethnic characteristics.
With respect to law enforcement, Seymour Martin Lipset famously argued in 1969 that police officers in the United States are strongly aligned with right-wing politics (Lipset, Reference Lipset1969). In the United Kingdom, the supposed political leaning of the police force has been an issue of contentious politicking in the last decades (Bowling et al., Reference Bowling, Reiner and Sheptycki2019), and a study on the French police shows higher right-wing authoritarian attitudes and prejudice against minorities among police officers compared to the general population (Gatto et al., Reference Gatto, Dambrun, Kerbrat and De Oliveira2010). Citing a report by the British Institute of Race Relations and leaked racist informal communication among police officers, far-left party BIJ1 in the Netherlands has expressed outrage over alleged right-wing extremism in the police force across Europe (BIJ1, 2024). Similarly, in Germany, the police force have been accused of harbouring far-right officers in their midst (Tussing, Reference Tussing2023).
The political impartiality of the judiciary has also been a source of contention in many European countries. In Poland, the conservative government led by the Law & Justice (PiS) party (2015–2023) attempted to capture the judicial system by replacing Supreme Court judges with PiS-loyalists (Van Lit et al., Reference Van Lit, van Ham and Meijers2023). This resulted in widespread protests against undue political influence in the courts. In Spain the politicisation of the judiciary has been hotly debated for many decades. Recently, the two competing mainstream parties, the Socialist Workers’ Party (PSOE) and the Popular Party (PP), quarrelled over judicial appointments and reform of the judiciary, a process through which the political allegiance of many publicly visible judges has become public knowledge (Hedgecoe, Reference Hedgecoe2023). In the Netherlands, Geert Wilders, leader of the far-right Freedom Party (PVV) frequently dismisses the legitimacy of ‘D66 judges’, referring to the supposed political allegiance of judges to the social-liberal D66 party. In Germany, the public debate has centred around inserting safeguards against political capture of the judiciary (Berger, Reference Berger2023).
With respect to the media, PVV-leader Wilders has repeatedly dismissed journalists as ‘scum’, has designated the public broadcaster as ‘left hate media’, and has advocated the abolishing of the Dutch public broadcaster (Algemeen Dagblad, Reference Dagblad2017; Villamedia Uitgeverij BV, 2023). In Germany, commentators have suggested that public broadcasters are ‘drenched with left-green’ ideology (Ruhs, Reference Ruhs2024) and that public broadcasters are ‘left-wing, paternalistic, and with close proximity to the state’ (Kissler, Reference Kissler2023). Polish public broadcasters had been the subject of international observers asserting partisan media coverage favouring the PiS government during the 2023 election campaign (OSCE, 2023). According to a 2016 YouGov survey, European citizens frequently perceive the media to be biased. While Finnish and British citizens saw a predominant right-wing bias in the media, French, German, and Swedish citizens believed the media to be skewed towards a left-wing bias, particularly on issues pertaining to crime and immigration (Dahlgreen, Reference Dahlgreen2016).
With respect to education, far-right parties across Europe have seen cause to oppose ‘left-wing indoctrination’ in public schools and universities. In the Netherlands and Germany, respectively, Forum for Democracy and Alternative for Germany have opened websites or portals to report such alleged ‘indoctrination’ (Kutter, Reference Kutter2018), and in the Netherlands, far-right activist group ‘gun sight on the left’ (Vizier op Links) targeted supposed left-wing academics and public figures by posting stickers on their homes. Moreover, conservative politicians in France and the United Kingdom have warned against supposed undue influence of left-wing, progressive academics in universities in campaigns against ‘islamo-gauchisme’ and ‘woke, critical race theory’. In Poland, the PiS government attempted to increase government control over school curricula, to reduce alleged ‘liberal bias’ in the education system (Radó and Mikola, Reference Radó and Mikola2025).
Finally, the neutrality of civil servants has been contested across European democracies. In the United Kingdom, politicians have alleged that civil servants are partly responsible for the failure of Brexit, suggesting that their politically progressive preferences stand in the way of carrying out government policy (Daisley, Reference Daisley2023). In Germany, right-wing extremism among civil servants has been a topic of debate. A proposal of the SPD-led government to ban ‘anti-democratic’ actors from the civil service was criticised by the conservative CDU, which feared it would actually target civil servants with right-wing or conservative views (Boos, Reference Boos2022). In the Netherlands, racial profiling by the tax authorities in the momentous ‘social benefits scandal’ (Toeslagenschandaal) highlighted concerns for political biases among bureaucrats. Similarly in Poland, concerns have been voiced about the lack of impartiality in the Polish civil service system (Lipowicz, Reference Lipowicz2023).
As this anecdotal overview suggests, whether or not there is really political bias in how these institutions operate, the neutrality of public service institutions has become the subject of intense political debate in many European countries. Accusations usually target individuals within these institutions, which are often conflated with the institution’s actual results or outcomes.
Citizens’ perceptions of political bias in public service institutions
Despite these heated debates, we know little about whether and how bias perceptions exist at the level of citizens. There are two reasons to expect such perceptions to exist. First, bias perceptions arise due to the information citizens are exposed to: how institutions and actors are discussed in the public debate, or to actual biases that are directly experienced or reported by the media. Research on procedural fairness has demonstrated that citizens are sensitive to information about the fairness of institutional procedures and outcomes (Lind and Tyler, Reference Lind and Tyler1988; Tyler, Reference Tyler2003). Initially, studies have demonstrated the impact of individual encounters with police or judges, or simulations of such in experiments, on perceived fairness of the outcome (Tyler, Reference Tyler1996). Yet also more general evaluations of fair treatment and fair procedures are found to affect levels of institutional trust (Grimes, Reference Grimes2006; Marien and Werner, Reference Marien and Werner2019). Information about fair procedures, be it first-hand or mediated, feeds into citizens’ evaluations and approval of impartial institutions. Second, bias perceptions can arise as a result of internal, psychological mechanisms related to how people process information. Psychological research has long shown that cognition is motivated (Kunda, Reference Kunda1990), and that people tend to weigh and align information with pre-existing political beliefs (Taber and Lodge, Reference Taber and Lodge2006). Research on procedural fairness acknowledges the role of outcome favourability on legitimacy (ie people like procedures more when they promote their self-interest, see Esaiasson et al., Reference Esaiasson, Persson, Gilljam and Lindholm2019; Werner, Reference Werner2020). Moreover, the role of motivated reasoning has been forcefully demonstrated in relation to perceived media bias. According to the ‘hostile media effect’, partisans from opposite sides tend to view the exact same (balanced) news content as biased against their side. Since the first recognition of this pattern (Vallone et al., Reference Vallone, Ross and Lepper1985), researchers have underlined the importance of perceiver characteristics – most notably individuals’ partisanship or issue attitudes – for perceptions of media bias (Perloff, Reference Perloff and Wei2018). Below, we propose that similar mechanisms may drive people’s evaluations of a much broader range of public institutions.
Indirect evidence suggests that various public institutions carry a political connotation in the eyes of citizens, as support for these institutions is related to citizens’ political positions. In European public opinion, climate science scepticism is stronger among citizens with a right-wing ideology (McCright et al., Reference McCright, Dunlap and Marquart-Pyatt2016) and among citizens with populist attitudes (Meijers et al, Reference Meijers, Van Drunen and Jacobs2023). Trust in the public news media is rooted in individual partisanship (Suiter and Fletcher, Reference Suiter and Fletcher2020), and trust in the political system is lower among citizens with culturally right-wing attitudes (Van Ham and Van Elsas, Reference Van Ham and van Elsas2024), as well as among citizens at the ideological extremes (Torcal and Carty, Reference Torcal and Carty2022; Torcal and Magalhães, Reference Torcal and Magalhães2022). More comprehensive evidence comes from the United States, where research finds consistent links between institutional trust and ideological positions. Trust in science is polarising along ideological and partisan lines as conservative citizens are increasingly distrusting of these institutions (Gabel et al, Reference Gabel, Gooblar and Roe2021; Gauchat, Reference Gauchat2012), and less willing to follow government vaccination programmes (Baumgaertner et al., Reference Baumgaertner, Carlisle and Justwan2018). Confidence in the police, on the other hand, is higher among Republican citizens (Brown, Reference Brown2017). A recent longitudinal study shows that trust gaps between Democratic and Republican citizens have increased in two directions: since the 1970s, ‘knowledge institutions’ (media, school system, and universities) have become more trusted by Democratic citizens (and less by Republican citizens), while ‘rules and values institutions’ (the police, church, and military) are increasingly trusted by Republican partisans (and less by Democrats) (Brady and Kent, Reference Brady and Kent2022).
Aims and hypotheses
We know of only a handful of (single-country) studies that directly measure perceived political bias in public service institutions. Brady and Kent (Reference Brady and Kent2022) report on a survey showing that Americans perceive the military and police officers as Conservative, while seeing professors, journalists, and teachers as Democratic. Yair (Reference Yair2021) finds that Israelis tend to perceive the police and the Attorney General as biased against their ideological camp and find evidence of a similar pattern in the United States for perceived bias at Facebook. These studies show that bias perceptions may reflect a mechanism that works across different types of institutions and in different contexts. Our study provides the first systematic cross-national and cross-institutional analysis of these perceptions.
Given the understudied status of our key concept, the first aim of our study is descriptive: we assess to what extent European citizens perceive political biases among the actors of a diverse range of public institutions. Two considerations are important here. First, political biases can manifest themselves on different dimensions, in relation to issue positions, ideology, or partisanship. While partisanship dominates the discussion in the United States, in Europe political bias is mostly discussed in terms of left-right ideology. The left-right dimension not only captures the most salient issue divides, reflecting attitudes towards economic as well as cultural issues (Steiner, Reference Steiner2024), but it also functions as a marker of social identity among European citizens (Devine, Reference Devine2015; Vegetti and Širinić, Reference Vegetti and Širinić2019). Second, we choose to focus on actors in institutions, rather than the more abstract institutions at large. As noted above, institutions and actors are often conflated in the public debate. Yet when probing people’s bias perceptions, it is ultimately the actors in the institutions that are thought to hold particular political positions. We consider actors from a diverse range of public service institutions: civil servants represent professionals working for executive institutions; police officers and judges represent institutions involved in maintaining order; journalists, teachers, and scientists relate to institutions involved in the production and transmission of knowledge. As the discussed examples of bias accusations across the different countries show, these institutions not only vary in their core public task but are also associated with different (left/right) sides of the political spectrum. Brady and Kent (Reference Brady and Kent2022) find a difference between knowledge institutions (associated with the left) and order institutions (associated with the right). Given the lack of broader evidence or theory on how different types of institutions are perceived ideologically, we do not hypothesise on these differences but ask an exploratory research question: To what extent do bias perceptions systematically differ between different types of institutions (executive, order, and knowledge)?
The second aim of our study is to explain why people differ in the extent to which they perceive bias. How can we understand bias perceptions at the individual level? And are there explanations that travel across different institutional contexts? Importantly, some individual-level factors may explain why people perceive any bias in public service institutions, irrespective of its direction (general explanations). Other factors may explain why people perceive a bias towards either the left or the right (directional explanations). Different operationalisations of the dependent variable allow us to test both types of explanations. General explanations of perceived institutional bias are analysed with a dependent variable on perceived neutrality of public service actors, ranging from neutral to ideologically biased (in any direction). Directional explanations of bias perceptions are analysed using a dependent variable where perceived actor bias ranges from left to right.
General explanations
A first general explanation for bias perceptions is the degree to which people receive and process information about institutions and their functioning. Specifically, we expect those with more political interest to be more prone to perceiving political bias, for two reasons. First, political discussions as well as media reports about alleged political bias in institutions primarily reach people who are interested in such information. Indeed, people who are more interested in politics consume more political news (Strömbäck and Shehata, Reference Strömbäck and Shehata2010) and report higher levels of political knowledge (Lecheler and De Vreese, Reference Lecheler and de Vreese2017), and they have more accurate perceptions of, for instance, the democratic quality in a country (Mauk, Reference Mauk2021). Second, political interest increases people’s sensitivity to political cues (Prior, Reference Prior2007; Zaller, Reference Zaller1992), their tendency to ‘sort’ political objects in ideological terms (Davis and Dunaway, Reference Davis and Dunaway2016) and to use ideological information in forming their judgement (Lau and Redlawsk, Reference Lau and Redlawsk2001). Thus, we expect politically interested people not only to be more aware of debates about political bias in the media and politics but also to be more inclined to apply concepts such as ‘left’ and ‘right’ to this discussion.
H1: Citizens with more political interest perceive more bias among actors in public service institutions.
A second general explanation lies in the extent to which different groups in society feel represented by public institutions. For political institutions, we know that descriptive and substantive representation (Arnesen and Peters, Reference Arnesen and Peters2018) as well as the sense that institutions ‘listen’ (Esaiasson et al., Reference Esaiasson, Gilljam and Persson2017, Ulbig, Reference Ulbig2008) are crucial for perceived legitimacy. The literature on representative bureaucracy (Mosher, Reference Mosher1982) has similarly emphasised the importance of representation in non-elected institutions: not only because representative institutions may take more representative decisions (see for an overview Bishu and Kennedy, Reference Bishu and Kennedy2019), but also because they convey to citizens a higher degree of symbolic representation: they give citizens the sense that they have ‘similar life experiences and shared values’ (Wang, Reference Wang2025, p. 5), thus enhancing cooperation and perceived legitimacy (Van Ryzin et al., Reference Van Ryzin, Riccucci and Li2016).
Citizens from lower social strata, specifically with lower income and lower education levels, tend to be underrepresented in public service institutions – as having a higher education level and a reasonable to good income is inherent to working in these professions. Not only do lower and higher social strata differ in their political views (Hainmueller and Hiscox, Reference Hainmueller and Hiscox2007; Hakhverdian et al., Reference Hakhverdian, van Elsas, van der Brug and Kuhn2013), lower educated and low income individuals may also perceive a larger cultural distance to the (often higher educated) people working in public institutions (Noordzij et al., Reference Noordzij, Van der Waal and De Koster2019), with academics, judges, and journalists standing out at the most ‘elitist’ professions with higher occupational status (Newlands and Lutz, Reference Newlands and Lutz2024) and cultural capital (Bourdieu, Reference Bourdieu1984). Furthermore, the literature on representative bureaucracy points to gender as a source of underrepresentation. Females are in the minority in many academic disciplines (Nakagawa et al., Reference Nakagawa, Wotipka and Buckner2024) and in courts (Valdini and Shortell, Reference Valdini and Shortell2016), as well as in the civil service and police force (Rabe-Hemp and Garcia, Reference Rabe-Hemp and Garcia2019). Taken together, we expect the following groups to perceive more bias among institutional actors.Footnote 1
H2a: Lower educated citizens perceive more bias among actors in public service institutions than higher educated citizens.
H2b: Lower income citizens perceive more bias among actors in public service institutions than higher income citizens.
H2c: Women perceive more bias among actors in public service institutions than men.
Third, ideological extremity is likely to lead to stronger perceptions of bias. Research on perceived media bias has consistently found that citizens with more extreme pre-existing attitudes tend to view more bias in news content (see Perloff, Reference Perloff and Wei2018, for an overview). According to social judgement theory (Sherif et al., Reference Sherif, Sherif and Nebergall1965), people use their own positions as the standard to which they compare new information. People with more extreme political positions are more likely to encounter information that falls into their ‘latitude of rejection’ and thus to perceive information as biased (Gunther et al., Reference Gunther, McLaughlin, Gotlieb and Wise2017). This is found both for strong partisans (Reid, Reference Reid2012) and for those with more extreme issue positions (Feldman, Reference Feldman2011), suggesting that the mechanism applies more generally when people have strong pre-existing attitudes. In the European context, the ideological left-right dimension is associated with both issue positions and partisanship (Steiner, Reference Steiner2024; Vegetti and Širinić, Reference Vegetti and Širinić2019). Thus, citizens with more extreme positions on this left-right dimension are more likely to perceive a distance between their own views and those of the actors in public service institutions, resulting in perceiving more bias.
H3: Citizens with more extreme ideological positions perceive more bias among actors in public service institutions.
Directional explanations
What explains whether people specifically see a left-wing or a right-wing bias, and how does this relate to their own political positions? Research on hostile media effects has long documented people’s tendency to perceive a hostile bias (i.e. a bias that opposes one’s own political views) in neutral or balanced content (Perloff, Reference Perloff and Wei2018). While early studies relied on aforementioned social judgement theory to explain this effect (Vallone et al., Reference Vallone, Ross and Lepper1985), an increasingly dominant explanation relies on social identity theory (Tajfel and Turner, Reference Tajfel and Turner1979). As people categorise the social world into in- and out-groups, reasoning processes can become motivated by a wish to maintain the in-group’s status at the cost of the out-group. This makes people sensitive to in-group unfavourable elements in media content and explains why people have a tendency to perceive a hostile bias. In balanced news content (i.e. containing an equal amount of attitude-congruent and -incongruent statements), unfavourable statements activate a ‘defensive processing’ mechanism which leads to a rejection of that content, especially when the issue at hand engages group identities (Matheson and Dursun, Reference Matheson and Dursun2001; Reid, Reference Reid2012). These effects are enhanced in the presence of a source cue that is perceived as belonging to an out-group (Gunther et al., Reference Gunther, McLaughlin, Gotlieb and Wise2017; Kim and Grabe, Reference Kim and Grabe2022). Conversely, when the source is deemed friendly, an opposite mechanism of biased assimilation is activated, which leads to a higher acceptance of unfavourable content.
In relation to perceptions of bias in public service institutions, we expect that – given that these institutions are distant and do not carry a partisan label – people who identify ideologically as ‘left’ or ‘right’ will tend to engage in defensive processing, resulting in perceptions of a hostile bias.
H4: Left-wing citizens perceive actors in public service institutions as biased more towards the right than right-wing citizens, and vice versa.
Finally, we expect the effect expected under H4 to be stronger for citizens with higher political interest. Hostile media effects are more pronounced among those who are more involved in an issue (Hansen and Kim, Reference Hansen and Kim2011; Soontjes and Van Erkel, Reference Soontjens and Van Erkel2022). Highly involved individuals may feel there is more at stake, which increases their motivation to defend the in-group against unfavourable information. In the case of perceiving a left-right political bias, we expect those more politically interested to have a stronger engagement with these political labels and underlying group identities. In addition, politically interested people are more susceptible to news or cues by political elites that align with their beliefs (Van Bavel and Pereira, Reference Van Bavel and Pereira2018) and more prone to politically motivated reasoning (Taber and Lodge, Reference Taber and Lodge2006). We therefore expect that the influence of prior ideological positions on directional bias perceptions is more pronounced for highly politically interested citizens, as opposed to citizens with relative disinterest in politics, resulting in the following hypothesis.
H5: The effect of left-right self-placement on directional bias perceptions is stronger for people with higher political interest.
Data and measurement
To examine perceptions of bias across different European contexts, we gathered unique survey data from five European nations. Our study is among the first to examine European citizens’ perceptions of ideological bias in different institutions. Given the novelty of this research area, it is crucial to explore whether identified patterns extend across different national and institutional contexts. To this end, we selected a set of countries that offer both regional diversity and institutional variation, allowing us to probe the generalisability of identified patterns and explanations.
The inclusion of Germany, the United Kingdom, Spain, and Poland was made possible through an existing large-scale project, while additional funding allowed us to incorporate the Netherlands. While the number of cases is too low to support a multilevel analysis of country-level explanations, our research is not designed to test such explanations. Instead, the selected countries allow us to assess cross-national patterns in institutional bias perceptions across countries in which public service institutions have been politicised in the past – albeit in different forms and degree. For instance, in Poland, the judiciary and public broadcaster have faced extensive controversy following their capture by the Law and Justice (Prawo i Sprawiedliwość) party (Van Lit et al., Reference Van Lit, van Ham and Meijers2023). In Germany and the United Kingdom, there are ongoing concerns regarding far-right sympathies among police officers (Koehler and Filipps Reference Koehler and Filipps2024). Spain has seen widespread debate over the politicisation of its judiciary (Hedgecoe, Reference Hedgecoe2020). In the United Kingdom, the Conservative Party has criticised what it perceives as the ‘political correctness’ of scientific research. Meanwhile, in the Netherlands, the Freedom Party (Partij voor de Vrijheid), which emerged as the largest party in the 2023 parliamentary elections, has called for the abolition of the public broadcaster and dismissed climate and environmental research as ‘nonsense’. What is more, these five countries differ in their institutional frameworks. The sample includes both proportional and majoritarian electoral systems (United Kingdom), as well as countries with varying degrees of party system fragmentation – from relatively concentrated (United Kingdom and Poland) to more extensive (Netherlands). While these differences do not allow us to systematically disentangle the effects of specific institutional features, they allow us to explore whether perceptions of ideological bias exist across diverse contexts. This case selection thus provides a meaningful comparative framework to examine the scope of the phenomenon of interest, even if it cannot fully disentangle overlapping contextual factors.
The data collection took place during the spring of 2022Footnote 2 , carried out by two survey organisations: YouGov (in the United Kingdom, Spain, Germany, and Poland) and Centerdata (in the Netherlands) as part of the LISS (Longitudinal Internet Surveys for the Social Sciences) household panel. Table 1 provides an overview of the data collection process in each country. YouGov’s samples were drawn from their panel using quota sampling based on age, gender, and region. Because of YouGov’s specific sampling method, response rates are unavailable. Participants receive a general invitation and are assigned to a specific survey only after agreeing to participate. In the Netherlands, the sample was obtained from the LISS panel, resulting in 2,723 completed surveys with a response rate of 79.7 per cent. Both survey organisations supply relevant socio-demographic and attitudinal background variables.
Overview of the collected samples

Measuring political bias perceptions
The dependent variable of our study asks respondents to place the actors of a given institution on a scale from left to right, with a neutral middle option, using the question format displayed in Table 2 (see online Appendix A for translations). The survey question presents respondents with six different types of professionals working in public service institutions: scientists (universities), schoolteachers (schools), journalists (public broadcasting), judges (the judiciary), police officers (law enforcement), and civil servants (bureaucracy).
Survey measurement of dependent variable
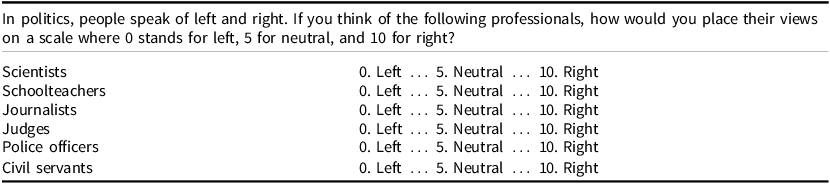
Note: A don’t know option was offered for each item. In the Netherlands, the left-right scale was presented without a label for the neutral (5) response option.
We analyse the dependent variable in three steps. First, we describe perceptions of bias in different institutions and in different countries. This provides a general overview of the strength and direction of such perceptions in different countries and across different institutions and allows us to answer the exploratory research question on cross-institutional differences. Second, we test the general explanations of bias perceptions (H1–H3) using a ‘folded’ dependent variable: recoding the original 0 to 10 scale such that extreme scores of 0 and 10 become ‘5’, and the neutral midpoint becomes ‘0’. This allows us to explain bias perceptions irrespective of their (left-right) direction. Third, we use the original dependent variable to test for directional explanations (H4–H5), allowing us to test how citizens’ ideology affects the direction of their bias perceptions.
Independent variables
We test H1–H3 by including the following independent variables. Political interest (H1) is measured by a single item (‘Generally speaking, how interested are you in politics?’), with the 0–5 response scale recoded into no interest/some interest/strong interest. To measure level of education (H2a), we use the ISCED scores provided by YouGov and LISS and recoded these into low/middle/high. For income level (H2b), we recoded the household income into terciles based on the distribution in the sample. Gender (H2c) is measured by a dummy for male (1) versus female (0). The degree of left-right extremity (H3) is operationalised by recoding left-right self-placement (measured on a 0 (left) to 10 (right) scale) into a 0 to 5 measure of absolute distance to the neutral (‘5’) position. The models additionally control for age of respondent in years. To test H4–H5, we recode the left-right self-placement variable into three categories: left (0–4), centre (5), and right (6–10). For H5, these categories are interacted with political interest. In these models, we control for the socio-demographic variables of age, gender, education, and income.Footnote 3
Modelling strategy
The data have a nested structure, as each respondent is asked to evaluate a set of six institutions. To account for intra-class correlation, we run Ordinary Least Squares regression models with standard errors clustered per respondent. In addition, the models include institution and country fixed effects to account for institution-based and country-level variation.
Results
To what extent do European citizens view the actors in impartial institutions as biased, and in which direction? To assess this, Figure 1 presents the distribution of perceptions of bias for different actors. For most professions, about 40 to 50 per cent of respondents place them in the middle (5) of the scale, which means that about half of the respondents perceives at least some ideological bias in these professions. At the same time, Figure 1 also indicates that a plurality of respondents report seeing no institutional bias in all six institutions. Scientists are most often regarded as neutral (61%), which is remarkable in light of studies demonstrating the politicisation of science (Rekker, Reference Rekker2021; Schrøder, Reference Schrøder2023). In terms of directionality of bias, teachers, journalists, and (to a lesser extent) scientists are generally seen as more left-leaning, while judges, police, and civil servants are placed more to the right. As a first answer to our exploratory research question, a left-right distinction thus emerges between institutions related to knowledge production and transmission on the one hand, and institutions related to maintaining order on the other hand, with civil servants fitting more into the latter category.
Left-right bias perceptions per institution pooled across countries.
Note: The figure shows histograms of the average perceived left-right position per public service institution across all five countries in which 0 signifies ‘left-wing’ and 10 signifies ‘right-wing’.

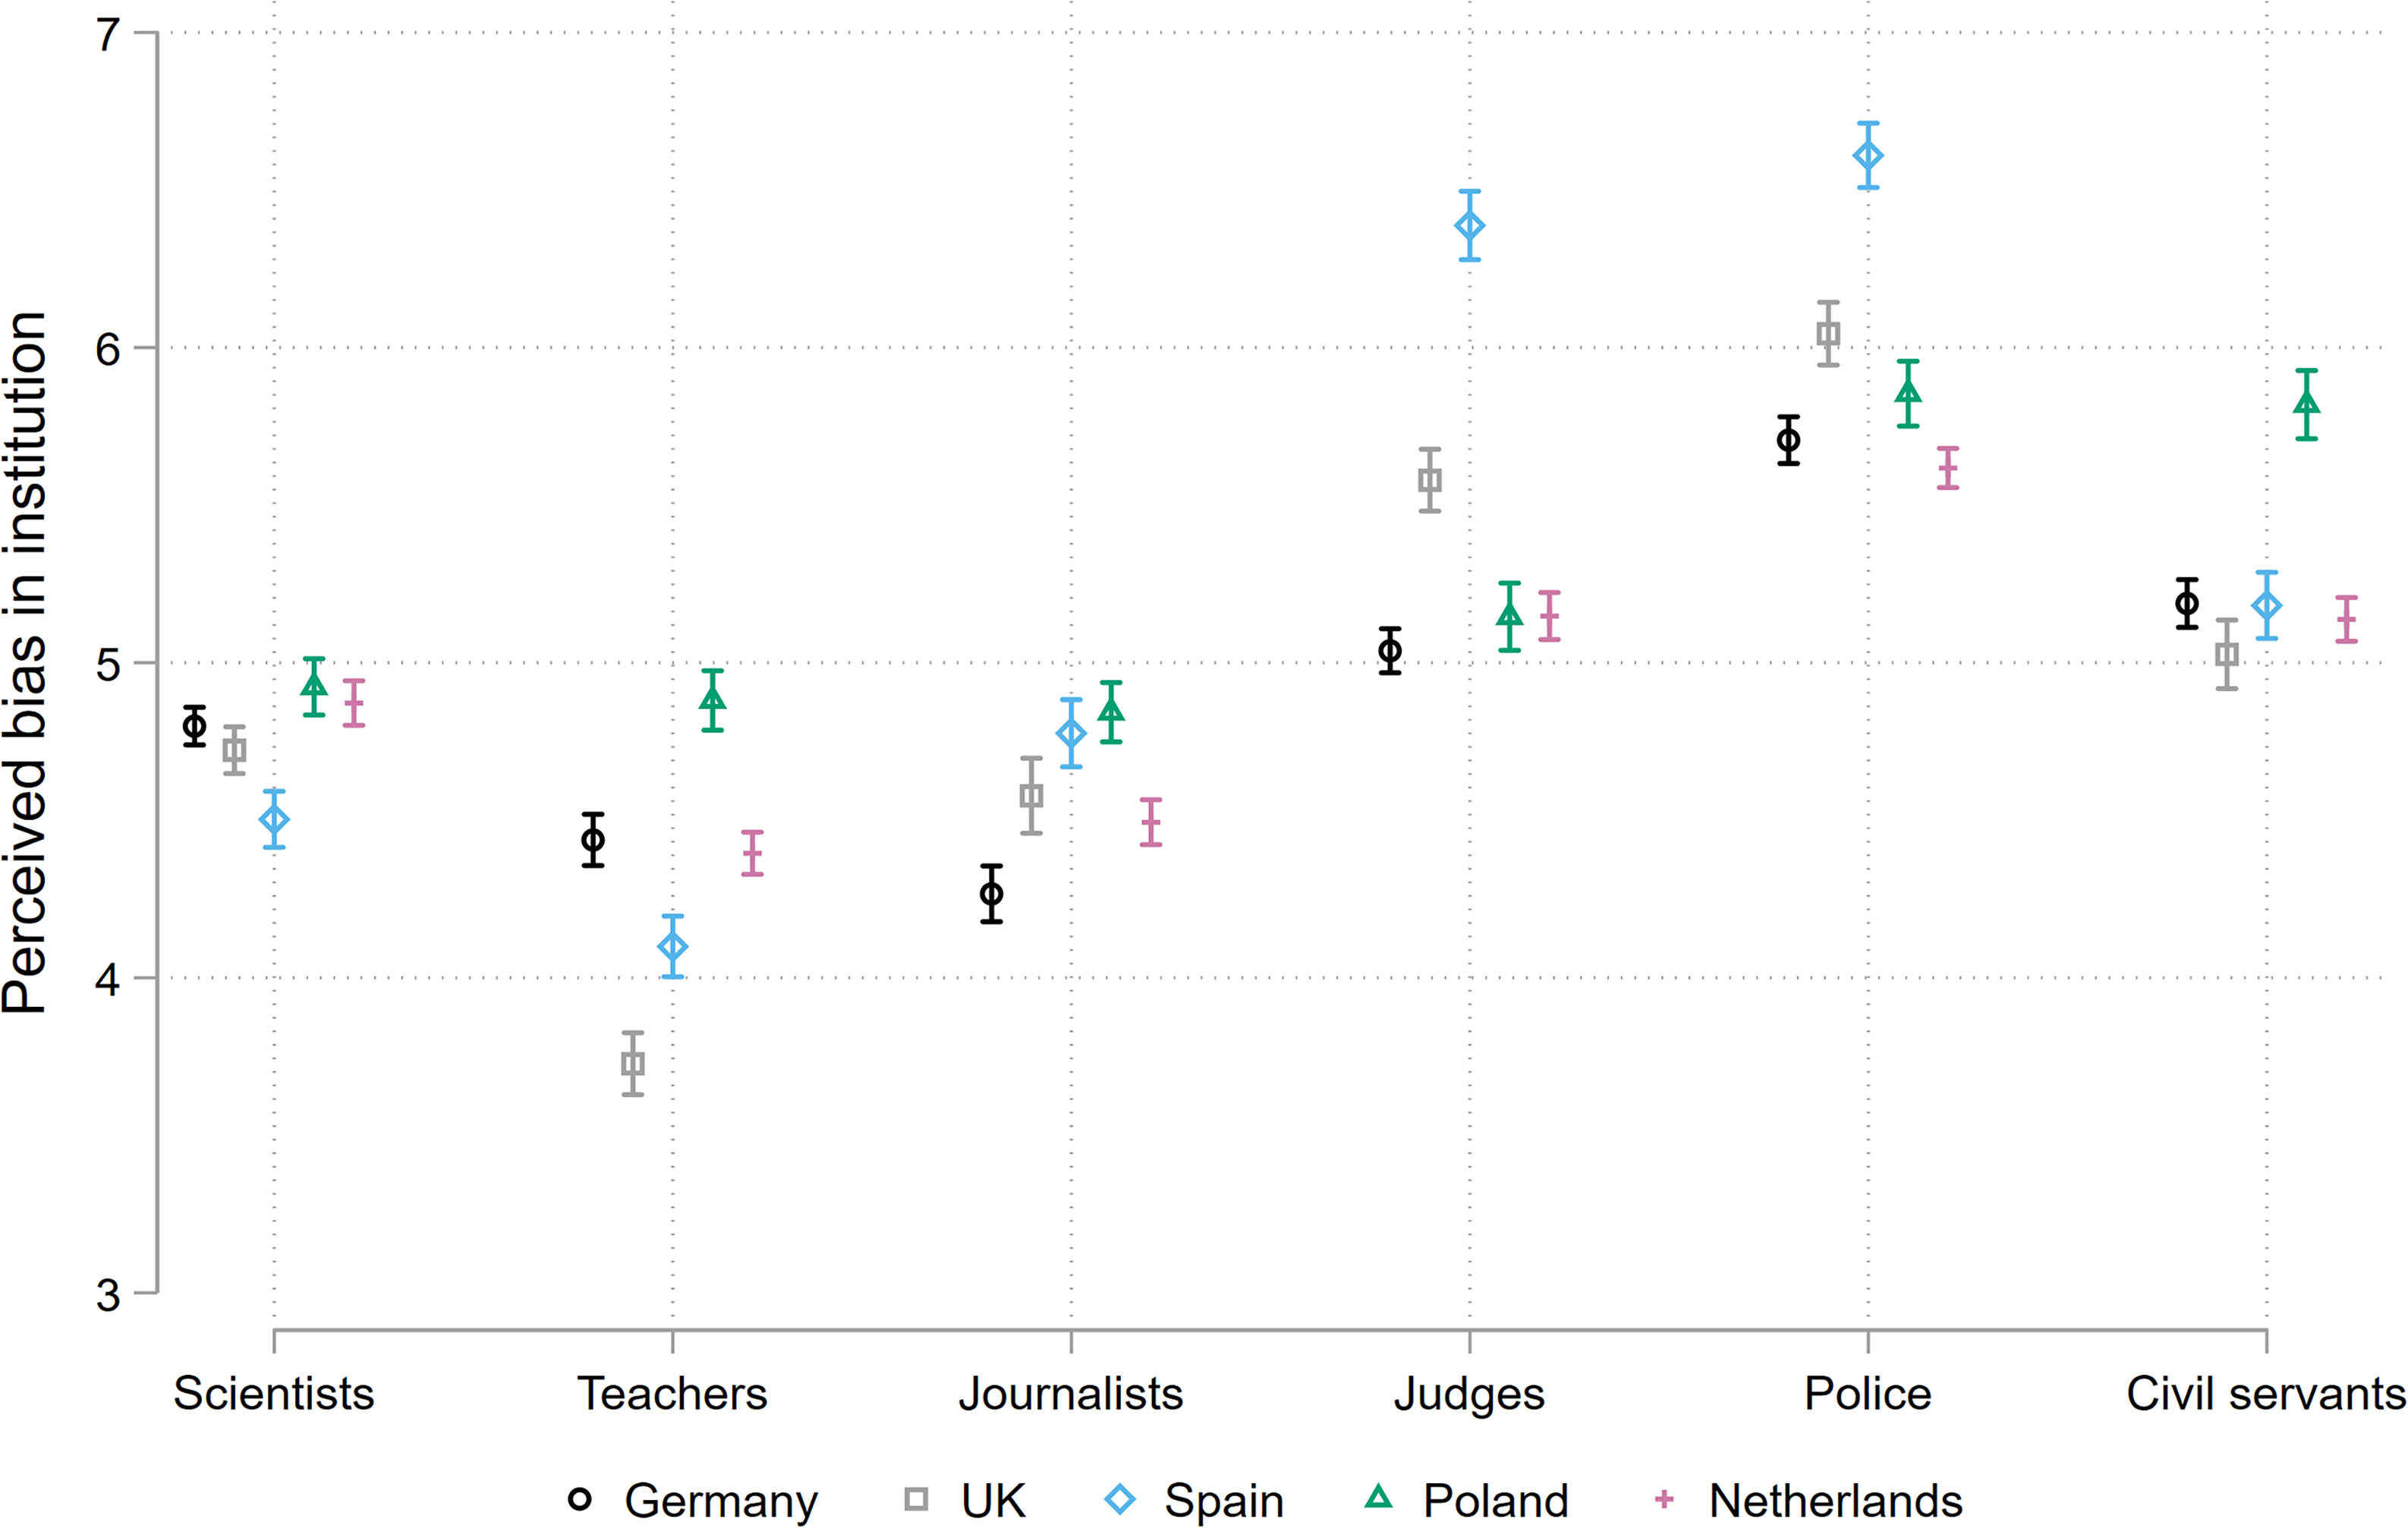
The mean level of perceived general bias over all institutions is relatively similar across countries. Perceived general bias measured on a 0 to 5 scale (‘folding’ the perceived bias item) is highest among Spanish and UK respondents (μ = 1.6 and 1.5, respectively), followed by Polish respondents (μ = 1.2), then the Netherlands (μ = 1.1) and finally German (μ = 0.9). Figure 2 displays the directional perceived bias in different institutions by country. Overall, and in response to our exploratory research question, we see a pattern where actors in knowledge institutions tend to be located towards the left, while actors in order institutions (judges and police officers) are placed more to the right – civil servants are close to the neutral midpoint in most countries (except Poland). There are considerable differences across countries. The spread of institutional actors across the left-right scale is largest in the United Kingdom and Spain, moderate in the Netherlands and Germany, and small in Poland. On the right side of the scale, the perceived right-wing bias among police officers is consistent across countries, while judges are placed towards the right in the United Kingdom and Spain. On the left side of the spectrum, the perceived left-wing bias among teachers, scientists, and journalists is moderate to strong in all countries except for Poland. Finally, for civil servants, Poland is again the exception: in most countries this profession is not considered biased on average, except for in Poland where it is associated with the right. In Poland, the right-wing PiS government, which was in place from 2015 to 2023, attempted to capture the civil service (Lipowicz, Reference Lipowicz2023). Our results indicate that Polish citizens perceive this institutional bias accordingly. In sum, while some biases are consistently perceived in the different countries (most markedly among the police and teachers), there are important differences that should be understood within the country context.
Estimated left-right bias perceptions per institution and country.
Note: The figure shows a predicted values plot based on a bivariate OLS regression analysis on perceived left-right bias per institution in a given country. Point estimates with 95 per cent confidence intervals are shown (N = 53,471 respondent–institution combinations).
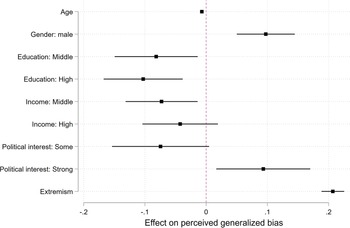
Turning to individual-level explanations, Figure 3 presents the results for the five countries combined for models explaining generalised perceptions of political bias, irrespective of direction (ie higher scores mean that one perceives more bias towards either left or right). In support of H1, we find a positive effect for political interest on the amount of perceived bias. Citizens with a strong political interest perceive more bias (b=.09, p<.05) compared to citizens with some interest in politics, while citizens with some or no interest do not differ in their bias perceptions. In support of H2a, we find that perceived bias decreases with level of education. Compared to the lowest educational level, those in the middle (b=− .08, p<.05) and higher (b=− .10, p<.01) education groups perceive less political bias, though these are substantively weak effects. For income, we find that the middle income levels see less bias than those with a lower income (b=.− .07, p<.05), but the highest and lowest income groups do not significantly differ. Against H2c, males see more bias than females (b=.10, p<.001). Finally, in line with H3, we find a strong effect of ideological extremity on bias perceptions (b=.21, p<.001): people who place themselves more towards the extremes of the left-right scale tend to perceive more bias in institutions. This effect is substantively large, as each one unit increase in left-right extremity (on a 0–5 scale) leads to about a .2 higher bias perception.
Coefficient plot of a pooled OLS regression model on generalised bias perceptions.
Note: The figure shows a coefficient plot of an OLS regression analysis on generalised bias perceptions, pooled across countries and institutions. Point estimates with 95 per cent confidence intervals are shown. The constant as well as country and institution fixed effects are not shown. NB: The confidence intervals for ‘age’ were so small [− .008 − .006] that they are not visible in the plot (N = 43,432 respondent-institution combinations).

Online Appendix B displays the results by country (Figure B1) and by institution (Figure B2). The effect of ideological extremity stands out as highly consistent across countries and institutions. The effects of (high) political interest (positive and significant in Germany, the United Kingdom, and Spain), of being highly educated (negative and significant in the United Kingdom and the Netherlands), and the difference between the lower- and middle-income groups are less consistent across countries. The results by institution (Figure B2), however, are revealing. Both educational and income levels have an effect on perceiving bias in scientists, judges, and civil servants, with the lower educated and lower income groups perceiving most bias; for journalists, only education has this effect. This supports H2a and H2b for these institutions and suggests a mechanism of perceived underrepresentation, as precisely these professional categories are associated with high education levels and high income and have a more elitist connotation compared to the remaining categories (police officers and teachers) (Newlands and Lutz, Reference Newlands and Lutz2024). As for gender, males see more bias in Germany, the United Kingdom, and the Netherlands, and across all actor categories except scientists.
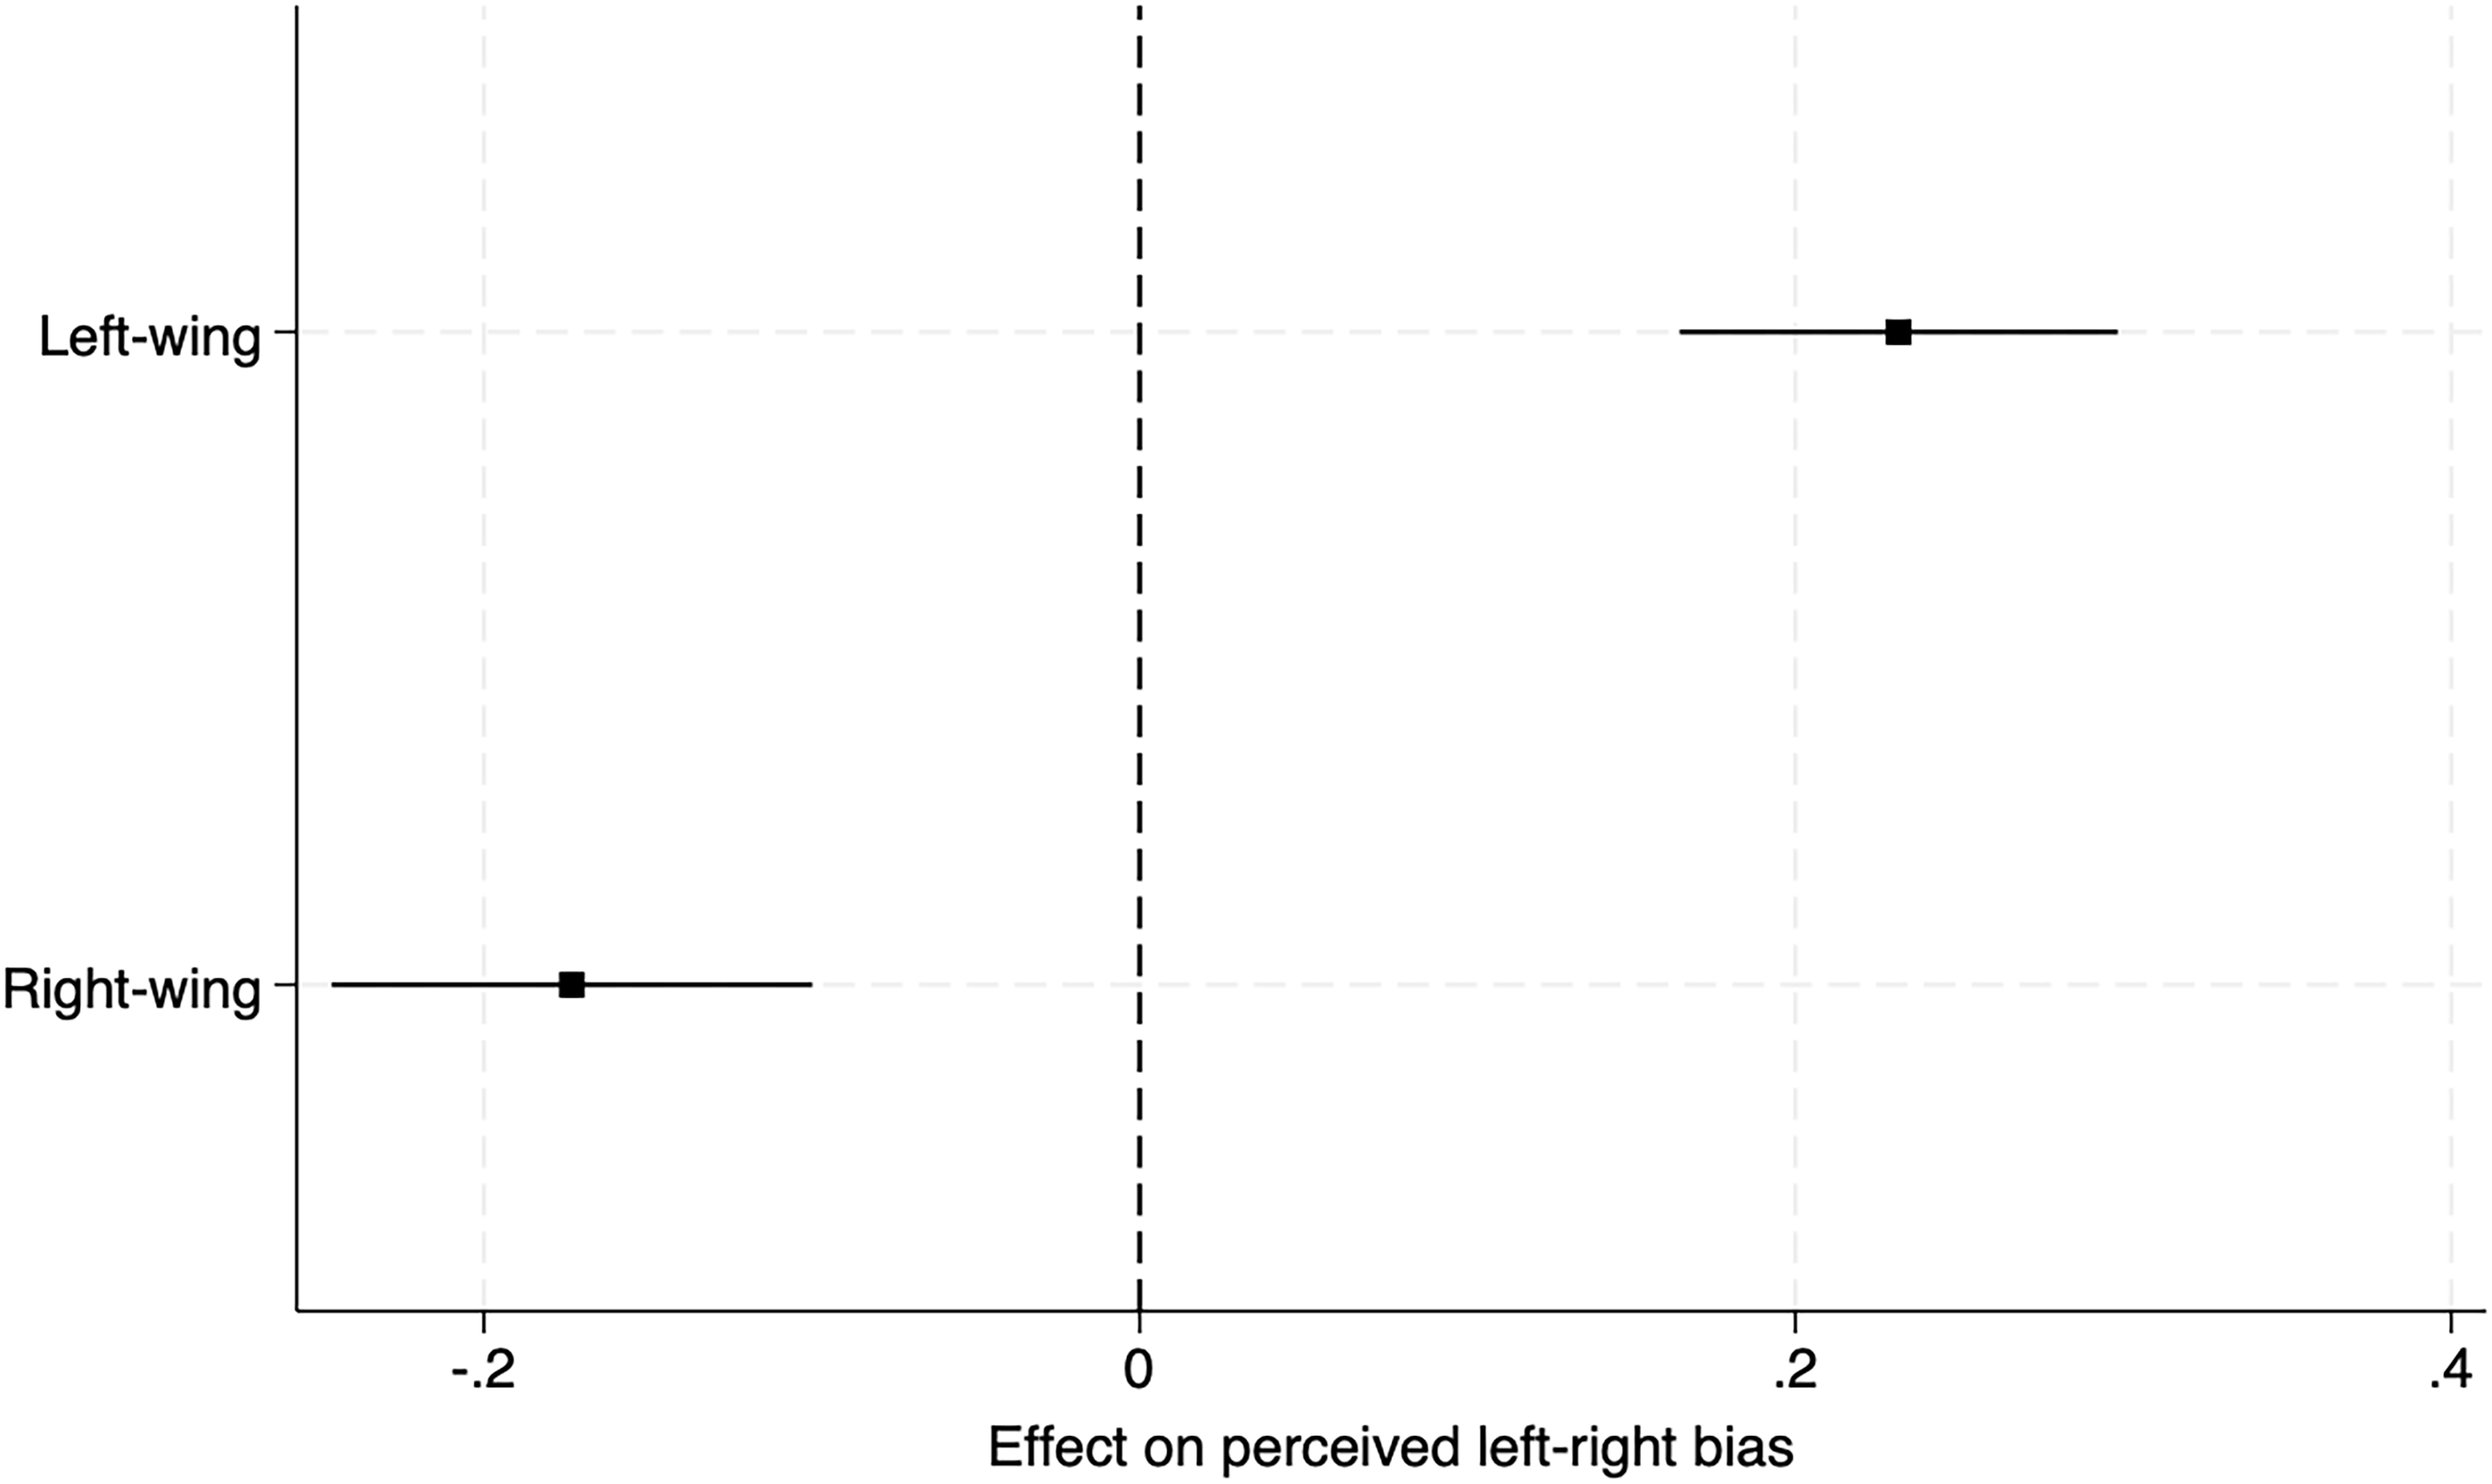
Until now, we have explained perceptions of bias irrespective of their (left-right) direction. But to what extent does individual ideological position steer bias perceptions in one direction or the other? Figure 4 displays the results of a regression for perceived bias from left (0) to right (10), pooled across countries and institutions: a positive coefficient thus signifies that a variable leads to a more right-wing placement of institutional actors. We see a clear pattern in support of H4, indicating a tendency towards perceiving a ‘hostile’ bias: People identifying as left-wing (compared to centrists) place institutional actors more to the right (b=.23, p<.001), while people identifying as right-wing (compared to centrists) place institutional actors more to the left (b=− .17, p<.001) (see Appendix Figure C1 for the effects of the control variables). The results per country (Figure C2) show that the impact of left-right self-placement is strongest in the United Kingdom and Spain, while in Germany and the Netherlands, there is a significant difference between respectively left-wing and right-wing citizens and the other two groups. In Poland, we see no effect of the own ideological position on directional bias perceptions.
Coefficient plot of a pooled OLS regression model on left-right bias perceptions.
Note: The figure shows a coefficient plot of OLS regression analyses of left-right bias perceptions for left- and right-wing respondents, pooled across countries and institutions. Point estimates with 95 per cent confidence intervals are shown. The estimates show the effect of left and right ideology vis-à-vis centrist ideology. The constant, controls, and country as well as institution fixed effects are not shown (N = 43,432 respondent-institution combinations).

The effect of one’s own ideological position varies across the different types of public service institutions, as illustrated in Figure 5. Both ideologically left- and right-wing citizens perceive a hostile bias among judges and civil servants, placing them on the opposite side of the political spectrum. Journalists are on average seen as more left-wing by both right-wing and centrist citizens. With regard to police officers – on average placed to the right in each country – left-wing citizens perceive them to be more right-wing than other citizens, while right-wing and centrist citizens do not differ. Both left- and right-wing citizens perceive teachers as more leftist than centrists. Finally, and remarkably, the political leaning of scientists is generally perceived to align with individuals’ own political views. Left-wing citizens perceive scientists as more left-wing, while right-wing citizens perceive them as (slightly) more right-wing. Appendix D shows these same results by country (Figure D1). Generally, left- and right-wing citizens are most divided in their bias perceptions in the United Kingdom and Spain. In the United Kingdom, a hostile bias is perceived across nearly all public service institutions, with left-leaning individuals seeing a right-wing bias among journalists, judges, the police, and civil servants, and right-leaning individuals perceiving a marked left-wing bias among teachers, journalists, and, again, civil servants. In Spain, similar patterns of hostile bias appear for journalists, judges, and civil servants, while such patterns do not apply to scientists and teachers. In the Netherlands and Germany, the differences between left- and right-wing citizens are less pronounced and occur only for a subset of the institutions; in Poland, there are marked differences in bias perceptions between left- and right-leaning citizens, but these do not align with a clear pattern of hostile bias.
The effect of left- and right-wing ideology on left-right bias perceptions per institution.
Note: The figure shows the predicted values of left-right bias perceptions for left-, centre, and right-wing respondents per institution, based on an OLS regression analysis pooled across countries. Point estimates with 95 per cent confidence intervals are shown. The constant, controls, and country fixed effects are not shown (N = 43,432 respondent-institution combinations).

Finally, H5 expects the effect of left-right self-placement on bias perceptions to be stronger for people with higher political interest. In support of this hypothesis, Figure 6 shows that the tendency to perceive a hostile bias is strongest for citizens with a strong political interest: among this group, left-wing citizens perceive more right-wing bias, and vice versa. Among citizens with some interest in politics, the effect of left-right self-placement is weaker; for citizens with no political interest, there is no effect of the own ideological position at all. Appendix E shows that these patterns – and the finding that the most politically interested are driven most by their own ideology in particular – hold in four out of five countries, with Poland again as the exception.
The effect of left-and right-wing ideology on left-right bias perceptions for different levels of political interest.
Note: The figure shows a predicted values plot of the interaction effect between left-right ideology and political interest on left-right bias perceptions (higher scores signify more right-wing bias), based on an OLS regression analysis pooled across countries and institutions. Point estimates with 95 per cent confidence intervals are shown. The constant, controls, and country as well as institution fixed effects are not shown (N = 43,432 respondent-institution combinations).

Discussion
Public service institutions are increasingly accused of political bias and partiality in the public debate. In this study, we aimed to map and explain perceptions of bias in public service institutions among European citizens. To capture the breadth of this phenomenon, we fielded a survey in Germany, the United Kingdom, Spain, Poland, and the Netherlands with newly designed survey items to capture perceptions of the ideological leaning of actors working in six types of public service institutions. This enabled us to assess to what extent and in what direction these (alleged) biases are perceived by citizens, and whether perceived bias differs based on citizens’ political interest, socio-demographic characteristics, and ideology.
Our results show that perceptions of bias are widespread, as about half of our respondents perceive political bias among actors in public service institutions. These perceptions are rather consistent across countries: generally, actors in institutions related to knowledge production and transmission are placed more towards the left (i.e. teachers, scientists, and journalists), while institutions related to maintaining order are associated more with the right (i.e. judges and police officers). The variation between institutions is most pronounced in the United Kingdom and Spain, and least in Poland. Furthermore, we find that bias perceptions are more common among people with higher political interest, and among lower educated and lower income citizens – with these latter effects found for institutions which harbour higher educated, higher income professionals (judges, scientists, civil servants, and journalists). This suggests that bias perceptions not only reflect an awareness of bias allegations in media and politics (among the politically interested) but can also result from perceptions of distance and a lack of representation (among lower educated and lower income groups). The most important explanation, however, is individuals’ ideological positions. Ideologically extreme citizens perceive more bias in general – and when looking at directional bias, we find a large effect of the own ideological position on the direction of perceived bias: left- and right-leaning citizens tend to associate institutional actors with the opposite ideological side. This ‘hostile bias’ perception is strongest among those with more political interest, which is in line with findings on the hostile media effect which occurs mostly among the politically involved (Gunther et al., Reference Gunther, McLaughlin, Gotlieb and Wise2017).
To gauge the normative implications of bias perceptions, it is important to better understand how such perceptions come about. Bias perceptions are the product of the information people are exposed to, and the way in which they process this information. In case bias perceptions are rooted in information about and experiences with actual biases in how institutions function, and whether they actually do their work in an impartial manner, the fact that citizens critically monitor institutions and perceive such biases can be good news for democracy. In this respect, our finding that Polish citizens perceive a right-wing bias among civil servants at the time the PiS government indeed attempted to take control of these institutions suggests such a critical outlook. Notably, Poland is also the country where bias perceptions are least related to people’s own political positions, suggesting that these reflect perceptions that are more broadly shared across the citizenry. On the other hand, when institutions come under pressure of political attacks with strategic motives, bias perceptions may reflect a politicised dynamic rather than genuine concerns. Not only may citizens’ perceptions then echo ‘false’ accusations, their perceptions may also be shaped by their own political views. Future research should study whether variation in bias perceptions can be explained by actual levels of institutional bias or by the information context of citizens. In the latter case, bias perceptions could be steered by media coverage of (supposed) institutional bias as well as by elite cues. Systematically collecting data both on actual bias and on the politicisation of institutional bias by political and media actors are, therefore, important next steps for research on institutional bias perceptions.
Such systematic data could also enlighten the contextual differences we find in our study. On average, we find stronger bias perceptions in the United Kingdom and Spain, which may be explained by the information context (media coverage or elite cues on institutional bias). We further observe that in these contexts where more biases are perceived on the average, citizens tend to rely more on their own political position when evaluating biases in institutions. This aligns with evidence that in polarised political contexts, people tend to engage more in politically motivated reasoning (Druckman et al., Reference Druckman, Peterson and Slothuus2013). Further research could therefore also link contextual variation in bias perceptions to political supply side factors (e.g. levels of elite polarisation and the presence of left- and right-wing challenger parties). Finally, the link between affective polarisation and bias perceptions deserves closer attention in further research. The in-group/out-group dynamics that underlie affective polarisation (Iyengar et al., Reference Iyengar, Lelkes, Levendusky, Malhotra and Westwood2019) may spill over into individuals’ evaluations of institutions – making affectively polarised individuals more inclined to perceive institutional bias.
While overall we find a tendency to perceive a hostile bias, this finding did not hold for scientists and schoolteachers. Two different explanations for these findings deserve further research. First, these institutions may be less politicised and therefore may be evaluated more on factual grounds and less on the basis of political-directional motivations (Kunda, Reference Kunda1990). In the case of schoolteachers, their views may in fact be more left-leaning, and this may be accurately perceived by all citizens alike. Alternatively, research on source cues has shown that people may switch between defensive processing (i.e. seeing information as hostile) and biased assimilation (i.e. seeing information as acceptable) (Reid, Reference Reid2012) depending on whether they consider a source (here: institution) as part of their in-group. This may explain, for example, why left-wing people see scientists as left-wing too; potentially, they perceive these actors as ‘in-group’ and assimilate their views to their own. The correlational evidence presented in our study is not able to disentangle these fine-grained mechanisms – but experimental setups from a hostile media effects context (Gunther et al., Reference Gunther, McLaughlin, Gotlieb and Wise2017; Reid, Reference Reid2012) could be employed to tease them out in further research. More generally, differences in bias perceptions across institutions may exist because citizens consider impartiality more important for some institutions than for others, or because its meaning differs across institutions. For executive and order institutions, impartiality is associated with equal treatment under the law – a more tangible form of impartiality which can also be inferred from citizens’ direct experience. Meanwhile, for knowledge institutions, impartiality is associated with the pursuit of objective truth and knowledge or – from a more constructivist perspective – the balancing of various interpretations of the truth. In science, such objectivity can be assessed according to established academic standards of transparency and replicability – which might be relatively complex for citizens to evaluate. Future research could further theorise and test how the meaning of impartiality varies across institutions and whether perceived bias affects the overall assessment of these institutions differently depending on the type of institution.
As a first effort to map bias perceptions in public service institutions cross-nationally and cross-institutionally, we were forced to make some necessary choices that nonetheless carry limitations. First, we focused on bias along the political left-right dimension, which varies in meaning and salience across countries. Especially in Poland, as a post-communist country, the meaning of left-right appears less stable (Jahn, Reference Jahn2023) and therefore less useful to voters (Otjes and Rekker, Reference Otjes and Rekker2021), which may explain the weaker findings. Second, we limited our questions to perceptions of bias in actors working in institutions. To be sure, institutions and the actors working within these institutions are often conflated in public debate. Moreover, it is arguably less taxing for survey respondents to think of the ideological leaning of specific actors than it is to think of the political leaning of an institution as a whole. Ultimately, an institution’s ideological leaning is constituted by the ideological viewpoints of the people working in the institution. However, whether the political leaning of professionals affects the functioning of the public service institution they are working in is an empirical question. Further research that distinguishes perceptions of the ideological identity of professionals from perceptions of biased output or functioning of the institution is therefore called for. This would also open up avenues to study institutional bias perceptions along different ideological dimensions and towards different groups in society.
Finally, our study gives insight into the extent to which people perceive bias but does not address to what extent these bias perceptions affect citizens’ legitimacy concerns. It is possible that bias perceptions mirror the ideological leaning apparent in certain institutions (i.e. scientists being more culturally progressive, Van de Werfhorst, Reference Van de Werfhorst2020), but this does not affect people’s legitimacy perceptions. Conversely, seeing an institution as politically ‘neutral’ on the left-right scale could for some citizens (those at the left/right extremes) mean that they do not trust it to serve their ideological interests. Moreover, some citizens may interpret ‘neutrality’ as aligning with a centrist ideological position, rather than as a commitment to impartiality. A crucial follow-up question is therefore how perceived bias among actors in institutions affects perceived legitimacy – and whether citizens at different ideological positions penalise all perceived bias equally. If bias perceptions reflect genuine legitimacy concerns as a form of healthy democratic criticism, we would expect citizens to penalise any perceived bias – irrespective of its direction and irrespective of their own political views – by withdrawing their trust. Conversely, in light of our finding that citizens tend to associate institutional actors with a ‘hostile’ ideology, citizens may only be concerned about institutional legitimacy once they perceive a bias that is not in line with their own political views. Eventually, such ‘politicised’ perceptions of bias may contribute to further politicisation of institutions, and to societal polarisation around their perceived legitimacy, leading some groups of citizens to structurally distrust specific institutions. Further research is needed to examine whether and how perceptions of ideological bias drive public distrust in public service institutions, as this may herald a broader crisis of legitimacy of these essential institutions in our democracies.
Supplementary material
For supplementary material accompanying this paper visit https://doi.org/10.1017/S1475676525100194
Data availability statement
The LISS data (Netherlands) is publicly available from the LISS data archive. The datasets used for this study are ‘Public perceptions of bias in impartial institutions’ (https://doi.org/10.17026/dans-xt3-h48j and ‘Politics and Values Wave 14’ (https://doi.org/10.17026/dans-xnn-gs7b, which can be accessed after registration. The Yougov data (Germany, the United Kingdom, Spain, and Poland) as well as the code used for data preparation and analysis are available at OSF, https://osf.io/vyjcz/.
Acknowledgements
We thank the three anonymous reviewers for their excellent feedback on our manuscript. This work was supported by an ODISSEI LISS Panel Grant for data collection. Erika van Elsas further gratefully acknowledges the financial support of the Dutch Research Council (NWO Veni Grant Vl. Veni.211R.053, ‘From common ground to battleground? Public perceptions of bias in impartial institutions’).
Funding statement
Open access funding provided by Radboud University Nijmegen.




 Open access

