

Introduction
Solution-based processes are ubiquitous to many natural and industrial processes. However, the nanoscale details of solution processes are largely unknown because they are hard to explore using conventional characterization methods. A more direct approach for visualization and quantification of these processes is needed. Liquid phase transmission electron microscopy (TEM) is an imaging platform that enables visualizing these processes in real time by sandwiching ultrathin layer of the liquid specimen between electron transparent thin films and isolating the specimen from the high vacuum environment inside the microscope. Liquid phase TEM opens up opportunities to address long-lasting questions. How do solute atoms come together to form a solid phase?Reference De Yoreo and Vekilov1–Reference Loh, Sen, Bosman, Tan, Zhong, Nijhuis, Král, Matsudaira and Mirsaidov3 How do nanomaterials transform or assemble to form two-dimensional (2D) or three-dimensional (3D) macroscopic structures with unique properties?Reference Yang, Zeng, Kang, Betzler, Czarnik, Zhang, Ophus, Yu, Bustillo, Pan, Qiu, Wang and Zheng4–Reference Evers, Schins, Aerts, Kulkarni, Capiod, Berthe, Grandidier, Delerue, van der Zant, van Overbeek, Peters, Vanmaekelbergh and Siebbeles6 How do large macromolecular biological complexes form from the individual subunitsReference McManus, Charbonneau, Zaccarelli and Asherie7 and modify their structure to achieve specific functions?Reference Grimaldo, Roosen-Runge, Zhang, Schreiber and Seydel8 Liquid cell TEM is a powerful emergent platform to explore these and other physical, chemical, and biological processes in liquids through direct time-resolved nanoscale imaging.Reference de Jonge and Ross9,Reference Ross10
The quest for TEM imaging of materials in solution has a long history, with the first liquid cell reported in 1944.Reference Abrams and McBain11 The early efforts were made in imaging colloids,Reference Ruska12 protein crystals, and microorganisms.Reference Matricardi, Moretz and Parsons13–Reference Parsons15 However, in these early studies, the spatial resolution of the images was limited, and it was a significant challenge to keep liquids within the liquid cell inside the high vacuum microscope, hence, the liquid cells were often filled with water vapor.Reference Liao and Zheng16,Reference Ross17 Only recently, owing to advances in liquid cell fabrication, has it become possible to study a wide range of solution-based nanoscale processes that were previously out of reach, for instance, in situ imaging of electrodeposition in liquid electrolytes,Reference Williamson, Tromp, Vereecken, Hull and Ross18 colloidal nanoparticles growth,Reference Zheng, Smith, Jun, Kisielowski, Dahmen and Alivisatos19 cellular structures of whole cells in water,Reference de Jonge, Peckys, Kremers and Piston20 water nanodroplets dynamics,Reference Mirsaidov, Zheng, Bhattacharya, Casana and Matsudaira21 self-assembly of nanoparticles,Reference Luo, Smith, Ou and Chen22,Reference Tan, Chee, Lin and Mirsaidov23 growth of metal–organic frameworks,Reference Patterson, Abellan, Denny, Park, Browning, Cohen, Evans and Gianneschi24 and the assembly of macromolecules.Reference Wu, Friedrich, Patterson, Sommerdijk and de Jonge25 Combining liquid phase TEM studies with the advanced electron microscopy techniques, such as atomic-resolution imaging with aberration-corrected TEM, fast electron detection and mapping of chemical and electronic properties with energy-dispersive x-ray analysis (EDX) and electron energy-loss spectroscopy (EELS) have led to many new breakthroughs. For example, these methods have enabled resolving nucleation and early stages of nanoparticle growth with atomic resolution,Reference Zheng, Smith, Jun, Kisielowski, Dahmen and Alivisatos19 structure and chemistry of solid-electrolyte interphases (SEIs) during the electrodeposition of lithium,Reference Lee, Shangguan, Alvarado, Betzler, Harris, Doeff and Zheng26,Reference Zeng, Zhang, Bustillo, Niu, Gammer, Xu and Zheng27 and structure and bonding of liquids.Reference Jokisaari, Hachtel, Hu, Mukherjee, Wang, Konecna, Lovejoy, Dellby, Aizpurua, Krivanek, Idrobo and Klie28 In this theme issue of MRS Bulletin, we have invited experts in the field to provide topical reviews on recent achievements in liquid phase TEM and outline future directions. Since this is a fast-growing field, we expect more exciting new results to follow.
Development of liquid cells for TEM
The development of liquid cells, including the sample holders, is the foundation for the growth of liquid phase electron microscopy. Although the basic concept of liquid cell design can be attributed to early work where liquids were sandwiched between two nitrocellulose thin filmsReference Abrams and McBain11,Reference Abrams and McBain29 (Figure 1a), advances in liquid cell fabrication are largely responsible for the recent achievements in the field. The success of modern liquid cell fabrication benefits from the ability to produce durable thin membranes.Reference Williamson, Tromp, Vereecken, Hull and Ross18,Reference Zheng, Smith, Jun, Kisielowski, Dahmen and Alivisatos19
Liquid cells for transmission electron microscope (TEM) imaging. (a) The first liquid cell made using Pt supporting frames with nitrocellulose thin-film windows. (b) Microfabricated static and flow liquid cell sandwiches a thin layer (10–100 nm) of solution (light blue) containing either precursor solution and/or nanoparticles between two ultrathin (∼10–20 nm) SiNx membrane windows that are separated by a spacer. These liquid cells protect the encapsulated thin solution layer from the vacuum of the TEM. A camera underneath captures the dynamics of the nanoscale process occurring in the solution. (c) Static graphene liquid cell sandwiches nanodroplet pockets of precursor solution between the two graphene layers. Reprinted with permission from Reference 39. © 2012 Springer Nature. (d) TEM grids with amorphous carbon film or other types of 2D films (e.g., BN and MoS2, can be used to make a simple static liquid cell). (e) Hybrid organic/inorganic liquid cell nanocapsule with liposome bilayers coated with a thin layer of gold.
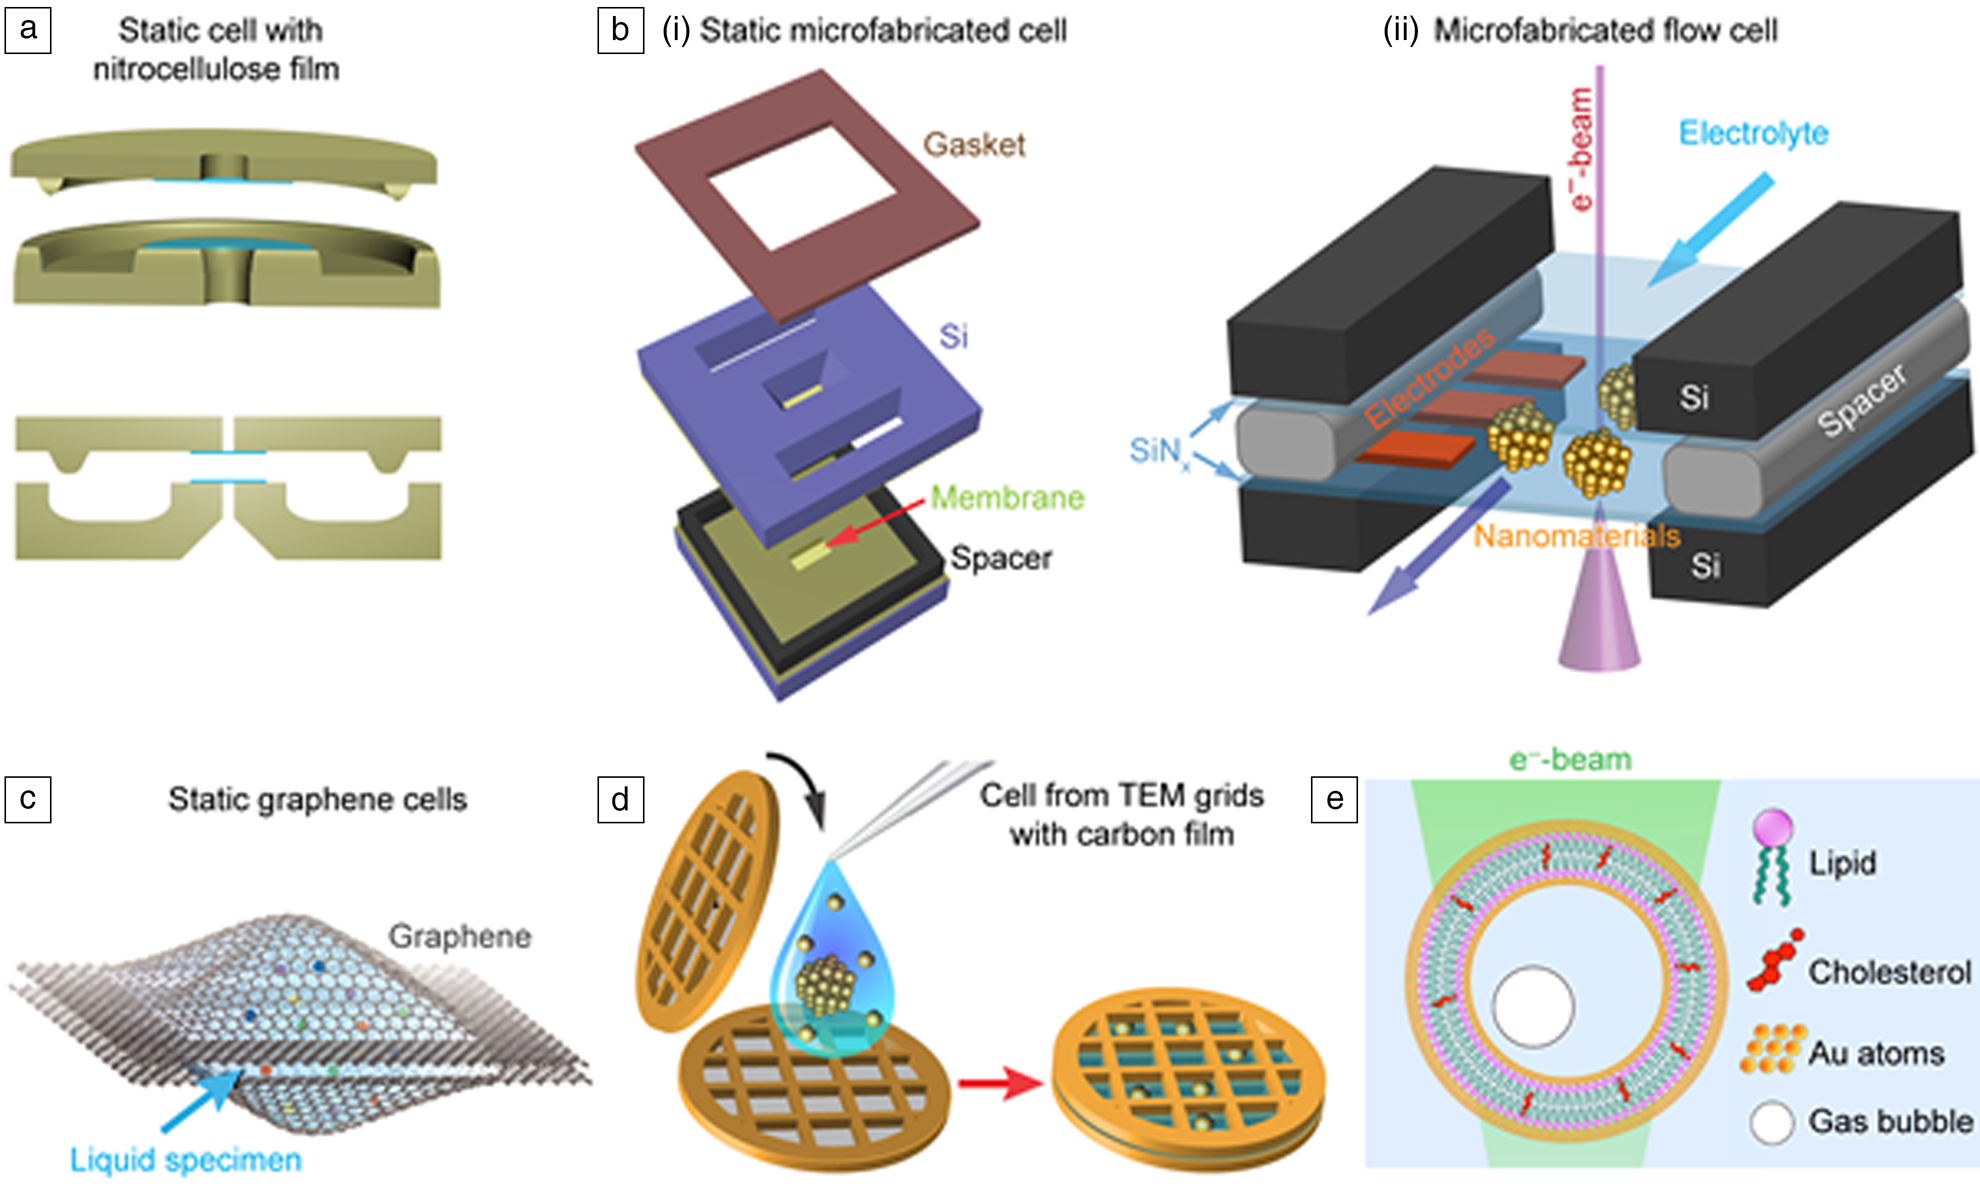
Many liquid cells today are made using silicon nitride (SiNx) membranes obtained from silicon microfabrication processes. The key advantages of microfabricated liquid cells with SiNx membrane windows are that the thin (∼10–50-nm thick) SiNx membranes windows are robust, and they induce limited background scattering during the imaging. In addition, they can be reliably mass-produced because they are produced by standard wafer-scale microfabrication techniques.Reference de Jonge and Ross9,Reference Niu, Liao and Zheng30 SiNx liquid cells can have multiple capabilities, such as multiline-flow, specimen heating, and electrochemical biasing (Figure 1b).Reference Ross10,Reference Ross17 These capabilities allow probing chemical reactions triggered by the mixing of multiple reactants,Reference Patterson, Abellan, Denny, Park, Browning, Cohen, Evans and Gianneschi24,Reference Nielsen, Aloni and De Yoreo31–Reference Patterson, Parent, Cantlon, Eickhoff, Bared, Evans and Gianneschi33 explore nanoparticle growthReference Chee, Tan, Baraissov, Bosman and Mirsaidov32,Reference Tan, Bisht, Anand, Bosman, Yong and Mirsaidov34–Reference Smith, Parent, Overholts, Beaucage, Bisbey, Chavez, Hwang, Park, Evans, Gianneschi and Dichtel37 at elevated temperatures, and the nanoscale details of electrochemical processes related to batteries.Reference Lee, Shangguan, Alvarado, Betzler, Harris, Doeff and Zheng26,Reference Mehdi, Qian, Nasybulin, Park, Welch, Faller, Mehta, Henderson, Xu, Wang, Evans, Liu, Zhang, Mueller and Browning38
Other types of membranes, for example, graphene or other 2D materials, have been used for liquid cell fabrication, where small pockets of solutions are encapsulated between two 2D films.Reference Yuk, Park, Ercius, Kim, Hellebusch, Crommie, Lee, Zettl and Alivisatos39 These ultrathin membranes significantly reduce electron scattering and improve image contrast. Especially, graphene liquid cells (Figure 1c) have the benefit of reducing radiation damage by conducting high-energy electrons more effectively.Reference Wang, Qiao and Shokuhfar40,Reference Keskin and de Jonge41 Different types of 2D materials, such as boron nitride (BN) and MoS2, offer unique advantages when they are used in liquid cell window materials. For instance, a BN membrane has minimum background absorption, ideal for analytical studies,Reference Jokisaari, Hachtel, Hu, Mukherjee, Wang, Konecna, Lovejoy, Dellby, Aizpurua, Krivanek, Idrobo and Klie28 and MoS2 can be the functional membrane for the study of heterostructures.Reference Yang, Choi, Sheng, Jung, Bustillo, Chen, Lee, Ercius, Kim, Warner, Chan and Zheng42 The ultrathin membrane liquid cells allow imaging of biological,Reference Keskin and de Jonge41,Reference Park, Park, Ercius, Pegoraro, Xu, Kim, Han and Weitz43 or electron-beam sensitive materials with improved spatial resolution.Reference de Jonge and Ross9 It also important to mention that liquid cells assembled from commercial TEM grids with thin amorphous carbon or even 2D films have also been used recently (Figure 1d).Reference Zhu, Liang, Song, Zhou, Wang, Shan, Shi, Hao, Yin, Zhang, Liu, Zheng and Sun44,Reference Wang, Peng, Abelson, Xiao, Qian, Yu, Ophus, Ercius, Wang, Law and Zheng45 The advantage of these cells made from commercial TEM grids is that they are easy to fabricate, and they drastically reduce the entry barrier for researchers to start using liquid phase TEM in their studies. Other developments include polymeric or hybrid organic–inorganic nanocapsules (Figure 1e).
Application areas of liquid phase TEM
The ability to resolve key scientific questions in various areas of research is the main catalyst for the rapid growth of liquid phase TEM. Here, we highlight three areas of application. First, the most prominent application of liquid phase electron microscopy is the study of colloidal nanoparticle nucleation and growth, which has attracted significant interest among chemists as well as materials scientists. The article by Chen et al.Reference Chen, Yuk, Hauwiller, Park, Dae, Kim and Alivisatos46 in this issue of MRS Bulletin discusses some of the important advances in this topic. Second, liquid phase TEM has been applied to reveal nanoscale electrochemical processes through the development of electrochemical liquid cells, for example, the electrodeposition of metals, and solid-electrolyte interphases related to batteries. This opens up opportunities to impact this important area of applied research. Unocic et al.Reference Unocic, Jungjohann, Layla, Browning and Wang47 review some of the notable developments and outlines future directions in this area of research in their article in the issue. Third, it has been a great challenge to use liquid phase TEM to study soft materials or biological macromolecular complexes due to electron beam damage and low contrast in imaging low-Z materials. The articles by Parent et al.Reference Parent, Vratsanos, Biao, De Yoreo and Gianneschi48 and Peckys et al.Reference Peckys, Macias-Sánchez and de Jong49 survey some significant advances in these areas of application.
The key challenges in liquid phase TEM imaging arise from electron-beam artefacts and damage to the system of study. To minimize electron-beam effects, low electron flux and dose imaging can be the most effective route, which requires sensitive detectors. Recent advances in new CMOS-based direct electron detectors now enable us to record at milliseconds times resolution or higher,Reference Chee, Anand, Bisht, Tan and Mirsaidov50,Reference Liao, Zherebetskyy, Xin, Czarnik, Ercius, Elmlund, Pan, Wang and Zheng51 and at lower electron fluxes, owing to their higher sensitivity,Reference Li, Mooney, Zheng, Booth, Braunfeld, Gubbens, Agard and Cheng52 which significantly reduces the effect of the beam on the observed process. Electron-beam effects can be complex, and there have been efforts in uncovering the mechanisms of electron-beam damage. More details can be found in the article by Woehl et al.Reference Woehl, Moser, Evans and Ross53 in this issue.
Finally, the analytical ability for advanced characterization of nanoscale chemistry, structure, and molecular bonding is critical for solution-based processes. The article in this issue by Ercius et al.Reference Ercius, Hachtel and Klie54 describes some recent studies that have leveraged EELS and other advanced methods such as four-dimensional (4D)-STEM, tomography.
In the following, we highlight some recent achievements in some of these topical areas and provide our view of the challenges and opportunities in liquid phase TEM.
In situ TEM for nucleation, growth, and self-assembly of nanoparticles
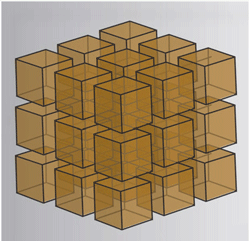
In nature, hierarchical structures form from individual building blocks of different length scales (Figure 2a). Atoms and molecules come together to form crystalline or amorphous nuclei from which materials grow.Reference De Yoreo and Vekilov1,Reference Whitesides and Boncheva55 Similarly, individual nanoparticles and biomolecular complexes can assemble into functional materials with new properties, devices, and cellular complexes.Reference Whitesides and Grzybowski56 For instance, biological molecules assemble into macromolecular complexes such as viruses or cellular organelles.Reference Misteli57,Reference Bruinsma, Gelbart, Reguera, Rudnick and Zandi58 The details of many of these solution-based processes have eluded us for years because conventional methods used for studying these processes are often blind to transient stages driving the assembly of these building blocks; conventional spectroscopic methods cannot track the growth and assembly trajectories of individual nanomaterials. In situ liquid cell TEM provides an ideal platform to reveal the elusive details of processes occurring at these blindspots.Reference Ross10
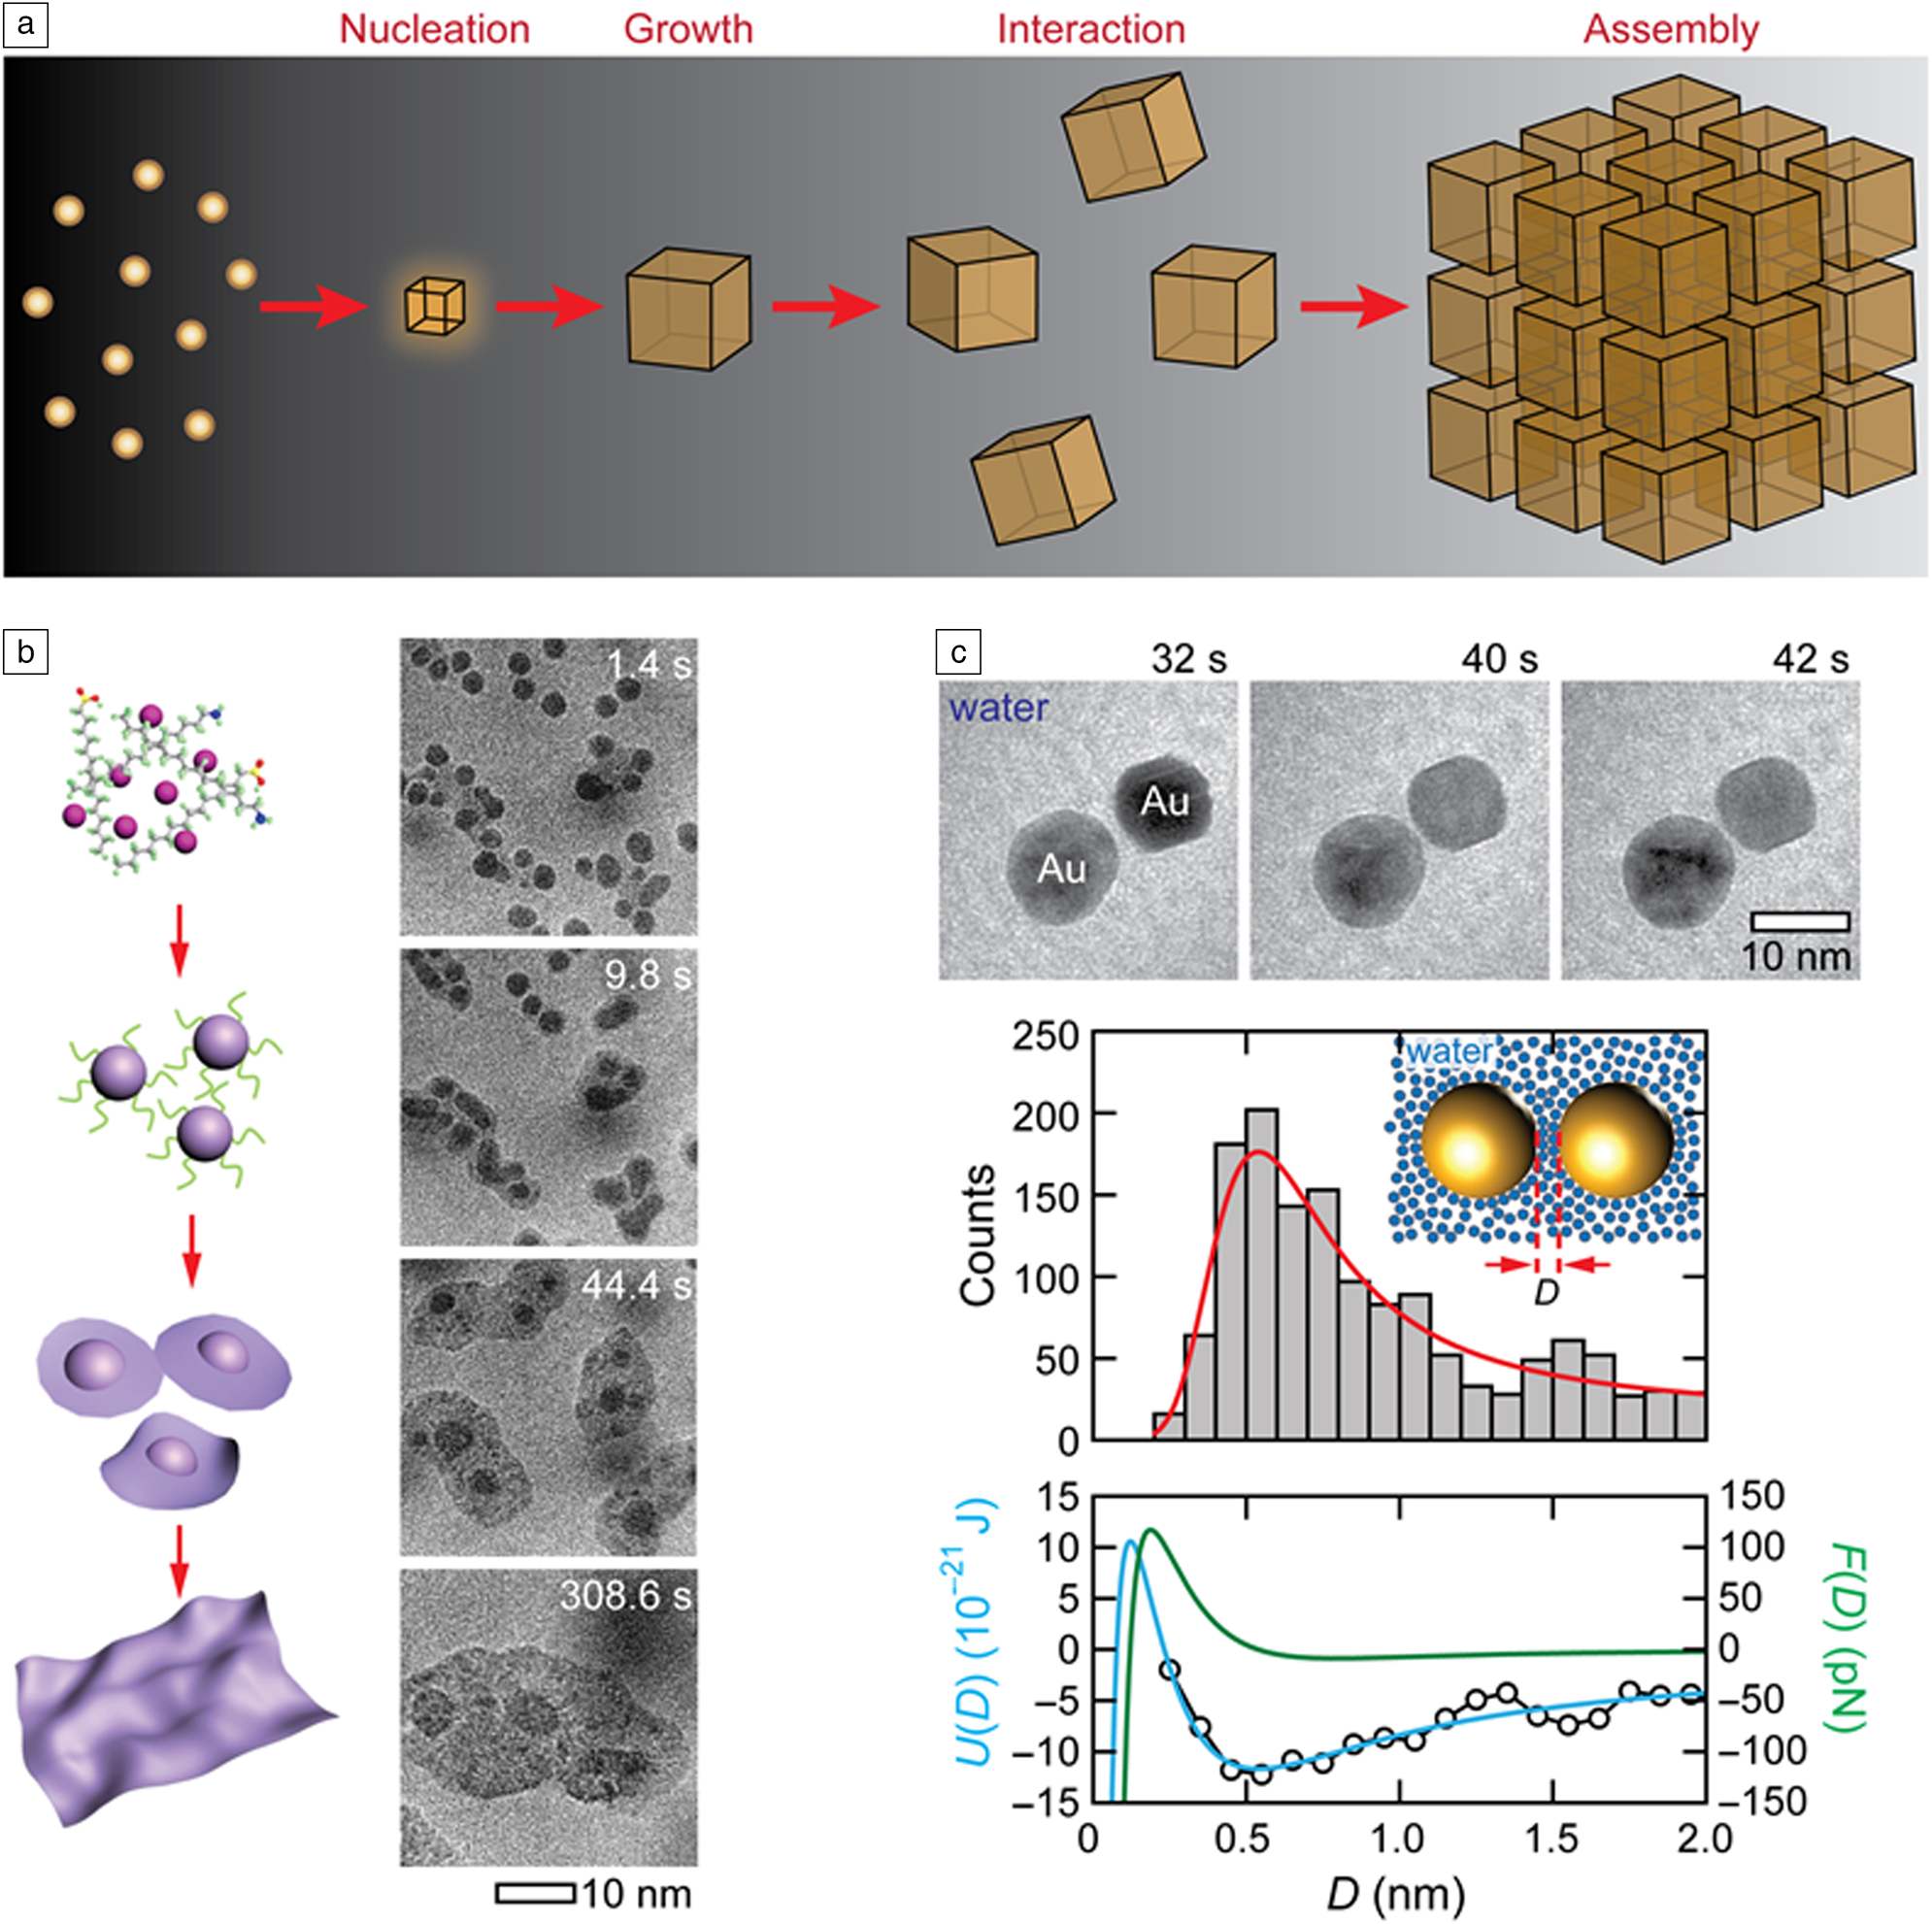
(a) Hierarchical organization of structures from atoms to crystalline nanoparticles via nucleation and growth and to nanoparticle assemblies via interaction of nanoparticles in a solution, all of which can be directly visualized using liquid cell transmission electron microscopy (TEM). (b) Schematic (left) and sequential TEM images (right) showing the formation of a 2D cobalt nickel oxide nanosheet from a molecular precursor solution with the pathway of 3D nanoparticle growth followed by 3D-to-2D transformations. Reprinted with permission from Reference 4. © 2019 Springer Nature. (c) Top: Time-series images of two Au nanoparticles interacting in water. Middle: Distribution of pairwise separation distances for Au nanoparticle pairs and corresponding Boltzmann distribution fit (red curve). Bottom: Pairwise interaction energy (open black circles) obtained from the distributions above and corresponding fits displaying the interaction energy (blue curve) and force (green curve). Reprinted with permission from Reference 69. © 2016 American Chemical Society.
One of the hallmark applications of in situ liquid cell TEM is its role in expanding our understanding of crystal nucleation and growth.Reference Loh, Sen, Bosman, Tan, Zhong, Nijhuis, Král, Matsudaira and Mirsaidov3,Reference Zheng, Smith, Jun, Kisielowski, Dahmen and Alivisatos19,Reference Patterson, Abellan, Denny, Park, Browning, Cohen, Evans and Gianneschi24,Reference Nielsen, Aloni and De Yoreo31,Reference Woehl, Evans, Arslan, Ristenpart and Browning59–Reference Yang, Koo, Kim, Jeon, Choi, Kwon, Kim, Kim, Lee, Lee, Lee, Hyeon, Ercius and Park61 Direct imaging of these processes has revealed the sequence of steps involved in the crystallization of solids from solution and highlighted the fact that there is more than one pathway for crystals to nucleate and grow. These pathways include classical pathways where the nucleus of a critical size that can sustain growth forms from a solution in a single step,Reference Woehl, Evans, Arslan, Ristenpart and Browning59 or multistep pathways where the precursor solution phase-separates into solute-rich and solute-poor regions, followed by condensation of the solute-rich region into an amorphous prenucleation cluster which then crystallizes into a nanocrystal.Reference Loh, Sen, Bosman, Tan, Zhong, Nijhuis, Král, Matsudaira and Mirsaidov3,Reference Nielsen, Aloni and De Yoreo31 Visualization of these crystallization processes have also revealed the important role of the solvent in all these processes.
Because in situ liquid cell TEM enables tracking the evolution of individual nanocrystals in a solution, it is also instrumental in establishing the details of post-nucleation growth. As an example, some of these studies directly showed that along with the expected growth by monomer addition, the growth of nanocrystals is also aided by the Ostwald ripening processReference Xin and Zheng62 (i.e., larger more stable nanoparticles grow at the expense of smaller ones that dissolve in the solution, and direct coalescence of multiple nanocrystals).Reference Zheng, Smith, Jun, Kisielowski, Dahmen and Alivisatos19,Reference Li, Nielsen, Lee, Frandsen, Banfield and De Yoreo63–Reference Aabdin, Lu, Zhu, Anand, Loh, Su and Mirsaidov65 While some of these growth processes can be expected from theory and microscopic studies, in situ liquid cell TEM has been “instrumental” in extending these observations to the nanoscale. Because processes at the nanoscale often diverge from our micro- and macroscopic understanding, liquid cell TEM studies often lead to the discovery of unexpected growth pathways. For example, Yang et al. recently identified that the growth of 2D metal oxide sheets occurs through nucleation of intermediate nanoparticles which transform into nanosheets, which then continue their growth into a larger sheet through coalescence (Figure 2b).Reference Yang, Zeng, Kang, Betzler, Czarnik, Zhang, Ophus, Yu, Bustillo, Pan, Qiu, Wang and Zheng4
The next growth stage in the formation of hierarchical structures that follows the nucleation and growth of nanocrystals is the organization of these crystals into assemblies. Here, a liquid cell TEM approach plays a critical role in identifying how these nanocrystals interact and assemble in a solution and how the solvent mediates these interactions.Reference Luo, Smith, Ou and Chen22,Reference Tan, Chee, Lin and Mirsaidov23 The colloidal interactions in solution are commonly described by the Derjaguin–Landau–Verwey–Overbeek theory, which accounts for electrostatic and van der Waals interactions.Reference Min, Akbulut, Kristiansen, Golan and Israelachvili66,Reference Silvera Batista, Larson and Kotov67 This model, however, does not adequately capture the interaction between the nanocrystals, because it ignores the discrete nature of the solvent molecules, hydrophobic interactions, the effect of the varying interaction strength between the different crystal planes and the role of the ligands capping these nanocrystals surfaces; all of which play an important role in how nanoparticles interact with each other in a solution.Reference Min, Akbulut, Kristiansen, Golan and Israelachvili66,Reference Silvera Batista, Larson and Kotov67 Furthermore, since many of these interactions between the nanoparticles are nonadditive, it makes predicting the route and the outcome of the assembly process challenging.Reference Silvera Batista, Larson and Kotov67 Liquid cell TEM studies not only reveal how nanoparticles interact to form assemblies but also enable quantifying and distinguishing between different interactions by accounting for electrostatic interactions, hydration shells surrounding the nanoparticles, ligands, molecular linkers between the nanoparticles, and many others (Figure 2c).Reference Zhu, Liang, Song, Zhou, Wang, Shan, Shi, Hao, Yin, Zhang, Liu, Zheng and Sun44,Reference Chen, Cho, Manthiram, Yoshida, Ye and Alivisatos68–Reference Miele, Raj, Baraissov, Král and Mirsaidov74
Finally, because there is a qualitative similarity between how nanoparticles and how atoms interact in a solution, insights from the nanoparticle self-organization, which are easier to track due to their sizes being larger than the size of individual atoms, can help to better understand how atoms crystallize into matter.Reference Ou, Wang, Luo, Luijten and Chen5
Biological and soft materials
The application of liquid phase TEM to soft-matter science and biological materials poses some unique challenges.Reference Wu, Friedrich, Patterson, Sommerdijk and de Jonge25 In general, the structures and dynamic events of interest are inherently sensitive to small changes in the free-energy landscape.Reference van der Gucht75,Reference Hamley76 Performing liquid phase TEM experiments will shift the free-energy landscape of the sample through the introduction of surfaces (the liquid cell windows) and the application of the electron beam.Reference Woehl and Abellan77–Reference Schneider, Norton, Mendel, Grogan, Ross and Bau79 In addition to these inherent effects, soft-matter chemistry often involves controlled manipulation of the free-energy landscape to create the structure of interest, and it can be extremely challenging to recreate these conditions inside the liquid cell.
For example, mixing two solutions or the application of heat are perhaps the two simplest and most common ways to shift the energy landscape when performing soft-matter chemistry in the laboratory (here referred to as in-flask experiments). While these experiments can be performed inside the liquid cell (here referred to as in situ experiments),Reference Wu, Friedrich, Patterson, Sommerdijk and de Jonge25,Reference Nielsen, Aloni and De Yoreo31,Reference Patterson, Parent, Cantlon, Eickhoff, Bared, Evans and Gianneschi33,Reference van Omme, Wu, Sun, Beker, Lemang, Spruit, Maddala, Rakowski, Friedrich, Patterson and Pérez Garza36,Reference Smith, Parent, Overholts, Beaucage, Bisbey, Chavez, Hwang, Park, Evans, Gianneschi and Dichtel37,Reference Ianiro, Wu, van Rijt, Vena, Keizer, Esteves, Tuinier, Friedrich, Sommerdijk and Patterson80,Reference Stawski, Roncal-Herrero, Fernandez-Martinez, Matamoros-Veloza, Kröger and Benning81 precise control of the mixing process inside the cell remains challenging, and the specimen heating can significantly alter electron-beam–sample interactions. Consequently, in liquid phase TEM experiments of soft and biological matter, it is certain that the free-energy landscape will be different for in situ and in-flask experiments. Therefore, it is reasonable to ask which features of in situ observations are representative of the in-flask structure and dynamics. Providing a definitive method for answering this question is a challenge that must be overcome for liquid phase TEM to find its place in the areas of soft and biological sciences. While this has not been fully realized, there have been significant efforts made, yielding impressive insights into the structure and dynamics of soft and biological matter.Reference Wu, Friedrich, Patterson, Sommerdijk and de Jonge25,Reference Kun, Tolou and Reza82
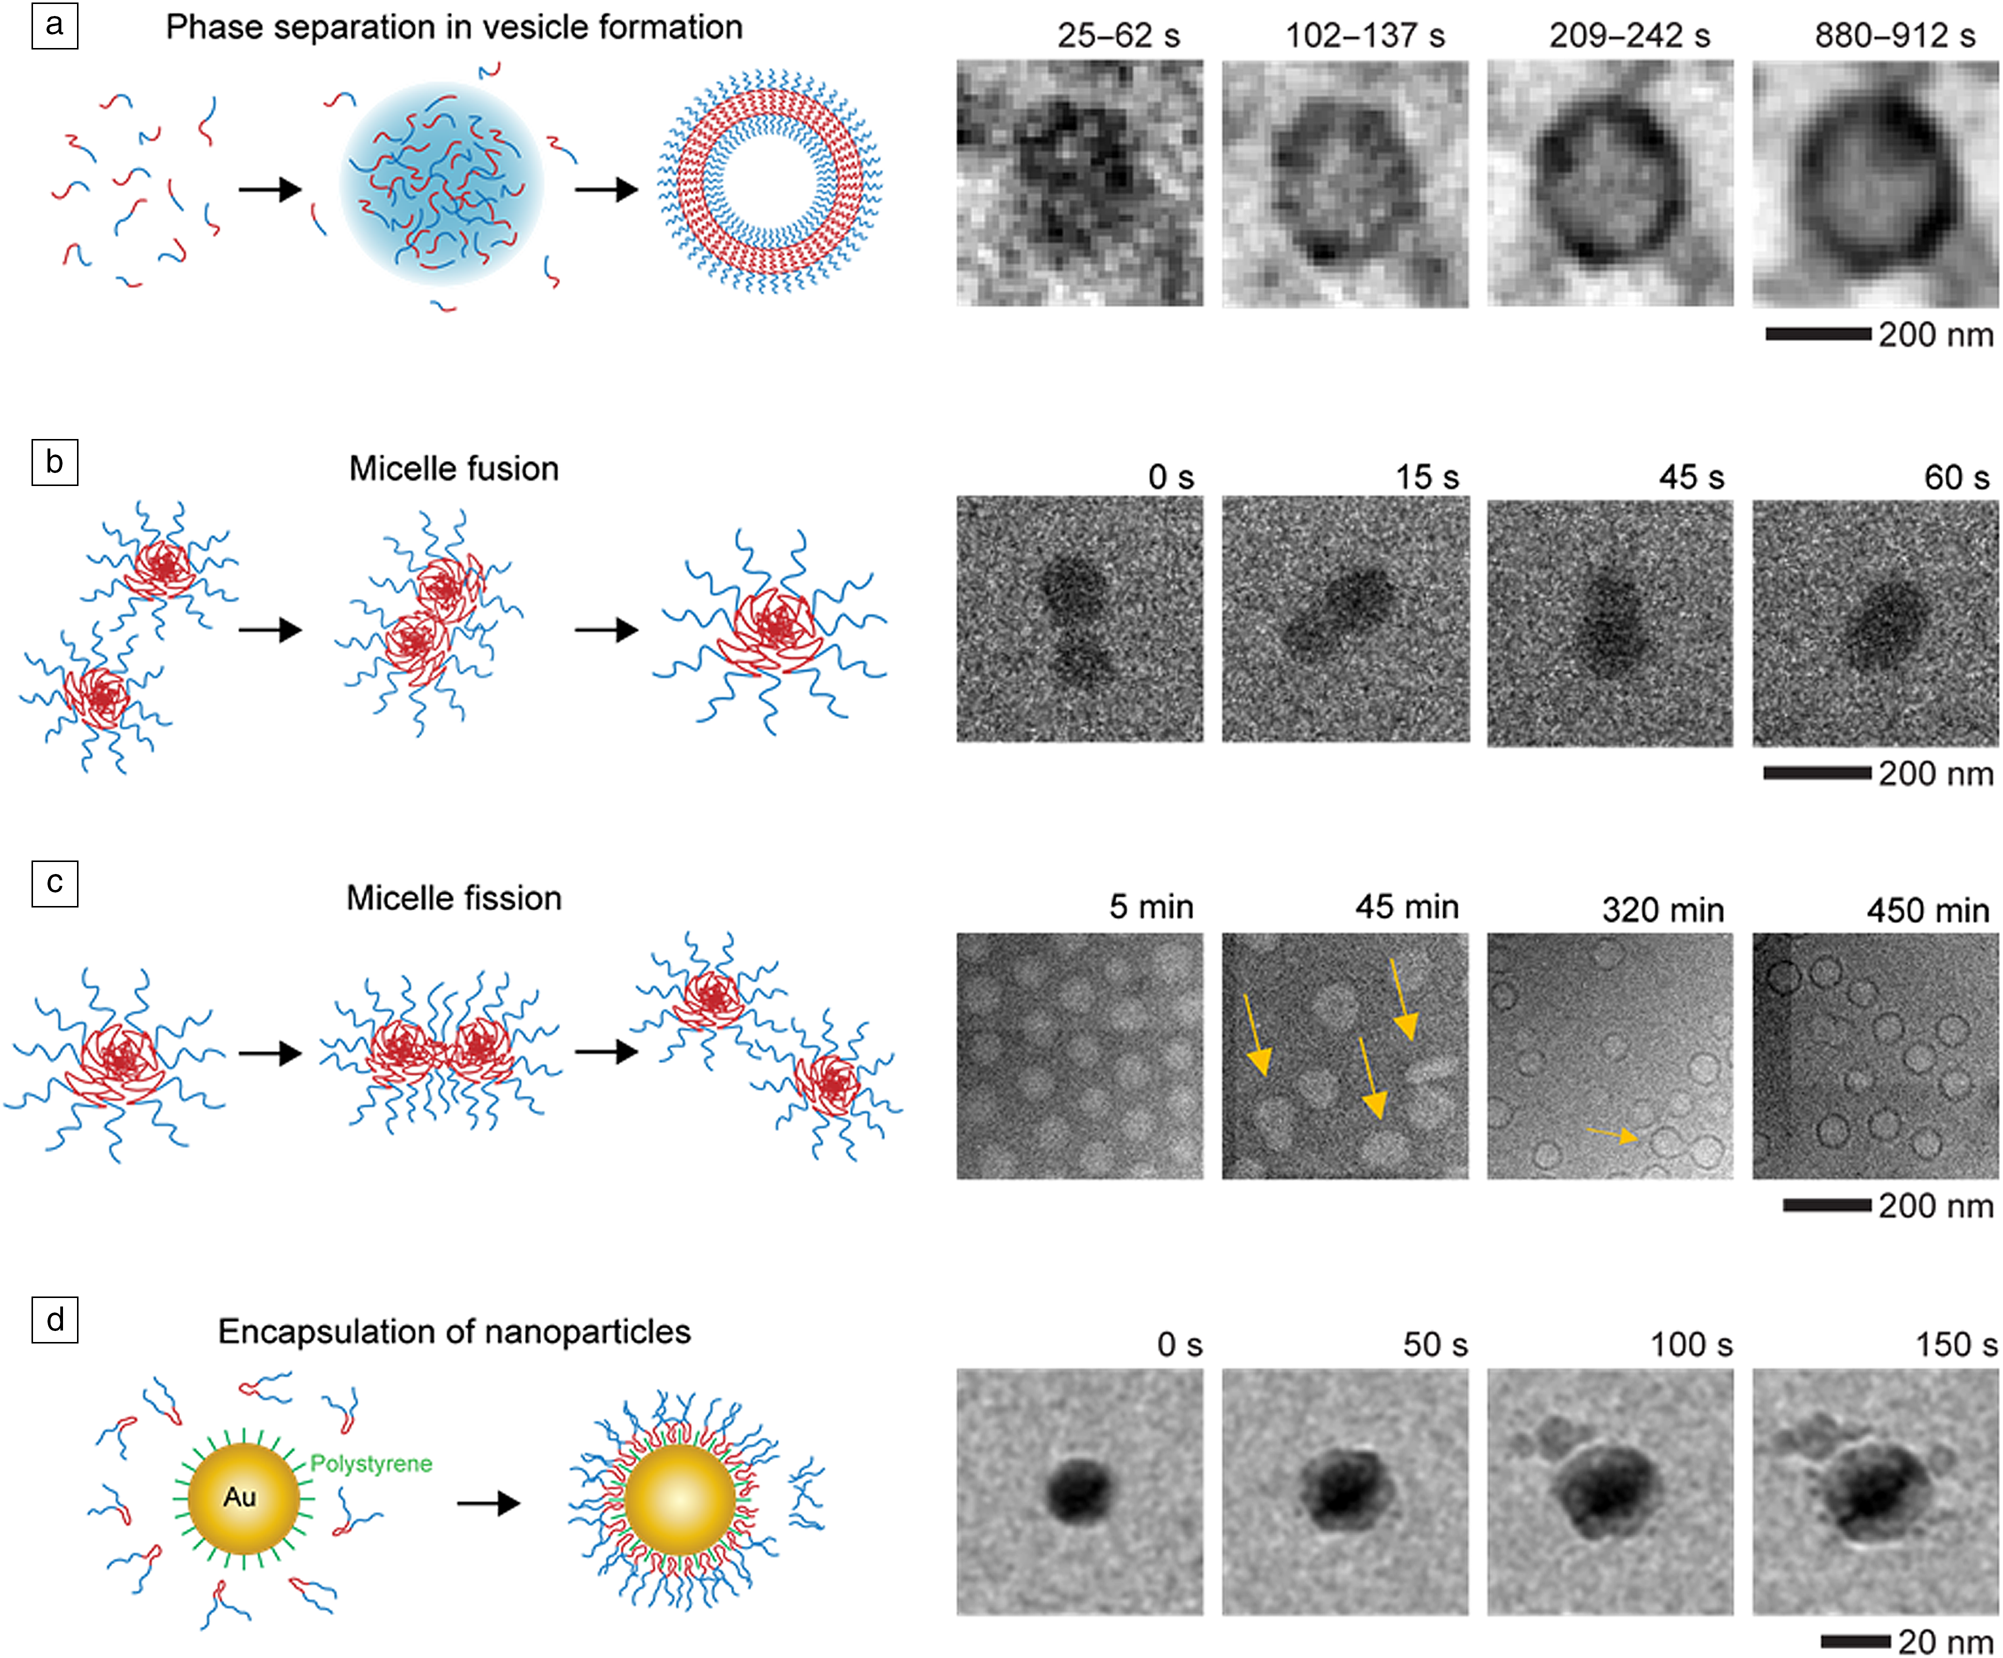
The self-assembly of block copolymers is an important process in soft-matter science as it can generate complex functional structures that find application in medicine and catalysis.Reference Mai and Eisenberg83,Reference Epps and O'Reilly84 Despite being studied for decades, there have been great challenges in understanding the role that phase separation,Reference Ianiro, Wu, van Rijt, Vena, Keizer, Esteves, Tuinier, Friedrich, Sommerdijk and Patterson80 particles fusionReference Parent, Bakalis, Ramírez-Hernández, Kammeyer, Park, de Pablo, Zerbetto, Patterson and Gianneschi85 and fission,Reference Early, Yager and Lodge86 and encapsulationReference Li, Tho, Galaktionova, Chen, Král and Mirsaidov87 play in the formation of complex structures.Reference Kelley, Murphy, Seppala, Smart, Hann, Sullivan and Epps88,Reference Jain and Bates89 Liquid phase TEM has provided great insights into these processes through direct observations and quantitative analysis of the events in solution (Figure 3).Reference Ianiro, Wu, van Rijt, Vena, Keizer, Esteves, Tuinier, Friedrich, Sommerdijk and Patterson80,Reference Parent, Bakalis, Ramírez-Hernández, Kammeyer, Park, de Pablo, Zerbetto, Patterson and Gianneschi85–Reference Li, Tho, Galaktionova, Chen, Král and Mirsaidov87
Liquid phase transmission electron microscope imaging of block-copolymer assembly. (a) Phase separation during vesicle formation. Reprinted with permission from Reference 80. © 2019 Springer Nature. (b) Micelle fusion. Reprinted with permission from Reference 85. © 2017 American Chemical Society. (c) Micelle fission. Reprinted with permission from Reference 86. © 2020 American Chemical Society. (d) Nanoparticle encapsulation. Reproduced from Reference 87. © 2019 Royal Society of Chemistry.
Importantly, these observations were supported by complementary methods that help to address the question of “which features are representative,” but also provide additional information to interpret the observed dynamics. Molecular dynamics simulations,Reference Parent, Bakalis, Ramírez-Hernández, Kammeyer, Park, de Pablo, Zerbetto, Patterson and Gianneschi85,Reference Li, Tho, Galaktionova, Chen, Král and Mirsaidov87 provide molecular-level details, which are not possible to obtain for soft matter, Gibbs free-energy calculations,Reference Ianiro, Wu, van Rijt, Vena, Keizer, Esteves, Tuinier, Friedrich, Sommerdijk and Patterson80 provide information on the thermodynamic driving forces, and x-ray scattering experiments,Reference Early, Yager and Lodge86 provide information that is statistically robust. The goal with these combined experiments is to extract mechanistic insights that are consistent with both data sets and thereby provide robust conclusions. In addition to these examples, the articles in this issue discuss how liquid phase TEM can be used to bridge knowledge gaps in many other soft and biological materials systems.
Nanoscale electrochemistry
Liquid phase TEM has emerged as a key technique to understand the nature of solid–liquid interfaces, especially the electrochemical phenomena at electrode–electrolyte interfaces. Electrochemical liquid cells with microelectrodes deposited onto SiNx membrane windows have been utilized to study nanoscale electrochemical processes. The direct observations of electrochemical reactions have also been combined with simultaneous structural/chemical analysis. Thereby, the mechanisms of a wide range of electrochemical processes have been unveiled. For example, the study of electrodeposition of metals, such as Cu, Ni, Au, Pb, and Pd, have provided insights into the fundamental nucleation and growth due to nanoscale electrochemistry.Reference Williamson, Tromp, Vereecken, Hull and Ross18,Reference Radisic, Vereecken, Searson and Ross90–Reference White, Singer, Augustyn, Hubbard, Mecklenburg, Dunn and Regan95 The electrochemical liquid cell TEM has also made it possible to quantitatively interpret electrocatalysisReference Zhu, Prabhudev, Yang, Gabardo, Botton and Soleymani96,Reference Beermann, Holtz, Padgett, de Araujo, Muller and Strasser97 and materials degradationReference Schilling, Janssen, Zaluzec and Burke98,Reference Chee, Pratt, Hattar, Duquette, Ross and Hull99 by applying an electric potential to electrodes or using an open-circuit potential. Many studies contribute to the understanding of electrochemical degradation of materials.Reference Chee, Tan, Baraissov, Bosman and Mirsaidov32,Reference Tan, Chee, Baraissov, Jin, Tan and Mirsaidov35,Reference Joo Kim, Seong Dae, Yeol Park, Yong Lee and Min Yuk100–Reference Chee, Duquette, Hull and Ross122
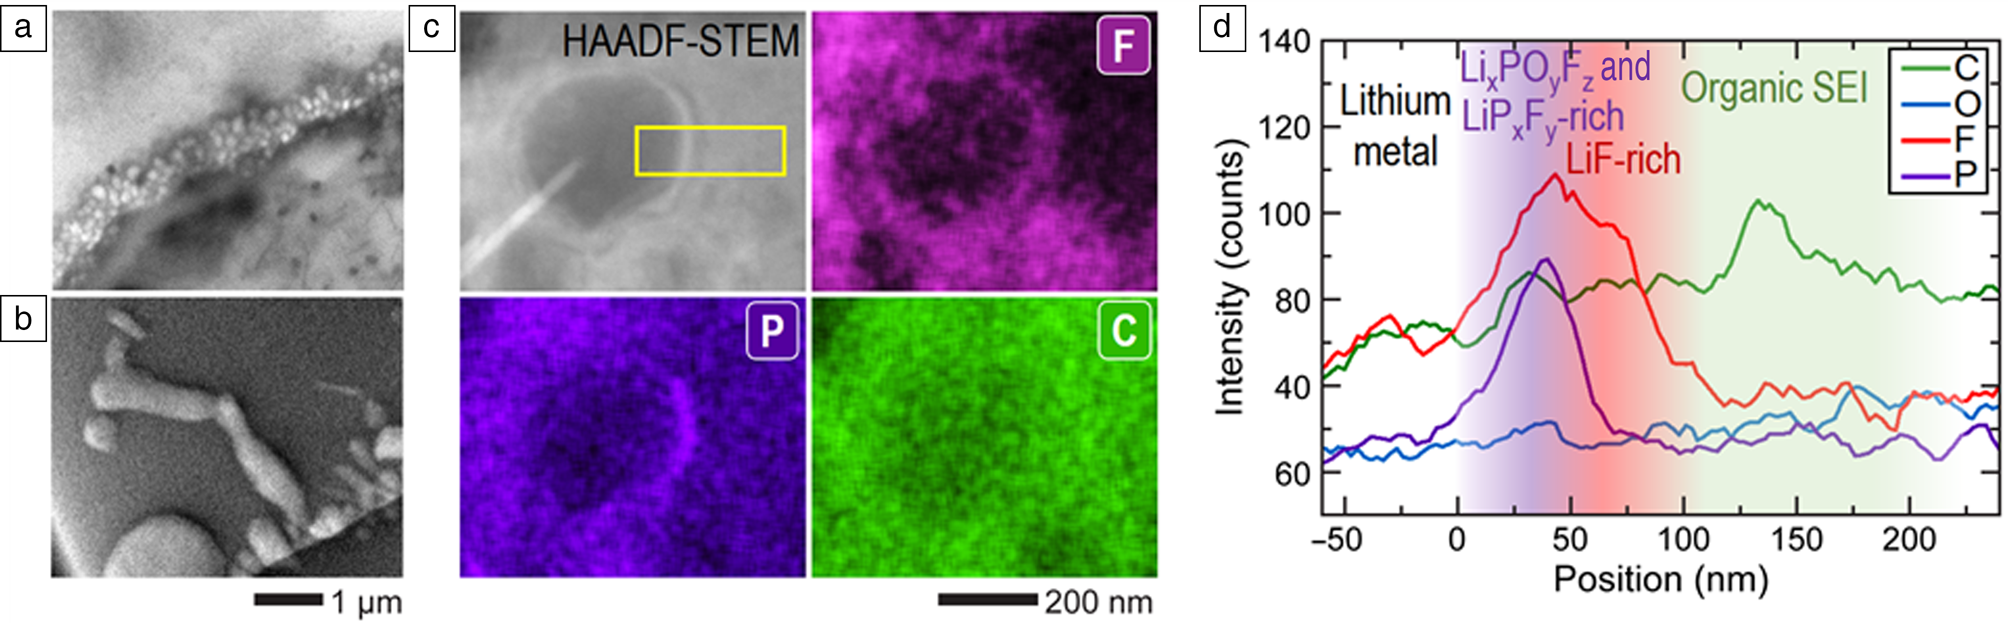
The development of electrochemical cell TEM offers significant advantages for the study of electrochemical processes related to batteries, especially by using the commercial liquid electrolytes used in lithium-ion batteries,Reference Zeng, Zhang, Bustillo, Niu, Gammer, Xu and Zheng27,Reference Kushima, Li, Koido, Fujiwara, Kusumi and Kuriyama123–Reference Hou, Han, Liu, Yang, Huang, Fujita, Hirata and Chen131 Li/Na metal plating and stripping,Reference Lee, Shangguan, Alvarado, Betzler, Harris, Doeff and Zheng26,Reference Mehdi, Qian, Nasybulin, Park, Welch, Faller, Mehta, Henderson, Xu, Wang, Evans, Liu, Zhang, Mueller and Browning38,Reference Zeng, Barai, Lee, Yang, Zhang, Zheng, Liu, Bustillo, Ercius, Guo, Cui, Srinivasan and Zheng132–Reference Leenheer, Jungjohann, Zavadil, Sullivan and Harris136 and solid-electrolyte interphase (SEI) formationReference Lee, Shangguan, Alvarado, Betzler, Harris, Doeff and Zheng26,Reference Sacci, Dudney, More, Parent, Arslan, Browning and Unocic137–Reference Unocic, Sun, Sacci, Adamczyk, Alsem, Dai, Dudney and More140 at the nanoscale. These studies provide insights into the reaction mechanisms of next-generation rechargeable batteries. For example, a recent study showed a remarkable leap in the capability of liquid phase TEM in revealing spatially resolved SEI chemistry on lithium nanograin deposits (Figure 4).Reference Patterson, Abellan, Denny, Park, Browning, Cohen, Evans and Gianneschi24 It has been a great challenge to study SEI and lithium growth due to the experimental difficulties originating from the vulnerability to air or moisture exposure in post-processing. This work reported the in situ observation of the suppression of lithium dendritic growth arising from a cationic polymer coating (Figure 4a). By correlating the lithium growth and the SEI chemistry (Figure 4b–d),Reference Lee, Shangguan, Alvarado, Betzler, Harris, Doeff and Zheng26 the mechanisms of lithium dendrite suppression through modification SEI chemistry have been uncovered.
Electrochemical liquid cell transmission electron microscopy (TEM) for lithium plating. (a, b) TEM images of lithium nanogranules and lithium dendrites in situ grown in a bare cell and a cationic polymer film coated cell. (c) High-angle annular dark-field (HAADF) scanning TEM (STEM) image and corresponding STEM-energy-dispersive x-ray (EDX) elemental maps of an in situ grown lithium nanogranule showing spatially resolved solid-electrolyte interphase chemistry, which clearly identifies the distributions of F, P, and C. (d) EDX line-scan profile of the lithium nanogranule corresponding to the marked region in the HAADF-STEM image in (c). Plots show both P and F signals are the most intense near the lithium nanogranule surface. P was concentrated in the 0–50 nm inner layer, while F was more broadly distributed in the 0–100 nm layer of the solid-electrolyte interphase (SEI). A slightly higher concentration of C and O was found 100–200 nm above the nanogranule surface. Reproduced with permission from Reference 26. © 2020 Royal Society of Chemistry.
Optimization of the electron-beam flux is crucial to limit its effects on electrochemical reactions while maintaining the spatial/temporal resolution. The excellent spatial/temporal resolution of TEM has not been fully utilized in the current electrochemical liquid cell TEM. In the future, low-dose imaging and other advanced TEM techniques, including 4D-STEM techniques or imaging with fast electron detectors, are necessary for breakthroughs. In addition, innovative cell designs will open opportunities for broadening the applications of electrochemical liquid cell TEM.
Conclusions and future opportunities
In situ liquid cell TEM is a powerful metrology tool that can catalyze many future discoveries in both materials and life sciences. Although significant achievements have already been made, there remain many challenges for liquid cell TEM that need to be addressed. For example, minimizing the effects of the electron beam on the imaged processes is one of the important ones.Reference Chee, Anand, Bisht, Tan and Mirsaidov50,Reference Schneider, Norton, Mendel, Grogan, Ross and Bau79,Reference Grogan, Schneider, Ross and Bau141 While beam effects can be drastically reduced by taking advantage of new direct electron detectors, there is an inherent tradeoff between electron flux, spatial and temporal resolutions because the images get increasingly noisy and less interpretable with decreasing electron flux on the camera.Reference Chee, Anand, Bisht, Tan and Mirsaidov50 Alleviating these challenges will require the development of adaptive image processing tools that can be trained using noisy image data sets of known structures to identify unknown structures and recognize the subtle structural transformations in low signal-to-noise ratio image sequences acquired for any given solution-based process.
The discovery of new routes through which materials form from a precursor solution is crucial for inspiring new synthesis methods. Such discoveries require high-resolution and time-resolved imaging. Achieving these resolutions comes at the cost of increased electron fluxes and doses used for imaging. In many instances, the electron beam can be advantageous in stimulating the different stages of the growth reactions and thus provide atomistic insights about the growth mechanisms. However, it is also possible that the intense beam may cause the growth trajectories to deviate from the typical pathways that might otherwise take place during normal bench-top synthesis, and thus provide a skewed mechanistic insight, not representative of the process. Using sensitive detectors and optimizing imaging conditions to reduce the beam effect, along with some careful validation of the observed processes with complementary approaches, will be important.
When trying to understand the future role that liquid phase TEM can play, it is helpful to consider the role of cryo-electron microscopy (cryo-EM), which also provides high-resolution images of materials in solution.Reference Patterson, Xu, Moradi, Sommerdijk and Friedrich142,Reference De Yoreo and Sommerdijk143 When comparing liquid cell TEM and cryo-EM, it is important to note that there have been significant efforts in the development of cryo-EM dating back to the 1980s,Reference Adrian, Dubochet, Lepault and McDowall144,Reference Nogales145 compared to liquid cell TEM where the significant developments occurred two decades later.Reference de Jonge and Ross9,Reference Ross10 Although the liquid phase TEM community has and will continue to benefit greatly from some of the cryo-EM developments (e.g., detector technology),Reference McMullan, Faruqi, Clare and Henderson146 there are some inherent differences that require new innovations.
Looking forward, we anticipate that innovations in instrumentation and computational approaches will transform in situ liquid cell TEM into a widely used high-throughput method. These high-throughput studies are critical not only for confirming the statistical significance of the observations but also identifying often-missed rare events and pathways, which can lead to significantly different outcomes. Overall, we expect liquid cell electron microscopy to play a significant role in accelerating materials and process discovery with great impact on science and technology.
Acknowledgments
U.M. acknowledges support from the Singapore National Research Foundation (NRF-CRP16-2015-05) and the Singapore Ministry of Education (MOE2018-T2-1-006). H.Z. acknowledges the funding support from the US Department of Energy (DOE), Office of Science, Office of Basic Energy Sciences (BES), Materials Sciences and Engineering Division under Contract No. DE-AC02-05-CH11231 within the KC22ZH program.
 Utkur Mirsaidov has been an associate professor in the Department of Physics at the National University of Singapore (NUS), Singapore, since 2013. He obtained his PhD degree in physics from The University of Texas at Austin in 2005. He completed his postdoctoral research at the University of Illinois at Urbana-Champaign and NUS. His research focuses on understanding fundamental chemical and physical processes fundamental for synthesis and application of nanomaterials, and the development of advanced electron microscopy techniques for materials application. Mirsaidov can be reached by email at mirsaidov@nus.edu.sg.
 Joe Patterson is an assistant professor in the Department of Chemistry at the University of California, Irvine. He received his PhD degree in polymer chemistry and self-assembly from the University of Warwick, UK. He completed postdoctoral research at the University of California, San Diego. Patterson also worked in the Laboratory of Materials and Interface Chemistry at the Eindhoven University of Technology, The Netherlands. His research includes the development of new materials through a deep understanding of their structural dynamics. His awards include the Domino/MacroGroupUK Young Polymer Scientist of the Year in 2011, the 2013 Jon Weaver PhD Prize, and a Marie Skłodowska-Curie Individual Fellowship in 2017. Patterson can be reached by email at patters3@uci.edu.
 Haimei Zheng is a senior staff scientist in the Materials Sciences Division at Lawrence Berkeley National Laboratory (LBNL), and an adjunct professor in the Department of Materials Science and Engineering at the University of California, Berkeley. She received her PhD degree in materials science and engineering from the University of Maryland, College Park, and was a postdoctoral fellow at the University of California, Berkeley, and LBNL. Her current research focuses on understanding how atomic-level heterogeneity and fluctuations control physical and chemical processes of materials. She received the US Department of Energy Office of Science Early Career Award in 2011, LBNL Director's Award for exceptional scientific achievement in 2013, and the Materials Research Society Medal in 2019. Zheng can be reached by email at hmzheng@lbl.gov.


