


Gender roles are socially constructed norms that dictate acceptable behaviors for men and women, often culturally reinforced (Brehm, Miller, Perlman, & Miller, Reference Brehm, Miller, Perlman and Miller2002). Masculinity ideologies refer to the set of prescriptive and proscriptive social norms that shape and regulate men’s behavior, distinguishing masculinity as a social construct from gender identity (Thompson & Pleck, Reference Thompson, Pleck, Levant and Pollack1995). This distinction is critical, as masculinity ideologies focus on expectations and norms society imposes on men, rather than personal identification or orientation (Thompson & Bennett, Reference Thompson and Bennett2015). From this perspective, masculinity can be seen either as a set of inherent traits or, alternatively, as a culturally constructed ideology promising certain privileges to men based on their adherence to these norms (Thompson & Bennett, Reference Thompson and Bennett2015).
Recent theoretical contributions emphasize the concept of precarious manhood, which views masculinity not as a stable identity but as a socially contingent status that must be continually demonstrated and defended (Vandello & Bosson, Reference Vandello and Bosson2013). From this perspective, masculinity is fragile and requires constant validation through behavior, making men particularly sensitive to social pressures that question or threaten their masculine status. This framework is relevant for understanding how men may respond to measures of masculine norms such as the CMNI, especially at transitional life stages when pressures to “prove” masculinity may be heightened.
Mahalik’s model of conformity to masculine norms (see Mahalik et al., Reference Mahalik, Locke, Ludlow, Diemer, Scott, Gottfried and Freitas2003) defines this construct as the extent to which men adhere to societal expectations of masculinity, both in public and private spheres. A widely used tool to measure these norms is the Conformity to Masculine Norms Inventory (CMNI) (Mahalik et al., Reference Mahalik, Locke, Ludlow, Diemer, Scott, Gottfried and Freitas2003), which reflects mainstream American cultural beliefs about what it means to be a man. The inventory includes domains such as winning, emotional control, risk-taking, violence, power over women, playboy, self-reliance, and heterosexual self-presentation. Since its introduction, the CMNI’s construct validity has been demonstrated in various studies (Graef, Tokar, & Kaut, Reference Graef, Tokar and Kaut2010; Iwamoto, Liao, & Liu, Reference Iwamoto, Liao and Liu2010; Smiler, Reference Smiler2006), providing robust evidence of its utility across different populations.
Over the years, reduced versions of the CMNI have usually been analyzed, as these reduced versions showed better stability and psychometric properties (Hsu & Iwamoto, Reference Hsu and Iwamoto2014; Parent & Moradi, Reference Parent and Moradi2011; Parent, Moradi, Rummell, & Tokar, Reference Parent, Moradi, Rummell and Tokar2011). In the present study, the CMNI-29 was chosen over the more recent CMNI-30 because it had already been validated in Spanish samples, ensuring cultural and linguistic appropriateness for our population. At the time of data collection, the CMNI-30 had not yet been adapted or validated for use in Spain, whereas the CMNI-29 had established psychometric support in this context. Nonetheless, we acknowledge the advances represented by the CMNI-30 and recommend its future validation and application in Spanish populations to build on the findings reported here.
Despite extensive research into gender and cultural group differences in conformity to masculine norms, one factor that remains underexplored is the role of age. While studies have examined the impact of gender and cultural identity (Hsu & Iwamoto, Reference Hsu and Iwamoto2014; Parent & Smiler, Reference Parent and Smiler2013; Smiler, Reference Smiler2006), the potential influence of age has been largely neglected. Age, however, is theoretically linked to construct such as risk-taking and emotional control. For instance, Boyer (Reference Boyer2006) theorizes that risk-taking behaviors tend to decline with age due to increased cognitive sophistication and responsibility. Similarly, Rice (Reference Rice, Fallon and Bambling2011) found that adherence to masculine norms decreases over the lifespan, suggesting that as men age, their conformity to these societal expectations may change. Also, Smiler (Reference Smiler2006) found using the full version of the CMNI that masculinity factor scores tended to decrease with age.
Arnett’s concept of “emerging adulthood” defines a developmental stage typically spanning ages 18 to 26, characterized by five distinct features. However, this change can vary between 25 and 29 years of age. The first is identity exploration, during which individuals experiment with different paths in relationships and careers to discover personal goals and values. Second is instability, a phase marked by frequent changes in life direction—such as switching colleges, majors, jobs, or relationships—when initial choices fail to align with expectations. Third, self-focus allows young adults to concentrate on personal growth, develop essential life skills, and establish a foundation for their future, a stage Arnett describes as transitional and necessary. Fourth, the feeling of being in-between reflects the ambiguous nature of this period, where individuals view themselves as neither adolescents nor fully independent adults. Lastly, the age of possibilities is characterized by optimism, as emerging adults believe in their capacity to shape their lives and achieve aspirations (Arnett, Reference Arnett2023; Arnett, Žukauskienė, & Sugimura, Reference Arnett, Žukauskienė and Sugimura2014; Gallo & Gallo, Reference Gallo and Gallo2011).
Arnett’s observations about emerging adulthood can be linked to the factors measured by the CMNI, as younger men, navigating this stage of uncertainty, are more likely to engage in risk-taking behaviors and seek to assert their identity to others. This makes them more prone to adopting behaviors aligned with societal expectations of masculinity, as they strive to conform to these norms during this early stage of adulthood. As men progress into adulthood and attain greater stability, many of these behaviors may decline. With more secure and established lives, adults are generally less affected by external perceptions. This decreased reliance on external validation often results in reduced adherence to masculinity norms, as the pressure to compete for status or affirmation lessens. Life-course theories suggest that younger men often engage in risk-taking and independent behaviors to assert masculinity, but these behaviors typically decline as they age and prioritize stability, responsibility, and long-term goals (Boyer, Reference Boyer2006; Pryce & Samuels, Reference Pryce and Samuels2008).
The present study examines how age influences adherence to masculine norms using the CMNI-29 (Hsu & Iwamoto, Reference Hsu and Iwamoto2014) due to its better psychometric properties. The instrument’s factors—winning, heterosexual self-presentation, violence, risk-taking, self-reliance, emotional control, power over women, and playboy—capture key aspects of masculinity that are likely to evolve with age, reflecting the developmental changes described by Arnett (Gallo & Gallo, Reference Gallo and Gallo2011; Arnett et al., Reference Arnett, Žukauskienė and Sugimura2014; Arnett, Reference Arnett2023).
In summary, age has a significant impact on how masculinity norms are perceived and expressed, so it is important to evaluate the performance of the CMNI-29 across different age groups. This involves assessing the psychometric properties of the instrument, including its internal structure and reliability, while ensuring that it demonstrates invariance with respect to age. Establishing invariance is essential to ensure that the CMNI-29 measures the same constructs in emerging and older adults without bias, thereby allowing valid comparisons of scores across age groups. By addressing these considerations, this study aims to improve our understanding of how masculinity norms evolve between early and later adulthood.
It is the first study to examine the factorial structure, measurement invariance (MI), and latent mean differences of the CMNI-29 across age groups in a Spanish sample, using advanced psychometric techniques: Exploratory Graph Analysis (EGA), Confirmatory Factor Analysis (CFA), and Multiple Indicators, Multiple Causes (MIMIC).
Our general objective is to examine age-related differences in conformity to masculine norms in a Spanish context. The hypothesis is:
-
(a) To test the factorial structure and reliability of the CMNI-29 in Spanish men (Hypothesis: The CMNI-29 will show robust factorial structure and reliability).
-
(b) To assess MI across age groups (Hypothesis: The CMNI-29 will demonstrate MI).
-
(c) To examine latent mean differences between age groups (Hypothesis: Emerging adults will report higher conformity to masculine norms than older adults).
Method
Participants
The study included 837 men aged 18 to 64 years. Due to the highly positively skewed age distribution and in line with Arnett’s theory of emerging adulthood, participants were divided into two age groups using the median age of 26 years, which aligns with the conceptual boundary of this developmental stage. This resulted in two groups: emerging adults (≤ 26 years; n = 439, M = 22.42, SD = 2.16) and older adults (> 26 years; n = 398, M = 39.54, SD = 10.33). Differences in standard deviations between the groups are both expected and normal. The emerging adulthood period spans a relatively shorter time frame but involves more frequent and substantial life changes; consequently, one year within this period corresponds to a greater amount of developmental change than one year in the older adulthood group. Therefore, the observed difference in variability is not only expected but also desirable for our research purposes, as it allows for a meaningful comparison of developmental changes across these two distinct life stages.
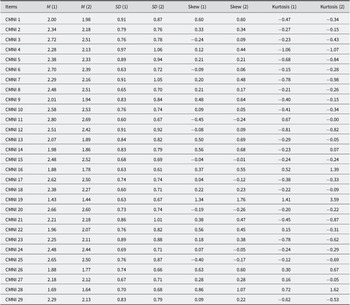
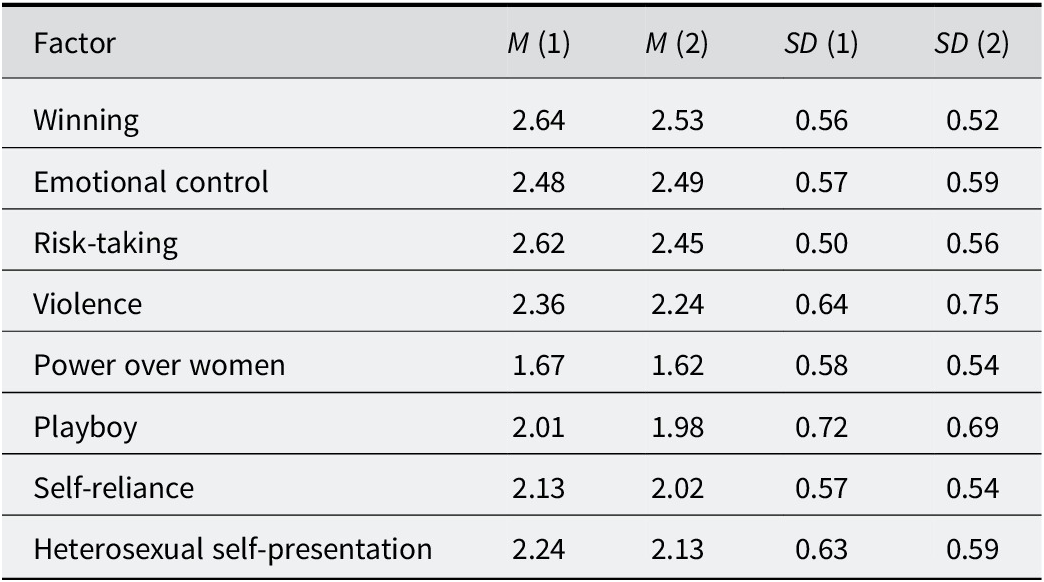
Descriptive statistics for item and factor scores can be found in the Appendix (Tables A1 and A2).
Among the participants, 33.57% identified as single, while 11.59% were married or in a stable relationship. A smaller fraction included those who were divorced (1.67%) or widowed (0.24%). Notably, a significant 52.93% opted not to disclose their relationship status for unspecified reasons.
Regarding employment status, the majority were employed (47.32%), whereas 22.28% reported being unemployed. Additionally, 30.1% chose not to share their employment status for unspecified reasons.
In terms of education, 65.59% had completed higher education, 21.62% had intermediate education, and 8.48% had primary education. Only 0.36% had no formal education, while 3.95% opted not to disclose their education level for unspecified reasons.
Materials
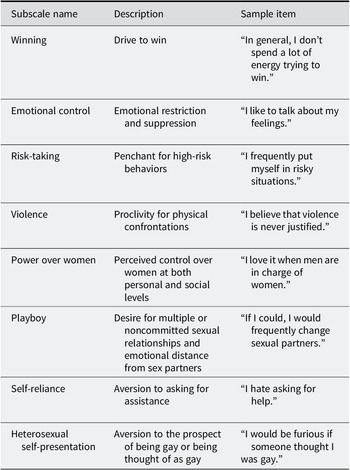
All participants completed the Spanish adaptation of the CMNI, but the 29-item version was analyzed due to the stability and evidence supporting this structure (Cuéllar-Flores, Sánchez-López, & Dresch, Reference Cuéllar-Flores, Sánchez-López and Dresch2011; Mahalik et al., Reference Mahalik, Locke, Ludlow, Diemer, Scott, Gottfried and Freitas2003). The decision to employ the CMNI-29 rather than the CMNI-30 was based on its prior validation in Spanish samples, which guaranteed cultural and linguistic suitability for our study population. At the time of data collection, the CMNI-30 lacked an available Spanish adaptation and psychometric validation, limiting its applicability. We recognize, however, the improvements of the CMNI-30 and suggest its validation in future Spanish studies as a promising avenue for research. The CMNI-29 assesses adherence to traditional masculine norms through 29 items, with responses measured on a 4-point Likert scale ranging from 0 (totally disagree) to 3 (totally agree). Examples of items from the instrument are provided in Table 1.
Masculine norms assessed by the CMNI-29

Table 1. Long description
The table consists of three columns: Subscale name, Description, and Sample item.
* Winning: Drive to win. Sample item: In general, I don’t spend a lot of energy trying to win.
* Emotional control: Emotional restriction and suppression. Sample item: I like to talk about my feelings.
* Risk-taking: Penchant for high-risk behaviors. Sample item: I frequently put myself in risky situations.
* Violence: Proclivity for physical confrontations. Sample item: I believe that violence is never justified.
* Power over women: Perceived control over women at both personal and social levels. Sample item: I love it when men are in charge of women.
* Playboy: Desire for multiple or noncommitted sexual relationships and emotional distance from sex partners. Sample item: If I could, I would frequently change sexual partners.
* Self-reliance: Aversion to asking for assistance. Sample item: I hate asking for help.
* Heterosexual self-presentation: Aversion to the prospect of being gay or being thought of as gay. Sample item: I would be furious if someone thought I was gay.
Procedure
The sample was a convenience sampling. We collected using a non-probabilistic method, targeting students at the Complutense University of Madrid. In addition, the recruitment process was complemented by the dissemination of the study through social media platforms in order to reach a wider, more diverse audience and ensure the inclusion of participants from a wider age range. This is a major limitation of the study, because it restricted generalizability. Before completing the questionnaire, participants were given an informed consent form that explained the focus of the study on masculinity and assured them that their data would be kept confidential. Participants were given a maximum of two weeks to complete and return the questionnaire.
All responses were collected anonymously via an online platform. No identifying information was gathered, and data were stored securely in compliance with ethical guidelines. All procedures in this study involving human participants adhered to the ethical standards of institutional and/or national research committees, in accordance with the Helsinki Declaration of 1964 and its subsequent amendments, or comparable ethical standards.
Statistical Analysis
Cases with missing responses on CMNI-29 items were excluded from the analyses, as these missing data were randomly distributed and represented less than 5% of the total sample.
No extreme scores were observed in the overall test responses and given that identifying outliers at the item level is generally not meaningful, therefore, no exclusions were necessary.
First, the necessary items were reverse scored to ensure that a higher score on each item corresponded to a higher score on the latent factor, thereby simplifying their interpretation.
EGA (Golino & Epskamp, Reference Golino and Epskamp2017) was used to test the dimensionality of the structure and the correct specification of the model, thereby avoiding the invariance problems associated with misspecification (Joo & Kim, Reference Joo and Kim2019). Additionally, Exploratory Bootstrap Factor Analysis (bootEFA) (Zhang, Preacher, & Luo, Reference Zhang, Preacher and Luo2010) was utilized to check the robustness of the structure and avoid capitalizing on chance.
Once the correct model specification was tested, an initial CFA was conducted following the recommendations for the treatment of ordinal data (Asún, Rodríguez-Navarro, & Alvarado, Reference Asún, Rodríguez-Navarro and Alvarado2016) on 4-category Likert-type scales. These guidelines include assuming that each ordinal variable comes from an underlying continuous distribution assuming normality, estimating polychoric correlations to capture the relationships between these continuous variables, and using diagonally weighted least squares (DWLS or WLSMV; see Asún et al., Reference Asún, Rodríguez-Navarro and Alvarado2016) as the estimation method. To assess model goodness of fit, the p-value for the chi-squared goodness of fit statistics, the comparative fit index (CFI), the Tucker–Lewis index (TLI), the standardized root mean square (SRMR), and the root mean square error of approximation (RMSEA) were used to test the fit in the model. Reliability indices were also reported for each factor, including Cronbach’s Alpha and McDonald’s Omega.
Before estimating MIMIC model, MI between the two age groups was checked. This is because the MIMIC model evaluates differences in latent variables under the assumption that the factor structure is correctly specified and invariant across groups in terms of thresholds, loadings, and intercepts. Therefore, it is essential to verify these aspects prior to its application. This procedure followed the recommendations of Wu and Estabrook (Reference Wu and Estabrook2016) for categorical data, the R code was inspired by the R code of Svetina et al. (Reference Svetina, Rutkowski and Rutkowski2020) and used the cutoff of Chen (Reference Chen2007) for ∆CFI. For RMSEAD, given that it is conceptually distinct from ΔRMSEA, we explicitly adopted the guideline of Savalei et al. (Reference Savalei, Brace and Fouladi2024), who recommend a cutoff of approximately .06 to indicate acceptable invariance. This differs from the traditional ΔRMSEA threshold of .015, and we consider it more appropriate for categorical indicators and the analytic strategy employed here. Finally, the MIMIC model was adjusted according to the R guidelines of Chang, Gardiner, Houang, & Yu (Reference Chang, Gardiner, Houang and Yu2020).
All structural models of the CMNI-29 were analyzed using R (R Development Core Team, 2024) with the EGAnet package (Golino & Christensen, Reference Golino and Christensen2024) for EGA, the psych package (Revelle, Reference Revelle2024) for reliability and bootEFA, and the lavaan and semTools packages (Jorgensen, Pornprasertmanit, Schoemann, & Rosseel, Reference Jorgensen, Pornprasertmanit, Schoemann and Rosseel2022; Rosseel, Reference Rosseel2012) for CFA, MI, and MIMIC analysis.
Results
EGA of the CMNI-29
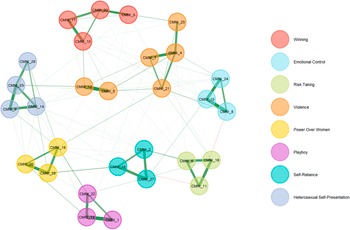
The EGA (see Figure 1) revealed the expected structure of eight factors according to the theoretical model. Additionally, it correctly grouped the items into their expected theoretical dimensions, verifying the model’s correct specification, except for the CMNI-5 and CMNI-12 items, although they are represented in close proximity to heterosexual self-presentation, appeared connected to the violence factor. This was examined using bootEFA (taking loadings mean with 10,000 subsamples), which found that the cross-loadings of CMNI-5 and CMNI-12 with the violence factor were .43 and .34, respectively, weighting .44 and .47, respectively, in heterosexual self-presentation. Given that these cross-loadings were likely linked to sample distortions and the weights were higher in their theoretical factor, this was not a concerning issue, but it could be considered in future revisions or editions of the questionnaire. Furthermore, bootEFA was useful in checking the stability of the theoretical structure across subsamples, helping to avoid capitalizing on chance.
Exploratory graph analysis.

Figure 1. Long description
A network diagram consisting of circular nodes labeled C M N I underscore followed by a number. Nodes are grouped into color-coded clusters connected by green lines of varying thickness.
* Top-Left (Red): Winning cluster includes nodes 17, 20, 3, and 10.
* Top-Right (Orange): Violence cluster includes nodes 25, 4, 7, 21, 12, and 5.
* Right (Light Blue): Emotional Control cluster includes nodes 24, 15, and 8.
* Bottom-Right (Light Green): Risk Taking cluster includes nodes 6, 18, and 11.
* Bottom-Center (Teal): Self-Reliance cluster includes nodes 2, 16, and 27.
* Bottom-Left (Purple): Playboy cluster includes nodes 22, 13, and 1.
* Left (Yellow): Power Over Women cluster includes nodes 19, 26, and 28.
* Far-Left (Dark Blue): Heterosexual Self-Presentation cluster includes nodes 29, 23, 9, and 14.
Thick green lines indicate strong connections within clusters, such as between 12 and 5, or 13 and 1. Thin gray lines show weaker cross-cluster correlations. A legend on the right maps colors to categories: Red for Winning, Light Blue for Emotional Control, Light Green for Risk Taking, Orange for Violence, Yellow for Power Over Women, Purple for Playboy, Teal for Self-Reliance, and Dark Blue for Heterosexual Self-Presentation.
CFA of the CMNI-29
The goodness of fit indices of the CFA was χ2(349) = 1737.53, p < .001, RMSEA = .069, SRMR = 0.065, CFI = .959, TLI = .953. Considering the cutoff values of SRMR ≤ .08, CFI and TLI ≥ .95, and RMSEA ≤ .06 (Hu & Bentler, Reference Hu and Bentler1999), the model showed an acceptable fit. Although the chi-square test was rejected due to the large sample size, the CFI, TLI, and SRMR indicated a good fit. Although the RMSEA was at the limit of acceptability, considering all fit indices the model obtained an adequate fit.
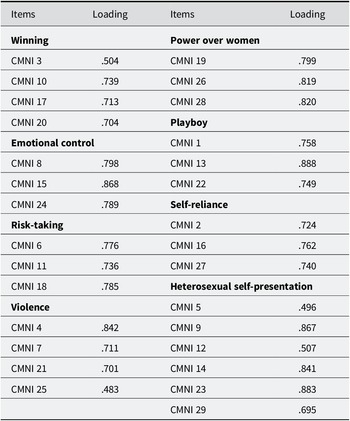
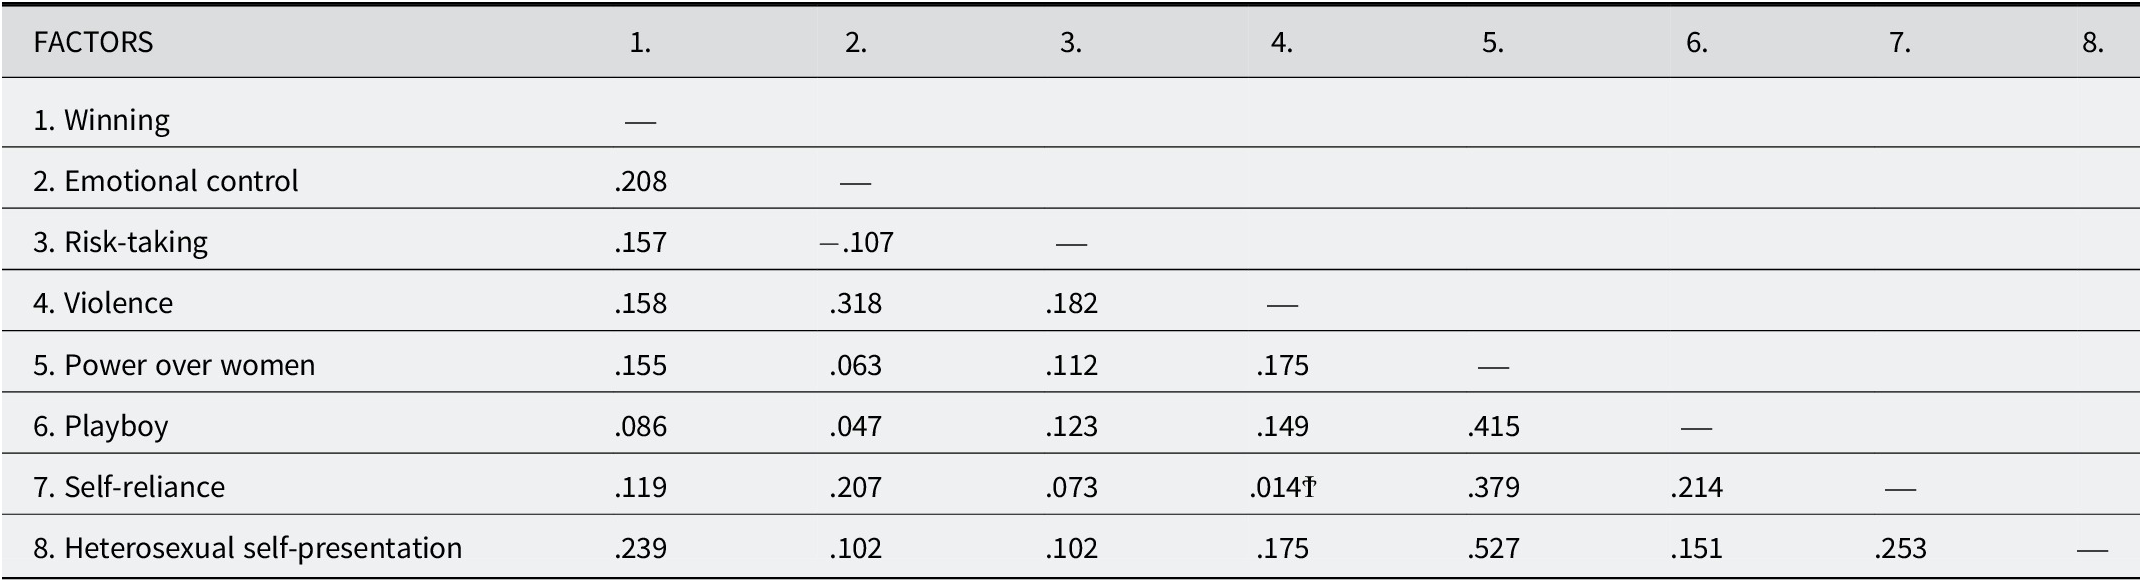
The loads for each factor are generally high (see Table 2), suggesting that the factors are well-defined. In Table 3, while most of the correlations between factors are statistically significant at p < .001, the correlation sizes are generally small, with only one correlation exceeding .50 (power over women and heterosexual self-presentation). Thus, although inter-factor correlations are modest overall, it is important to acknowledge that certain associations—particularly between power over women and heterosexual self-presentation—are substantial. This pattern is theoretically coherent, as both factors involve dimensions of masculinity linked to gender relations and the affirmation of heterosexual identity. These stronger associations, however, do not undermine the multidimensional structure of the CMNI-29 but rather highlight conceptually related domains within the broader construct. This result is consistent with what is observed in Figure 1 and confirms that the instrument should be applied with consideration of its multidimensional nature.
Standardized factor loadings for CFA model to the CMNI-29

Table 2. Long description
The table is organized into two main columns, each containing sub-columns for Items and Loading. All loadings are statistically significant at p less than .001.
Left Column Data:
* Winning: C M N I 3 at .504, C M N I 10 at .739, C M N I 17 at .713, C M N I 20 at .704.
* Emotional control: C M N I 8 at .798, C M N I 15 at .868, C M N I 24 at .789.
* Risk-taking: C M N I 6 at .776, C M N I 11 at .736, C M N I 18 at .785.
* Violence: C M N I 4 at .842, C M N I 7 at .711, C M N I 21 at .701, C M N I 25 at .483.
Right Column Data:
* Power over women: C M N I 19 at .799, C M N I 26 at .819, C M N I 28 at .820.
* Playboy: C M N I 1 at .758, C M N I 13 at .888, C M N I 22 at .749.
* Self-reliance: C M N I 2 at .724, C M N I 16 at .762, C M N I 27 at .740.
* Heterosexual self-presentation: C M N I 5 at .496, C M N I 9 at .867, C M N I 12 at .507, C M N I 14 at .841, C M N I 23 at .883, C M N I 29 at .695.
Note: All loadings are statistically significant p < .001.
Correlation coefficients between factors

Table 3. Long description
The table displays correlation coefficients for eight factors. The diagonal is marked with dashes.
* Factor 1. Winning.
* Factor 2. Emotional control: correlates with Winning at .208.
* Factor 3. Risk-taking: correlates with Winning at .157 and Emotional control at negative .107.
* Factor 4. Violence: correlates with Winning at .158, Emotional control at .318, and Risk-taking at .182.
* Factor 5. Power over women: correlates with Winning at .155, Emotional control at .063, Risk-taking at .112, and Violence at .175.
* Factor 6. Playboy: correlates with Winning at .086, Emotional control at .047, Risk-taking at .123, Violence at .149, and Power over women at .415.
* Factor 7. Self-reliance: correlates with Winning at .119, Emotional control at .207, Risk-taking at .073, Violence at .014 (not significant), Power over women at .379, and Playboy at .214.
* Factor 8. Heterosexual self-presentation: correlates with Winning at .239, Emotional control at .102, Risk-taking at .102, Violence at .175, Power over women at .527, Playboy at .151, and Self-reliance at .253.
All correlations are statistically significant p less than .05 except for the correlation between Self-reliance and Violence.
Note: All correlations are statistically significant p < .05, except those marked with Ϯ.
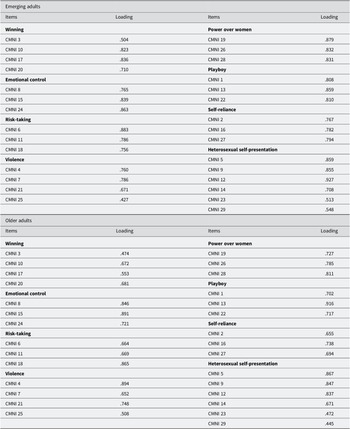
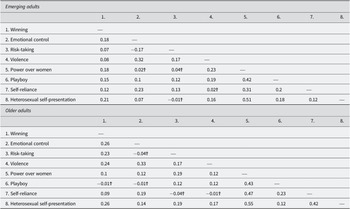
For factor loadings and inter-factor correlations by age group, see the Appendix (Tables A3 and A4).
Reliability of the CMNI-29
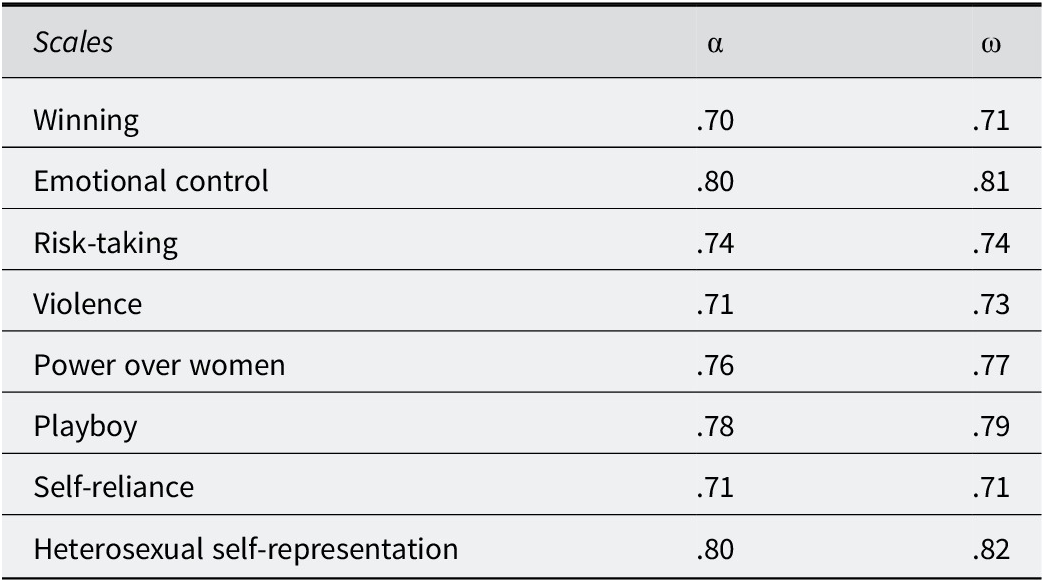
In Table 4, we can observe that all factors exhibit high reliability, with both Alpha and Omega values ranging between .7 and .8. Omega is considered a more accurate reliability estimate since it does not assume tau-equivalence (equal factor loadings), making it more appropriate for models with varying item weights. However, Alpha is also reported to allow for comparability with other studies, as it remains the classic measure of reliability in psychometrics.
Reliability indices

Table 4. Long description
The table consists of three columns: Scales, alpha, and omega.
* Winning: alpha .70, omega .71.
* Emotional control: alpha .80, omega .81.
* Risk-taking: alpha .74, omega .74.
* Violence: alpha .71, omega .73.
* Power over women: alpha .76, omega .77.
* Playboy: alpha .78, omega .79.
* Self-reliance: alpha .71, omega .71.
* Heterosexual self-representation: alpha .80, omega .82.
Measurement Invariance of the CMNI-29
There are many equivalent models for calculating invariance in categorical items (Wu & Estabrook, Reference Wu and Estabrook2016). In this study, four levels of invariance were examined: configural, thresholds, loadings, and intercepts.
Configural invariance examines whether the same factor structure exists across different groups, confirming that items relate to the same underlying construct without imposing restrictions on parameter estimates.
Threshold invariance focuses on the cutoff points in the underlying continuous variable that determines the observed categories. At this level, intercepts are also forced to be equal across groups, reflecting the level of the underlying continuous variable when the factor value is zero. It is crucial to understand that thresholds and intercepts cannot be estimated simultaneously; increasing the thresholds by a certain amount is equivalent to reducing the intercept by the same amount.
Loadings invariance assesses whether the factor loadings of items are consistent across groups, ensuring that the strength of the relationship between items and the underlying construct remains the same.
Finally, with intercepts invariance, once the thresholds and loadings are forced to be equal between the two groups, we can estimate the intercepts and check the change in goodness of fit when they are equalized in both groups.
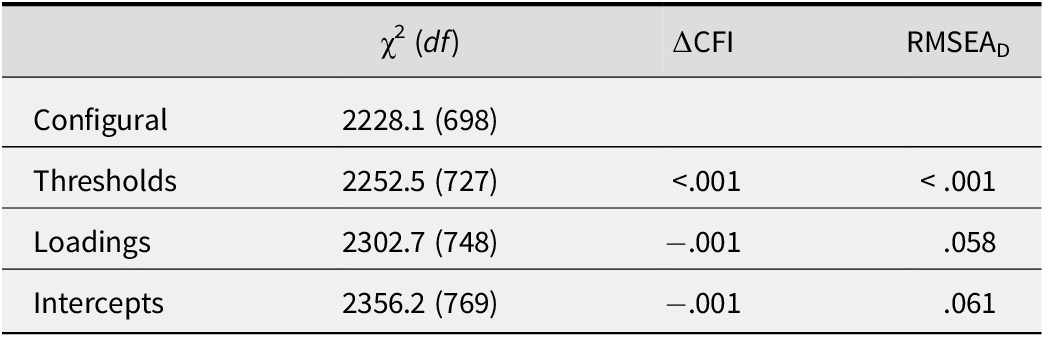
MI across age groups was examined at four levels: configural, thresholds, loadings, and intercepts. Results (see Table 5) indicated that the CMNI-29 achieved invariance at each step, as changes in CFI remained below the recommended cutoff of .01 (Chen, Reference Chen2007). Regarding RMSEAD, the different levels of invariance are also satisfactorily achieved, except at the intercepts level, which very slightly exceeds the cutoff limit (0.061). Because it is so close to the cutoff, it does not necessarily indicate a significant problem. Cutoffs are often overly rigid and do not always take the context of each analysis into account. Additionally, multiple invariance analyses were conducted by varying the age range of the second group. In these analyses, the issue previously observed with the RMSEAD did not occur, indicating that the model successfully meets this level of invariance. Therefore, we can conclude that the test is invariant across age groups, considering both ΔCFI and RMSEAD, or, if we take a conservative criterion, has minor intercepts invariance problems.
Levels of measurement invariance for categorical items

Table 5. Long description
The table consists of four columns and five rows including the header. The columns are labeled from left to right as: Model Level, chi-squared with degrees of freedom d f in open parenthesis, delta C F I, and R M S E A sub D.
Row 1: Configural model shows chi-squared of 2228.1 with 698 degrees of freedom. Delta C F I and R M S E A sub D values are not applicable.
Row 2: Thresholds model shows chi-squared of 2252.5 with 727 degrees of freedom, delta C F I less than .001, and R M S E A sub D less than .001.
Row 3: Loadings model shows chi-squared of 2302.7 with 748 degrees of freedom, delta C F I of minus .001, and R M S E A sub D of .058.
Row 4: Intercepts model shows chi-squared of 2356.2 with 769 degrees of freedom, delta C F I of minus .001, and R M S E A sub D of .061.
These findings support that the CMNI-29 operates equivalently across emerging and older adults, confirming that observed group differences can be interpreted as genuine variations in conformity to masculine norms rather than artifacts of measurement. This reinforces the validity of cross-age comparisons in our study context.
MIMIC Model of the CMNI-29: Age as Covariate
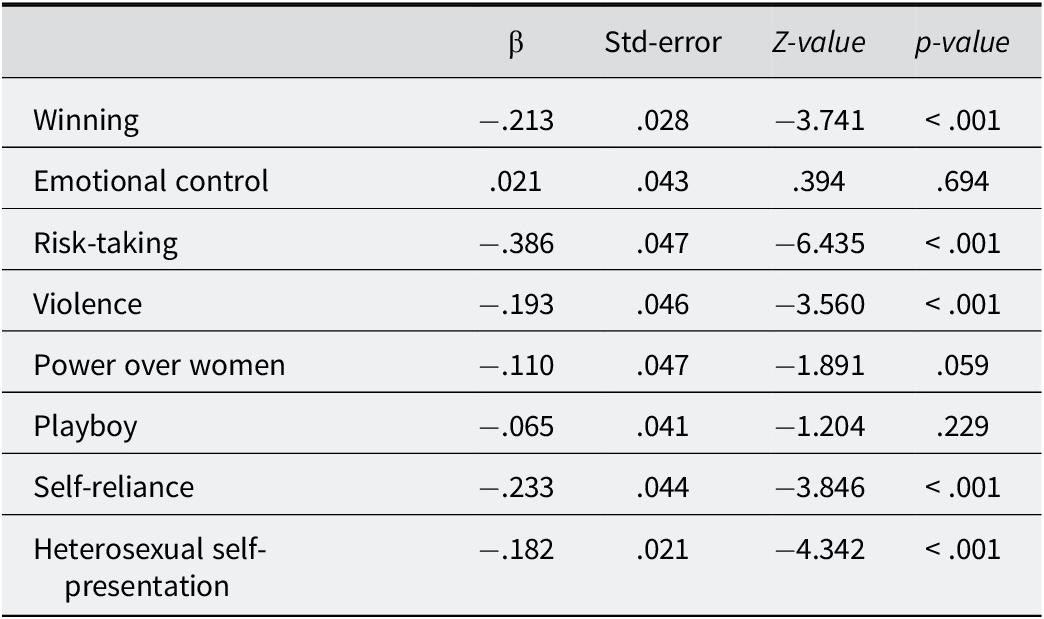
To estimate the MIMIC model, age (dichotomized into the two groups as previously explained in the Method section) was included as a covariate across all factors in the theoretical model. The results indicated that the factors significantly influenced by age (p < .05) were winning, risk-taking, violence, self-reliance, and heterosexual self-presentation. Specifically, the largest effect was observed for the risk-taking factor (β = −0.386), indicating that older adults reported lower adherence to this norm compared to emerging adults. Similarly, the remaining significant factors also showed negative coefficients, suggesting that older adults tended to score lower than emerging adults in these dimensions. The details of these relationships are presented in Table 6.
Regression coefficient of age on the factors

Table 6. Long description
The table consists of five columns: Factor, beta, Std-error, Z-value, and p-value.
* Winning: beta negative .213, Std-error .028, Z-value negative 3.741, p-value less than .001.
* Emotional control: beta .021, Std-error .043, Z-value .394, p-value .694.
* Risk-taking: beta negative .386, Std-error .047, Z-value negative 6.435, p-value less than .001.
* Violence: beta negative .193, Std-error .046, Z-value negative 3.560, p-value less than .001.
* Power over women: beta negative .110, Std-error .047, Z-value negative 1.891, p-value .059.
* Playboy: beta negative .065, Std-error .041, Z-value negative 1.204, p-value .229.
* Self-reliance: beta negative .233, Std-error .044, Z-value negative 3.846, p-value less than .001.
* Heterosexual self-presentation: beta negative .182, Std-error .021, Z-value negative 4.342, p-value less than .001.
According to the conventional benchmarks proposed by Cohen (Reference Cohen1988), this coefficient would correspond to an effect of approximately medium magnitude (d ≈ 0.5), while the remaining significant effects would fall within the small-to-medium range. However, as noted by Cohen himself in the same work, these cutoff values are merely heuristic and arbitrary conventions, and the interpretation of effect size magnitudes should ultimately rely on empirical accumulation within a specific research area. In this sense, given that the present study addresses a relatively emerging phenomenon, even small effects may be considered meaningful until future studies allow for more precise comparisons and contextualized benchmarks.
Discussion
The analyses conducted in this study primarily aimed to gather evidence of the internal validity of the CMNI-29, confirming that the model was correctly specified and well-supported by the data. The model demonstrated robustness, with high factor loadings, low inter-factor correlations, and strong reliability for each subscale. Thus, Hypothesis (a), which predicted that the CMNI-29 would show robust factorial structure and reliability, was supported. Although minor structural deviations were observed in items 5 and 12, likely due to sample-specific effects, it would be valuable to monitor these items in future studies of the internal structure of the questionnaire to assess whether revisions are needed or if the biases are unique to this sample. Additionally, we encourage researchers to apply a range of analytical techniques when evaluating questionnaire quality, as this multi-method approach can provide a more comprehensive assessment that addresses the limitations inherent to individual methods. Overall, our findings reinforce the strong psychometric properties previously observed in U.S. samples (Hsu & Iwamoto, Reference Hsu and Iwamoto2014; Parent & Moradi, Reference Parent and Moradi2011), including robust construct validity (Parent et al., Reference Parent, Moradi, Rummell and Tokar2011; Parent & Moradi, Reference Parent and Moradi2011), and extend this accumulation of validity evidence to a Spanish sample. It is also worth noting that, while most inter-factor correlations were modest, some associations—such as between power over women and heterosexual self-presentation—were more substantial. This finding is theoretically expected, as both dimensions tap into relational and identity-based aspects of masculinity. Importantly, these higher correlations do not compromise the multidimensionality of the CMNI-29 but rather point to specific domains where constructs overlap conceptually, enriching the interpretation of the instrument’s structure.
Secondly, it is important to emphasize the invariance observed between emerging and older adults across various levels of the questionnaire: configural (the factor structure of items), thresholds (the categorization of the underlying continuous variable), loadings (the influence of each item on each factor), and intercepts (the expected score for a subject with an average level of the trait, given that factors are standardized). This result confirms Hypothesis (b), which stated that the CMNI-29 would demonstrate MI across age groups. This establishes that comparisons between age groups are valid, meaning that observed differences reflect genuine variations in conformity to masculine norms measures rather than age-related differences in how the questionnaire is interpreted or functions. Regarding the adequacy of our sample for the invariance analyses, simulation studies suggest a sample size of more than 600 cases is required, with balanced groups (300 per group), a requirement that is met in our study (n = 837) to detect non-invariance in multifactor models (Svetina et al., Reference Svetina, Rutkowski and Rutkowski2020). Although low inter-factor correlations can in some cases reduce power, recent methodological work indicates that the techniques we applied—particularly DWLS estimation and the use of robust cutoff criteria—are reliable under such conditions. Taken together, these considerations provide reasonable confidence that the observed invariance reflects the true property of the CMNI-29 across age groups, rather than a limitation of statistical power. Specifically, the older group scored lower than the younger group, especially in winning, risk-taking, violence, self-reliance, and heterosexual self-presentation. The results of Smiler (Reference Smiler2006) using the full version of the test are consistent with the results of this study. However, while Smiler reported greater emotional control in older adults, this study observed a similar trend that did not reach statistical significance. This aspect warrants further investigation in future research. Therefore, Hypothesis (c), which predicted that emerging adults would report higher conformity to masculine norms than older adults, was also supported, as the younger group scored higher on several subscales. Nevertheless, we acknowledge that this dichotomous grouping into “emerging” and “older” adults has limitations, as it may mask heterogeneity within the older group (e.g., differences between early adulthood, midlife, and later adulthood). Future research could adopt alternative analytic strategies, such as treating age as a continuous variable or employing more developmentally sensitive groupings, to capture more nuanced age-related differences in masculinity. These results show that in some variables, conformity to male gender norms moderates over time, possibly due to a shift in priorities and social context over the course of life. This trend may reflect greater emotional and social adaptation with age, along with reduced pressure to exhibit risk-taking behaviors or intense competitiveness.
These findings are consistent with life-course theories, which suggest that behaviors associated with risk-taking and self-reliance are more prominent in early adulthood (Boyer, Reference Boyer2006; Pryce & Samuels, Reference Pryce and Samuels2008). Younger men are more likely to engage in risk-taking behaviors, which could reflect attempts to assert masculinity during key developmental stages. Similarly, younger men may exhibit stronger tendencies toward self-reliance, avoiding help-seeking as a marker of independence and perceived success (Pryce & Samuels, Reference Pryce and Samuels2008). Higher violence scores in young men may be explained by a greater influence of social norms and gender socialization during critical developmental stages. These norms often associate aggression with masculinity and authority, especially in contexts where demonstrating physical strength is perceived as a desirable trait. In older men, scores are lower, possibly due to greater emotional regulation and reduced exposure to contexts that encourage violent behaviors (Stanaland & Gaither, Reference Stanaland and Gaither2021). Although older adults in our study had lower scores on violence and higher scores on emotional control, the latter did not reach statistical significance. The obsession with winning, especially in competitive contexts, tends to be more prominent in young men, who may experience greater pressure to demonstrate their success in terms of tangible achievements or status. However, with age, these priorities shift toward more intrinsic values such as cooperation and personal well-being (Stanaland & Gaither, Reference Stanaland and Gaither2021). Finally, the heterosexual self-presentation norm is related to demonstrating behaviors that reaffirm heterosexuality as part of masculine identity. Younger men may feel greater pressure to conform to this ideal due to insecurities about their identity or fears of social exclusion. With age, confidence in personal identity and diminished social expectations may contribute to less adherence to this norm (Mahalik et al., Reference Mahalik, Locke, Ludlow, Diemer, Scott, Gottfried and Freitas2003).
These findings underscore the importance of considering generational differences when studying conformity to masculine norms. High scores on subscales such as risk-taking and violence in younger groups may be associated with gender socialization that privileges these attitudes as symbols of masculinity. However, as men age, they may prioritize norms related to self-reliance and emotional control. Ignoring these differences may lead to misinterpretations, such as assuming that all male cohorts uniformly adhere to the same standards, which could affect the validity of interventions or policies designed to address problems associated with these norms.
This decline in dimensions of masculinity across generations may reflect broader cultural shifts and evolving societal expectations regarding gender roles. Future studies would benefit from examining these changes longitudinally to determine whether they represent developmental shifts that occur with age or are more likely related to generational differences rooted in cultural contexts.
Finally, it is worth noting that incorporating Structural Equation Modeling (SEM) with age as a covariate could further enhance the utility of the CMNI. This approach would allow for a more nuanced understanding of how masculinity is expressed across age groups, uncovering latent differences that may not be apparent in simpler analyses. Such modeling could provide valuable insights for both research and clinical settings, refining our understanding of masculinity norms across age groups or even developmental stages.
These patterns can also be understood through the lens of precarious manhood theory (Vandello & Bosson, Reference Vandello and Bosson2013), which conceptualizes masculinity as a fragile and socially contingent status that requires continual validation. Emerging adults, situated in a developmental stage characterized by identity exploration and social instability, may be particularly vulnerable to pressures to “prove” their masculinity by adhering strongly to traditional norms such as risk-taking, violence, or heterosexual self-presentation. In contrast, older adults, who generally experience greater social stability and identity consolidation, may face fewer challenges to their masculine status and thus show lower conformity to these norms. This perspective enriches our interpretation of the results by highlighting how age-related differences may partly reflect variation in the intensity of social pressures to defend or assert masculinity across the life course.
Limitations
This study has some limitations. First, the non-probabilistic sampling method may have introduced biases that affect the representativeness of the sample, thereby limiting the generalizability of the findings. Second, the exclusive use of self-report measures administered online could have introduced potential response biases, such as social desirability or reduced attention during questionnaire completion. Third, while the use of two broad age groups was justified both theoretically (Arnett’s model of emerging adulthood) and empirically (our sample distribution), this approach may obscure heterogeneity within the older group. Future studies should therefore consider alternative strategies, such as modeling age continuously or differentiating between early adulthood, midlife, and later adulthood. Finally, future research should address these issues by employing longitudinal designs and recruiting more diverse and representative samples, which would strengthen the external validity of the results and allow for a deeper understanding of the developmental and cultural factors influencing conformity to masculine norms.
Conclusion
Despite these limitations, our findings make a significant contribution to the literature by providing evidence of the CMNI’s validity across different age groups within the Spanish population. Furthermore, this study underscores the importance of employing diverse techniques in structural validation studies to ensure the correct specification of the measurement model. It also emphasizes the necessity of assessing metric invariance before conducting any analyses of latent mean differences for variables of interest. Only when measurement models are correctly specified and demonstrate invariance can it be considered valid to examine whether theoretically relevant variables, such as age, influence CMNI scores.
Practical Implications
The findings of this study also carry relevant practical implications for applied professionals, such as clinicians, counselors, and educators. First, the observed age-related differences in conformity to masculinity norms highlight the importance of tailoring interventions to the developmental stage of the target population. For instance, strategies addressing risk-taking or aggression may be particularly relevant for emerging adults, whereas approaches focusing on emotional regulation and identity confidence may be more appropriate for older adults. Second, the CMNI-29 emerges as a valuable tool for assessing masculinity-related risk factors across different age groups. Its demonstrated validity and reliability in a Spanish sample support its use in clinical and educational settings to identify patterns of conformity to masculine norms that may be linked to mental health outcomes, relational difficulties, or reduced help-seeking behaviors. Integrating these considerations into practice can enhance the cultural and developmental sensitivity of interventions aimed at promoting well-being among men.
Data availability statement
The data, analysis code, and materials used in this study will be made publicly available to facilitate reproducibility and transparency. All relevant files, including the dataset and R scripts used for the analyses, are accessible through the research group repository at the following website: https://memopro.weebly.com/ (see the section “Repositorio BBDD”). The materials are provided under open access and can be freely used by other researchers for purposes of replication or further analysis.
Author contributions
M.A.G. contributed to conceptualization, investigation, supervision, and writing (original draft and review & editing). M.R.S. contributed to formal analysis, investigation, methodology, software, and writing (original draft and review & editing). D.V.E. contributed to data curation, formal analysis, and writing original draft. J.A.I. contributed to conceptualization, methodology, supervision, and writing (original draft and review & editing). All authors contributed to the interpretation of results and to the review and editing of the manuscript.
Funding statement
This research was supported by the Ministry of Science, Innovation and Universities (Spain) under grant PID2022-136905OB-C22, funded by CIN/AEI/10.13039/501100011033/ FEDER, UE.
Competing interests
The authors declare no potential conflicts of interest concerning the research, authorship, and/or publication of this article.
Appendix
Descriptive item statistics by age group

Table A1. Long description
The table contains 9 columns: Items, M 1, M 2, S D 1, S D 2, Skew 1, Skew 2, Kurtosis 1, and Kurtosis 2. Note that 1 represents emerging adults and 2 represents older adults.
* C M N I 1: M 2.00, 1.98; S D 0.91, 0.87; Skew 0.60, 0.60; Kurtosis -0.47, -0.34.
* C M N I 2: M 2.34, 2.18; S D 0.79, 0.76; Skew 0.33, 0.34; Kurtosis -0.27, -0.15.
* C M N I 3: M 2.72, 2.51; S D 0.76, 0.78; Skew -0.24, 0.09; Kurtosis -0.23, -0.43.
* C M N I 4: M 2.28, 2.13; S D 0.97, 1.06; Skew 0.12, 0.44; Kurtosis -1.06, -1.07.
* C M N I 5: M 2.38, 2.33; S D 0.89, 0.94; Skew 0.21, 0.21; Kurtosis -0.68, -0.84.
* C M N I 6: M 2.70, 2.39; S D 0.63, 0.72; Skew -0.09, 0.06; Kurtosis -0.15, -0.28.
* C M N I 7: M 2.29, 2.16; S D 0.91, 1.05; Skew 0.20, 0.48; Kurtosis -0.78, -0.98.
* C M N I 8: M 2.48, 2.51; S D 0.65, 0.70; Skew 0.21, 0.17; Kurtosis -0.21, -0.26.
* C M N I 9: M 2.01, 1.94; S D 0.83, 0.84; Skew 0.48, 0.64; Kurtosis -0.40, -0.15.
* C M N I 10: M 2.58, 2.53; S D 0.76, 0.74; Skew 0.09, 0.05; Kurtosis -0.41, -0.34.
* C M N I 11: M 2.80, 2.69; S D 0.60, 0.67; Skew -0.45, -0.24; Kurtosis 0.67, -0.00.
* C M N I 12: M 2.51, 2.42; S D 0.91, 0.92; Skew -0.08, 0.09; Kurtosis -0.81, -0.82.
* C M N I 13: M 2.07, 1.89; S D 0.84, 0.82; Skew 0.50, 0.69; Kurtosis -0.29, -0.05.
* C M N I 14: M 1.98, 1.86; S D 0.83, 0.79; Skew 0.56, 0.68; Kurtosis -0.23, 0.07.
* C M N I 15: M 2.48, 2.52; S D 0.68, 0.69; Skew -0.04, -0.01; Kurtosis -0.24, -0.24.
* C M N I 16: M 1.88, 1.78; S D 0.63, 0.61; Skew 0.37, 0.55; Kurtosis 0.52, 1.39.
* C M N I 17: M 2.62, 2.50; S D 0.74, 0.74; Skew 0.04, -0.12; Kurtosis -0.38, -0.33.
* C M N I 18: M 2.38, 2.27; S D 0.60, 0.71; Skew 0.22, 0.23; Kurtosis -0.22, -0.09.
* C M N I 19: M 1.43, 1.44; S D 0.63, 0.67; Skew 1.34, 1.76; Kurtosis 1.41, 3.59.
* C M N I 20: M 2.66, 2.60; S D 0.73, 0.74; Skew -0.19, -0.26; Kurtosis -0.20, -0.22.
* C M N I 21: M 2.21, 2.18; S D 0.86, 1.01; Skew 0.38, 0.47; Kurtosis -0.45, -0.87.
* C M N I 22: M 1.96, 2.07; S D 0.76, 0.82; Skew 0.56, 0.45; Kurtosis 0.15, -0.31.
* C M N I 23: M 2.25, 2.11; S D 0.89, 0.88; Skew 0.18, 0.38; Kurtosis -0.78, -0.62.
* C M N I 24: M 2.48, 2.44; S D 0.69, 0.71; Skew 0.07, -0.05; Kurtosis -0.24, -0.29.
* C M N I 25: M 2.65, 2.50; S D 0.76, 0.87; Skew -0.40, -0.17; Kurtosis -0.12, -0.69.
* C M N I 26: M 1.88, 1.77; S D 0.74, 0.66; Skew 0.63, 0.60; Kurtosis 0.30, 0.67.
* C M N I 27: M 2.18, 2.12; S D 0.67, 0.71; Skew 0.28, 0.28; Kurtosis 0.16, -0.05.
* C M N I 28: M 1.69, 1.64; S D 0.70, 0.68; Skew 0.86, 1.07; Kurtosis 0.72, 1.62.
* C M N I 29: M 2.29, 2.13; S D 0.83, 0.79; Skew 0.09, 0.22; Kurtosis -0.62, -0.53.
Note SD = standard deviation; (1) represents emerging adults and (2) represents older adults.
Descriptive factor statistics by age group

Table A2. Long description
The table consists of five columns: Factor, M 1, M 2, S D 1, and S D 2. Group 1 represents emerging adults and group 2 represents older adults.
* Winning: M 1 is 2.64, M 2 is 2.53, S D 1 is 0.56, S D 2 is 0.52.
* Emotional control: M 1 is 2.48, M 2 is 2.49, S D 1 is 0.57, S D 2 is 0.59.
* Risk-taking: M 1 is 2.62, M 2 is 2.45, S D 1 is 0.50, S D 2 is 0.56.
* Violence: M 1 is 2.36, M 2 is 2.24, S D 1 is 0.64, S D 2 is 0.75.
* Power over women: M 1 is 1.67, M 2 is 1.62, S D 1 is 0.58, S D 2 is 0.54.
* Playboy: M 1 is 2.01, M 2 is 1.98, S D 1 is 0.72, S D 2 is 0.69.
* Self-reliance: M 1 is 2.13, M 2 is 2.02, S D 1 is 0.57, S D 2 is 0.54.
* Heterosexual self-presentation: M 1 is 2.24, M 2 is 2.13, S D 1 is 0.63, S D 2 is 0.59.
Note. SD = standard deviation; (1) represents emerging adults and (2) represents older adults.
Standardized factor loadings by age group

Table A3. Long description
The table is divided into two main horizontal sections: Emerging Adults and Older Adults. Each section contains two columns of items and loadings.
Emerging Adults Section:
* Winning: C M N I 3 (.504), C M N I 10 (.823), C M N I 17 (.836), C M N I 20 (.710).
* Emotional control: C M N I 8 (.765), C M N I 15 (.839), C M N I 24 (.863).
* Risk-taking: C M N I 6 (.883), C M N I 11 (.786), C M N I 18 (.756).
* Violence: C M N I 4 (.760), C M N I 7 (.786), C M N I 21 (.671), C M N I 25 (.427).
* Power over women: C M N I 19 (.879), C M N I 26 (.832), C M N I 28 (.831).
* Playboy: C M N I 1 (.808), C M N I 13 (.859), C M N I 22 (.810).
* Self-reliance: C M N I 2 (.767), C M N I 16 (.782), C M N I 27 (.794).
* Heterosexual self-presentation: C M N I 5 (.859), C M N I 9 (.855), C M N I 12 (.927), C M N I 14 (.708), C M N I 23 (.513), C M N I 29 (.548).
Older Adults Section:
* Winning: C M N I 3 (.474), C M N I 10 (.672), C M N I 17 (.553), C M N I 20 (.681).
* Emotional control: C M N I 8 (.846), C M N I 15 (.891), C M N I 24 (.721).
* Risk-taking: C M N I 6 (.664), C M N I 11 (.669), C M N I 18 (.865).
* Violence: C M N I 4 (.894), C M N I 7 (.652), C M N I 21 (.748), C M N I 25 (.508).
* Power over women: C M N I 19 (.727), C M N I 26 (.785), C M N I 28 (.811).
* Playboy: C M N I 1 (.702), C M N I 13 (.916), C M N I 22 (.717).
* Self-reliance: C M N I 2 (.655), C M N I 16 (.738), C M N I 27 (.694).
* Heterosexual self-presentation: C M N I 5 (.867), C M N I 9 (.847), C M N I 12 (.837), C M N I 14 (.671), C M N I 23 (.472), C M N I 29 (.445).
Factor correlation matrix by age group

Table A4. Long description
The table is divided into two sections: Emerging adults at the top and Older adults at the bottom. Both sections use the same eight factors: 1. Winning, 2. Emotional control, 3. Risk-taking, 4. Violence, 5. Power over women, 6. Playboy, 7. Self-reliance, and 8. Heterosexual self-presentation. All correlations are significant at p less than .05 unless noted with a non-significant symbol.
Emerging Adults correlations:
* Emotional control with Winning: 0.18.
* Risk-taking with Winning: 0.07; with Emotional control: minus 0.17.
* Violence with Winning: 0.08; with Emotional control: 0.32; with Risk-taking: 0.17.
* Power over women with Winning: 0.18; with Emotional control: 0.02 non-significant; with Risk-taking: 0.04 non-significant; with Violence: 0.23.
* Playboy with Winning: 0.15; with Emotional control: 0.1; with Risk-taking: 0.12; with Violence: 0.19; with Power over women: 0.42.
* Self-reliance with Winning: 0.12; with Emotional control: 0.23; with Risk-taking: 0.13; with Violence: 0.02 non-significant; with Power over women: 0.31; with Playboy: 0.2.
* Heterosexual self-presentation with Winning: 0.21; with Emotional control: 0.07; with Risk-taking: minus 0.01 non-significant; with Violence: 0.16; with Power over women: 0.51; with Playboy: 0.18; with Self-reliance: 0.12.
Older Adults correlations:
* Emotional control with Winning: 0.26.
* Risk-taking with Winning: 0.23; with Emotional control: minus 0.04 non-significant.
* Violence with Winning: 0.24; with Emotional control: 0.33; with Risk-taking: 0.17.
* Power over women with Winning: 0.1; with Emotional control: 0.12; with Risk-taking: 0.19; with Violence: 0.12.
* Playboy with Winning: minus 0.01 non-significant; with Emotional control: minus 0.01 non-significant; with Risk-taking: 0.12; with Violence: 0.12; with Power over women: 0.43.
* Self-reliance with Winning: 0.09; with Emotional control: 0.19; with Risk-taking: minus 0.04 non-significant; with Violence: minus 0.01 non-significant; with Power over women: 0.47; with Playboy: 0.23.
* Heterosexual self-presentation with Winning: 0.26; with Emotional control: 0.14; with Risk-taking: 0.19; with Violence: 0.17; with Power over women: 0.55; with Playboy: 0.12; with Self-reliance: 0.42.
Note: All correlations are statistically significant p < .05, except those marked with Ϯ

 Open access

