

Research conducted in prehospital, emergency public health, and disaster medicine is evolving. More comparative studies are published in these areas. Results are often reported in terms of means or medians to describe an effect for an intervention or event within a study population. Statistical tests applied within many of the studies are often reported in terms of a P value to associate findings with “statistical significance.”
“Statistical significance” is derived from hypothesis testing and is one research standard for determining the importance of an effect. Hypothesis testing generates P values. Simplistically, hypothesis testing is a process of comparing the probability for an effect of an intervention (study hypothesis) within a test population versus no effect (null hypothesis) within the same population. The P value is the probability that no effect of an intervention (null hypothesis) has occurred within a population. A large P value (higher probability for no effect) indicates no influence of an intervention. A small P value indicates that an intervention did have an effect. Traditionally, a P=.05 (5% probability of no effect) has been considered the cut off for determining statistical significance. Stated more precisely, by convention, a P=.05 or smaller indicates those data support an effect of an intervention upon a population and a P>.05 supports no effect of an intervention.
A statistically significant P value of .05 or less may or may not be of true clinical importance. In addition to data showing statistical significance of an effect on a population, the magnitude of an effect is of clinical interest. A small or minimal effect can be statistically significant, but a clinically insignificant and non-statistical significant study may show important clinical effects.
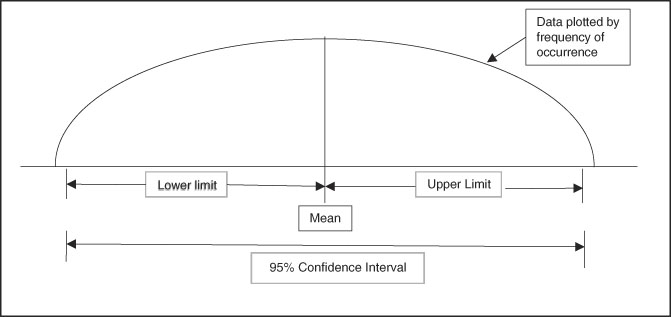
Confidence intervals provide a measure of the magnitude of an effect. The formal definition of a confidence interval is a range of values for a variable (effect) of interest such that the range has probability of including the true value for the variable (Figure 1 and Figure 2). Convention is to report a 95% range for confidence intervals, meaning that there is a 95% probability that the true value of the effect is within the range generated. Clinically important is that a confidence interval is a range or magnitude within which the effect or outcome of interest is likely to lie. Confidence intervals compliment a hypothesis-testing P value by providing the magnitude of an effect in addition to a decision about statistically significant difference.
Graphic Representation of a 95% Confidence Interval with Normal Distribution of Continuous Data (Hypothetical Bell-Shaped Curve Distribution).
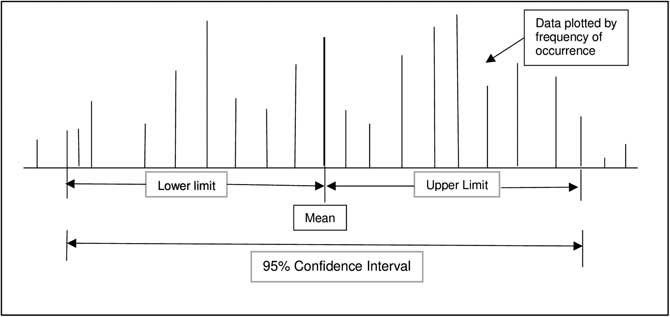
Graphic Representation of a 95% Confidence Interval with Non-Normal Distribution of Continuous Data.
Additionally, confidence intervals provide a measure of the tendency of data to be grouped in a narrow range (precision). A wide confidence interval indicates dispersal of data and a narrower confidence interval indicates data grouped in a more precise manner. This “precision” characteristic of confidence intervals is called the “measure of central tendency.” Widely dispersed confidence intervals indicate less reliability in the measured effect or a data set with too few elements (numbers) to be conclusive. When desired, intervals other than 95% are used to show precision of data, with 90% and 99% intervals the common alternates.
P values and confidence intervals can be calculated for proportions, differences of means and proportions, and other statistics such as regression slopes and relative risks. Interpretation of confidence intervals depends on the type of data analysis. An example is use of confidence intervals for assessing proportions. Consider a statistic such as Relative Risk where 1.0 is considered no difference in risk between two study groups. If a calculated 95% confidence interval range is above 1.0, one can state a risk exists for the group of interest. If the range is below 1.0, one can assume there is decreased risk. However, if the range crosses above and below 1.0, there is both risk and no risk, indicating no benefit or risk can be determined between the two groups. Additionally, the range or magnitude of effect (risk or benefit) can be determined by assessing the width and location of the confidence interval range relative to 1.0.
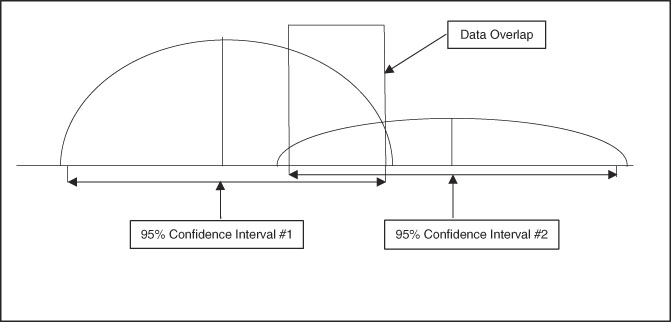
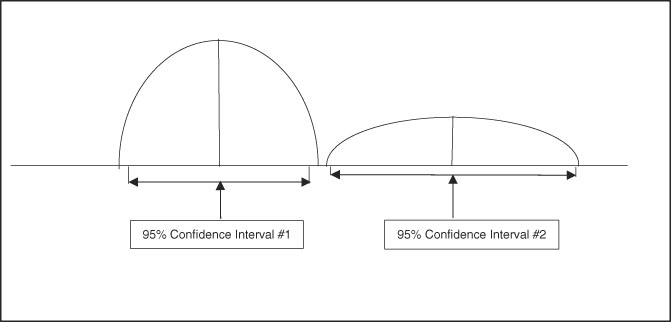
A useful aspect of confidence intervals is comparison of means. When comparing two means to determine if they represent distinct and different population effects, the confidence intervals can be compared, as shown in Figure 3 and Figure 4. If the confidence intervals overlap as shown in Figure 3, there is risk for comingled values indicating lack of a distinct difference between the two sets of data. Figure 4 shows no comingled data with separation of the confidence intervals, indicating high probability that the two populations are truly different. When this population difference occurs, it is termed “clinically significant.”
Graphic Representation of Two Sets of Data with Well-Differentiated Means but Overlap of 95% Confidence Intervals, Indicating the Two Data Sets are Not Necessarily Separate in Clinical Significance.
Graphic Representation of Two Sets of Data with Well-Differentiated Means and No Overlap of 95% Confidence Intervals, Indicating the Two Data Sets are Clinically Significant and Distinct.
As important as P values and confidence intervals are in interpreting study data, it is necessary to note that these values are only as good as the data to which they are applied. Common problems that generate false P values and confidence intervals are bias in study method, missing data, and too few cases entered into a study (beta-error). Any of these flaws will generate invalid data analysis and risk for false conclusions.
In summary, both P values and confidence intervals are valuable tools that provide strong support for interpretation of data. P values give an indication of a real difference between data sets or populations. Confidence intervals provide an estimate of the magnitude of an effect within a data set or between populations. To allow for full interpretation of research results in prehospital, emergency public health, and disaster medicine, it is imperative to report both P values and confidence intervals when appropriate for the study data.


