





1 Introduction
When handling high-dimensional tensor data, as often done in psychometrics sciences, it is common to seek a low-dimensional representation of the data to capture the latent information more efficiently and enhance characterization. Indeed, this low-dimensional representation often helps reduce the data’s high-dimensionality-induced complexity. In this setting, it is increasingly common to manipulate tensors with some underlying smooth structure in one of the modes. Additionally, since data are often collected through a sampling process, tensors commonly feature a mode (the “sample mode”) on which the induced sub-tensors can be seen as samples drawn from a random tensor distribution. In longitudinal studies involving tensor-valued data, these two properties are often encountered: the time-continuous property naturally implies that one of the modes has a smooth structure, while the sampling setting introduces randomness along one tensor mode, as described previously. Since integrating these smooth and probabilistic structures would lead to more interpretable results, extending the functional and multiway data analysis procedures appears essential to help psychometric researchers leverage the increasing complexity of their datasets.
For instance, we propose to consider in this article multiple neurocognitive markers observed over time to evaluate the cognitive abilities of Alzheimer’s disease (AD) patients and cognitively normal (CN) patients observed in the Alzheimer’s Disease Neuroimaging Initiative (ADNI) study. In this context, retrieving the most important modes of variation among patients can be particularly useful for medical researchers to investigate mechanisms behind cognitive decline among AD and CN patients. The data, which can be organized as a tensor with dimensions
$\text {subject} \times \text {time} \times \text {marker}$
 , come with the properties described previously. Notably, the first mode can be seen as a “sample” mode, which comes with an underlying statistical structure, as its elements can be seen as samples drawn from some complex tensor distribution. On the other hand, the second mode, which represents time, comes with an inherent continuous property. Considering this, it appears essential to consider both properties to retrieve relevant results and provide researchers with more insightful information.
In the tensor literature, the PARAFAC decomposition Carroll & Chang, Reference Carroll and Chang1970; Harshman, Reference Harshman1970, also known as CANDECOMP/PARAFAC (CP) or the canonical polyadic decomposition (CPD), is a well-known dimension reduction approach used to represent a tensor as a sum of rank-1 tensors. The method effectively reduces the high-dimensionality of a tensor to a collection of matrices with a matching number of columns R, also called the rank. The Tucker decomposition Tucker, Reference Tucker1966 is a closely related technique reducing the dimension of a tensor to a collection of matrices, with a varying number of columns
$r_1, \dots , r_D$
 , and a (smaller) tensor, of dimensions
$r_1 \times \dots \times r_D$
, and a (smaller) tensor, of dimensions
$r_1 \times \dots \times r_D$
 , called the tensor core. Both approaches have been studied intensively and applied to numerous statistical problems Sidiropoulos et al., Reference Sidiropoulos, De Lathauwer, Fu, Huang, Papalexakis and Faloutsos2017, including regression Lock, Reference Lock2018; Zhou et al., Reference Zhou, Li and Zhu2013.
Over the past decades, numerous methods have been developed to analyze data exhibiting an underlying smooth structure. Such data are commonly referred to in the literature as functional data (see Ramsay & Silverman, Reference Ramsay and Silverman2006; Wang et al. Reference Wang, Chiou and Müller2016). In this context, functional principal component analysis (FPCA) has become a widely used technique for reducing the underlying infinite-dimensional space of the data to a low-dimensional subspace spanned by the most informative modes of variation, represented by the eigenfunctions of the covariance operator. To ensure smooth eigenfunctions, Rice and Silverman (Reference Rice and Silverman1991) introduced smoothing penalties in the estimation of the mean and covariance functions. Building on this, Yao et al. (Reference Yao, Müller and Wang2005) proposed a local linear smoothing approach for estimating the covariance surface and extracting smooth eigenfunctions. FPCA has since been extended in various directions, including multilevel data Di et al., Reference Di, Crainiceanu, Caffo and Punjabi2009 and multivariate data Happ & Greven, Reference Happ and Greven2018, and has been applied to broader statistical problems such as regression Morris, Reference Morris2015.
Despite these advances, there has been limited progress in bridging the gap between functional data analysis and tensor methods to handle tensors with inherent smooth structures. In this context, most approaches rely on smoothness penalties, particularly in the context of tensor decomposition Imaizumi & Hayashi, Reference Imaizumi and Hayashi2017; Reis & Ferreira, Reference Reis and Ferreira2002; Timmerman & Kiers, Reference Timmerman and Kiers2002; Yokota et al., Reference Yokota, Zhao and Cichocki2016. More recently, Guan (Reference Guan2023) proposed to extend the supervised PARAFAC framework of Lock and Li (Reference Lock and Li2018) to decompose order-3 smooth tensors using a smoothness penalty. A key advantage of the method is its ability to handle missing data, considering shared missingness, and sparse settings, which are common in longitudinal studies. Alternatively, Han et al. (Reference Han, Shi and Zhang2023) extended functional singular value decomposition (SVD) to tensor-valued data using a reproducing kernel Hilbert space (RKHS) framework.
Nevertheless, a general and flexible framework that extends PARAFAC to functional tensors—capable of handling sparse and irregular sampling as well as the inherent randomness in observations—is still lacking. Notably, the method introduced in Han et al. (Reference Han, Shi and Zhang2023) does not accommodate irregular sampling and does not rely on a probabilistic model, while the approach introduced by Guan (Reference Guan2023) may lack of robustness for very sparse and irregular sampling schemes due to smoothing penalty considered. Finally, tensor methods grounded in time-series analysis have recently emerged Chang et al., Reference Chang, He, Yang and Yao2023; Chen et al., Reference Chen, Han, Li, Xiao, Yang and Yu2022; Wang et al., Reference Wang, Zheng and Li2024, offering potential to integrate smooth structures. However, these frameworks typically assume densely and regularly sampled data, which is not suited for the sparse and irregular settings considered here.
In this context, we introduce a new latent and functional PARAFAC model for functional tensors of any order with an underlying statistical structure. Our method uses a covariance-based algorithm that requires the estimation of (cross-)covariance surfaces of the functional entries of the tensor, allowing the decomposition of highly sparse and irregular data. Furthermore, we introduce a conditional approach, inspired by Yao et al. (Reference Yao, Müller and Wang2005), to predict individual-mode factors and fit the data more accurately under mild assumptions.
The article is organized as follows. In Section 2, we introduce notations and existing methods before presenting the proposed method. In Section 3, we provide the estimation setting and introduce the solving procedure for the method. An estimation method for sample-mode vectors is shown afterward. We present results obtained on simulated data in Section 4. As introduced above, we then provide an application study of our method in Section 5 to help characterize multiple neurocognitive scores observed over time in the ADNI study. Finally, we discuss our method’s limitations and possible extensions in Section 6. All proofs are given in Appendix A. The code associated with this article can be found in Supplementary Materials.
2 Model
2.1 Notations
2.1.1 Tensor notations
In the following, we denote a vector by a small bold letter
$\mathbf {a}$
 , a matrix by a capital bold letter
$\mathbf {A}$
, a matrix by a capital bold letter
$\mathbf {A}$
 , and a tensor by a calligraphic letter
$\mathcal {A}$
, and a tensor by a calligraphic letter
$\mathcal {A}$
 . Scalars are denoted so they do not fall in any of those categories. Additionally, we denote
$[D] = \{1, \dots , D\}$
. Scalars are denoted so they do not fall in any of those categories. Additionally, we denote
$[D] = \{1, \dots , D\}$
 . Elements of a vector
$\mathbf {a}$
. Elements of a vector
$\mathbf {a}$
 are denoted by
$a_j$
are denoted by
$a_j$
 , of a matrix
$\mathbf {A}$
, of a matrix
$\mathbf {A}$
 by
$a_{jj'}$
by
$a_{jj'}$
 , and of a tensor
$\mathcal {A}$
, and of a tensor
$\mathcal {A}$
 of order D by
$a_{j_1 \dots j_D}$
of order D by
$a_{j_1 \dots j_D}$
 , often abbreviated using the vector of indices
$\mathbf {j} = (j_1, \dots , j_D)$
, often abbreviated using the vector of indices
$\mathbf {j} = (j_1, \dots , j_D)$
 as
$a_{\mathbf {j}}$
as
$a_{\mathbf {j}}$
 . The jth column of
$\mathbf {A}$
. The jth column of
$\mathbf {A}$
 is denoted by
$\mathbf {a}_j$
is denoted by
$\mathbf {a}_j$
 . The Frobenius norm of a matrix is defined as
$\|\mathbf {A}\|_F^2 = \operatorname {\mathrm {tr}}(\mathbf {A}^\top \mathbf {A}) = \sum _{j, j'} a_{jj'}^2$
. The Frobenius norm of a matrix is defined as
$\|\mathbf {A}\|_F^2 = \operatorname {\mathrm {tr}}(\mathbf {A}^\top \mathbf {A}) = \sum _{j, j'} a_{jj'}^2$
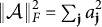
 . We extend this definition to tensors as
$\|\mathcal {A}\|_F^2 = \sum _{\mathbf {j}} a_{\mathbf {j}}^2$
. We extend this definition to tensors as
$\|\mathcal {A}\|_F^2 = \sum _{\mathbf {j}} a_{\mathbf {j}}^2$
 . We denote the mode-d matricization of a tensor
$\mathcal {X}$
. We denote the mode-d matricization of a tensor
$\mathcal {X}$
 as the matrix
$\mathbf {X}_{(d)} \in \mathbb {R}^{p_d \times p_{(-d)}}$
as the matrix
$\mathbf {X}_{(d)} \in \mathbb {R}^{p_d \times p_{(-d)}}$
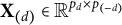 , where
$p_{(-d)} = \prod _{d'\neq d} p_{d'}$
, where
$p_{(-d)} = \prod _{d'\neq d} p_{d'}$
 , which columns correspond to mode-d fibers of the tensor
$\mathcal {X}$
, which columns correspond to mode-d fibers of the tensor
$\mathcal {X}$
 . We denote the vectorization operator, stacking the columns of a matrix
$\mathbf {A}$
. We denote the vectorization operator, stacking the columns of a matrix
$\mathbf {A}$
 into a column vector, as
$\operatorname *{\mathrm {vec}}(\mathbf {A})$
into a column vector, as
$\operatorname *{\mathrm {vec}}(\mathbf {A})$
 . In this context, we define the mode-d vectorization as
$\mathbf {x}_{(d)} = \operatorname *{\mathrm {vec}}(\mathbf {X}_{(d)}) \in \mathbb {R}^{P\times 1}$
. In this context, we define the mode-d vectorization as
$\mathbf {x}_{(d)} = \operatorname *{\mathrm {vec}}(\mathbf {X}_{(d)}) \in \mathbb {R}^{P\times 1}$
 , where
$P = \prod _{d} p_{d}$
, where
$P = \prod _{d} p_{d}$
 . The mode-
$1$
. The mode-
$1$
 vectorization of
$\mathcal {X}$
vectorization of
$\mathcal {X}$
 is sometimes simply denoted
$\mathbf {x} = \mathbf {x}_{(1)}$
is sometimes simply denoted
$\mathbf {x} = \mathbf {x}_{(1)}$
 . For two matrices
$\mathbf {A} \in \mathbb {R}^{p\times d}$
. For two matrices
$\mathbf {A} \in \mathbb {R}^{p\times d}$
 and
$\mathbf {B} \in \mathbb {R}^{p' \times d'}$
and
$\mathbf {B} \in \mathbb {R}^{p' \times d'}$
 , the Kronecker product between
$\mathbf {A}$
, the Kronecker product between
$\mathbf {A}$
 and
$\mathbf {B}$
and
$\mathbf {B}$
 is defined as

The Khatri–Rao product between two matrices with a fixed number of columns
$\mathbf {A} = [\mathbf {a}_1 \dots \mathbf {a}_d] \in \mathbb {R}^{p\times d}$
 and
$\mathbf {B} = [\mathbf {b}_1 \dots \mathbf {b}_d]\in \mathbb {R}^{p' \times d}$
and
$\mathbf {B} = [\mathbf {b}_1 \dots \mathbf {b}_d]\in \mathbb {R}^{p' \times d}$
 is defined as a column-wise Kronecker product:

Finally, the Hadamard product between two matrices with similar dimensions
$\mathbf {A} \in \mathbb {R}^{p\times d}$
 and
$\mathbf {B} \in \mathbb {R}^{p\times d}$
and
$\mathbf {B} \in \mathbb {R}^{p\times d}$
 is defined as the element-wise product of the two matrices:

2.1.2 Functional notations
Considering an interval
$\mathcal {I} \subset \mathbb {R}$
 , we consider now the space
$L^2(\mathcal {I})$
, we consider now the space
$L^2(\mathcal {I})$
 of square integrable functions on
$\mathcal {I}$
of square integrable functions on
$\mathcal {I}$
 (i.e.,
$\int _{\mathcal {I}} f(s)^2 \mathrm {d}s < \infty $
(i.e.,
$\int _{\mathcal {I}} f(s)^2 \mathrm {d}s < \infty $
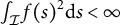 ). The inner product in
$L^2(\mathcal {I})$
). The inner product in
$L^2(\mathcal {I})$
 is defined for any
$f \in L^2(\mathcal {I})$
is defined for any
$f \in L^2(\mathcal {I})$
 and
$g \in L^2(\mathcal {I})$
and
$g \in L^2(\mathcal {I})$
 by
$\langle f, g \rangle _{L^2} = \int _{\mathcal {I}} f(s)g(s) \mathrm {d}s$
by
$\langle f, g \rangle _{L^2} = \int _{\mathcal {I}} f(s)g(s) \mathrm {d}s$
 . In the multivariate functional data setting (see Happ & Greven, Reference Happ and Greven2018), we can define the inner product between two multivariate functions
$\mathbf {f} \in L^2(\mathcal {I}){}^p$
. In the multivariate functional data setting (see Happ & Greven, Reference Happ and Greven2018), we can define the inner product between two multivariate functions
$\mathbf {f} \in L^2(\mathcal {I}){}^p$
 and
$\mathbf {g} \in L^2(\mathcal {I}){}^p$
and
$\mathbf {g} \in L^2(\mathcal {I}){}^p$
 as
as

which defines a Hilbert Space. Considering now the space
$L^2(\mathcal {I}){}^{p_1 \times \dots \times p_D}$
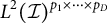 of tensors of order D with entries in
$L^2(\mathcal {I})$
of tensors of order D with entries in
$L^2(\mathcal {I})$
 . We define the inner product between two functional tensors
$\mathcal {F} \in L^2(\mathcal {I}){}^{p_1 \times \dots \times p_D}$
. We define the inner product between two functional tensors
$\mathcal {F} \in L^2(\mathcal {I}){}^{p_1 \times \dots \times p_D}$
 and
$\mathcal {G} \in L^2(\mathcal {I}){}^{p_1 \times \dots \times p_D}$
and
$\mathcal {G} \in L^2(\mathcal {I}){}^{p_1 \times \dots \times p_D}$
 as
as

where we denote
$f_{\mathbf {j}}(s) = (f(s))_{\mathbf {j}}$
 .
.
2.2 Existing methods
The PARAFAC decomposition Carroll & Chang, Reference Carroll and Chang1970; Harshman, Reference Harshman1970 is a powerful and well-known method in the tensor literature. Its purpose is to represent any tensor as a sum of rank-
$1$
 tensors. In
$\mathbb {R}^{p_1 \times \dots \times p_D}$
tensors. In
$\mathbb {R}^{p_1 \times \dots \times p_D}$
 , the rank-R PARAFAC decomposition is defined as

where
$\mathbf {a}_{dr} \in \mathbb {R}^{p_d}$
 and
$\mathbf {A}_d = [\mathbf {a}_{d1}, \dots , \mathbf {a}_{dR}] \in \mathbb {R}^{p_d \times R}$
and
$\mathbf {A}_d = [\mathbf {a}_{d1}, \dots , \mathbf {a}_{dR}] \in \mathbb {R}^{p_d \times R}$
 . Here, each vector
$\mathbf {a}_{dr}$
. Here, each vector
$\mathbf {a}_{dr}$
 captures latent information along the mode d of the tensor. Consequently, the PARAFAC decomposition can be effectively employed as a dimension reduction technique, particularly compelling in the tensor setting, as the number of variables grows exponentially with the order of the tensor.
To approximate any tensor
$\mathcal {X} \in \mathbb {R}^{p_1 \times \dots \times p_D}$
 using a PARAFAC decomposition, factor matrices
$\mathbf {A}_d$
using a PARAFAC decomposition, factor matrices
$\mathbf {A}_d$
 are estimated by minimizing the squared difference between the original tensor
$\mathcal {X}$
are estimated by minimizing the squared difference between the original tensor
$\mathcal {X}$
 and its decomposition approximation,

The original optimization process used an alternating least squares (ALS) procedure Carroll & Chang, Reference Carroll and Chang1970; Harshman, Reference Harshman1970, where, iteratively, each factor matrix is updated while keeping the others fixed until convergence is reached. The procedure belongs to the more general class of block relaxation algorithms, known to be locally and globally convergent under mild assumptions Lange, Reference Lange2013. Note that PARAFAC can be seen as a generalization of the factor analysis framework Bartholomew et al., Reference Bartholomew, Knott and Moustaki2011, which is commonly used in psychometrics. Indeed, the loading vector associated with the statistical/sample mode (which we will describe after) can be seen as factors, and all other parameters can be used to derive loading factors.
A good property of the PARAFAC decomposition is that aside from scaling and order indeterminacies, the decomposition is generally unique Sidiropoulos & Bro, Reference Sidiropoulos and Bro2000. The scaling indeterminacy stems from the fact that, for
$r = 1, \dots , R$
 , when considering any set of scalars
$c_{1r}, \dots , c_{Dr}$
, when considering any set of scalars
$c_{1r}, \dots , c_{Dr}$
 such that
$\prod _d c_{dr} = 1$
such that
$\prod _d c_{dr} = 1$
 , using
$\tilde {\mathbf {a}}_{dr} = c_{dr} \mathbf {a}_{dr}$
, using
$\tilde {\mathbf {a}}_{dr} = c_{dr} \mathbf {a}_{dr}$
 leads to a similar tensor as when using
$\mathbf {a}_{dr}$
leads to a similar tensor as when using
$\mathbf {a}_{dr}$
 . This indeterminacy is usually fixed by scaling vectors
$\mathbf {a}_{dr}$
. This indeterminacy is usually fixed by scaling vectors
$\mathbf {a}_{dr}$
 for
$d = 1, \dots , D-1$
for
$d = 1, \dots , D-1$
 and
$r = 1, \dots , R$
and
$r = 1, \dots , R$
 , such that they have unit-norm. On the other hand, the order indeterminacy is caused by the fact that permuting columns of matrices
$\mathbf {A}_d$
, such that they have unit-norm. On the other hand, the order indeterminacy is caused by the fact that permuting columns of matrices
$\mathbf {A}_d$
 jointly does not change the resulting tensor. This indeterminacy can be fixed by ordering matrix columns such that
$\| \mathbf {a}_{D1} \| < \| \mathbf {a}_{D2} \| <\dots < \| \mathbf {a}_{DR}\| $
jointly does not change the resulting tensor. This indeterminacy can be fixed by ordering matrix columns such that
$\| \mathbf {a}_{D1} \| < \| \mathbf {a}_{D2} \| <\dots < \| \mathbf {a}_{DR}\| $

Applying the PARAFAC model straightforwardly to decompose a tensor with smooth functional entries may be inefficient as the method does not integrate the smooth property. The PARAFAC decomposition also assumes a consistent structure across tensor modes. Therefore, it cannot handle schemes where functional entries are sampled irregularly, e.g., at different time points. To answer this last problem, several alternatives to the PARAFAC model were introduced, especially the PARAFAC2 model Harshman, Reference Harshman1972; Kiers et al., Reference Kiers, ten Berge and Bro1999, which was widely employed but still does not integrate any smoothness structure into the reconstructed tensor.
Another limitation of the PARAFAC model in our setting is that it is not a statistical model. Consequently, it does not integrate the potential sampling structure of the data. In the tensor literature, several approaches are able to integrate this property (see Giordani et al. (Reference Giordani, Rocci and Bove2020) for references). The SupCP model of Lock and Li (Reference Lock and Li2018) or the SupSVD model Li et al. (Reference Li, Yang, Nobel and Shen2016) recently went even further in this direction by allowing the introduction of covariates in the sampling modeling.
In the functional setting, the Karhunen–Loève theorem is often used to retrieve a low-dimensional representation of a high (or infinite) dimensional random process. The theorem guarantees the existence of an orthonormal basis
${\Phi _k}$
 and a sequence
${\xi _k}$
and a sequence
${\xi _k}$
 of independent random variables for any squared integrable random process X, such that

By truncating the above sum to a limited number of functions, we can recover a good enough representation of X. More recently, this decomposition was extended to multivariate functional data, allowing the representation of any multivariate random process as a sum of multivariate orthonormal functions and scores. By arranging the sequence of independent random variables
${\xi _k}$
 in descending order of variance, this decomposition can be viewed as an extension of the well-known principal component analysis (PCA). Similarly to the PCA, estimating parameters in model (4) relies on the eigen decomposition of the covariance operator of the random process. As evoked previously, numerous approaches have been proposed to achieve this. The most notable of which, Yao et al. (Reference Yao, Müller and Wang2005), proposed a linear least squares smoothing procedure with asymptotic guarantees, allowing estimation of the covariance surface in sparse and irregular data sampling settings. Furthermore, using simple assumptions on the joint distribution of principal components and residual errors, they introduce an efficient approach for estimating principal components.
When dealing with multivariate or tensor-structured functional data, it appears natural to extend this decomposition. As evoked in Section 1, various approaches have been introduced to extend this decomposition to multivariate functional data. In the tensor-structured functional data setting, vectorizing the tensor appears as a straightforward way to proceed. However, similar to before, as the number of processes grows exponentially with the order of the tensor, this procedure would be computationally unfeasible for large tensors, as it would require estimating orthonormal functions for each functional feature. In addition, the vectorization of the tensor would lead to the loss of the tensor structure, and the resulting representation would still be high-dimensional, causing the approach to be inefficient.
2.3 Proposed model
We propose to extend the rank R PARAFAC decomposition introduced in (2) to functional tensors with elements in
$L^2(\mathcal {I})$
 by further multiplying each rank-1 sub-tensor
$\mathbf {a}_{1r} \circ \dots \circ \mathbf {a}_{Dr}$
by further multiplying each rank-1 sub-tensor
$\mathbf {a}_{1r} \circ \dots \circ \mathbf {a}_{Dr}$
 by a functional term
$\phi _{r} \in \mathscr {H}$
by a functional term
$\phi _{r} \in \mathscr {H}$
 , where
$\mathscr {H}$
, where
$\mathscr {H}$
 is a subset of
$L^2(\mathcal {I})$
is a subset of
$L^2(\mathcal {I})$
 ,
,
![Summation from r=1 to R of phi sub r (t) (a sub 1r circle ... circle a sub Dr) = [[phi(t); A sub 1; ...; A sub D]], t in I.](https://static.cambridge.org/binary/version/id/urn:cambridge.org:id:binary:20260630090126869-0627:S0033312325100756:S0033312325100756_eqn5.png?pub-status=live)
denoting
$\boldsymbol {\phi } = (\phi _{1}, \dots , \phi _{r}) \in \mathscr {H}^R$
 . We propose to name this decomposition the functional PARAFAC (F-PARAFAC) decomposition.
As discussed earlier, it is common for a functional tensor to have a sample mode, i.e., a mode on which sub-tensors can be seen as samples drawn from an underlying tensor distribution. Similar to the structural PARAFAC model Giordani et al., Reference Giordani, Rocci and Bove2020, we propose to account for the inherent randomness of random functional tensors with elements in
$L^2(\mathcal {I})$
 by multiplying each rank-
$1$
by multiplying each rank-
$1$
 functional tensor
$\phi _{r}(t) (\mathbf {a}_{1r} \circ \dots \circ \mathbf {a}_{Dr})$
functional tensor
$\phi _{r}(t) (\mathbf {a}_{1r} \circ \dots \circ \mathbf {a}_{Dr})$
 by a random variable
$u_r$
by a random variable
$u_r$
 ,
,
![Summation from r=1 to R of u sub r phi sub r (t) (a sub 1r circle ... circle a sub Dr) = [[u; phi(t); A sub 1; ...; A sub D]], t in I.](https://static.cambridge.org/binary/version/id/urn:cambridge.org:id:binary:20260630090126869-0627:S0033312325100756:S0033312325100756_eqn6.png?pub-status=live)
denoting
$\mathbf {u} = (u_1, \dots , u_R) \in \mathbb {R}^{R}$
 . We propose naming this model the latent functional PARAFAC (LF-PARAFAC) decomposition. A visualization of the model is given in Figure 1. Assumptions on the distribution of
$\mathbf {u}$
. We propose naming this model the latent functional PARAFAC (LF-PARAFAC) decomposition. A visualization of the model is given in Figure 1. Assumptions on the distribution of
$\mathbf {u}$
 are further discussed in Section 3.
Latent functional PARAFAC decomposition for an order-3 functional tensor.

Figure 1 Long description
The diagram flows from left to right.
* On the far left is a three-dimensional cube representing a tensor. It is labeled with dimensions n for height, p sub c for depth, and l for width. The front face of the cube contains three horizontal wavy lines and an ellipsis in the center.
* To the right of the cube is an equals sign, followed by a series of additive components.
* The first component consists of a vertical rectangle labeled u sub 1, a diagonal rectangle labeled c sub 1, and a wavy line labeled Phi sub 1. An arrow points from the vertical rectangle u sub 1 to a bell curve above it.
* A plus sign and an ellipsis lead to the final component on the right, which mirrors the first. It features a vertical rectangle u sub R, a diagonal rectangle c sub R, and a wavy line Phi sub R. An arrow also points from u sub R to a second bell curve above it.
* A long horizontal double-headed arrow spans across the top of both bell curves, labeled with the normal distribution notation N(0, Lambda).
Given a random functional tensor
$\mathcal {X}$
 , which we assume to be centered throughout this section, we are interested in finding the best LF-PARAFAC decomposition approximating
$\mathcal {X}$
, which we assume to be centered throughout this section, we are interested in finding the best LF-PARAFAC decomposition approximating
$\mathcal {X}$
 :
:

In this optimization problem,
$\boldsymbol {\psi }^{\ast}$
 is the operator
$\mathcal {X} \mapsto \boldsymbol {\psi }^{\ast}(\mathcal {X}) = \mathbf {u}^{\ast}$
is the operator
$\mathcal {X} \mapsto \boldsymbol {\psi }^{\ast}(\mathcal {X}) = \mathbf {u}^{\ast}$
 outputting the optimal (over the expectation) random vector
$\mathbf {u}^{\ast} \in \mathbb {R}^{1 \times R}$
outputting the optimal (over the expectation) random vector
$\mathbf {u}^{\ast} \in \mathbb {R}^{1 \times R}$
 for the random functional tensor distribution
$\mathscr {D}_{\mathcal {X}}$
for the random functional tensor distribution
$\mathscr {D}_{\mathcal {X}}$
 followed by
$\mathcal {X}$
followed by
$\mathcal {X}$
 . It implies that for any sample
$\mathcal {X}_n$
. It implies that for any sample
$\mathcal {X}_n$
 obtained from
$\mathscr {D}_{\mathcal {X}}$
obtained from
$\mathscr {D}_{\mathcal {X}}$
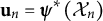
 , the criterion is optimal, in average, using the sample mode vector
$\mathbf {u}_n = \boldsymbol {\psi }^{\ast}(\mathcal {X}_n)$
, the criterion is optimal, in average, using the sample mode vector
$\mathbf {u}_n = \boldsymbol {\psi }^{\ast}(\mathcal {X}_n)$
 in its decomposition along with the other optimal parameters
$\boldsymbol {\phi }^{\ast}, \mathbf {A}_1^{\ast}, \dots , \mathbf {A}_D^{\ast}$
in its decomposition along with the other optimal parameters
$\boldsymbol {\phi }^{\ast}, \mathbf {A}_1^{\ast}, \dots , \mathbf {A}_D^{\ast}$
 . The asymmetry between
$\mathbf {u}$
. The asymmetry between
$\mathbf {u}$
 , which is random, and
$\boldsymbol {\phi }, \mathbf {A}_1, \dots , \mathbf {A}_D$
, which is random, and
$\boldsymbol {\phi }, \mathbf {A}_1, \dots , \mathbf {A}_D$
 , which are fixed, allows us to rewrite the optimization problem as
![min over phi, A sub 1, ..., A sub D of the expectation of [ min over u of the squared norm of script X minus [[u; phi; A sub 1; ...; A sub D]] ].](https://static.cambridge.org/binary/version/id/urn:cambridge.org:id:binary:20260630090126869-0627:S0033312325100756:S0033312325100756_eqn8.png?pub-status=live)
Proposition 1 gives the expression of
$\Psi ^{\ast}$
 , corresponding to the optimal matrix
$\mathbf {u}$
, corresponding to the optimal matrix
$\mathbf {u}$
 of the optimization sub-problem on the right-hand side of (8).
Proposition 1. Denoting
$\mathbf {A}_{(D)} = (\mathbf {A}_D \odot \dots \odot \mathbf {A}_{1})$
 , and fixing
$\boldsymbol {\phi }, \mathbf {A}_1, \dots , \mathbf {A}_D$
, and fixing
$\boldsymbol {\phi }, \mathbf {A}_1, \dots , \mathbf {A}_D$
 , for any
$\mathcal {X}$
, for any
$\mathcal {X}$
 , the optimal operator
$\boldsymbol {\psi }^{\ast}$
, the optimal operator
$\boldsymbol {\psi }^{\ast}$
 is given by

Plugging the optimal operator
$\Psi ^{\ast}$
 in model (6) eliminates the dependency on
$\mathbf {u}$
in model (6) eliminates the dependency on
$\mathbf {u}$
 , and the problem can now be seen as depending only on
$\boldsymbol {\phi }, \mathbf {A}_1, \dots , \mathbf {A}_D$
, and the problem can now be seen as depending only on
$\boldsymbol {\phi }, \mathbf {A}_1, \dots , \mathbf {A}_D$
 :
:

Denoting collapsed functional covariance matrices
$\boldsymbol {\Sigma }_{[f]}(s, t) = \mathbb {E} [\mathbf {x}(s) (\mathbf {I}_{P} \otimes \mathbf {x}(t)^\top )]$
 and
$\boldsymbol {\Sigma }_{[d]}(s, t) = \mathbb {E} [\mathbf {X}_{(d)}(s) (\mathbf {I}_{p_{(-d)}} \otimes \mathbf {x}(t)^\top )],$
and
$\boldsymbol {\Sigma }_{[d]}(s, t) = \mathbb {E} [\mathbf {X}_{(d)}(s) (\mathbf {I}_{p_{(-d)}} \otimes \mathbf {x}(t)^\top )],$
 where
$\mathbf {I}_{P}$
where
$\mathbf {I}_{P}$
 and
$\mathbf {I}_{p_{(-d)}}$
and
$\mathbf {I}_{p_{(-d)}}$
 denote the identity matrix of order P and
$p_{(-d)}$
denote the identity matrix of order P and
$p_{(-d)}$
 respectively, for which an interpretation of
$\boldsymbol {\Sigma }_{[f]}(s, t)$
respectively, for which an interpretation of
$\boldsymbol {\Sigma }_{[f]}(s, t)$
 and
$\boldsymbol {\Sigma }_{[d]}(s, t)$
and
$\boldsymbol {\Sigma }_{[d]}(s, t)$
 is given in Section 3.2, we can derive Corollary 1 from Proposition 1.
Corollary 1. Denoting
$\boldsymbol {\Lambda }^{\ast} = \mathbb {E}[\mathbf {u}^{\ast}{\mathbf {u}^{\ast}}^\top ]$
 the covariance matrix of
$\mathbf {u}^{\ast}$
the covariance matrix of
$\mathbf {u}^{\ast}$
 and
$\mathbf {K}(t) = (\mathbf {A}_{(D)} \odot \boldsymbol {\phi }(t)) \left ( \int (\mathbf {A}_{(D)} \odot \boldsymbol {\phi }(t))^\top (\mathbf {A}_{(D)} \odot \boldsymbol {\phi }(t)) \right )^{-1}$
and
$\mathbf {K}(t) = (\mathbf {A}_{(D)} \odot \boldsymbol {\phi }(t)) \left ( \int (\mathbf {A}_{(D)} \odot \boldsymbol {\phi }(t))^\top (\mathbf {A}_{(D)} \odot \boldsymbol {\phi }(t)) \right )^{-1}$
 , we have

Using Corollary 1, it is possible to show that the optimization problem only depends on the optimal covariance
$\boldsymbol {\Lambda }^{\ast}$
 and other operators derive via an operator C. Expressions of this operator C are derived in Lemma A1 in the Appendix.
For a given tensor, this operator C depends on the collapsed covariance
$\boldsymbol {\Sigma }_{[f]}$
 . This dependency can be replaced by a dependency on
$\boldsymbol {\Sigma }_{[d]}$
. This dependency can be replaced by a dependency on
$\boldsymbol {\Sigma }_{[d]}$
 for any
$d \in [D]$
for any
$d \in [D]$
 , which gives multiple expressions for C, introduced in Lemma A1. Lemma A2 in the Appendix allows us to derive simple stationary equations, which are introduced in Proposition 2.
Proposition 2. For the functional mode, for fixed
$\boldsymbol {\phi }$
 , we have

Denoting
$\mathbf {A}_{(-d)} = (\mathbf {A}_D \odot \dots \odot \mathbf {A}_{d+1} \odot \mathbf {A}_{d-1} \odot \dots \odot \mathbf {A}_{1})$
 , and
$\mathbf {A}_{(-d)}^{\boldsymbol {\phi }}(t) = \mathbf {A}_{(-d)} \odot \boldsymbol {\phi }(t),$
, and
$\mathbf {A}_{(-d)}^{\boldsymbol {\phi }}(t) = \mathbf {A}_{(-d)} \odot \boldsymbol {\phi }(t),$
 we have for any
$d\in [D]$
we have for any
$d\in [D]$
 tabular mode, for fixed
$\mathbf {A}_d$
tabular mode, for fixed
$\mathbf {A}_d$
 ,
,

2.4 Identifiability
As said previously, a well-known advantage of the PARAFAC decomposition is the identifiability of model parameters under mild assumptions. In the probabilistic setting, we define identifiability as the fact that if for two sets of model parameters
$\boldsymbol {\Theta } = (\boldsymbol {\Lambda }, \boldsymbol {\phi }, \mathbf {A}_1, \dots , \mathbf {A}_D)$
 and
$\tilde {\boldsymbol {\Theta }} = (\tilde {\boldsymbol {\Lambda }}, \tilde {\mathbf {A}}_f, \tilde {\mathbf {A}}_1, \dots , \tilde {\mathbf {A}}_D)$
and
$\tilde {\boldsymbol {\Theta }} = (\tilde {\boldsymbol {\Lambda }}, \tilde {\mathbf {A}}_f, \tilde {\mathbf {A}}_1, \dots , \tilde {\mathbf {A}}_D)$
 we have,
$L( \boldsymbol {\Theta }| \mathcal {X} ) = L( \tilde {\boldsymbol {\Theta }} | \mathcal {X} )$
we have,
$L( \boldsymbol {\Theta }| \mathcal {X} ) = L( \tilde {\boldsymbol {\Theta }} | \mathcal {X} )$
 , for any data
$\mathcal {X}$
, for any data
$\mathcal {X}$
 , where
$L( \boldsymbol {\Theta }| \mathcal {X} )$
, where
$L( \boldsymbol {\Theta }| \mathcal {X} )$
 stands for the model likelihood, then
$\boldsymbol {\Theta } = \tilde {\boldsymbol {\Theta }}$
stands for the model likelihood, then
$\boldsymbol {\Theta } = \tilde {\boldsymbol {\Theta }}$
 Lock & Li, Reference Lock and Li2018. In this context, similar to the standard setting, two well-known indeterminacies preventing parameters from being identifiable can be noted: the scaling and order indeterminacies. To remove these, we propose to consider the following assumptions:
-
(C1) For any $d\in [D]$
 and
$r\in [R]$
,
$\| \mathbf {a}_{dr} \|_2 = 1$
, and the first non-zero value of
$\mathbf {a}_{dr}$
is positive. Similarly,
$\| \phi _{r} \|_{\mathcal {H}} = 1$
and
$\phi _{r}$
is positive at the lower bound of its support.
and
$r\in [R]$
,
$\| \mathbf {a}_{dr} \|_2 = 1$
, and the first non-zero value of
$\mathbf {a}_{dr}$
is positive. Similarly,
$\| \phi _{r} \|_{\mathcal {H}} = 1$
and
$\phi _{r}$
is positive at the lower bound of its support. -
(C2) Function $\phi _{r}$
and vectors
$\mathbf {a}_{dr}$
are ordered such that sample-mode random variables
$u_r$
have decreasing variance:
$\boldsymbol {\Lambda }_{rr} < \boldsymbol {\Lambda }_{r'r'}$
for any
$r < r'$
(we suppose no equal variance).


Considering the scaling and order indeterminacies fixed, a simple condition on the k-rank of the feature matrices and R was derived Sidiropoulos & Bro, Reference Sidiropoulos and Bro2000 for tensors of any order to guarantee identifiability. In the probabilistic setting, it can be shown that the any-order structural PARAFAC decomposition model Giordani et al., Reference Giordani, Rocci and Bove2020, with just the probabilistic property considered, is identifiable (see Lemma A3 in the Appendix). We propose to extend this identifiability result in the LF-PARAFAC setting. Proposition 3 gives conditions for which model (6) is identifiable. We recall that we denote
$\operatorname {\mathrm {kr}}(\mathbf {A}_d)$
 the k-rank of the feature matrix
$\mathbf {A}_d$
the k-rank of the feature matrix
$\mathbf {A}_d$
 and define it as the maximum number k such that any k columns of
$\mathbf {A}_d$
and define it as the maximum number k such that any k columns of
$\mathbf {A}_d$
 are linearly independent.
Proposition 3. Denoting
$\mathscr {H}$
 the space to which belong functions
$\phi _r$
the space to which belong functions
$\phi _r$
 , assuming assumptions (C1) and (C2) verified, model (6) is identifiable if
$\mathscr {H}$
, assuming assumptions (C1) and (C2) verified, model (6) is identifiable if
$\mathscr {H}$
 is infinite-dimensional and if the following inequality is verified:

Conversely, assuming
$\mathscr {H}$
 is finite-dimensional, and, considering
$\{ \psi _k \}_{1 \leq k \leq p}$
is finite-dimensional, and, considering
$\{ \psi _k \}_{1 \leq k \leq p}$
 any basis of
$\mathscr {H}$
any basis of
$\mathscr {H}$
 , we can denote
$\mathbf {C}$
, we can denote
$\mathbf {C}$
 the
$R\times p$
the
$R\times p$
 basis decomposition matrix for functions
$\{\phi _r\}_{1 \leq r \leq R}$
basis decomposition matrix for functions
$\{\phi _r\}_{1 \leq r \leq R}$
 (i.e., with entries corresponding to
$\langle \psi _k, \phi _r\rangle _{\mathscr {H}}$
(i.e., with entries corresponding to
$\langle \psi _k, \phi _r\rangle _{\mathscr {H}}$
 ). In this context, model (6) is identifiable if deleting any row of
$\mathbf {C} \odot \mathbf {A}_1 \odot \dots \odot \mathbf {A}_D$
). In this context, model (6) is identifiable if deleting any row of
$\mathbf {C} \odot \mathbf {A}_1 \odot \dots \odot \mathbf {A}_D$
 results in a matrix having two distinct full-rank submatrices and if we have:

Proposition 3 ensures that for a small enough R, the LF-PARAFAC decomposition will be identifiable. This result also implies that using high values of R often leads to unidentifiable and, therefore, poorly conditioned decomposition. Consequently, we recommend in practice considering not too large rank values for the decomposition to ensure identifiability and therefore stability of the interpretation. Additionally, note that since we enforce unit-norm constraints (C2), the number of free parameters in the decomposition is therefore reduced by a factor
$RD$
 .
.
3 Estimation
3.1 Observation model
We now consider N samples of a random functional tensor
$\mathcal {X}$
 of order D, denoted
$\{\mathcal {X}_n\}_{1 \leq n \leq N}$
of order D, denoted
$\{\mathcal {X}_n\}_{1 \leq n \leq N}$
 . For a given
$\mathcal {X}_n$
. For a given
$\mathcal {X}_n$
 , we assume that entries of
$\mathcal {X}_n$
, we assume that entries of
$\mathcal {X}_n$
 are observed at similar time points, e.g., all functional entries of
$\mathcal {X}_n$
are observed at similar time points, e.g., all functional entries of
$\mathcal {X}_n$
 are observed at the same time points. Observation time points of
$\mathcal {X}_n$
are observed at the same time points. Observation time points of
$\mathcal {X}_n$
 are denoted
$t_{nk}$
are denoted
$t_{nk}$
 with
$ 1 \leq k \leq K_n$
with
$ 1 \leq k \leq K_n$
 . The number of observations
$K_n$
. The number of observations
$K_n$
 is allowed to be different across samples. In general, observations are contaminated with noise. Denoting
$\mathcal {E}$
is allowed to be different across samples. In general, observations are contaminated with noise. Denoting
$\mathcal {E}$
 the random functional tensor modeling this noise, and
$\mathcal {E}_{nk}$
the random functional tensor modeling this noise, and
$\mathcal {E}_{nk}$
 the measurement error associated with
$\mathcal {X}_{n}(t_{nk})$
the measurement error associated with
$\mathcal {X}_{n}(t_{nk})$
 , for any
$t \in \mathcal {I,}$
, for any
$t \in \mathcal {I,}$
 we consider that
$\mathcal {E}(t)$
we consider that
$\mathcal {E}(t)$
 has i.i.d. entries drawn from a distribution
$\mathcal {N}(0, \sigma ^2)$
has i.i.d. entries drawn from a distribution
$\mathcal {N}(0, \sigma ^2)$
 . The kth observation of the sample i, denoted
$\mathcal {Y}_{nk}$
. The kth observation of the sample i, denoted
$\mathcal {Y}_{nk}$
 , is thus modeled as

As we aim to decompose
$\mathcal {X}$
 , we model the random functional tensor using the mean functional tensor
$\mathcal {M} = \mathbb {E}[\mathcal {X}]$
, we model the random functional tensor using the mean functional tensor
$\mathcal {M} = \mathbb {E}[\mathcal {X}]$
 and the LF-PARAFAC decomposition model as introduced in (6),

In practice, as introduced in Section 2.3, we, therefore, seek parameters of the LF-PARAFAC decomposition model that best fit the data given by observations
$\{\mathcal {Y}_{nk}\}_{i,k}$
 . The noise term
$\mathcal {E}$
. The noise term
$\mathcal {E}$
 can also be seen as the unexplained part of the LF-PARAFAC decomposition. Furthermore, under the normality assumption on the error term
$\mathcal {E}_{nk}$
can also be seen as the unexplained part of the LF-PARAFAC decomposition. Furthermore, under the normality assumption on the error term
$\mathcal {E}_{nk}$
 entries, the identifiability result of Section 2.4, derived in the maximum likelihood setting, is similar for estimates obtained in the least squares setting (as seen in Section 2.3).
3.2 Covariance terms
In (12) and (13), we must estimate terms
$\boldsymbol {\Sigma }_{[f]}(s, t) = \mathbb {E} [\mathbf {x}(s) (\mathbf {I}_{P} \otimes \mathbf {x}(t)^\top )]$
 and
$\boldsymbol {\Sigma }_{[d]}(s, t) = \mathbb {E} [\mathbf {X}_{(d)}(s) (\mathbf {I}_{p_{(-d)}} \otimes \mathbf {x}(t)^\top )]$
and
$\boldsymbol {\Sigma }_{[d]}(s, t) = \mathbb {E} [\mathbf {X}_{(d)}(s) (\mathbf {I}_{p_{(-d)}} \otimes \mathbf {x}(t)^\top )]$
 to retrieve optimal functions
$\boldsymbol {\phi }^{\ast}$
to retrieve optimal functions
$\boldsymbol {\phi }^{\ast}$
 and factor matrices
$\mathbf {A}_d^{\ast}$
and factor matrices
$\mathbf {A}_d^{\ast}$
 . As evoke previously, for any
$d \in [D]$
. As evoke previously, for any
$d \in [D]$
 , the term
$\boldsymbol {\Sigma }_{[d]}(s, t)$
, the term
$\boldsymbol {\Sigma }_{[d]}(s, t)$
 can be seen as a transformation of the mode-d functional covariance matrix
$\boldsymbol {\Sigma }_{(d)}(s, t) = \mathbb {E}[\mathbf {x}_{(d)}(s) \mathbf {x}_{(d)}(t)^\top ] \in \mathbb {R}^{P \times P}$
can be seen as a transformation of the mode-d functional covariance matrix
$\boldsymbol {\Sigma }_{(d)}(s, t) = \mathbb {E}[\mathbf {x}_{(d)}(s) \mathbf {x}_{(d)}(t)^\top ] \in \mathbb {R}^{P \times P}$
 . Recalling that
$P = \prod _{d'} p_{d'}$
. Recalling that
$P = \prod _{d'} p_{d'}$
 and
$p_{(-d)} = \prod _{d'\neq d} p_{d'}$
and
$p_{(-d)} = \prod _{d'\neq d} p_{d'}$
 , the transformation consists of a row-space collapse of non-mode-d entries into the column space, resulting in a matrix of dimensions
$p_d\times P \cdot p_{(-d)}$
, the transformation consists of a row-space collapse of non-mode-d entries into the column space, resulting in a matrix of dimensions
$p_d\times P \cdot p_{(-d)}$
 .
.
To better grasp the idea, let’s consider an order-
$2$
 functional tensor of dimensions
$p_1\times p_2$
functional tensor of dimensions
$p_1\times p_2$
 . The mode-1 functional covariance matrix can be decomposed as

where each block functional matrix
$\boldsymbol {\Sigma }_{(j, j')}(s, t) = \mathbb {E}[\mathcal {X}_{.j}(s) \mathcal {X}_{. j'}(t)^\top ] \in \mathbb {R}^{p_1\times p_1}$
 , where
$\mathcal {X}_{. j}$
, where
$\mathcal {X}_{. j}$
 is the jth column of
$\mathcal {X}$
is the jth column of
$\mathcal {X}$
 , corresponds to functional covariance of mode-
$1$
, corresponds to functional covariance of mode-
$1$
 variables with fixed mode-
$2$
variables with fixed mode-
$2$
 variables
$j, j' \in [p_2]$
variables
$j, j' \in [p_2]$
 . The functional matrix
$\boldsymbol {\Sigma }_{[1]}(s, t)$
. The functional matrix
$\boldsymbol {\Sigma }_{[1]}(s, t)$
 can then be expressed as

For
$\boldsymbol {\Sigma }_{[2]}(s, t) \in \mathbb {R}^{p_2\times p_1 p_2 p_1}$
 , a similar reasoning can help see the structure of the matrix with respect to the functional block entries of
$\boldsymbol {\Sigma }_{(2)}$
, a similar reasoning can help see the structure of the matrix with respect to the functional block entries of
$\boldsymbol {\Sigma }_{(2)}$
 .
.
Since functional matrices
$\boldsymbol {\Sigma }_{(d)}$
 can be obtained by reordering
$\boldsymbol {\Sigma }$
can be obtained by reordering
$\boldsymbol {\Sigma }$
 , only
$\boldsymbol {\Sigma }$
, only
$\boldsymbol {\Sigma }$
 must be estimated to obtain an estimate of
$\boldsymbol {\Sigma }_{[d]}$
must be estimated to obtain an estimate of
$\boldsymbol {\Sigma }_{[d]}$
 . For this purpose, we rely on a local linear smoothing procedure outlined in Fan and Gijbels (Reference Fan and Gijbels2018). First, assuming functional tensor entries are not centered (
$\mathcal {M} \neq 0$
. For this purpose, we rely on a local linear smoothing procedure outlined in Fan and Gijbels (Reference Fan and Gijbels2018). First, assuming functional tensor entries are not centered (
$\mathcal {M} \neq 0$
 ), a centering pre-processing step is carried out. The mean function
$m_{\mathbf {j}} = \mathbb {E}[y_{\mathbf {j}}]$
), a centering pre-processing step is carried out. The mean function
$m_{\mathbf {j}} = \mathbb {E}[y_{\mathbf {j}}]$
 , which is estimated by aggregating observations and using the smoothing procedure evoked earlier, is removed from each functional entry of
$\mathcal {Y}$
, which is estimated by aggregating observations and using the smoothing procedure evoked earlier, is removed from each functional entry of
$\mathcal {Y}$
 . Next, for each pair of centered functional entries
$\mathcal {Y}_{\mathbf {j}}$
. Next, for each pair of centered functional entries
$\mathcal {Y}_{\mathbf {j}}$
 and
$\mathcal {Y}_{\mathbf {j}'}$
and
$\mathcal {Y}_{\mathbf {j}'}$
 , we estimate the (cross-)covariance surface
$\Sigma _{\mathbf {j}\mathbf {j}'}(s, t)$
, we estimate the (cross-)covariance surface
$\Sigma _{\mathbf {j}\mathbf {j}'}(s, t)$
 using a similar approach. The raw-(cross-)covariance is computed for each pair of observations within each sample. Raw (cross-)covariances are then aggregated, and the values are smoothed on a regular two-dimensional grid using the same smoothing procedure as before.
Additionally, we can estimate
$\sigma $
 by averaging the residual variance of functional entry. This residual variance is obtained for each process by running a one-dimensional smoothing of the diagonal using the previously removed pairs of observations and then averaging the difference between this smoothed diagonal and the previously computed smoothed diagonal (without the noise). For more details on this procedure, we refer the reader to the seminal paper by Yao et al. (Reference Yao, Müller and Wang2005).
This traditional smoothing approach was chosen for its simplicity and theoretical guarantees Yao et al., Reference Yao, Müller and Wang2005. However, several other approaches exist to estimate (cross-)covariance surfaces. Most notably, different smoothing procedures can be used Eilers & Marx, Reference Eilers and Marx2003; Wood, Reference Wood2003. For a univariate process, the fast covariance estimation (FACE) proposed by Xiao et al. (Reference Xiao, Zipunnikov, Ruppert and Crainiceanu2014) allows estimating the covariance surface with linear complexity (with respect to the number of observations). An alternative FACE method, robust to sparsely observed functional data, was introduced in Xiao et al. (Reference Xiao, Li, Checkley and Crainiceanu2017). More recently, the method was adapted to multivariate functional data in Li et al. (Reference Li, Xiao and Luo2020).
3.3 Solving procedure
Solution equations introduced in Proposition 2 along the expression of sample mode optimal vector covariance matrix introduced in Corollary 1 emphasize the use of a block relaxation algorithm outlined in Algorithm 1 to estimate parameters in (6).

Long description
The algorithm begins with a Result line defining Theta hat as a set containing Lambda hat, phi hat, and A sub 1 hat through A sub D hat.
Initialization: Theta hat super 0 is set to the initial values of Lambda, phi, and A sub 1 through A sub D, with the counter i set to 0.
The repeat loop contains the following steps:
1. Lambda super i plus 1 is updated using a double integral of K of s transpose, Sigma hat of s comma t, and K of t with respect to d s d t.
2. phi super i plus 1 is updated as the argmin over phi of the cost function C, taking Lambda super i plus 1 and the previous values of A sub 1 through A sub D as arguments.
3. A nested for loop runs from d equals 1 to D. Inside, A sub d super i plus 1 is updated as the argmin over A sub d of the cost function C. The arguments include the updated Lambda and phi, updated A values from 1 to d minus 1, the current A sub d, and the previous A values from d plus 1 to D.
4. The counter i is incremented by 1.
The loop terminates when the difference between the cost function C of Theta hat super i plus 1 and C of Theta hat super i is less than epsilon.
This algorithm uses all non-mode-d collapsed functional covariance matrices
$\boldsymbol {\Sigma }_{[d]}$
 as input. It produces estimates
$\hat {\boldsymbol {\Lambda }}, \hat {\boldsymbol {\phi }}, \hat {\mathbf {A}_1}, \dots , \hat {\mathbf {A}_D}$
as input. It produces estimates
$\hat {\boldsymbol {\Lambda }}, \hat {\boldsymbol {\phi }}, \hat {\mathbf {A}_1}, \dots , \hat {\mathbf {A}_D}$
 of the parameters in model (6).
Initialization can significantly influence the algorithm’s output, particularly in high-dimensional settings. In practice, random initialization is often chosen for simplicity, but it comes with the cost of running the algorithm multiple times. In our setting, we suggest initializing feature functions and matrices with the ones obtained from a standard PARAFAC decomposition. Experience shows that this simple approach is stable and provides good results. Note that alternative approaches were proposed in Guan (Reference Guan2023) and Han et al. (Reference Han, Shi and Zhang2023), but were not studied here.
3.4 Sample-mode inference
In this section, we consider that
$\mathbf {u}_n = (u_{n1}, \dots , u_{nR})^\top \in \mathbb {R}^R$
 . For a given sample
$\boldsymbol {\mathcal {Y}}_n$
. For a given sample
$\boldsymbol {\mathcal {Y}}_n$
 , when dealing with sparse and irregular observations, the estimation of
$\mathbf {u}_n$
, when dealing with sparse and irregular observations, the estimation of
$\mathbf {u}_n$
 given by (9) can be unstable (or untracktable), since it requires integrating
$\mathbf {x}_n$
given by (9) can be unstable (or untracktable), since it requires integrating
$\mathbf {x}_n$
 on possibly very few observation time points. Furthermore, this estimator can give inconsistent estimates as it does not incorporate the error term
$\mathcal {E}$
on possibly very few observation time points. Furthermore, this estimator can give inconsistent estimates as it does not incorporate the error term
$\mathcal {E}$
 . Therefore, similar to the FPCA PACE-based procedure of Yao et al. (Reference Yao, Müller and Wang2005), we propose using a conditional approach to predict the factors
$\mathbf {u}_n$
. Therefore, similar to the FPCA PACE-based procedure of Yao et al. (Reference Yao, Müller and Wang2005), we propose using a conditional approach to predict the factors
$\mathbf {u}_n$
 . In this context, we assume a joint Gaussian distribution on vectors
$\mathbf {u}_{i}$
. In this context, we assume a joint Gaussian distribution on vectors
$\mathbf {u}_{i}$
 and residual errors
$\mathbf {e}_{i}$
and residual errors
$\mathbf {e}_{i}$
 . Then, considering
$\mathbf {u}_n \sim \mathcal {N}(\mathbf {0}, \boldsymbol {\Lambda }),$
. Then, considering
$\mathbf {u}_n \sim \mathcal {N}(\mathbf {0}, \boldsymbol {\Lambda }),$
 we propose using the conditional expectation as our predictor of factors
$\mathbf {u}_n$
we propose using the conditional expectation as our predictor of factors
$\mathbf {u}_n$
 . Denoting
$\mathbf {y}_i$
. Denoting
$\mathbf {y}_i$
 the vector of observations of sample i, and
$\mathbf {m}_{i}$
the vector of observations of sample i, and
$\mathbf {m}_{i}$
 the vectorized mean tensor of
$\mathcal {Y}$
the vectorized mean tensor of
$\mathcal {Y}$
 , at time points
$\mathbf {t}_i$
, at time points
$\mathbf {t}_i$
 , Proposition 4 gives an expression of the conditional expectation of
$\mathbf {u}_n$
, Proposition 4 gives an expression of the conditional expectation of
$\mathbf {u}_n$
 .
.
Proposition 4. Denoting
$\mathbf {u}_n = (u_{n1}, \dots , u_{nR}) \in \mathbb {R}^{1 \times R} \mathbf {A}_{f,n} = [ \boldsymbol {\phi }(t_{n1})^\top , \dots , \boldsymbol {\phi }(t_{nK_n})^\top ]^\top \in \mathbb {R}^{K_n \times R}$
 ,
$\mathbf {F}_n = \mathbf {A}_{(D)} \odot \mathbf {A}_{f,n} \in \mathbb {R}^{K_n P \times R}$
,
$\mathbf {F}_n = \mathbf {A}_{(D)} \odot \mathbf {A}_{f,n} \in \mathbb {R}^{K_n P \times R}$
 , assuming joint Gaussian distribution on
$\mathbf {u}$
, assuming joint Gaussian distribution on
$\mathbf {u}$
 and residual errors, a conditional estimator of
$\mathbf {u}_n$
and residual errors, a conditional estimator of
$\mathbf {u}_n$
 is
is

Coupled with estimations
$\hat {\boldsymbol {\Lambda }}, \hat {\boldsymbol {\phi }}, \hat {\mathbf {A}_1}, \dots , \hat {\mathbf {A}_D}$
 obtained from Algorithm 1, and estimations
$\hat {\sigma }$
obtained from Algorithm 1, and estimations
$\hat {\sigma }$
 and
$\hat {\mathbf {m}}_n$
and
$\hat {\mathbf {m}}_n$
 of
$\sigma $
of
$\sigma $
 and
$\mathbf {m}_n$
and
$\mathbf {m}_n$
 , obtained as described in Section 3.2, Proposition 4 allows to derive the following empirical Bayes estimator for
$\mathbf {u}_n$
, obtained as described in Section 3.2, Proposition 4 allows to derive the following empirical Bayes estimator for
$\mathbf {u}_n$
 :
:

4 Simulations study
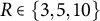
Using model (16), we generate
$N = 100$
 functional tensors of rank
$R \in \{3, 5, 10\}$
functional tensors of rank
$R \in \{3, 5, 10\}$
 on the interval
$\mathcal {I} = [0, 1]$
on the interval
$\mathcal {I} = [0, 1]$
 . Functions
$\phi _{r}$
. Functions
$\phi _{r}$
 are randomly generated using a Fourier basis, with
$M=5$
are randomly generated using a Fourier basis, with
$M=5$
 basis functions, and elements of factor matrices
$\mathbf {A}_d$
basis functions, and elements of factor matrices
$\mathbf {A}_d$
 are sampled from a uniform distribution. As assumed previously, sample mode vectors
$\mathbf {u}_n$
are sampled from a uniform distribution. As assumed previously, sample mode vectors
$\mathbf {u}_n$
 are drawn from a distribution
$\mathcal {N}(\mathbf {0}_R, \boldsymbol {\Lambda })$
are drawn from a distribution
$\mathcal {N}(\mathbf {0}_R, \boldsymbol {\Lambda })$
 , where
$\boldsymbol {\Lambda }$
, where
$\boldsymbol {\Lambda }$
 is the diagonal matrix
$\operatorname *{\mathrm {diag}}(\{ r^2 \})_{R \geq r \geq 1}$
is the diagonal matrix
$\operatorname *{\mathrm {diag}}(\{ r^2 \})_{R \geq r \geq 1}$
 . The functional tensor is sampled on a regular grid of
$\mathcal {I}$
. The functional tensor is sampled on a regular grid of
$\mathcal {I}$
 with size
$K=30$
with size
$K=30$
 . The resulting array is then sparsified by removing a proportion
$s \in \{0.0, 0.2, 0.5, 0.8\}$
. The resulting array is then sparsified by removing a proportion
$s \in \{0.0, 0.2, 0.5, 0.8\}$
 of observations. We consider two settings for tensor dimensions: one of order
$D=2$
of observations. We consider two settings for tensor dimensions: one of order
$D=2$
 , with
$p_1 = 10$
, with
$p_1 = 10$
 , and one of order
$D=3$
, and one of order
$D=3$
 with
$p_1 = p_2 = 5$
with
$p_1 = p_2 = 5$
 (in the Appendix). Observation tensors are contaminated with i.i.d. measurement errors of variance
$\sigma ^2 = 1$
(in the Appendix). Observation tensors are contaminated with i.i.d. measurement errors of variance
$\sigma ^2 = 1$
 , and we adjust the signal-to-noise ratio (SNR) by multiplying the original tensors by a constant
$c_{\text {SNR}}$
, and we adjust the signal-to-noise ratio (SNR) by multiplying the original tensors by a constant
$c_{\text {SNR}}$
 . Three settings are considered:
$\text {SNR} \in \{0.5, 1, 2\}$
. Three settings are considered:
$\text {SNR} \in \{0.5, 1, 2\}$
 .
.
We compare our approach to the native PARAFAC decomposition (without smoothing and probabilistic modeling), the functional tensor SVD (FTSVD) Han et al., Reference Han, Shi and Zhang2023, and the multivariate FPCA (MFPCA) Happ & Greven, Reference Happ and Greven2018. Due to software and package issues, we were unable to include other functional approaches in our comparison, particularly that of Guan (Reference Guan2023). Two comparison tasks are considered: a reconstruction task and a parameter recovery task. Since the FTSVD does not handle missing values, it is not considered when
$s \neq 0$
 . MFPCA is only considered for the reconstruction task as it is not based on the F-PARAFAC decomposition model. Furthermore, since the method only deals with multivariate functional data, we apply the mode on the vectorized tensor. To obtain an approximation of the original tensor, we then tensorize back the approximated functional vector. For the reconstruction task, the metric used to compare methods is the root mean squared error (RMSE) between original tensors
$\mathcal {X}_n$
. MFPCA is only considered for the reconstruction task as it is not based on the F-PARAFAC decomposition model. Furthermore, since the method only deals with multivariate functional data, we apply the mode on the vectorized tensor. To obtain an approximation of the original tensor, we then tensorize back the approximated functional vector. For the reconstruction task, the metric used to compare methods is the root mean squared error (RMSE) between original tensors
$\mathcal {X}_n$
 and approximations
$\hat {\mathcal {X}}_i$
and approximations
$\hat {\mathcal {X}}_i$
 . For the parameter recovery task, we compare the true functions
$\phi _{r}$
. For the parameter recovery task, we compare the true functions
$\phi _{r}$
 and estimated functions
$\hat {\phi }_{r}$
and estimated functions
$\hat {\phi }_{r}$
 using the maximum principal angle Bjorck & Golub, Reference Bjorck and Golub1973. MFPCA is carried out using the
$\texttt {R}$
using the maximum principal angle Bjorck & Golub, Reference Bjorck and Golub1973. MFPCA is carried out using the
$\texttt {R}$
 package
$\texttt {MFPCA}$
package
$\texttt {MFPCA}$
 , the PARAFAC decomposition is obtained using the multiway package, and the FTSVD is performed using the code from the associated paper. Simulations were run on a standard laptop.
As observed in Figure 2, we note that our approach outperforms all methods for SNR
$\in \{ 0.5, 1 \}$
 for the reconstruction task. For SNR
$=2$
for the reconstruction task. For SNR
$=2$
 , the naive PARAFAC decomposition seems to be the best approach. However, as seen in the parameter estimation task (Figure 3), smoothing approaches are more accurate for retrieving functions
$\phi _{r}$
, the naive PARAFAC decomposition seems to be the best approach. However, as seen in the parameter estimation task (Figure 3), smoothing approaches are more accurate for retrieving functions
$\phi _{r}$
 in all cases. Thanks to the smoothing procedure, our approach is particularly efficient when the SNR is low and the sparsity is high. The FTSVD performs well in retrieving the true feature functions but seems to be slightly worse than the PARAFAC decomposition at reconstructing the original tensor. The unfavorable setting may explain this observation, as we do not assume any additional regularity conditions on the space on which lie functions
$\phi _{r}$
in all cases. Thanks to the smoothing procedure, our approach is particularly efficient when the SNR is low and the sparsity is high. The FTSVD performs well in retrieving the true feature functions but seems to be slightly worse than the PARAFAC decomposition at reconstructing the original tensor. The unfavorable setting may explain this observation, as we do not assume any additional regularity conditions on the space on which lie functions
$\phi _{r}$
 . Nevertheless, the good performances, and, especially, the ability of our approach to handle settings with 80% of missing values, as observed in the figures, come with an overall increased computational cost, as other approaches ran much faster most of the time.
Root mean squared error (RMSE) of order-2 reconstructed functional tensors. Comparing latent functional PARAFAC (LF-PARAFAC), standard PARAFAC (PARAFAC), functional tensor singular value decomposition (FTSVD), and multivariate functional principal component analysis (MFPCA).

Figure 2 Long description
A multi-panel line and box plot grid with three columns labeled S N R equals 0.5, 1.0, and 2.0, and three rows labeled R equals 3, 5, and 10. The y-axis represents R M S E on a logarithmic scale, and the x-axis represents the Proportion of missing values from 0 to 0.8.
Legend at the top identifies four methods:
- L F PARAFAC (light blue)
- PARAFAC (gold)
- F T S V D (grey)
- M F P C A (dark green)
Data Trends:
- Across all panels, R M S E generally increases as the proportion of missing values increases.
- In the first column (S N R equals 0.5), L F PARAFAC consistently maintains the lowest R M S E across all R values and missingness levels.
- In the third column (S N R equals 2.0), the performance gap narrows, though L F PARAFAC and PARAFAC often outperform M F P C A and F T S V D at higher missingness levels.
- As R increases from 3 to 10 (moving down the rows), the absolute R M S E values increase, with the y-axis scale shifting from a maximum of 0.10 to 3.0.
- F T S V D often shows higher variance and higher R M S E compared to the functional methods, particularly in the S N R equals 2.0 column.
Max principal angle between
$\Phi $
 and
$\hat {\Phi }$
and
$\hat {\Phi }$
 . Comparing latent functional PARAFAC (LF-PARAFAC), standard PARAFAC (PARAFAC), and functional tensor singular value decomposition (FTSVD).

Figure 3 Long description
A three-by-three grid of box plots. The vertical Y-axis represents Max principal angle on a logarithmic scale. The horizontal X-axis represents Proportion of missing values with increments at 0, 0.2, 0.5, and 0.8. Columns are categorized by S N R values of 0.5, 1.0, and 2.0 from left to right. Rows are categorized by R values of 3, 5, and 10 from top to bottom.
* Legend: L F - PARAFAC is light blue, PARAFAC is gold, and F T S V D is grey.
* Data Trends: In all panels, the Max principal angle generally increases as the proportion of missing values increases.
* Method Comparison: L F - PARAFAC consistently maintains the lowest Max principal angle across most conditions, especially as R increases. PARAFAC typically shows the highest error values. F T S V D is only present for the 0 proportion of missing values in most panels, where it performs better than PARAFAC but worse than L F - PARAFAC.
* Impact of S N R: As S N R increases from 0.5 to 2.0, the overall Max principal angle values decrease for all methods, indicating improved accuracy with higher signal strength.
* Impact of R: As R increases from 3 to 10, the performance gap between L F - PARAFAC and PARAFAC widens, with L F - PARAFAC showing significantly higher stability and lower error rates.
In the higher-order setting, described in Appendix B.1, we observe overall the same results. One important difference is that all tensor methods outperform the MFPCA in most cases, as the vectorization leads to the loss of the tensor structure. In the misspecified model setting, described in Appendix B.2, we observe that the LF-PARAFAC model still performs well compared to the PARAFAC and FTSVD approaches in all settings and to MFPCA in the high-sparsity setting only.
5 Application study
To help characterize cognitive decline among AD and CN patients and illustrate our method in the psychometrics setting, we propose to apply the introduced method to various neurocognitive markers measured over several years in the ADNI study. In this context, we consider six different cognitive markers observed on 518 healthy controls with normal cognition and 370 patients diagnosed with AD, resulting in
$N=888$
 total patients. Although some subjects were observed for more than 10 years, we propose first to restrict ourselves to the first two years of the study to ensure a uniform distribution of time points. Neurocognitive tests are often used by physicians to help assess the cognitive abilities of patients. In the context of AD and, more generally, dementia, they play an important role in the diagnosis and follow-up. Most neurocognitive tests consist of more or less simple questions asked to patients regarding their everyday lives or to complete a task involving specific cognitive abilities. The six cognitive markers considered here are the Alzheimer’s Disease Assessment Scale (ADAS), the Mini-Mental State Examination (MMSE), the Rey Auditory Verbal Learning Test (RAVLT), the Functional Activities Questionnaire (FAQ), the Montreal Cognitive Assessment (MOCA), and the logical memory delayed recall score (LDEL). Scores were normalized for improved readability. Markers were observed at different time points across individuals, resulting in a heavily irregular sampling scheme with
$262$
total patients. Although some subjects were observed for more than 10 years, we propose first to restrict ourselves to the first two years of the study to ensure a uniform distribution of time points. Neurocognitive tests are often used by physicians to help assess the cognitive abilities of patients. In the context of AD and, more generally, dementia, they play an important role in the diagnosis and follow-up. Most neurocognitive tests consist of more or less simple questions asked to patients regarding their everyday lives or to complete a task involving specific cognitive abilities. The six cognitive markers considered here are the Alzheimer’s Disease Assessment Scale (ADAS), the Mini-Mental State Examination (MMSE), the Rey Auditory Verbal Learning Test (RAVLT), the Functional Activities Questionnaire (FAQ), the Montreal Cognitive Assessment (MOCA), and the logical memory delayed recall score (LDEL). Scores were normalized for improved readability. Markers were observed at different time points across individuals, resulting in a heavily irregular sampling scheme with
$262$
 unique time points overall. Only subjects with at least two observations were considered, resulting in an average number of observations per subject of 3. Trajectories are represented in Figure 4.
Trajectories of six cognitive scores measured over 10 years. Colors correspond to baseline diagnosis: cognitively normal (CN) and Alzheimer’s disease (AD).

Figure 4 Long description
The multi-panel line graph consists of six panels arranged in two rows and three columns. The shared X-axis is Number of years since enrollment, ranging from 0.0 to 2.0. The shared Y-axis is Biomarker value, ranging from 0.00 to 1.00. Lines are colored by diagnosis: light gray for C N (cognitively normal) and brown for A D (Alzheimer’s disease).
* Top-left panel (A D A S 13): C N lines remain stable and concentrated near the bottom (0.00 to 0.25). A D lines show a general upward trend, starting between 0.25 and 0.75 and increasing over time.
* Top-middle panel (F A Q): C N lines are clustered at the very bottom near 0.00. A D lines are highly variable, spanning the entire range from 0.00 to 1.00, with many lines showing sharp increases or remaining high.
* Top-right panel (L D E L T O T A L): C N lines are concentrated in the upper half (0.50 to 0.90). A D lines are concentrated in the lower half (0.00 to 0.40), showing a slight downward trend.
* Bottom-left panel (M M S E): C N lines are densely packed at the top (0.80 to 1.00). A D lines start high but show significant downward slopes, with some dropping toward 0.00.
* Bottom-middle panel (M O C A): C N lines are concentrated in the upper range (0.75 to 1.00). A D lines are lower (0.25 to 0.75) and show a general decline over the two-year period.
* Bottom-right panel (R A V L T dot immediate): C N lines are concentrated in the upper range (0.50 to 1.00). A D lines are concentrated in the lower range (0.00 to 0.50), showing relatively flat or slightly declining trajectories.
The LF-PARAFAC decomposition was applied to the resulting random functional “tensor”, which lies in
$L^2(\mathcal {I})^6$
 , with
$\mathcal {I} = [0,2]$
, with
$\mathcal {I} = [0,2]$
 and can be seen as a tensor with dimensions
$\text {subject} \times \text {time} \times \text {marker}$
and can be seen as a tensor with dimensions
$\text {subject} \times \text {time} \times \text {marker}$
 . As seen in Figure 5, the rank
$R=4$
. As seen in Figure 5, the rank
$R=4$
 of the decomposition was chosen since the mean squared error between the predicted tensor and the observed tensor did not appear to provide a significantly better fit compared to
$R>4$
of the decomposition was chosen since the mean squared error between the predicted tensor and the observed tensor did not appear to provide a significantly better fit compared to
$R>4$
 . The smoothing procedure’s bandwidths were manually set to
$1$
. The smoothing procedure’s bandwidths were manually set to
$1$
 .
.
Mean squared error between predicted tensor and observed tensor in the ADNI application using various values for R.

The four functions and vectors retrieved from the decomposition are represented in Figure 6 along with population mode scores. Our approach took 2.4 seconds on average to provide estimates using an Apple M4 Pro chip. Additionally, note that with
$R=4$
 , we obtained approximately similar results across different initializations. Since it was not the case for larger values of R, it suggests that our selected rank was probably close to the maximum rank under which the identifiability criterion of Proposition 3 is met for the true underlying tensor.
(left) Functions and vectors retrieved by a rank
$R=4$
 LF-PARAFAC decomposition. (right) Population mode scores colored by diagnosis at baseline: cognitively normal (CN) and Alzheimer’s disease (AD).

Figure 6 Long description
The figure is divided into three main sections.
Section 1 (Left): Four vertically stacked line graphs labeled 1 through 4. The y-axis is Phi ranging from 0.0 to 0.4. The x-axis ranges from 0.0 to 2.0.
* Graph 1 shows a relatively flat line with a slight peak at 1.2.
* Graph 2 shows a distinct bell-shaped peak centered at 1.2.
* Graph 3 shows a sharp upward trend starting at 1.0.
* Graph 4 shows a gradual upward trend.
Section 2 (Center): Four vertically stacked bar charts labeled 1 through 4. The y-axis is ‘a’ ranging from -0.5 to 1.0. The x-axis lists clinical tests: A D A S, F A Q, L D E L, M M S E, M O C A, and R A V L T.
* Chart 1 has positive bars for L D E L, M M S E, M O C A, and R A V L T.
* Chart 2 has a dominant positive bar for L D E L.
* Chart 3 has a dominant positive bar for M M S E.
* Chart 4 has a dominant negative bar for F A Q and a positive bar for M M S E.
Section 3 (Right): A 4 by 4 matrix of plots. The diagonal from top-left to bottom-right contains density plots showing the distribution of C N (light gray) and A D (brown) groups. The off-diagonal plots are scatterplots showing the relationship between modes 1 through 4. The C N group generally clusters at higher values on the x-axes compared to the A D group, which shows more dispersion and lower values in several modes.
Figures show that the LF-PARAFAC decomposition successfully captured the inherent information of the random functional tensor. Notably, as expected, the method has retrieved smooth continuous vectors for the functional mode, describing predominant tendencies among cognitive scores.When observed with feature mode loadings, it appears that the first rank (first row), which has the highest associated sample-mode score variance, captures the average level of neurocognitive abilities: the higher the associated sample-mode score is, the better the cognitive abilities are, implying, as captured by the feature-mode loadings, high LDEL, MMSE, MOCA, and RAVLT, along with low ADAS and FAQ. This trend is also asserted by the distribution of the associated sample-mode scores: AD patients, who typically show poor cognitive abilities overall, have score values much lower than CN patients’ scores. The next rank (second row) seems to describe an increase of cognitive measures over the first year followed by a decrease during the second year. The associated marker-mode vector tells us that LDEL particularly follows this trend. ADAS and FAQ scores appear not to be involved for this rank. The third rank (third row), which is still associated with a high variance sample-mode score, describes an increasing trend, starting at the end of the first year. This trend seems to describe a decline (or improvement, depending on the sign) in cognitive abilities over the second year. Finally, the fourth rank appears to capture a similar trend as the third rank, although the increase is softer. The feature-mode vector suggests that it describes a trend shared by both FAQ and LDEL scores, and in the opposite way for MMSE.
Further investigation (Appendix B.3) shows that the first component is indeed associated with a bad prognosis: subjects in the first decile of the first sample-mode scores overall have low cognitive abilities. For the second component, we note that subjects with low sample-mode scores have worse cognitive abilities, particularly for LDEL (which explains the high value of the associated loading). As mentioned earlier, the third component appears to be associated with a slow deterioration of cognitive abilities.
Finally, we propose also to visualize the reconstruction capacity of the LF-PARAFAC decomposition using the parameters retrieved previously on a subset of 5 random subjects. For this analysis, we used the data retrieved over 10 years. Results are displayed in Figure 7. Overall, we observe that predicted curves are close to observations, except for FAQ, for which predicted trajectories seem to be inaccurate. An interesting property of using the LF-PARAFAC decomposition to reconstruct such tensor-structured data is that it can allow the prediction of trajectories of features for which no observations are made, as observed for trajectories of subjects 312, 565, and 1,056 for the MOCA score.
Observations as points and reconstructed trajectories as solid lines estimated using the latent functional PARAFAC decomposition.

Figure 7 Long description
A multi-panel grid with 30 individual plots organized into 5 columns and 6 rows.
Axes and Labels:
* The horizontal x-axis for all plots is Number of years since enrollment, ranging from 0.0 to 10.0.
* The vertical y-axis is Biomarker value.
* Columns are labeled by subject I D numbers at the top: 312, 565, 686, 1056, and 6418.
* Rows are labeled by biomarker initialisms on the right: A D A S 13, F A Q, L D E L T O T A L, M M S E, M O C A, and R A V L T.
Data Trends:
* Each plot contains black dots representing discrete observations and a solid black line representing the reconstructed trajectory.
* Subject 565 shows the most dramatic changes, with a sharp peak and subsequent decline in A D A S 13 and F A Q, and a corresponding dip followed by an increase in M M S E and M O C A.
* Subject 686 shows relatively stable, flat trajectories across most biomarkers with multiple data points clustered near the start of the timeline.
* Subject 6418 has the least amount of data, often showing only a single point at year zero with a nearly flat reconstructed line.
* The trajectories for A D A S 13 and F A Q generally trend upward or peak early, while M M S E and M O C A often show inverse patterns, reflecting different scales of cognitive measurement.
6 Discussion
We introduced a new approach to assist psychometric researchers by efficiently decomposing a functional tensor with an underlying random structure. Thanks to the (cross-)covariance formulation of the solving procedure, the method can be applied to a broad range of longitudinal settings, notably to sparse and irregular sampling schemes. Simulation results show that our approach retrieves feature functions closer to the true smooth functions, and the approximation made from those functions is indeed better.
The developments introduced in this article pave the way for a broad range of extensions, the more prominent of which is tensor regression, i.e., regression using tensor-structured covariates. A similar methodology to Zhou et al. (Reference Zhou, Li and Zhu2013) is currently being investigated to perform linear functional tensor regression. Another interesting extension of our work would be to consider that not one but multiple modes have a smooth structure. This situation is often encountered in spatial statistics. As evoked earlier, various tensor decomposition frameworks have been introduced in such settings. However, those methods were developed from a signal-processing setting rather than a statistical setting. Therefore, no probabilistic modeling is made in the decomposition, and the random structure is not considered.
The most notable extension of our approach would be allowing to control for external factors, especially, confounders. This problem is particularly relevant in a longitudinal framework, as the time dimension is rarely easily comparable between subjects. In our setting for instance, subjects may have entered the study at different stages of the disease and, more importantly, at different ages. This information, which is strongly associated with the disease (aged patients are more likely to have AD), could act as a major confounder, explaining most of the variation observed in our sample mode vectors, and therefore significantly changing the interpretation. In this context, integrating this external information, similar to Guan (Reference Guan2023) and Lock and Li (Reference Lock and Li2018), appears as a straightforward extension of our approach that would definitely improve our model’s capacity to represent the data and avoid misinterpretation.
Additionally, our work emphasizes the need for multivariate high-dimensional FACE methods. Indeed, one major drawback of our approach is its computational complexity. Currently, the method requires estimating the (cross-)covariance surface between each pair of functional entries of the tensor, a number that grows exponentially with the order of the tensor. Assuming local linear smoothing is used to estimate (cross-)covariance surfaces, which has a complexity of
$O(IJ^2)$
 denoting I the number of samples and J the number of observations for each sample (to simplify, in a sparse and regular sampling setting), the overall complexity of multidimensional tensor covariance estimation is
$O(IJ^2P^2)$
denoting I the number of samples and J the number of observations for each sample (to simplify, in a sparse and regular sampling setting), the overall complexity of multidimensional tensor covariance estimation is
$O(IJ^2P^2)$
 , where we recall that
$P = \prod _d p_d$
, where we recall that
$P = \prod _d p_d$
 . As already mentioned, other covariance estimation strategies such as FACE Xiao et al., Reference Xiao, Zipunnikov, Ruppert and Crainiceanu2014, which has a complexity
$O(I^2J + I^3)$
. As already mentioned, other covariance estimation strategies such as FACE Xiao et al., Reference Xiao, Zipunnikov, Ruppert and Crainiceanu2014, which has a complexity
$O(I^2J + I^3)$
 (assuming the number of knots c in the spline modeling is
$O(I)$
(assuming the number of knots c in the spline modeling is
$O(I)$
 ), could be considered to speed up the process. Notably, this would allow us to more closely match the complexity of the method introduced in Guan (Reference Guan2023), which appears to be linear in J. Nevertheless, the multidimensional structure of the data still prevents considering highly multidimensional data in practice due to the
$P^2$
), could be considered to speed up the process. Notably, this would allow us to more closely match the complexity of the method introduced in Guan (Reference Guan2023), which appears to be linear in J. Nevertheless, the multidimensional structure of the data still prevents considering highly multidimensional data in practice due to the
$P^2$
 term in the complexity, and, similar to before, in some settings, the approach of Guan (Reference Guan2023) could be a better alternative due to its linear complexity in P. To solve this issue, we currently investigate a new estimation approach which considers a separable Kronecker covariance structure Hoff, Reference Hoff2011 on the covariance function
$\boldsymbol {\Sigma }$
term in the complexity, and, similar to before, in some settings, the approach of Guan (Reference Guan2023) could be a better alternative due to its linear complexity in P. To solve this issue, we currently investigate a new estimation approach which considers a separable Kronecker covariance structure Hoff, Reference Hoff2011 on the covariance function
$\boldsymbol {\Sigma }$
 . Under simple assumptions, assuming such a structure can significantly reduce the number of computations.
Supplementary material
The supplementary material for this article can be found at https://doi.org/10.1017/psy.2025.10075.
Funding statement
Data collection and sharing for the Alzheimer’s Disease Neuroimaging Initiative (ADNI) is funded by the National Institute on Aging (National Institutes of Health Grant U19 AG024904). The grantee organization is the Northern California Institute for Research and Education. In the past, ADNI has also received funding from the National Institute of Biomedical Imaging and Bioengineering, the Canadian Institutes of Health Research, and private sector contributions through the Foundation for the National Institutes of Health (FNIH), including generous contributions from the following: AbbVie, Alzheimer’s Association; Alzheimer’s Drug Discovery Foundation; Araclon Biotech; BioClinica, Inc.; Biogen; Bristol-Myers Squibb Company; CereSpir, Inc.; Cogstate; Eisai Inc.; Elan Pharmaceuticals, Inc.; Eli Lilly and Company; EuroImmun; F. Hoffmann-La Roche Ltd. and its affiliated company Genentech, Inc.; Fujirebio; GE Healthcare; IXICO Ltd.; Janssen Alzheimer Immunotherapy Research & Development, LLC.; Johnson & Johnson Pharmaceutical Research & Development LLC.; Lumosity; Lundbeck; Merck & Co., Inc.; Meso Scale Diagnostics, LLC.; NeuroRx Research; Neurotrack Technologies; Novartis Pharmaceuticals Corporation; Pfizer Inc.; Piramal Imaging; Servier; Takeda Pharmaceutical Company; and Transition Therapeutics.
Competing interests
The authors have no competing interests to declare that are relevant to the content of this article.
A Proofs
Proposition 1.
To obtain
$\Psi ^{\ast}$
 , we look for solutions of

for fixed
$\boldsymbol {\phi }, \mathbf {A}_1, \dots , \mathbf {A}_D$
 and a given
$\mathcal {X}$
and a given
$\mathcal {X}$
 . Developing the criterion, we get

Deriving this expression with respect to U and setting the derivative to
$0$
 leads to

Which, under mild assumptions, leads to

Corollary 1.
From (9), we have

Lemma A1. The objective function of optimization problem (10) only depends on covariance
$\boldsymbol {\Lambda }^{\ast}$
 and other parameters via an operator C:

Proof. We have
![E[||X - [[u; phi; A sub 1; ...; A sub D]]||^2] equals integral E[||x(t) - (A sub D circle ... circle A sub 1 circle u*)phi(t)^T||^2] which equals integral E[||x(t) - (A sub (D) circle u*)phi(t)^T||^2] expanded into three integral terms.](https://static.cambridge.org/binary/version/id/urn:cambridge.org:id:binary:20260630090126869-0627:S0033312325100756:S0033312325100756_eqnu13.png?pub-status=live)
In this expression, the first term does not depend on the parameters and can thus be removed for optimization. Next, using the property
$(\mathbf {A} \otimes \mathbf {B}) (\mathbf {C} \odot \mathbf {D}) = (\mathbf {A}\mathbf {C}) \odot (\mathbf {B}\mathbf {D})$
 , we can write

and

which leads to

Alternatively, for any
$d\in [D]$
 , we can rewrite (A1) as

In the following, we denote
$C_f: \boldsymbol {\phi } \mapsto C(\boldsymbol {\Lambda }^{\ast}, \boldsymbol {\phi }, \mathbf {A}_1, \dots , \mathbf {A}_D)$
 for any fixed
$\boldsymbol {\Lambda }^{\ast}, \mathbf {A}_1, \dots , \mathbf {A}_D$
for any fixed
$\boldsymbol {\Lambda }^{\ast}, \mathbf {A}_1, \dots , \mathbf {A}_D$
 , and similarly
$C_d: \mathbf {A}_d \mapsto C(\boldsymbol {\Lambda }^{\ast}, \boldsymbol {\phi }, \mathbf {A}_1, \dots , \mathbf {A}_D)$
, and similarly
$C_d: \mathbf {A}_d \mapsto C(\boldsymbol {\Lambda }^{\ast}, \boldsymbol {\phi }, \mathbf {A}_1, \dots , \mathbf {A}_D)$
 for fixed
$\boldsymbol {\Lambda }^{\ast}, \boldsymbol {\phi }, \mathbf {A}_1, \dots , \mathbf {A}_{d-1}, \mathbf {A}_{d+1}, \dots , \mathbf {A}_{D}$
for fixed
$\boldsymbol {\Lambda }^{\ast}, \boldsymbol {\phi }, \mathbf {A}_1, \dots , \mathbf {A}_{d-1}, \mathbf {A}_{d+1}, \dots , \mathbf {A}_{D}$
 .
.
Lemma A2. The operator
$C_f$
 is Gâteau-differentiable and at any
$\boldsymbol {\phi } \in \mathcal {H}^{1\times R}$
is Gâteau-differentiable and at any
$\boldsymbol {\phi } \in \mathcal {H}^{1\times R}$
 and
$s \in \mathcal {I}$
and
$s \in \mathcal {I}$
 , the derivative is given by

Proof. Let
$\boldsymbol {\phi }\in \mathcal {H}^{1\times R}$
 . Let’s show that there is a continuous (bounded) linear operator
$C_f'(\boldsymbol {\phi })$
. Let’s show that there is a continuous (bounded) linear operator
$C_f'(\boldsymbol {\phi })$
 such that

We have

Therefore,

The term on the right-hand side can be rewritten
$\langle C_f'(\boldsymbol {\phi }) , \mathbf {H} \rangle ,$
 where
$C_f'(\boldsymbol {\phi })$
where
$C_f'(\boldsymbol {\phi })$
 is defined for any
$s \in \mathcal {I}$
is defined for any
$s \in \mathcal {I}$
 as
as

which is bounded under mild conditions.
Proposition 2.
We have
-
• Using Lemma A2, we have for any $\boldsymbol {\phi } \mathcal {H}^{1 \times R}$
and
$s \in \mathcal {I}$
, $$ \begin{align*} C_f'(\boldsymbol{\phi})(s) = 2 \boldsymbol{\phi}(s) (\mathbf{A}_{(D)}^\top \mathbf{A}_{(D)} \ast \boldsymbol{\Lambda}^{\ast}) -2 \int \boldsymbol{\Sigma}_{[f]}(s, t) (\mathbf{A}_{(D)} \odot \mathbf{K}(t)) \end{align*} $$
Setting the derivative to zero leads to
$$ \begin{align*} \boldsymbol{\phi}(s) (\mathbf{A}_{(D)}^\top \mathbf{A}_{(D)} \ast \boldsymbol{\Lambda}^{\ast}) - \int \boldsymbol{\Sigma}_{[f]}(s, t) (\mathbf{A}_{(D)} \odot \mathbf{K}(t)) = 0, \end{align*} $$
which implies under nonsingular assumption,
$$ \begin{align*} \boldsymbol{\phi}(s) = \int \boldsymbol{\Sigma}_{[f]}(s, t) (\mathbf{A}_{(D)} \odot \mathbf{K}(t)) (\mathbf{A}_{(D)}^\top \mathbf{A}_{(D)} \ast \boldsymbol{\Lambda}^{\ast})^{-1.} \end{align*} $$
-
• Similarly, we have
$$ \begin{align*} C_d'(\mathbf{A}_d) = 2 \int \mathbf{A}_{d} (\mathbf{A}_{(-d), f}(t)^\top \mathbf{A}_{(-d), f}(t) \ast \boldsymbol{\Lambda}^{\ast}) -2 \int \int \boldsymbol{\Sigma}_{[d]}(s, t) (\mathbf{A}_{(-d), f}(t) \odot \mathbf{K}(s)). \end{align*} $$
Setting the derivative to zero leads to
$$ \begin{align*} \mathbf{A}_d \int \mathbf{A}_{(-d), f}(t)^\top \mathbf{A}_{(-d), f}(t) \ast \boldsymbol{\Lambda}^{\ast} - \int \int \boldsymbol{\Sigma}_{[d]}(s, t) (\mathbf{A}_{(-d), f}(t) \odot \mathbf{K}(s)) = 0, \end{align*} $$
which implies under nonsingular assumption,
$$ \begin{align*} \mathbf{A}_d = \int \int \boldsymbol{\Sigma}_{[d]}(s, t) (\mathbf{A}_{(-d), f}(t) \odot \mathbf{K}(s)) \left (\int \mathbf{A}_{(-d), f}(t)^\top \mathbf{A}_{(-d), f}(t) \ast \boldsymbol{\Lambda}^{\ast} \right)^{-1}. \end{align*} $$


Lemma A3. Consider the following rank-R latent PARAFAC decomposition model:


with
$\mathbf {V}_d \in \mathbb {R}^{p_d \times R}$
 for any
$d =1,\dots , D$
for any
$d =1,\dots , D$
 ,
$\boldsymbol {\Sigma } \in \mathbb {R}^{R \times R}$
,
$\boldsymbol {\Sigma } \in \mathbb {R}^{R \times R}$
 a positive-definite matrix, and elements of
$\mathcal {E}$
a positive-definite matrix, and elements of
$\mathcal {E}$
 i.i.d. normally distributed with variance
$\sigma ^2$
i.i.d. normally distributed with variance
$\sigma ^2$
 . The model is identifiable, up to scaling and order, under the following constraints:
-
(A1) When deleting any row of $\mathbf {V}_M = \mathbf {V}_1 \odot \dots \odot \mathbf {V}_D$
, the resulting matrix always has two distinct submatrices of rank R. -
(A2) The following inequality is verified:
(A5) $$ \begin{align} \sum_{d = 1}^D \operatorname{\mathrm{kr}}(\mathbf{V}_d) \geq R + (D - 1). \end{align} $$


Proof. The proof is largely based on Giordani et al. (Reference Giordani, Rocci and Bove2020, Section 4.1). Identifiability is defined as the identifiability of the covariance matrix
$\boldsymbol {\Sigma }_{\mathbf {x}}$
 of
$\mathbf {x}$
of
$\mathbf {x}$
 . The residual variance
$\sigma $
. The residual variance
$\sigma $
 is identifiable since, using the fact that
$\operatorname {\mathrm {rank}}(\boldsymbol {\Sigma }) = R$
is identifiable since, using the fact that
$\operatorname {\mathrm {rank}}(\boldsymbol {\Sigma }) = R$
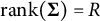 , it is defined by the rank R of the decomposition, such as

Now, since
$\boldsymbol {\Sigma }_{\mathbf {x}} - \sigma ^2 \mathbf {I}= \mathbf {V}_M \boldsymbol {\Sigma } \mathbf {V}_M^\top $
 assume we have
$\mathbf {V}_1', \dots \mathbf {V}_D'$
assume we have
$\mathbf {V}_1', \dots \mathbf {V}_D'$
 and
$\boldsymbol {\Sigma }^{\prime }$
and
$\boldsymbol {\Sigma }^{\prime }$
 such that

which is equivalent to

Under condition (A2), since
$\operatorname {\mathrm {rank}}(\boldsymbol {\Sigma }) = R$
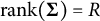 , if any row of
$\mathbf {V}_M \boldsymbol {\Sigma }^{1/2}$
, if any row of
$\mathbf {V}_M \boldsymbol {\Sigma }^{1/2}$
 is deleted, there remain two distinct submatrices of rank R. By considering Theorem 5.1 in Anderson and Rubin (Reference Anderson and Rubin1956), we known there exists an orthogonal matrix
$\mathbf {M}$
is deleted, there remain two distinct submatrices of rank R. By considering Theorem 5.1 in Anderson and Rubin (Reference Anderson and Rubin1956), we known there exists an orthogonal matrix
$\mathbf {M}$
 such that
$\mathbf {V}_M \boldsymbol {\Sigma }^{1/2} = \mathbf {V}_M' \boldsymbol {\Sigma }^{\prime 1/2} \mathbf {M}$
such that
$\mathbf {V}_M \boldsymbol {\Sigma }^{1/2} = \mathbf {V}_M' \boldsymbol {\Sigma }^{\prime 1/2} \mathbf {M}$
 . Finally, using condition (A2) and the fact that
$\operatorname {\mathrm {rank}}(\boldsymbol {\Sigma }) = R$
. Finally, using condition (A2) and the fact that
$\operatorname {\mathrm {rank}}(\boldsymbol {\Sigma }) = R$
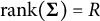 , we have

Using the PARAFAC identifiability result provided in Sidiropoulos and Bro (Reference Sidiropoulos and Bro2000), up to permutation and scaling defined by a matrix
$\mathbf {P}$
 , we can assert that
$\mathbf {V}_d = \mathbf {V}_M' \mathbf {P}$
, we can assert that
$\mathbf {V}_d = \mathbf {V}_M' \mathbf {P}$
 for any
$d=1,\dots , D$
for any
$d=1,\dots , D$
 and
$\boldsymbol {\Sigma }^{1/2} = \mathbf {M} \boldsymbol {\Sigma }^{\prime 1/2} \mathbf {P}$
and
$\boldsymbol {\Sigma }^{1/2} = \mathbf {M} \boldsymbol {\Sigma }^{\prime 1/2} \mathbf {P}$
 , which implies
$\boldsymbol {\Sigma } = \mathbf {P}^\top \boldsymbol {\Sigma }^{\prime } \mathbf {P}$
, which implies
$\boldsymbol {\Sigma } = \mathbf {P}^\top \boldsymbol {\Sigma }^{\prime } \mathbf {P}$
 . Identifiability is therefore verified.
Proposition 3.
We follow the same steps as in Han et al. (Reference Han, Shi and Zhang2023):
-
• $\mathscr {H}$
is finite dimensional. Denoting
$p_{\phi }$
the dimension of
$\mathscr {H}$
. We can decompose
$\phi _{r}$
and
$\tilde {\phi }_{r}$
using an orthonormal basis
$\{ \psi _k \}_{1 \leq k \leq p_{\phi }}$
of
$\mathscr {H}$
, $$ \begin{align*} \phi_{r} = \sum^{p_{\phi}}_{k=1} c_{kr} \psi_{k}\ \; \; \; \tilde{\phi}_{r} = \sum^{p_{\phi}}_{k=1} \tilde{c}_{kr} \psi_{k}.\ \end{align*} $$
Considering the following latent factor PARAFAC decomposition:
$$ \begin{align*} \mathcal{B} = \sum^{R}_{r=1} u_{r} (\mathbf{c}_{r} \circ \mathbf{a}_{1 r} \circ \dots \circ \mathbf{a}_{D r}) \; \; \; \tilde{\mathcal{B}} = \sum^{R}_{r=1} \tilde{u_{r}} (\tilde{\mathbf{c}}_{r} \circ \tilde{\mathbf{a}}_{1 r} \circ \dots \circ \tilde{\mathbf{a}}_{D r}). \end{align*} $$
We can rewrite (6)
$$ \begin{align*} \sum_{r=1}^R u_r \phi_{r}(t) (\mathbf{a}_{1r} \circ \dots \circ \mathbf{a}_{Dr}) &= \sum_{r=1}^R u_r \sum^{p_{\phi}}_{k=1} c_{kr} \psi_{k}(t) (\mathbf{a}_{1r} \circ \dots \circ \mathbf{a}_{Dr})\\ &= \sum^{p_{\phi}}_{k=1} \sum_{r=1}^R u_r (c_{kr} (\mathbf{a}_{1r} \circ \dots \circ \mathbf{a}_{Dr})) \psi_{k}(t) \\ &= \sum^{p_{\phi}}_{k} \mathcal{B}_k \psi_{k}(t), \end{align*} $$
where $\mathcal {B}_k$
denotes the sub-tensor of
$\mathcal {B}$
defined by fixing the first mode (associated with basis coefficients
$\mathbf {C}$
) to the kth dimension. Similarly, we have $$ \begin{align*} \sum_{r=1}^R \tilde{u}_r \tilde{\phi}_{r}(t) (\tilde{\mathbf{a}}_{1r} \circ \dots \circ \tilde{\mathbf{a}}_{Dr}) = \sum^{p_{\phi}}_{k=1} \tilde{\mathcal{B}}_k \psi_{k}(t). \end{align*} $$
From the equality,
$$ \begin{align*} \sum^{p_{\phi}}_{k=1} \mathcal{B}_k \psi_{k}(t)= \sum^{p_{\phi}}_{k=1} \tilde{\mathcal{B}}_k \psi_{k}(t) \end{align*} $$
and the orthonormality of $\{ \psi _k \}_{1 \leq k \leq p_{\phi }}$
, we have that
$\mathcal {B} = \tilde {\mathcal {B}}$
. From the identifiability result given in Lemma A3, assuming scaling and order indeterminacies fixed, we have
$\boldsymbol {\Theta } = \tilde {\boldsymbol {\Theta }}$
under the assumption that deleting any row of
$\mathbf {C} \odot \mathbf {A}_1 \odot \dots \odot \mathbf {A}_D$
results in a matrix having two distinct full-rank submatrices and considering: $$ \begin{align*} \operatorname{\mathrm{kr}}(\mathbf{C}) + \sum_{d=1}^D \operatorname{\mathrm{kr}}(\mathbf{A}_d) \geq R + (D - 1). \end{align*} $$
-
• $\mathscr {H}$
is infinite-dimensional. Considering a regular grid of
$\mathcal {I}$
with size K, we denote
$\mathcal {X}^{(K)}$
and
$\tilde {\mathcal {X}}{}^{(K)}$
, the values of
$\mathcal {X}$
and
$\tilde {\mathcal {X,}}$
respectively, at the time points of the grid. Since
$\mathcal {X} = \tilde {\mathcal {X}}$
, we have
$\mathcal {X}^{(K)} = \tilde {\mathcal {X}}{}^{(K)}$
. Considering
$\boldsymbol {\phi }_r^{(K)} \in \mathbb {R}^K$
the vector of values of
$\phi _r$
at the time points of the grid, we have from the previous equality, $$ \begin{align*} \sum_{r=1}^R u_r (\boldsymbol{\phi}_r^{(K)} \circ \mathbf{a}_{1r} \circ \dots \circ \mathbf{a}_{Dr}) = \sum_{r=1}^R \tilde{u}_r (\tilde{\boldsymbol{\phi}}_r{}^{(K)} \circ \tilde{\mathbf{a}}_{1r} \circ \dots \circ \tilde{\mathbf{a}}_{Dr}), \end{align*} $$
which also corresponds to a SupCP model. In this context, for K large enough, we are guaranteed that $\operatorname {\mathrm {kr}}(\boldsymbol {\phi }^{(K)})=\operatorname {\mathrm {kr}}(\boldsymbol {\phi })$
. Using identifiability result from Lemma A3, we can assert that
$\boldsymbol {\phi }^{(K)} = \tilde {\boldsymbol {\phi }}{}^{(K)}$
as long as deleting any row of
$(\boldsymbol {\phi }^{(K)} \odot \mathbf {A}_1 \odot \dots \odot \mathbf {A}_D)$
results in a matrix which has two full rank distinct submatrices and $$ \begin{align*} \operatorname{\mathrm{kr}}(\boldsymbol{\phi}^{(K)}) + \sum_{d=1}^D \operatorname{\mathrm{kr}}(\mathbf{A}_d) \geq R + (D - 1). \end{align*} $$
Finally, we can assert that there exists $K_T$
such that for all
$K \geq K_T$
, the first condition is necessarily verified and
$\operatorname {\mathrm {kr}}(\boldsymbol {\phi }^{(K)}) = R = \operatorname {\mathrm {kr}}(\boldsymbol {\phi }).$














Proposition 4.
Denoting
$\boldsymbol {e}_{n}$
 the vector of measurement errors
$\{ \mathcal {E} _{nk}\}_{1\leq k \leq K_n}$
the vector of measurement errors
$\{ \mathcal {E} _{nk}\}_{1\leq k \leq K_n}$
 of sample n. We have

From this, we propose to rewrite jointly the observations and the scores as:

Using this expression, and the jointly Gaussian assumptions on
$\mathbf {u}_n$
 and
$\boldsymbol {e}_n$
and
$\boldsymbol {e}_n$
 we clearly see that
$\mathbf {u}_n$
we clearly see that
$\mathbf {u}_n$
 and
$\mathbf {y}_n$
and
$\mathbf {y}_n$
 are also jointly Gaussian with joint law:

To obtain the best predictions for the scores, we now consider the conditional distribution of
$\mathbf {u}_n$
 and suggest using the conditional expectation as the best predictor. Using the standard formulation of the Gaussian conditional distribution, we obtain

B Additional experiments
B.1 Simulations: Higher order
We propose to compare decomposition methods on order
$D=3$
 tensors using the simulation setting of Section 4. Dimensions of tensors considered are
$(30, 5, 5)$
tensors using the simulation setting of Section 4. Dimensions of tensors considered are
$(30, 5, 5)$
 . Results are displayed in Figure B1. We still observe a notable advantage of our approach in high and medium noise settings. On the other hand, MFPCA seems to perform worse than before. We suppose that this is caused by the lack of assumptions on the underlying structure of tensors.
Root mean squared error (RMSE) of order-3 reconstructed functional tensors. Comparing latent functional PARAFAC (LF-PARAFAC), standard PARAFAC (PARAFAC), functional tensor singular value decomposition (FTSVD), and multivariate functional principal component analysis (MFPCA).

Figure B1 Long description
A three-by-three grid of box plots. The x-axis represents the Proportion of missing values (0, 0.2, 0.5, 0.8). The y-axis represents R M S E on a logarithmic scale.
Columns are grouped by S N R (0.5, 1.0, 2.0) from left to right. Rows are grouped by R values (3, 5, 10) from top to bottom.
Legend at the top identifies four methods:
* L F - P A R A F A C (light blue)
* P A R A F A C (gold)
* F T S V D (light gray)
* M F P C A (dark green)
General trends across all panels:
* R M S E increases as the proportion of missing values increases.
* R M S E generally decreases as S N R increases from 0.5 to 2.0.
* M F P C A consistently shows the highest R M S E across most conditions.
* P A R A F A C and L F - P A R A F A C typically show the lowest R M S E, with L F - P A R A F A C often outperforming others at higher missing value proportions.
* F T S V D shows high variability (longer whiskers) particularly in the S N R 2.0 column.
B.2 Simulations: Misspecified model
We propose here to investigate how decomposition methods perform on order
$D=3$
 tensors assuming no underlying low-rank structure. In this context, data is generated using a Fourier basis of order
$3$
tensors assuming no underlying low-rank structure. In this context, data is generated using a Fourier basis of order
$3$
 by sampling Fourier coefficients from a multivariate normal distribution for each tensor entry. The dimensions of tensors considered are
$(30, 8, 8)$
by sampling Fourier coefficients from a multivariate normal distribution for each tensor entry. The dimensions of tensors considered are
$(30, 8, 8)$
 . For tensor decomposition approaches, a rank of
$R=3$
. For tensor decomposition approaches, a rank of
$R=3$
 decomposition is considered. Experiments are repeated 10 times. Results are displayed in Figure B2. As expected, we observe that MFPCA performs better than tensor decomposition approaches in dense and low-sparsity settings since the method does not assume any underlying low-rank structure. Interestingly, our method still performs better than MFPCA for medium-sparsity and high-sparsity settings (Figure B3).
Reconstruction error on order
$D=3$
 tensors using
$p_1=p_2=8$
tensors using
$p_1=p_2=8$
 , with
$N=100$
, with
$N=100$
 samples. Comparing LF-PARAFAC, PARAFAC (standard), FTSVD, and MFPCA for different proportions of missing values (x-axis) and signal-to-noise ratios (SNR) (column-wise facets). Plot obtained from
$10$
samples. Comparing LF-PARAFAC, PARAFAC (standard), FTSVD, and MFPCA for different proportions of missing values (x-axis) and signal-to-noise ratios (SNR) (column-wise facets). Plot obtained from
$10$
 simulation runs.

Figure B2 Long description
A multi-panel line graph consisting of three horizontal facets. The y-axis is labeled R M S E with a log-like scale from 0.10 to 0.20. The x-axis is labeled Proportion of missing values with discrete categories at 0, 0.2, 0.5, and 0.8. A legend at the top identifies four methods: L F - P A R A F A C (light blue), P A R A F A C (gold), F T S V D (gray), and M F P C A (dark green).
* Panel 1 (S N R = 0.5): At 0 missing values, all methods cluster near 0.12, with M F P C A slightly lower. As missing values increase to 0.8, all methods show a non-linear increase in R M S E. P A R A F A C reaches the highest error above 0.20, while M F P C A and L F - P A R A F A C remain lower, around 0.15 to 0.18.
* Panel 2 (S N R = 1.0): Similar upward trend. M F P C A maintains the lowest error across 0 to 0.5 missing values. At 0.8 missing values, P A R A F A C peaks highest, followed by M F P C A and L F - P A R A F A C.
* Panel 3 (S N R = 2.0): The performance gap widens. M F P C A shows the most stability at low missingness (0 to 0.2). At the 0.8 threshold, P A R A F A C again shows the highest reconstruction error, while L F - P A R A F A C and M F P C A show comparable performance around 0.16 to 0.18.
Across all panels, F T S V D is only plotted for the 0 missing value category, where it performs similarly to the standard P A R A F A C.
Cognitive score trajectories in first (left column) and last deciles (right column) of rank-1 sample-mode scores (top left), of rank-2 sample-mode scores (top right), of rank-3 sample-mode scores (bottom left), and of rank-4 sample-mode scores (bottom right).

Figure B3 Long description
The image consists of four large quadrants, each containing a grid of 12 line graphs (2 columns by 6 rows). Each quadrant represents a different rank (Rank-1 top-left, Rank-2 top-right, Rank-3 bottom-left, Rank-4 bottom-right).
Common axes and labels:
- X-axis: Time, ranging from 0.0 to 2.0.
- Y-axis: Value, ranging from 0.0 to 1.0 (with some variation in D E L T O T rows).
- Legend: C N (grey lines) and A D (brown lines). A thick black line represents the mean trajectory.
- Columns: Column 1 represents the first decile and Column 10 represents the last decile.
- Rows (Top to Bottom): A D A S 13, F A Q, D E L T O T, M M S E, M O C A, and R A V L T dot Imme.
Data Trends:
- Top-Left (Rank-1): Column 1 shows steady increases in A D A S 13 and F A Q for A D patients, while M M S E and M O C A show steady declines. Column 10 shows flat, stable trajectories near the baseline for all metrics.
- Top-Right (Rank-2): Shows more volatility. Column 1 and 10 both exhibit non-linear, wavy mean trajectories, particularly in the D E L T O T and M O C A rows, with wider grey confidence intervals.
- Bottom-Left (Rank-3): Column 1 shows gradual linear trends. Column 10 shows more pronounced divergence, with A D A S 13 and F A Q increasing sharply after time 1.0, while M M S E and M O C A decline.
- Bottom-Right (Rank-4): Similar to Rank-3 but with more compressed data in Column 1. Column 10 shows sharp inflection points around time 0.5, where A D trajectories for A D A S 13 and F A Q peak and then decline, while M M S E and M O C A show a late-stage upward trend.
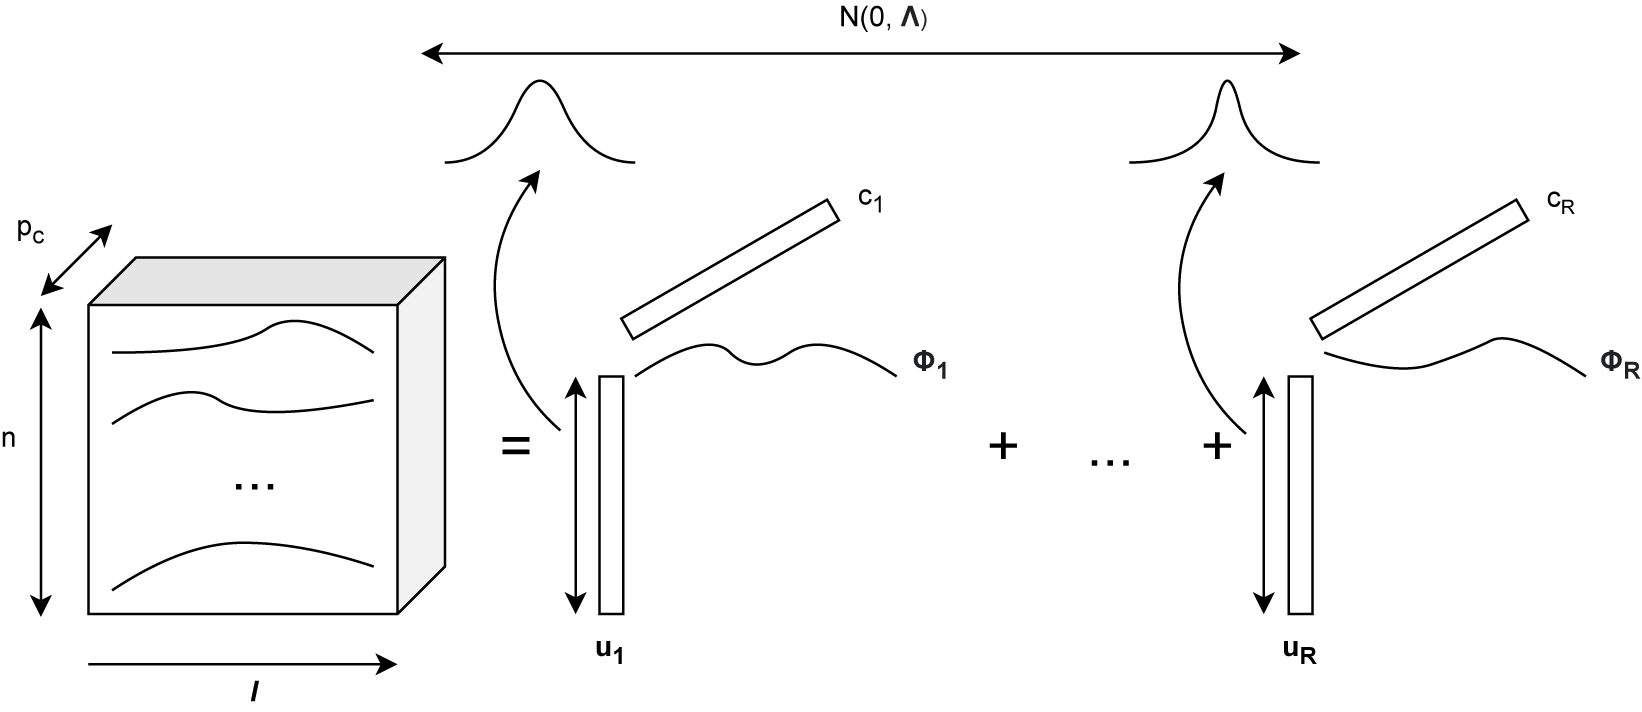
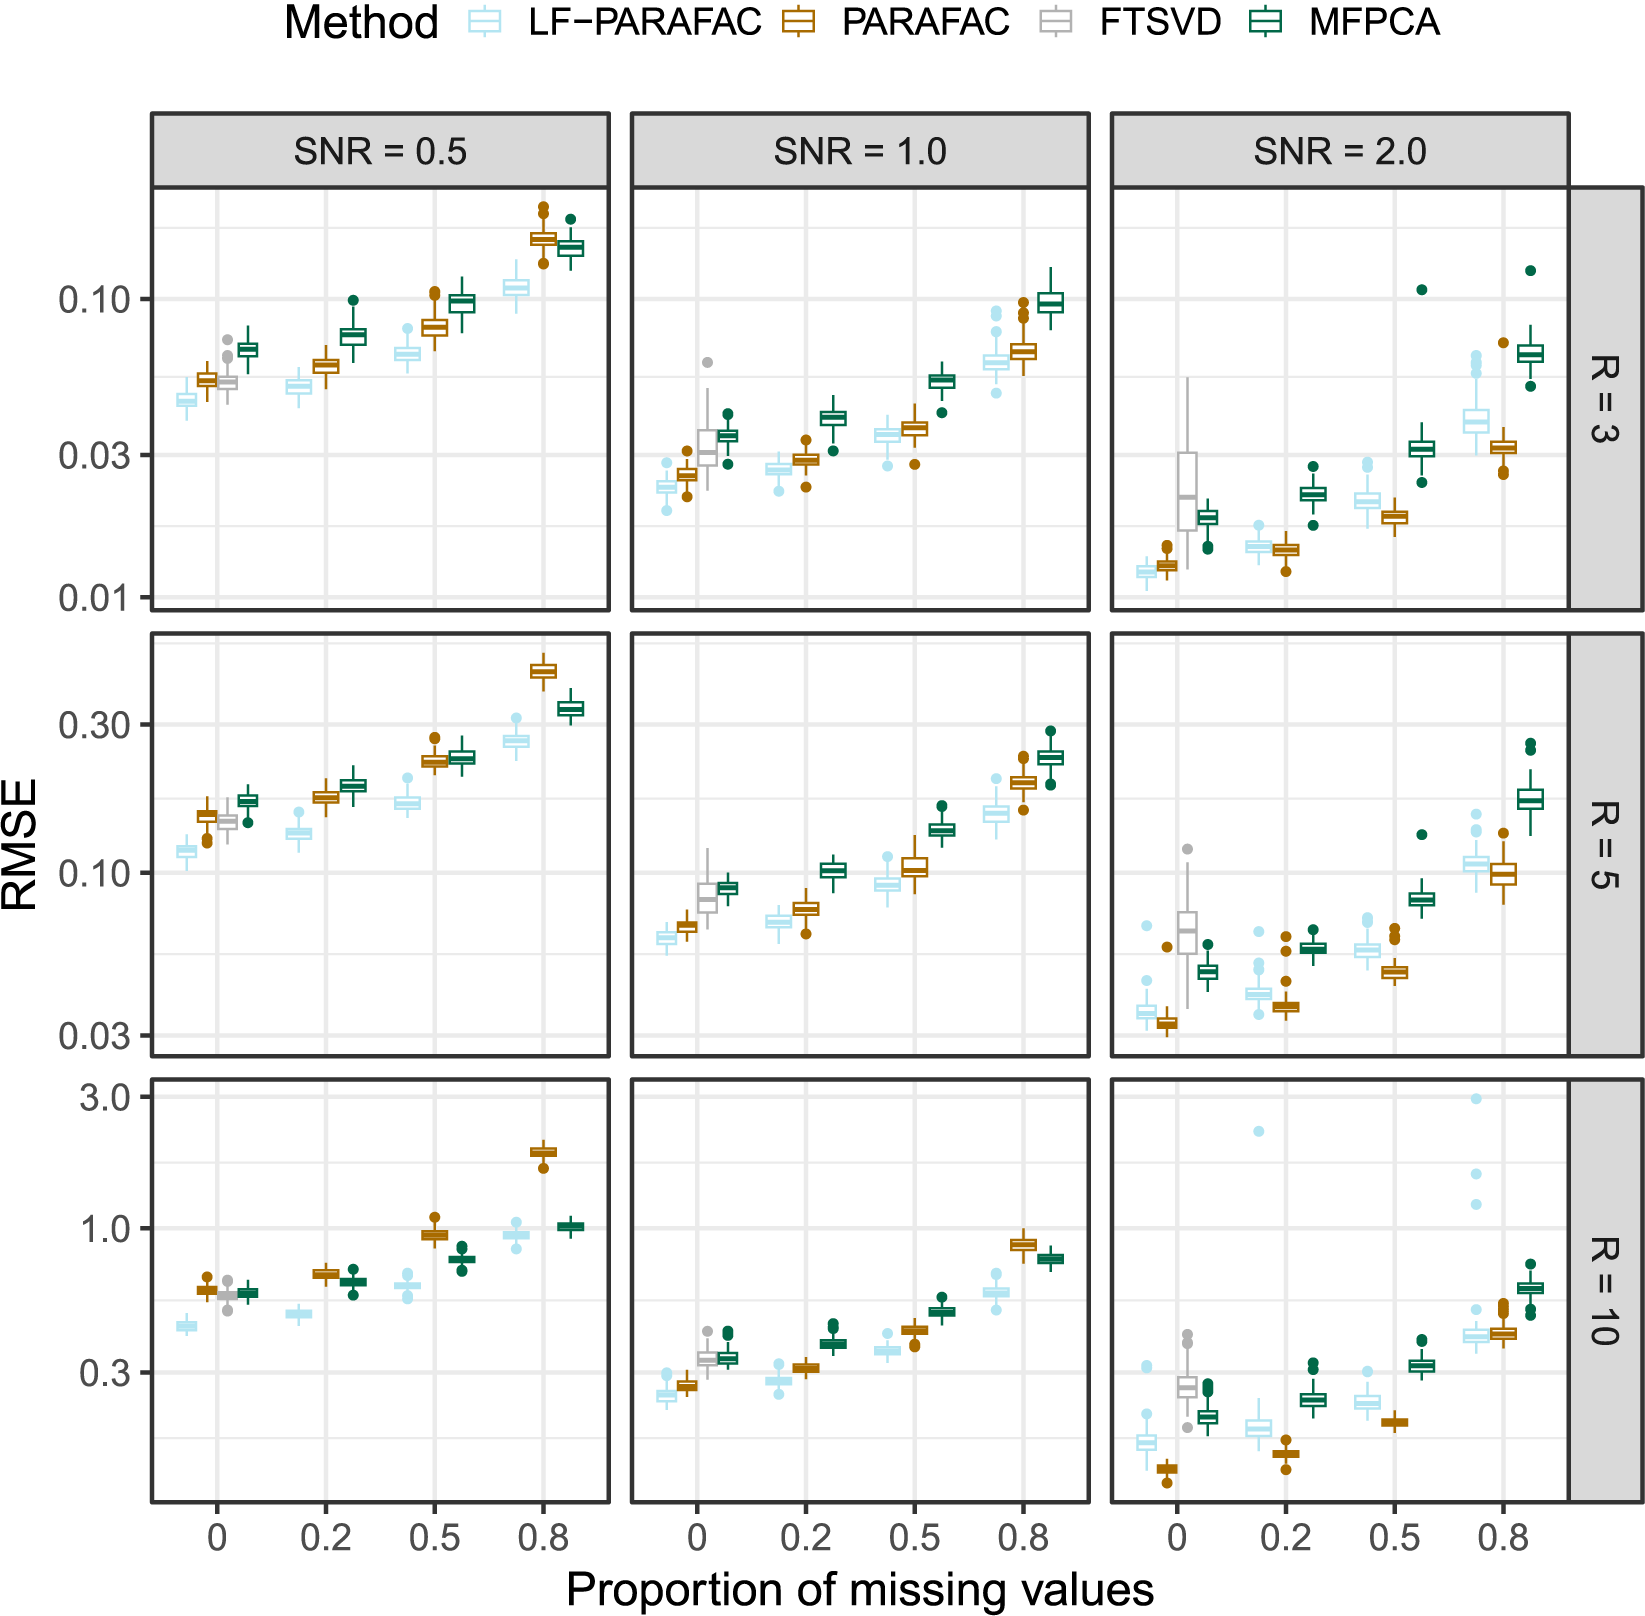
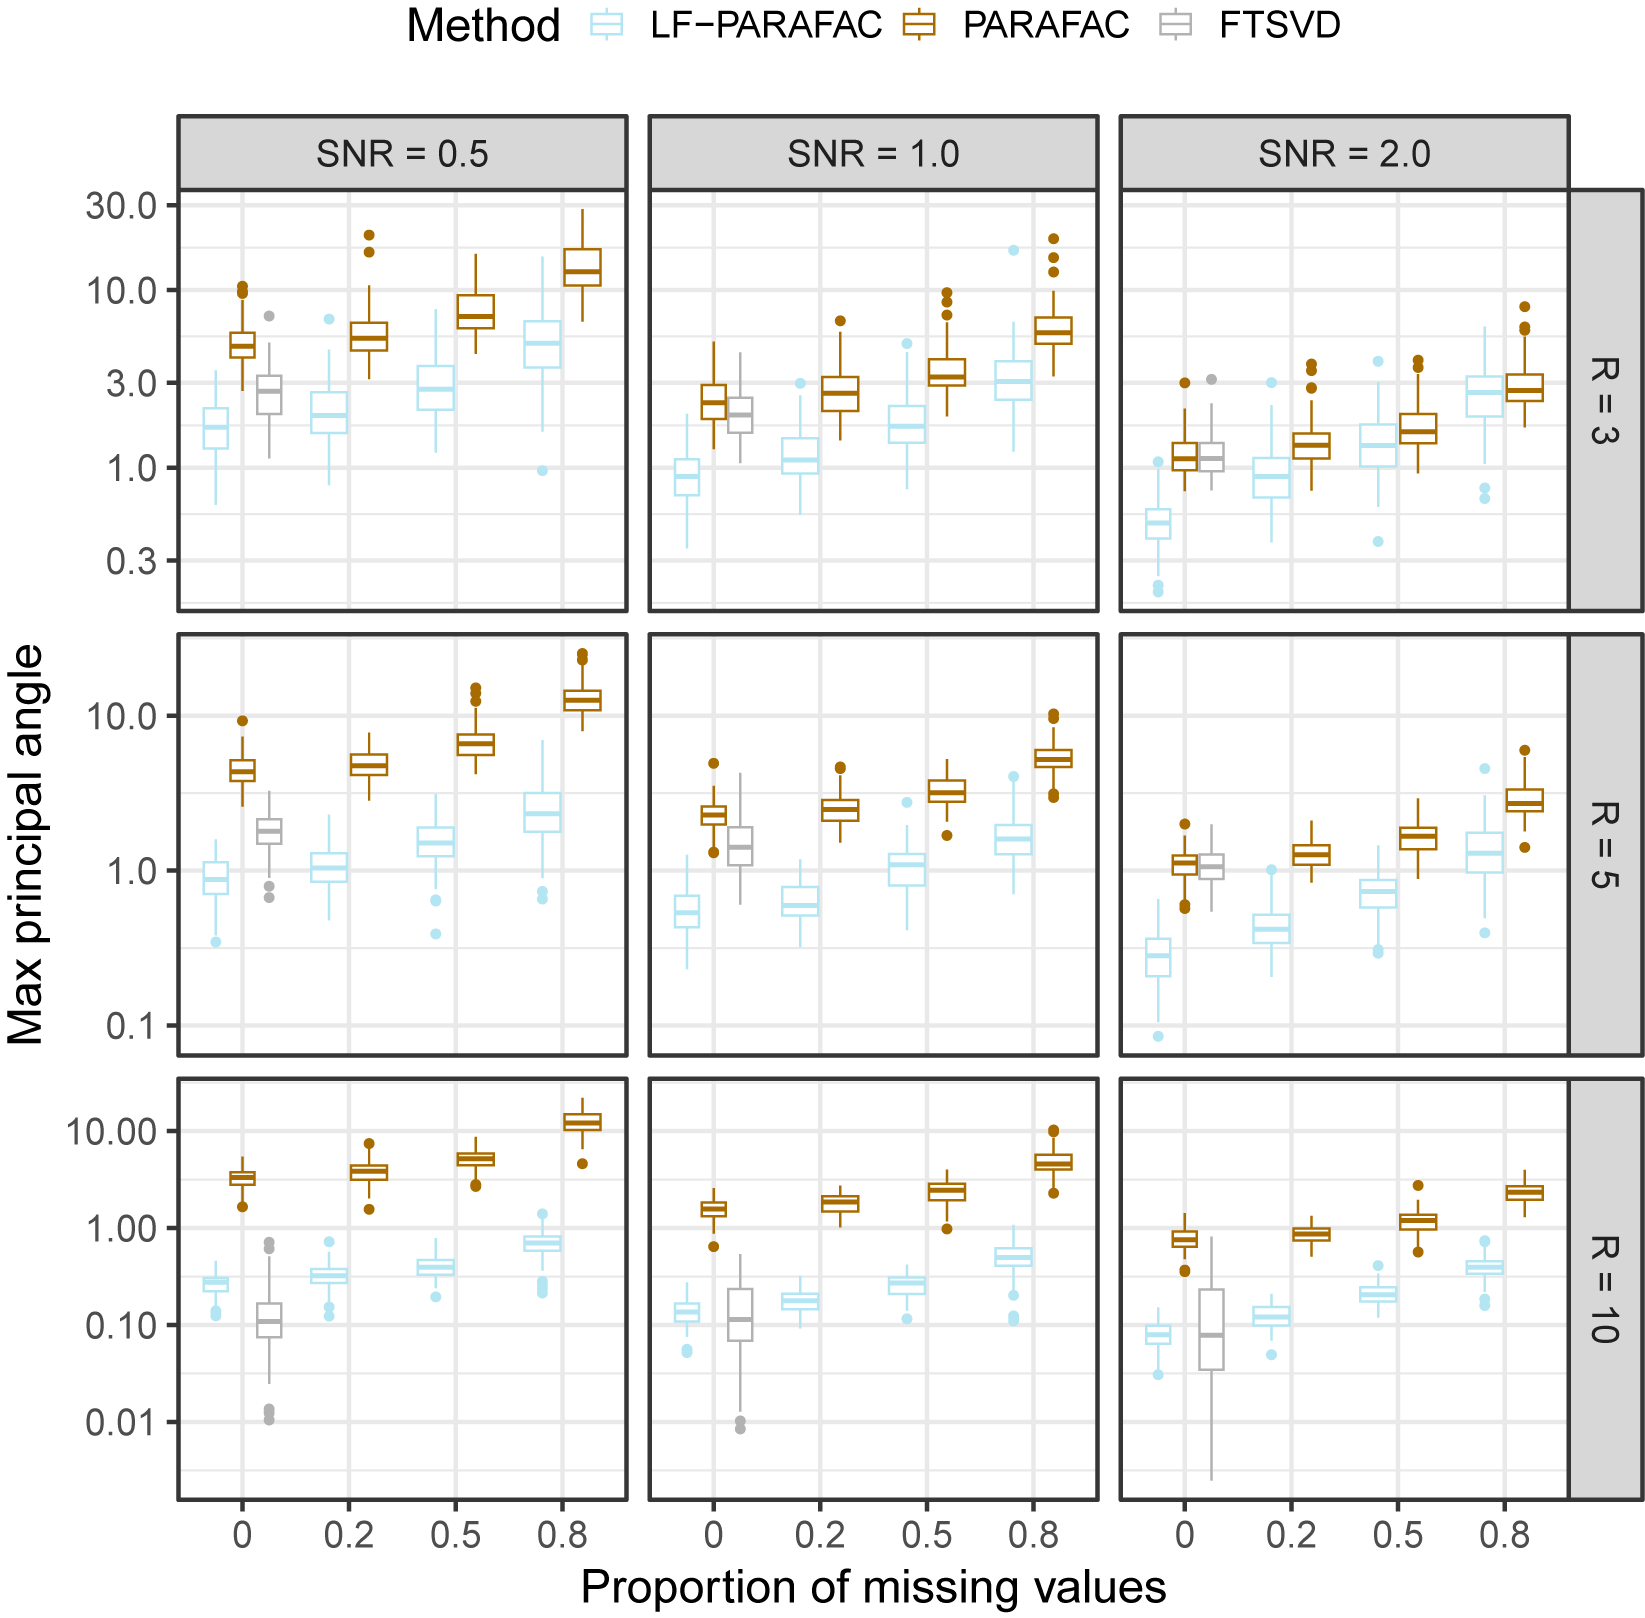


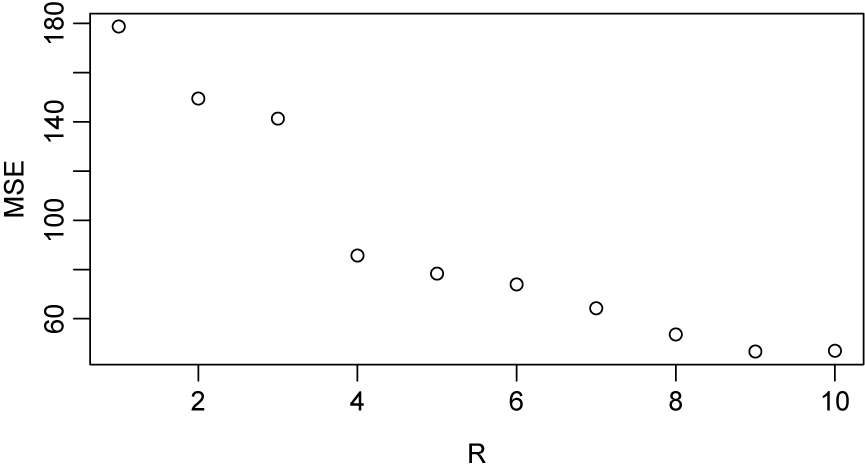
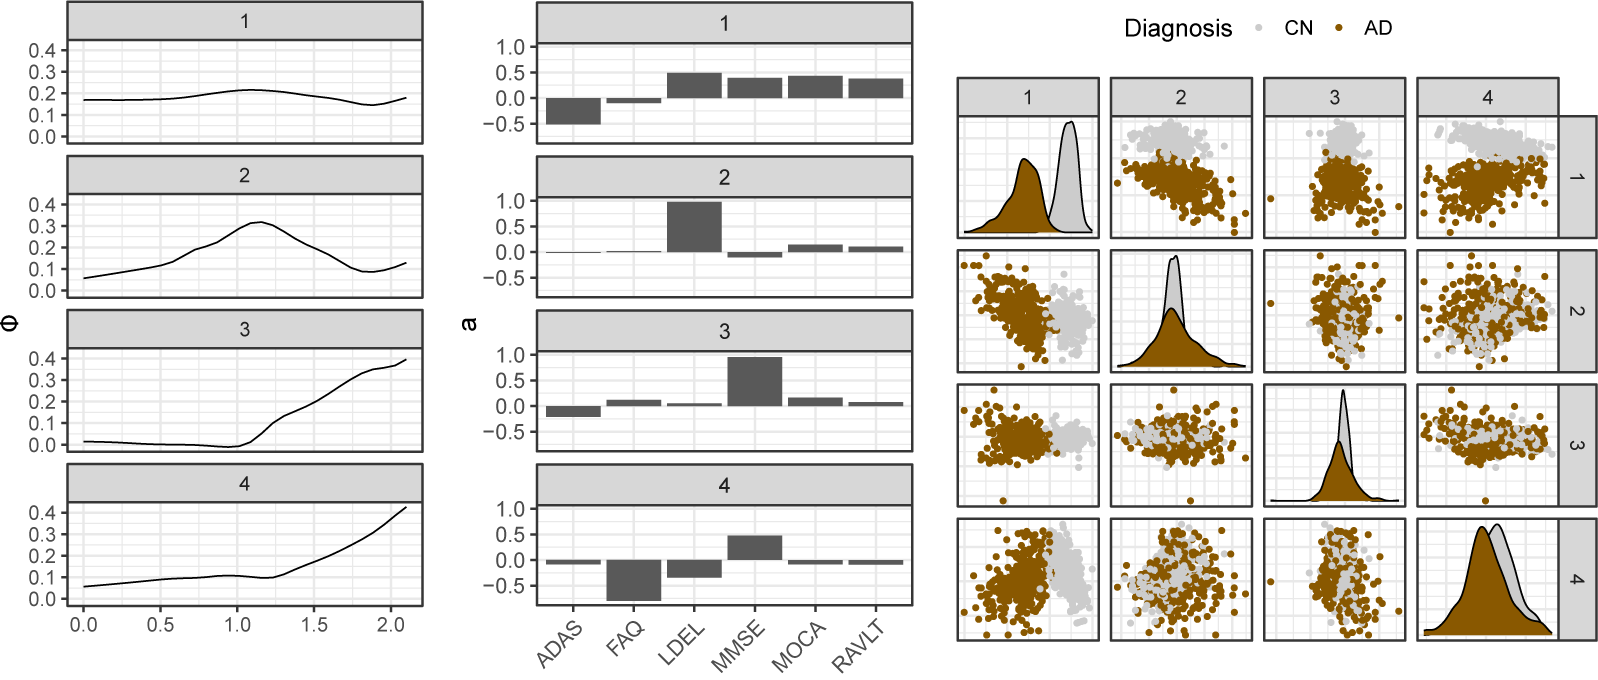

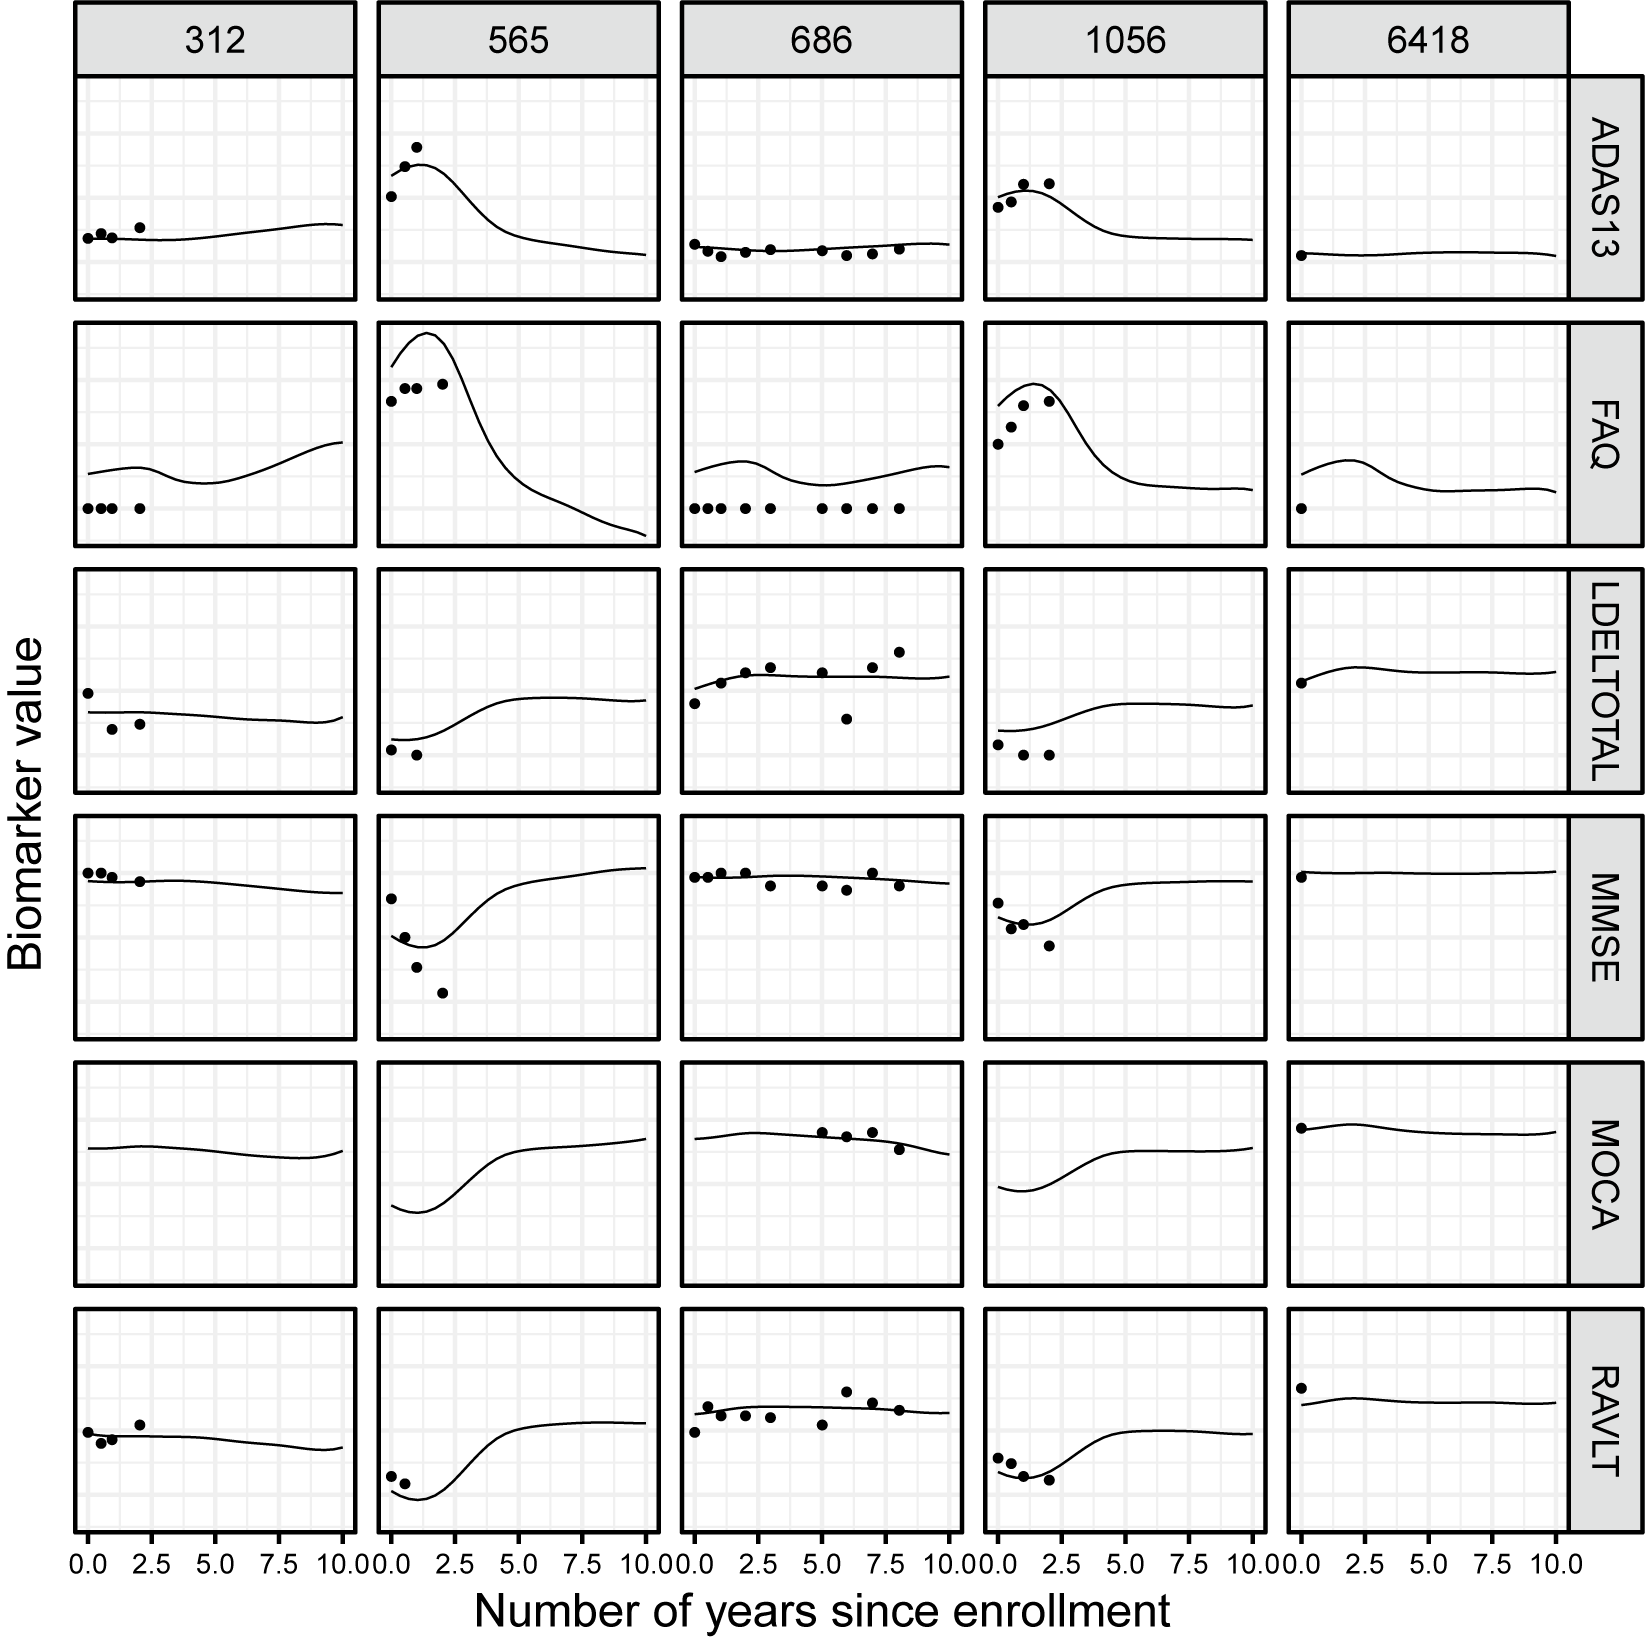
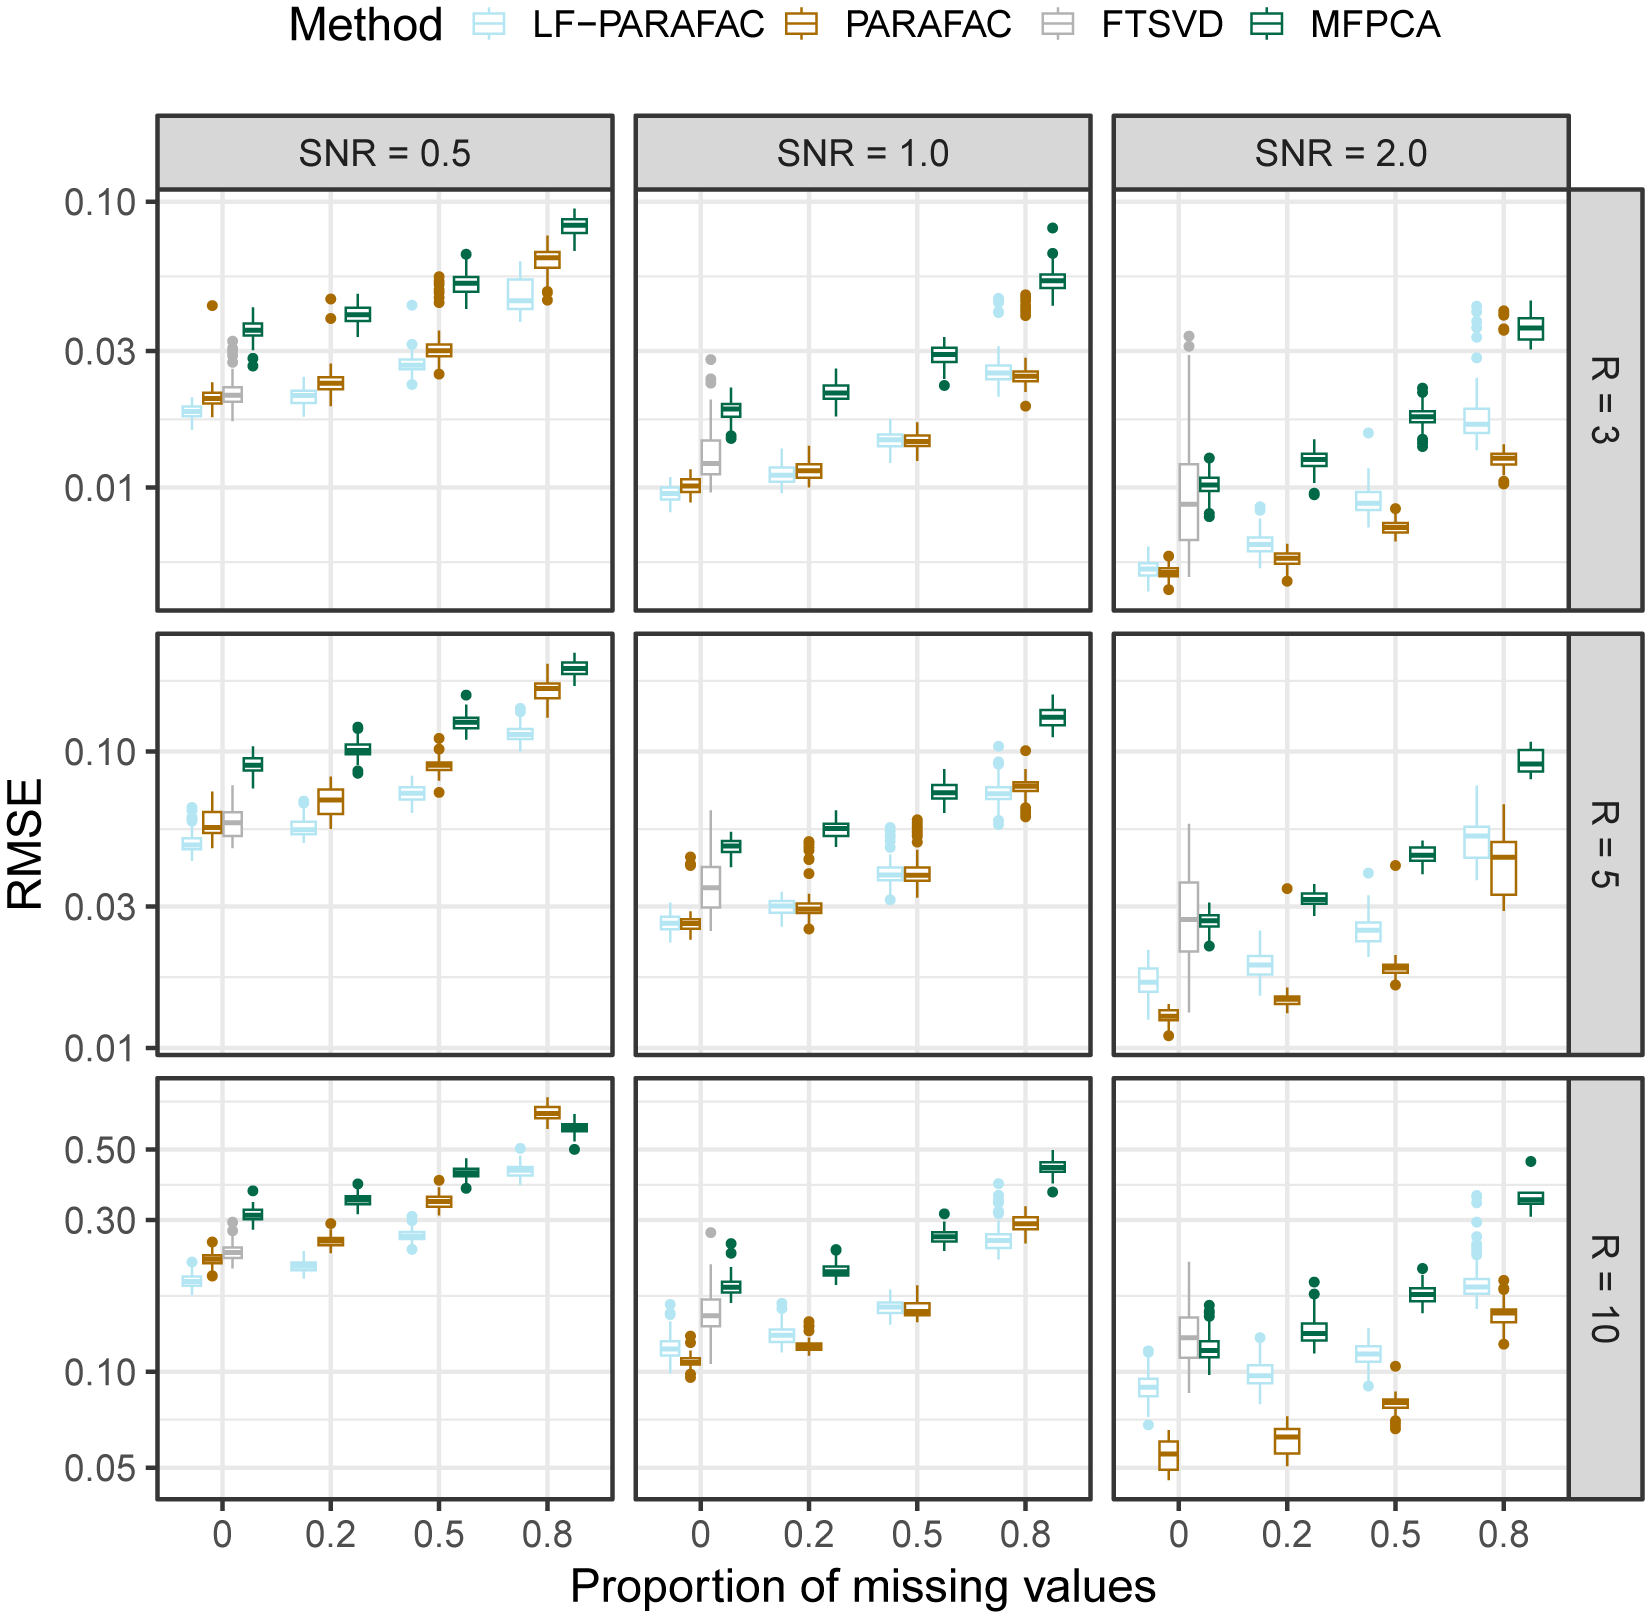
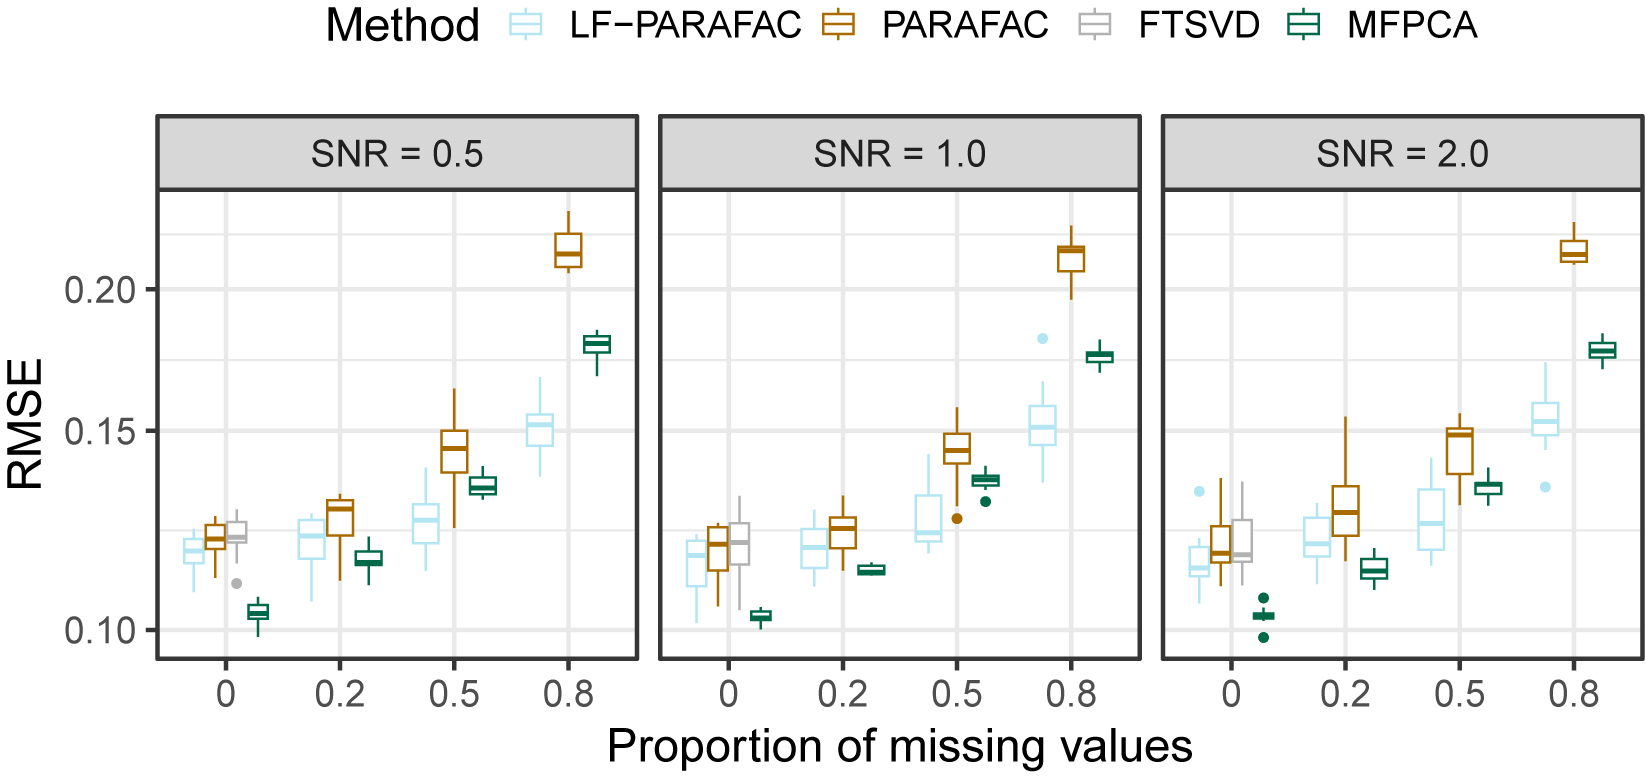


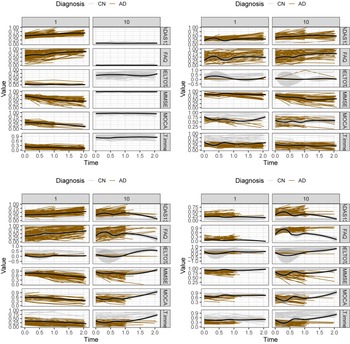


 Open access

