


The identification of symptom-based dimensions (factors) within various psychotic diagnoses has led to a number of questions. First, association of dimensions with various illness characteristics regarding onset, course and impairment has been reported in a number of studies (Reference Gureje, Aderibigbe and ObikoyaGureje et al, 1995; Reference Lenzenweger and DworkinLenzenweger & Dworkin, 1996; Reference van Os, Fahy and Jonesvan Os et al, 1996; Reference Ratakonda, Gorman and YaleRatakonda et al, 1998; Reference Marengo, Harrow and HerbenerMarengo et al, 2000; Reference Wickham, Walsh and AshersonWickham et al, 2001; Reference Kulhara and AvasthiKulhara & Avasthi, 2003; Reference Sato, Bottlender and SchroterSato et al, 2004); however, the associations observed in studies with multiple diagnostic groups may actually reflect differences among diagnostic categories rather than pure associations of the factors with the characteristics. Second, the distribution of the factor scores has not been examined adequately in the various diagnostic groups. Third, the usefulness of the dimensional approach is not firmly established. In previous studies it was generally found that symptom dimensions are superior to diagnostic categories in predicting course, outcome and treatment response (Reference van Os, Fahy and Jonesvan Os et al, 1996; Reference Peralta, Cuesta and GiraldoPeralta et al, 2002; Reference Rosenman, Korten and MedwayRosenman et al, 2003), but the difference between their degrees of explanatory power is rather small.
The first aim of the present study was to examine the factor structure in a population of people with psychosis, including patients with schizophrenia, schizoaffective disorder and mood disorders, and to identify differences between diagnostic groups regarding the factors. Our second aim was to check for correlations between the factors and various clinical characteristics before and after taking into account the diagnostic category to which the participants belonged. Our third aim was to assess the relative contribution of the dimensional v. the categorical diagnostic approach in explaining disease characteristics.
METHOD
Participants and clinical assessment
The Maudsley Family Study is an ongoing project which has recruited 694 individuals with familial or non-familial major psychotic disorders, their unaffected relatives, and healthy controls (Reference Frangou, Sharma and SigmundssonFrangou et al, 1997; Reference Toulopoulou, Rabe-Hesketh and KingToulopoulou et al, 2003; McDonald et al, Reference McDonald, Bullmore and Sham2004, Reference McDonald, Bullmore and Sham2005). For 194 of the respondents an Operational Criteria Checklist for Psychotic and Affective Illness (OPCRIT) file (Reference McGuffin, Farmer and HarveyMcGuffin et al, 1991) was completed. Three of these people were excluded from the present study, since more than 20% of the variables in their OPCRIT files had missing values.
For all 191 patients who were included in the analysis (Table 1), Research Diagnostic Criteria (RDC; Reference Spitzer, Endicott and RobinsSpitzer et al, 1978) and DSM–IV (American Psychiatric Association, 1994) diagnoses were made using a modified version of the Schedule for Affective Disorders and Schizophrenia – Lifetime version (Reference Endicott and SpitzerEndicott & Spitzer, 1978) in face-to-face interviews with experienced psychiatrists (C.McD, T.S., A.G., E.B.). Additional information regarding psychopathology was obtained from family members and hospital records where available. The OPCRIT files were filled in by two experienced psychiatrists (H.W., D.D.) who reviewed all material. In case of uncertainty, the final rating was decided after a discussion between the two raters and a third expert (C.McD.).
Diagnosis and demographic characteristics of the sample
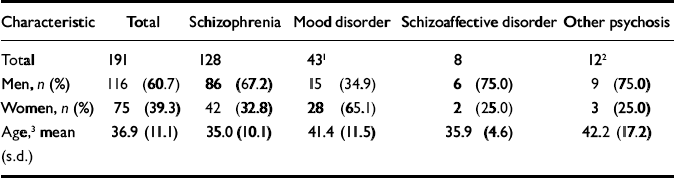
| Characteristic | Total | Schizophrenia | Mood disorder | Schizoaffective disorder | Other psychosis |
|---|---|---|---|---|---|
| Total | 191 | 128 | 431 | 8 | 122 |
| Men, n (%) | 116 (60.7) | 86 (67.2) | 15 (34.9) | 6 (75.0) | 9 (75.0) |
| Women, n (%) | 75 (39.3) | 42 (32.8) | 28 (65.1) | 2 (25.0) | 3 (25.0) |
| Age,3 mean (s.d.) | 36.9 (11.1) | 35.0 (10.1) | 41.4 (11.5) | 35.9 (4.6) | 42.2 (17.2) |
Extraction of factors and calculation of factor scores
In all, 51 OPCRIT items referring to symptoms entered the analysis as variables taking a value of 0 (symptom not present) or 1. Items referring to data collection and communication with sources of information (items 1, 2, 84 and 86), demographic variables (item 3), premorbid characteristics (items 6, 7, 9–11), potential aetiological correlates and comorbidity (items 12–16, 78–83), and onset and course of the disorder (items 4, 5, 8, 87–90) were not included in the factor analysis, but the correlation of factor scores with most of these items was later explored. Items 52, 64 and 65 (which refer to relationship between symptoms covered by other items) and items 38 and 40 (diurnal mood variation and diminished libido which, for many participants, could not be reliably retrieved) were also excluded from the analysis. Sleep disorders (insomnia and/or hypersomnia – items 44–47) and problems with appetite and/or weight (reduced or increased appetite with or without weight change – items 48–51) entered the analysis as two variables referring overall to each one of these conditions.
Extraction of factors was based on principal component analysis of correlation matrix and varimax rotation. Missing values (only 5 respondents of the 191 had more than five variables missing and none more than eight variables) were replaced with sample means. Regression factor scores were then calculated for each participant using the standard option within the Statistical Package for the Social Sciences, version 11.5 factor analysis procedure. The mean scores of factors were compared between the two main diagnostic groups, i.e. schizophrenia and mood disorder with psychosis (affective psychosis), and the factor scores were plotted in bar charts with participants grouped according to their diagnosis. Finally, a discriminant analysis was performed with diagnosis (schizophrenia or affective psychosis) as grouping variable and the five factor scores as independent variables.
Correlation of factor scores with characteristics of history and course
The clinical parameters examined for their relation to the factor scores were those referring to premorbid characteristics (work and social adjustment, personality disorder, presence of potential stressor associated with onset), onset (age at onset, mode of onset), and course (impairment during the episodes or exacerbations, quality of remissions between episodes or exacerbations, deterioration from the premorbid level of functioning, response to neuroleptics, overall course); these items were rated according to the OPCRIT definitions.
Each clinical characteristic was the dependent variable in two sets of regression analyses (linear, logistic or ordinal, as appropriate), and the factor scores were the independent variables; confounding factors were gender and age in the first set, and gender, age and diagnosis in the second. The relative contribution of factor scores v. that of categorical diagnosis in explaining the variability of clinical characteristics was assessed by comparing regression models.
Appropriate Bonferroni corrections for repeat measurements were applied wherever necessary.
RESULTS
Factor analysis
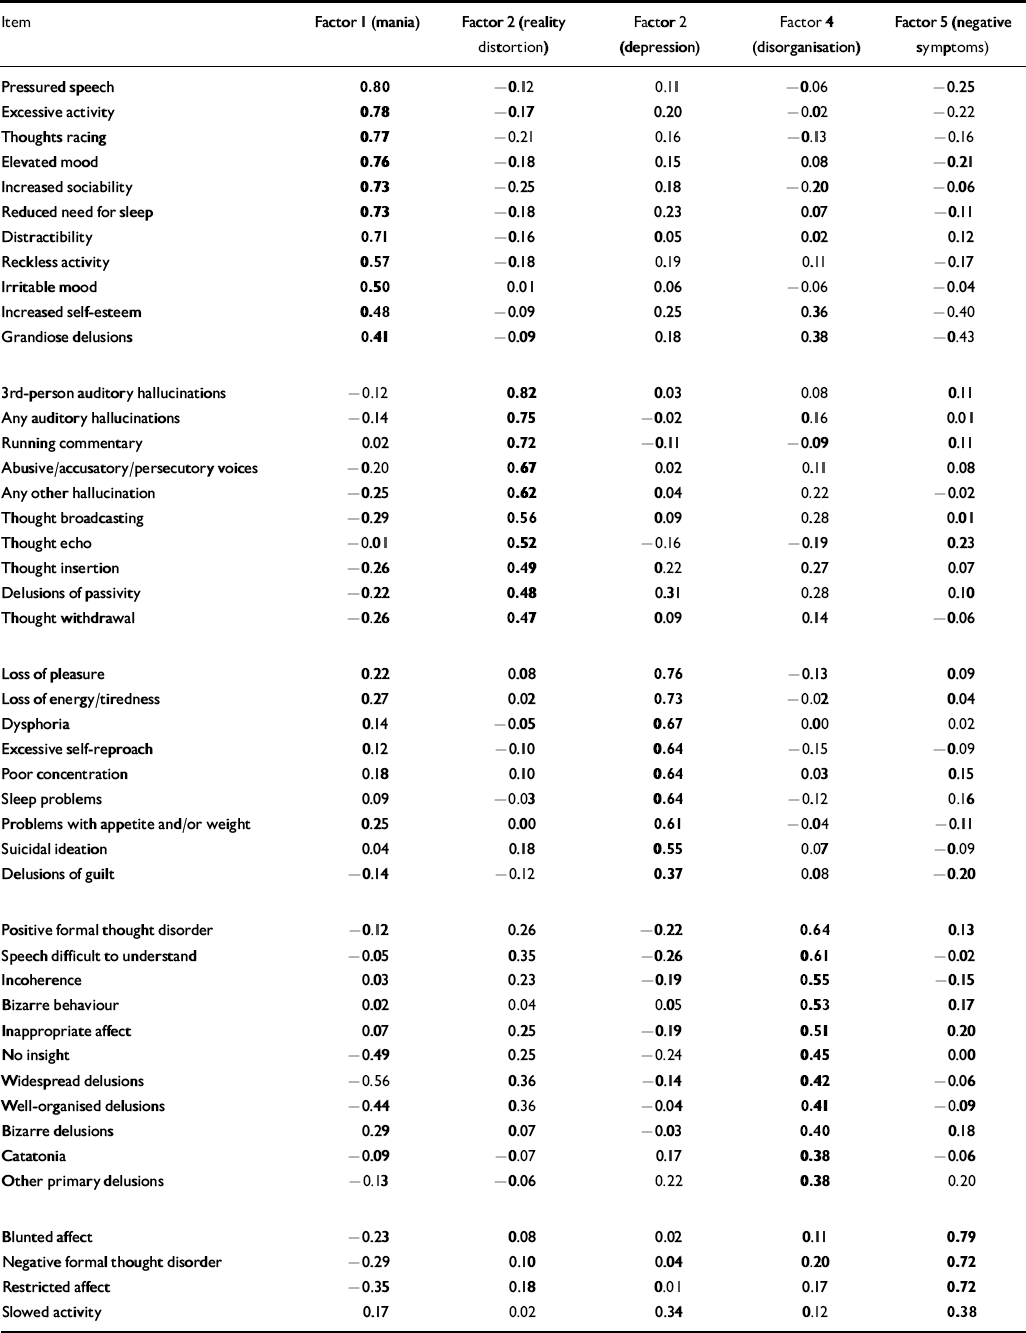
Inspection of the factor solution eigenvalues and of their scree plot showed that 4, 5 or 6 factors might be the best solutions for the analysis, but examination of items loading to each factor showed that the five-factor solution was superior. Six items (delusions of poverty, primary delusional perception, persecutory delusions, agitated activity, nihilistic delusions and delusions of reference) were excluded from the final solution, as each one accounted for less than 10% of each factor's variance and was complex, loading on more than one factor. The final five-factor solution explained 50.2% of the total variance. The items loading to each of the five factors are shown in Table 2. The factors can be considered as representing mania, reality distortion, depression, disorganisation and negative symptomatology.
Five-factor solution. Item loadings after varimax rotation. Bold type indicates the item loadings that contribute to each factor.
| Item | Factor 1 (mania) | Factor 2 (reality distortion) | Factor 2 (depression) | Factor 4 (disorganisation) | Factor 5 (negative symptoms) |
|---|---|---|---|---|---|
| Pressured speech | 0.80 | -0.12 | 0.11 | -0.06 | -0.25 |
| Excessive activity | 0.78 | -0.17 | 0.20 | -0.02 | -0.22 |
| Thoughts racing | 0.77 | -0.21 | 0.16 | -0.13 | -0.16 |
| Elevated mood | 0.76 | -0.18 | 0.15 | 0.08 | -0.21 |
| Increased sociability | 0.73 | -0.25 | 0.18 | -0.20 | -0.06 |
| Reduced need for sleep | 0.73 | -0.18 | 0.23 | 0.07 | -0.11 |
| Distractibility | 0.71 | -0.16 | 0.05 | 0.02 | 0.12 |
| Reckless activity | 0.57 | -0.18 | 0.19 | 0.11 | -0.17 |
| Irritable mood | 0.50 | 0.01 | 0.06 | -0.06 | -0.04 |
| Increased self-esteem | 0.48 | -0.09 | 0.25 | 0.36 | -0.40 |
| Grandiose delusions | 0.41 | -0.09 | 0.18 | 0.38 | -0.43 |
| 3rd-person auditory hallucinations | -0.12 | 0.82 | 0.03 | 0.08 | 0.11 |
| Any auditory hallucinations | -0.14 | 0.75 | -0.02 | 0.16 | 0.01 |
| Running commentary | 0.02 | 0.72 | -0.11 | -0.09 | 0.11 |
| Abusive/accusatory/persecutory voices | -0.20 | 0.67 | 0.02 | 0.11 | 0.08 |
| Any other hallucination | -0.25 | 0.62 | 0.04 | 0.22 | -0.02 |
| Thought broadcasting | -0.29 | 0.56 | 0.09 | 0.28 | 0.01 |
| Thought echo | -0.01 | 0.52 | -0.16 | -0.19 | 0.23 |
| Thought insertion | -0.26 | 0.49 | 0.22 | 0.27 | 0.07 |
| Delusions of passivity | -0.22 | 0.48 | 0.31 | 0.28 | 0.10 |
| Thought withdrawal | -0.26 | 0.47 | 0.09 | 0.14 | -0.06 |
| Loss of pleasure | 0.22 | 0.08 | 0.76 | -0.13 | 0.09 |
| Loss of energy/tiredness | 0.27 | 0.02 | 0.73 | -0.02 | 0.04 |
| Dysphoria | 0.14 | -0.05 | 0.67 | 0.00 | 0.02 |
| Excessive self-reproach | 0.12 | -0.10 | 0.64 | -0.15 | -0.09 |
| Poor concentration | 0.18 | 0.10 | 0.64 | 0.03 | 0.15 |
| Sleep problems | 0.09 | -0.03 | 0.64 | -0.12 | 0.16 |
| Problems with appetite and/or weight | 0.25 | 0.00 | 0.61 | -0.04 | -0.11 |
| Suicidal ideation | 0.04 | 0.18 | 0.55 | 0.07 | -0.09 |
| Delusions of guilt | -0.14 | -0.12 | 0.37 | 0.08 | -0.20 |
| Positive formal thought disorder | -0.12 | 0.26 | -0.22 | 0.64 | 0.13 |
| Speech difficult to understand | -0.05 | 0.35 | -0.26 | 0.61 | -0.02 |
| Incoherence | 0.03 | 0.23 | -0.19 | 0.55 | -0.15 |
| Bizarre behaviour | 0.02 | 0.04 | 0.05 | 0.53 | 0.17 |
| Inappropriate affect | 0.07 | 0.25 | -0.19 | 0.51 | 0.20 |
| No insight | -0.49 | 0.25 | -0.24 | 0.45 | 0.00 |
| Widespread delusions | -0.56 | 0.36 | -0.14 | 0.42 | -0.06 |
| Well-organised delusions | -0.44 | 0.36 | -0.04 | 0.41 | -0.09 |
| Bizarre delusions | 0.29 | 0.07 | -0.03 | 0.40 | 0.18 |
| Catatonia | -0.09 | -0.07 | 0.17 | 0.38 | -0.06 |
| Other primary delusions | -0.13 | -0.06 | 0.22 | 0.38 | 0.20 |
| Blunted affect | -0.23 | 0.08 | 0.02 | 0.11 | 0.79 |
| Negative formal thought disorder | -0.29 | 0.10 | 0.04 | 0.20 | 0.72 |
| Restricted affect | -0.35 | 0.18 | 0.01 | 0.17 | 0.72 |
| Slowed activity | 0.17 | 0.02 | 0.34 | 0.12 | 0.38 |
The mean score of each of the five factors differed significantly between the two main diagnostic groups, with scores of mania and depression being higher in participants with mood disorders, and scores of the other three factors being higher in participants with schizophrenia.
The discriminant analysis with diagnosis (schizophrenia or mood disorders) as grouping variable, and the five factor scores as independent variables, classified correctly 97.7% of the respondents with schizophrenia and 95.3% of the respondents with mood disorder, corresponding to 86.9% of the total sample.
Distribution of factor scores
In the overall sample the distribution of mania and negative symptoms factors seemed to be bimodal, whereas the distribution of the other three factors was unimodal. The distribution of factor scores in participants with schizophrenia and mood disorders, separated according to diagnosis, is shown in Fig. 1.
Distribution of the factor scores in patients with schizophrenia (filled bars) and mood disorders (shaded bars). The y-axis represents percentage of cases within each diagnostic category.

The factor scores of the people with schizoaffective disorder and psychosis not otherwise specified were scattered all over the range of the factor scores without any particular pattern.
Correlation of factor scores with other clinical characteristics which were not included in the factor analysis
Factor scores did not show any significant association with gender or age when diagnosis was controlled by regression. Similarly, they were not different between familial and non-familial participants.
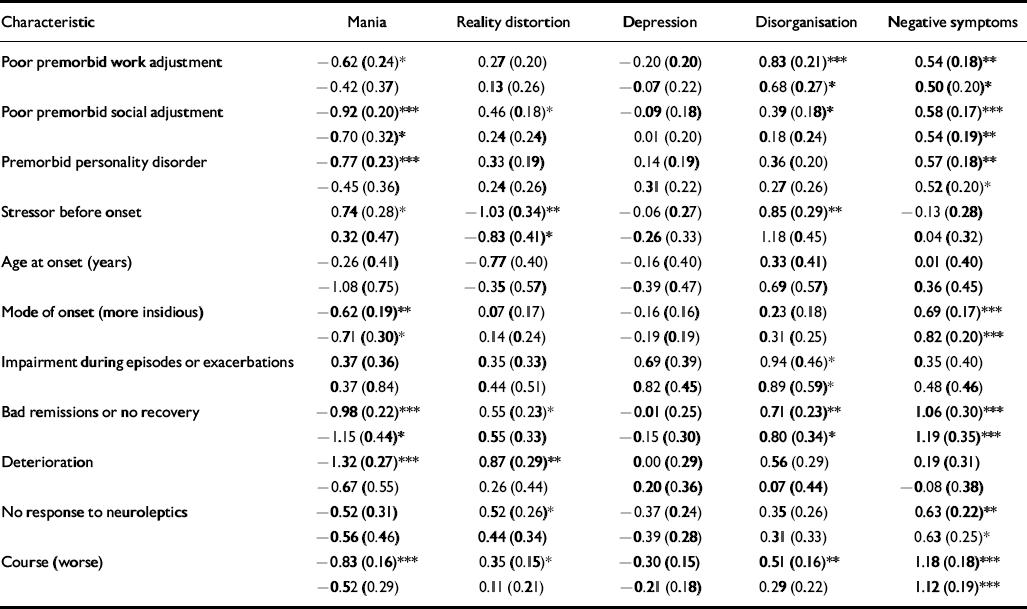
Statistical analysis of the relationship of factor scores and clinical characteristics relating to premorbid features, onset and course before and after controlling for diagnosis is presented in Table 3.
Regressions of clinical characteristics relating to premorbid features, onset and course on the five-factor scores. Values represent beta (standard error in parentheses) for logistic, linear or ordinal regression as appropriate. Within each cell, values of the top line are controlled for gender and age, and values of the bottom line are controlled for gender, age and diagnosis
| Characteristic | Mania | Reality distortion | Depression | Disorganisation | Negative symptoms |
|---|---|---|---|---|---|
| Poor premorbid work adjustment | -0.62 (0.24)* | 0.27 (0.20) | -0.20 (0.20) | 0.83 (0.21)*** | 0.54 (0.18)** |
| -0.42 (0.37) | 0.13 (0.26) | -0.07 (0.22) | 0.68 (0.27)* | 0.50 (0.20)* | |
| Poor premorbid social adjustment | -0.92 (0.20)*** | 0.46 (0.18)* | -0.09 (0.18) | 0.39 (0.18)* | 0.58 (0.17)*** |
| -0.70 (0.32)* | 0.24 (0.24) | 0.01 (0.20) | 0.18 (0.24) | 0.54 (0.19)** | |
| Premorbid personality disorder | -0.77 (0.23)*** | 0.33 (0.19) | 0.14 (0.19) | 0.36 (0.20) | 0.57 (0.18)** |
| -0.45 (0.36) | 0.24 (0.26) | 0.31 (0.22) | 0.27 (0.26) | 0.52 (0.20)* | |
| Stressor before onset | 0.74 (0.28)* | -1.03 (0.34)** | -0.06 (0.27) | 0.85 (0.29)** | -0.13 (0.28) |
| 0.32 (0.47) | -0.83 (0.41)* | -0.26 (0.33) | 1.18 (0.45) | 0.04 (0.32) | |
| Age at onset (years) | -0.26 (0.41) | -0.77 (0.40) | -0.16 (0.40) | 0.33 (0.41) | 0.01 (0.40) |
| -1.08 (0.75) | -0.35 (0.57) | -0.39 (0.47) | 0.69 (0.57) | 0.36 (0.45) | |
| Mode of onset (more insidious) | -0.62 (0.19)** | 0.07 (0.17) | -0.16 (0.16) | 0.23 (0.18) | 0.69 (0.17)*** |
| -0.71 (0.30)* | 0.14 (0.24) | -0.19 (0.19) | 0.31 (0.25) | 0.82 (0.20)*** | |
| Impairment during episodes or exacerbations | 0.37 (0.36) | 0.35 (0.33) | 0.69 (0.39) | 0.94 (0.46)* | 0.35 (0.40) |
| 0.37 (0.84) | 0.44 (0.51) | 0.82 (0.45) | 0.89 (0.59)* | 0.48 (0.46) | |
| Bad remissions or no recovery | -0.98 (0.22)*** | 0.55 (0.23)* | -0.01 (0.25) | 0.71 (0.23)** | 1.06 (0.30)*** |
| -1.15 (0.44)* | 0.55 (0.33) | -0.15 (0.30) | 0.80 (0.34)* | 1.19 (0.35)*** | |
| Deterioration | -1.32 (0.27)*** | 0.87 (0.29)** | 0.00 (0.29) | 0.56 (0.29) | 0.19 (0.31) |
| -0.67 (0.55) | 0.26 (0.44) | 0.20 (0.36) | 0.07 (0.44) | -0.08 (0.38) | |
| No response to neuroleptics | -0.52 (0.31) | 0.52 (0.26)* | -0.37 (0.24) | 0.35 (0.26) | 0.63 (0.22)** |
| -0.56 (0.46) | 0.44 (0.34) | -0.39 (0.28) | 0.31 (0.33) | 0.63 (0.25)* | |
| Course (worse) | -0.83 (0.16)*** | 0.35 (0.15)* | -0.30 (0.15) | 0.51 (0.16)** | 1.18 (0.18)*** |
| -0.52 (0.29) | 0.11 (0.21) | -0.21 (0.18) | 0.29 (0.22) | 1.12 (0.19)*** |
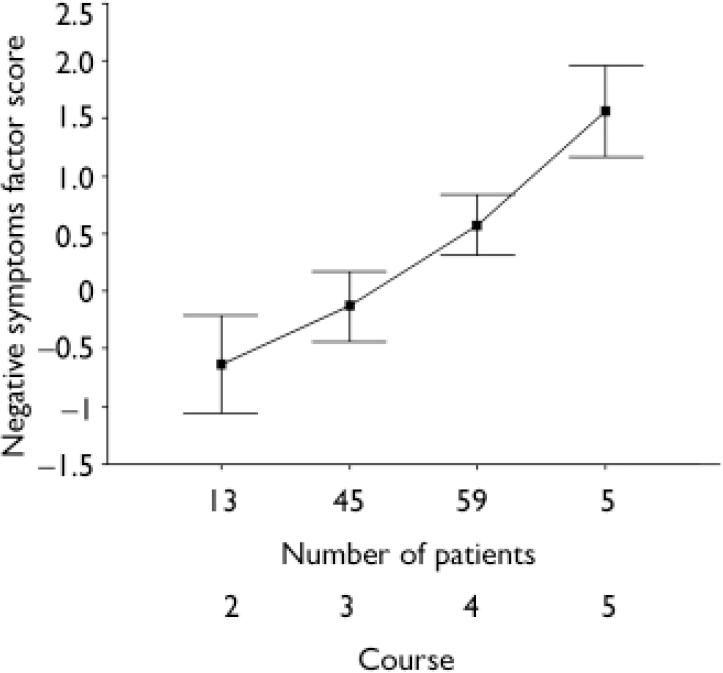
The majority of correlations that were significant after controlling for diagnosis related to people with schizophrenia. The strongest association between a factor score and a clinical characteristic was that of negative factor score and course among participants with schizophrenia (ordinal regression controlling for gender and age P<0.001, after controlling for multiple testing); this association is depicted in Fig. 2.
Negative symptoms factor score of patients with schizophrenia separated into groups according to the course of their illness. 2: multiple episodes with good recovery between; 3: multiple episodes with partial recovery between; 4: continuous chronic illness; 5: continuous chronic illness with deterioration. Dots show means for each group and bars represent 95% confidence intervals.
Relative contribution of diagnosis and factor scores to the explanation of the variability of clinical characteristics
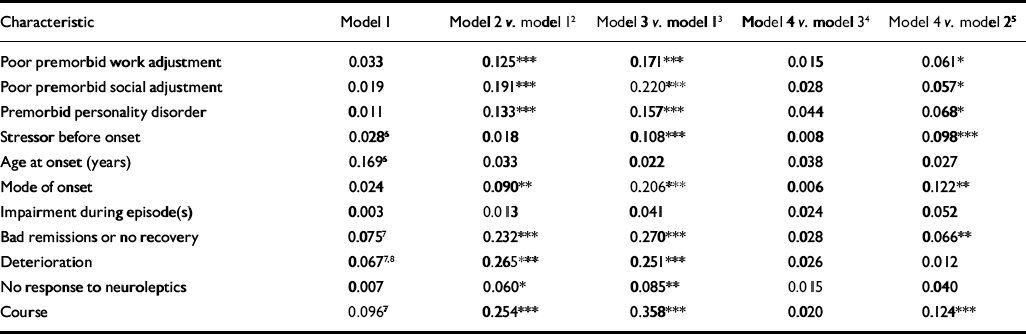
The results of comparing regression models to assess the relative contribution of the factor scores and that of the diagnosis in the variability of clinical characteristics are presented in Table 4. The association of gender and age with clinical characteristics was quite limited and generally not of high statistical significance. Diagnosis was found to explain premorbid impairment, mode of onset, bad remissions or no recovery between episodes or exacerbations, deterioration, no response to neuroleptics, and bad course (Table 4, model 2 v. model 1). All these characteristics, as well as the existence of stressors before onset, were also explained by the factor scores (Table 4, model 3 v. model 1). When the factor scores were considered first, diagnosis did not add to the explanation of the clinical characteristics (Table 4, model 4 v. model 3), whereas for most of the clinical characteristics whose variability was explained by diagnosis, factor scores still added substantially to the explanation (Table 4, model 4 v. model 2). Age of onset and impairment during episodes or exacerbations were not explained by either factor scores or diagnosis.
Regressions of clinical characteristics on gender, age, diagnosis and factor scores.1 Values in the first column are R-squares (based on the Cox & Snell calculation); values in the last four columns are R-square differences between regression models
| Characteristic | Model 1 | Model 2 v. model 12 | Model 3 v. model 13 | Model 4 v. model 34 | Model 4 v. model 25 |
|---|---|---|---|---|---|
| Poor premorbid work adjustment | 0.033 | 0.125*** | 0.171*** | 0.015 | 0.061* |
| Poor premorbid social adjustment | 0.019 | 0.191*** | 0.220*** | 0.028 | 0.057* |
| Premorbid personality disorder | 0.011 | 0.133*** | 0.157*** | 0.044 | 0.068* |
| Stressor before onset | 0.0286 | 0.018 | 0.108*** | 0.008 | 0.098*** |
| Age at onset (years) | 0.1696 | 0.033 | 0.022 | 0.038 | 0.027 |
| Mode of onset | 0.024 | 0.090** | 0.206*** | 0.006 | 0.122** |
| Impairment during episode(s) | 0.003 | 0.013 | 0.041 | 0.024 | 0.052 |
| Bad remissions or no recovery | 0.0757 | 0.232*** | 0.270*** | 0.028 | 0.066** |
| Deterioration | 0.0677,8 | 0.265*** | 0.251*** | 0.026 | 0.012 |
| No response to neuroleptics | 0.007 | 0.060* | 0.085** | 0.015 | 0.040 |
| Course | 0.0967 | 0.254*** | 0.358*** | 0.020 | 0.124*** |
DISCUSSION
Factor analysis
The ratio of various diagnoses in our study is similar to that of other studies which have analysed symptomatology of mixed diagnostic samples (Reference van Os, Fahy and Jonesvan Os et al, 1996; Reference McGorry, Bell and DudgeonMcGorry et al, 1998; Reference Toomey, Faraone and SimpsonToomey et al, 1998; Reference Ventura, Nuechterlein and SubotnikVentura et al, 2000; Reference Serretti, Rietschel and LattuadaSerretti et al, 2001; Reference Wickham, Walsh and AshersonWickham et al, 2001; Reference Rosenman, Korten and MedwayRosenman et al, 2003; Reference Lindenmayer, Brown and BakerLindenmayer et al, 2004), and it reflects the ratio of people with schizophrenia to people with affective psychosis presenting to general psychiatric services in London (Reference Morgan, Mallett and HutchinsonMorgan et al, 2005).
The five-factor solution that we chose as best fitting to our data is comparable with that proposed by many other studies on psychosis (Lindenmayer et al, Reference Lindenmayer, Bernstein-Hyman and Grochowski1995a ,Reference Lindenmayer, Grochowski and Hyman b ; Reference Nakaya, Suwa and OhmoriNakaya et al, 1999; Reference Lykouras, Oulis and PsarrosLykouras et al, 2000; Reference Mass, Schoemig and HitschfeldMass et al, 2000; Reference Ehmann, Holliday and MacewanEhmann et al, 2001; Reference Wickham, Walsh and AshersonWickham et al, 2001; Reference Drake, Dunn and TarrierDrake et al, 2003; Reference Good, Rabinowitz and WhitehornGood et al, 2004; Reference Lindenmayer, Brown and BakerLindenmayer et al, 2004). Of the recent studies which have assessed the dimensions of mixed diagnostic samples of patients with schizophrenia spectrum and patients with mood disorder, the five-factor model has been chosen as the most appropriate in some (Reference van Os, Gilvarry and Balevan Os et al, 1999; Reference Wickham, Walsh and AshersonWickham et al, 2001; Reference Lindenmayer, Brown and BakerLindenmayer et al, 2004) and a four-factor model in others (Reference McGorry, Bell and DudgeonMcGorry et al, 1998; Reference Serretti, Rietschel and LattuadaSerretti et al, 2001). In the first of the latter studies, the four-factor model was chosen because psychotic symptoms were examined from the Bleulerian v. the Schneiderian perspective, and both negative and disorganisation symptoms fall into the first of these categories (Reference McGorry, Bell and DudgeonMcGorry et al, 1998). In the study of Serretti et al (Reference Serretti, Rietschel and Lattuada2001), the negative symptoms factor was not distinguished from disorganisation, but the item ‘restricted affect’ was excluded from the analysis because of high correlation with ‘blunted affect’, which might have had an important impact on the negative symptoms factor when the analysis was based on OPCRIT data. Items loading to the negative symptoms factor in the OPCRIT were few, but inspection of their factor loading scores (Table 2) shows the negative factor to be quite robust. This was further supported when we attempted the four-factor solution, where the items contributing to the negative factor and their loadings stayed practically unchanged, whereas the disorganisation factor dissolved.
Thus, we believe that the five-factor model is the most appropriate to explain the variance in the symptoms of our sample.
Distribution of factor scores
The score on the mania factor seems the best discriminator between schizophrenia and mood disorders (Fig. 1). For depression, reality distortion and disorganisation factor scores there is considerable overlap of participants with schizophrenia and those with mood disorders, although mean values differ between the two groups. For the negative symptoms factor, the scores of respondents with mood disorders are at about the middle of the range, whereas the scores of respondents with schizophrenia vary more widely.
In general, the score of people with schizophrenia has a much wider distribution than the score of people with mood disorders, implying that bipolar disorder is a much more solid construct than schizophrenia, which appears to be heterogeneous. Negative symptoms, in particular, have a bimodal distribution among people with schizophrenia, suggesting two different latent sub-categories of the disease.
Five studies provide some description of the factor structure by diagnostic category. Intra-group variation of factor scores and considerable overlap between diagnostic groups is cited by van Os et al (Reference van Os, Fahy and Jones1996). In the study by Ratakonda et al (Reference Ratakonda, Gorman and Yale1998) the patients with schizophrenia scored higher in the negative symptoms factor and the positive factor and, to a lesser extent, also in the disorganisation factor, than the patients without schizophrenia. The latter group, however, was a mixed diagnostic group including 65 individuals with mood disorders, 16 with delusional disorder and 21 with various other psychotic disorders (Reference Ratakonda, Gorman and YaleRatakonda et al, 1998). As in our study, the participants with affective psychosis were found to score higher in mania and depression and lower in positive and negative symptom factors, with considerable overlap between diagnostic categories in the van Os et al (Reference van Os, Gilvarry and Bale1999) study, but no detailed presentation of the factor distributions was made. Factor score distribution across categories of individuals with affective psychosis v. non-affective psychosis is presented in the van Os et al (Reference van Os, Gilvarry and Bale2000) study. The overlap of scores for negative symptom, disorganisation and positive symptom factors is much greater than the respective overlap in our sample; the inclusion of patients with schizoaffective disorder in the affective psychosis group of the van Os et al study may be an explanation for this. In the most recent study by Lindenmayer et al (Reference Lindenmayer, Brown and Baker2004), the factors were derived by separate analyses for the diagnostic groups of schizophrenia and mood disorders, and only a few differences in symptoms between the diagnostic groups are mentioned.
Correlation of factor scores with other clinical characteristics which were not included in the factor analysis
Mania, reality distortion and disorganisation factor scores are associated with various clinical characteristics, but most of these associations are lost when diagnosis is controlled for by multiple regression (Table 3). The negative symptoms factor score is the only factor score which shows significant associations with more than one of the clinical characteristics when gender, age and diagnosis are controlled for and multiple testing is taken into account. Negative symptoms factor score is positively associated with poor premorbid performance (social and occupational), premorbid personality disorder, more insidious onset, bad remissions or no recovery between episodes, no response to neuroleptics, and worse course of the illness.
Those associations the significance of which is lost after controlling for diagnosis are mainly concerned with differences between diagnostic groups (of schizophrenia v. mood disorder), and do not reflect a real relation between the factor score and the clinical characteristic other than that which connects the clinical characteristic with a specific diagnosis.
In all eight other studies, which examined the correlation between psychopathological dimensions and clinical characteristics, the negative factor was found to be associated with at least one characteristic indicating either poor premorbid functioning (Reference Gureje, Aderibigbe and ObikoyaGureje et al, 1995; Reference Lenzenweger and DworkinLenzenweger & Dworkin, 1996; Reference Ratakonda, Gorman and YaleRatakonda et al, 1998; Reference Wickham, Walsh and AshersonWickham et al, 2001; Reference Kulhara and AvasthiKulhara & Avasthi, 2003), earlier or insidious onset (Reference van Os, Fahy and Jonesvan Os et al, 1996; Reference Ratakonda, Gorman and YaleRatakonda et al, 1998; Sato et al, 1998; Reference Sato, Bottlender and SchroterSato et al, 2004), or deteriorating/chronic course (Reference van Os, Fahy and Jonesvan Os et al, 1996; Reference Marengo, Harrow and HerbenerMarengo et al, 2000; Reference Wickham, Walsh and AshersonWickham et al, 2001). The dimension of disorganisation has been found to be associated with the same characteristics as the negative symptoms dimension in five out of the eight studies (Reference Gureje, Aderibigbe and ObikoyaGureje et al, 1995; Reference Lenzenweger and DworkinLenzenweger & Dworkin, 1996; Reference van Os, Fahy and Jonesvan Os et al, 1996; Reference Ratakonda, Gorman and YaleRatakonda et al, 1998; Reference Wickham, Walsh and AshersonWickham et al, 2001); the strength of correlations, however, was less strong than that of the negative symptoms dimension (Reference van Os, Fahy and Jonesvan Os et al, 1996; Reference Wickham, Walsh and AshersonWickham et al, 2001), as was the case in our study. The reality distortion dimension was found in three studies to be associated with a deteriorating/chronic course or (not very strongly) with a bad outcome (Reference van Os, Fahy and Jonesvan Os et al, 1996; Reference Ratakonda, Gorman and YaleRatakonda et al, 1998; Reference Wickham, Walsh and AshersonWickham et al, 2001). In our study, we observed an association of the reality distortion factor with poor premorbid adjustment and poor course, but these correlations were lost when diagnosis was controlled for. It seems, thus, that the findings relating reality distortion to a more severe disorder could be attributed to differences among the various diagnostic groups of patients of the three studies, all of which contained mixed populations of people with psychosis (Reference van Os, Fahy and Jonesvan Os et al, 1996; Reference Ratakonda, Gorman and YaleRatakonda et al, 1998; Reference Wickham, Walsh and AshersonWickham et al, 2001). In the only study that included people with schizophrenia only, reality distortion was associated with better premorbid adjustment, suggesting that among patients belonging to one diagnostic category its presence might be an indicator of milder disease (Reference Lenzenweger and DworkinLenzenweger & Dworkin, 1996). The depressive symptoms dimension has not been found in any other study to be related to another clinical characteristic, which is in accordance with our results. Finally, in one study the mania dimension was found to be associated with a better course, a finding which was similar to what was observed in the present study, and which was markedly attenuated when diagnosis was taken into account (Reference van Os, Fahy and Jonesvan Os et al, 1996).
Thus, it seems that our results are quite similar to those of previous studies, particularly if differences between diagnoses are taken into account. It should be noted, however, that direct comparisons with previous findings cannot be made, since the current analysis was based on global premorbid and retrospective items on course and outcome, whereas prospective follow-up measures or detailed measures of need were used in other papers.
Relative contributions of diagnosis and factor scores to the explanation of the variability of clinical characteristics
According to the comparison between regression models, diagnosis seems to explain by itself the large majority of clinical characteristics that were examined. Factor scores were found to add to the explanation of the variability of these characteristics, even when diagnosis had already been taken into account. On the other hand, when factor scores were first used to explain the variability of the clinical picture, diagnosis did not seem to add anything to the explanation. It appears, thus, that the Kraepelinian subdivision can be almost perfectly derived from the five symptom dimensions, as was also shown by the results of the discriminant analysis we performed.
Categorical v. dimensional approaches were compared in a number of studies, generally showing (as was the case in our study) that dimensions are more useful than diagnostic categories as predictors of clinical course and treatment decisions (van Os et al, Reference van Os, Fahy and Jones1996, Reference van Os, Gilvarry and Bale1999; Reference Peralta, Cuesta and GiraldoPeralta et al, 2002; Reference Rosenman, Korten and MedwayRosenman et al, 2003).
The finding that dimensions explain more of the clinical characteristics, course, and use of services than do diagnoses, has led to proposals that the dimensional approach should be considered indispensable for clinical management, alongside the use of categorical diagnosis (Reference van Os, Gilvarry and Balevan Os et al, 1999; Reference Salokangas, Honkonen and StengardSalokangas et al, 2002; Reference Rosenman, Korten and MedwayRosenman et al, 2003; Reference van Os, Verdoux, Murray, Jones and Susservan Os & Verdoux, 2003). Our findings, however, show that the number of clinical characteristics whose variability is explained to a satisfactory level by diagnosis alone is quite high, and does not fall short of the number of characteristics the variability of which is explained by the factors alone. Furthermore, in the studies by Peralta et al (Reference Peralta, Cuesta and Giraldo2002) and Rosenman et al (Reference Rosenman, Korten and Medway2003), the difference in the explanatory potential of diagnosis v. that of dimensions was overall not very large, indicating that categorical diagnoses as used today in psychiatry are quite robust and convey a large amount of information. In that sense, the diagnostic categories which are available seem to be sufficient as a first-order approximation, given also that their use is the most cost-effective approach for communication between clinicians and initial understanding of the patient. On the other hand, since dimensions are generally found to add to the information contained in diagnosis, the dimensional approach offers a much better perspective into the symptoms and characteristics of the illness, and is useful for an in-depth understanding of the individual patient and for research purposes.
General comments and conclusions
There are some limitations to the present study. First, the sample is relatively small and was recruited for the special purpose of a family study. Individuals with mood disorders, in particular, were selected only if they also had exhibited psychotic symptoms, whereas the sample of participants with diagnoses other than schizophrenia or mood disorders was rather small. On the other hand, this recruitment procedure meant that all participants have been very rigorously examined by the same few individuals. Another limitation of the study is that it relies on retrospective rather than prospective data.
In spite of these limitations, various conclusions can be drawn. A five-dimension structure comprising mania, reality distortion, depression, disorganisation and negative symptoms seems to be most appropriate to explain the symptoms of people with psychosis. The scores of all factors are more variable in schizophrenia than in mood disorders, mania is the best discriminator between schizophrenia and affective psychosis, and the factor of negative symptoms is bimodal in schizophrenia. In addition, the negative symptoms factor seems to be the most robust of all, with its scores strongly correlated to various other clinical factors that relate to premorbid features, onset and course of the disorder. Finally, the contribution of factors to the understanding of symptoms of a given individual is found to be important, although it is also shown that the contribution of Kraepelinian diagnosis is quite high as well.
Acknowledgements
Funding sources: D.G.D. received partial funding from the University of Athens. H.W. was supported by the Medical Research Council. C.McD. and E.B. were supported by the Wellcome Trust. We also received funding from the Stanley Medical Research Institute, the National Alliance for Research in Schizophrenia and the Schizophrenia Research Fund.




eLetters
No eLetters have been published for this article.