


Chapter 3 introduces readers to politics in Ghana and is divided into three sections. Section 3.1 provides an overview of Ghana’s national and local political institutions. A constitution that upholds multi-party democracy was adopted in 1992, after a period of authoritarian rule. Since then, two main political parties, the National Democratic Congress (NDC) and the New Patriotic Party (NPP), have come to dominate the political landscape. Executive power lies with an elected President. At the local level, power is decentralized to 260 local governments that serve individual districts. Local governments are the focal unit of study in this book. Local governments’ main task is to construct new local infrastructure projects, to which 40 percent of total local government spending is dedicated.Footnote 1
Section 3.2 focuses on the groups of actors whose incentives and behavior determine how local governments operate: politicians, bureaucrats, and voters. Mayors head local governments.Footnote 2 They are centrally appointed by the president. Mayors play a key role in implementing local development projects and awarding public contracts. Their work within districts influences the president’s political fortunes. Furthermore, because their re-appointment relies on the incumbent party retaining the presidency, they have an incentive to dedicate time and resources to electoral mobilization on the incumbent party’s behalf. Many mayors also seek to advance their political careers by contesting parliamentary primaries, which are often highly competitive and financially demanding.
The local government’s bureaucratic arm is headed by the District Coordinating Director (DCD), who is supported by a team of centrally recruited professional staff. Regarding voters, Ghanaians value both private benefits and broader development outcomes. While clientelistic exchanges are common, voters also reward politicians for delivering local public goods and universal policies. These multifaceted demands create strong incentives for politicians to value both loyal and competent bureaucracies to meet diverse electoral expectations.
Section 3.3 homes in on the recruitment of bureaucrats who work across local governments. I analyze data from expert and bureaucrat surveys, and human resource (HR) data that contains individual-bureaucratic records, to assess the extent to which bureaucratic selection is determined by meritocratic or non-meritocratic traits of individuals. These data suggest that while the very top layer of bureaucrats – mainly those at the national level – are politically appointed, political affiliation rarely influences selection to mid- and top-tier positions in local governments. Establishing relatively high levels of meritocracy in the recruitment of professional bureaucrats in local governments is important, as it highlights why it is puzzling that such bureaucrats sometimes work to undermine local development for political purposes once in office – a phenomenon that I explore and seek to explain in Chapter 4.
3.1 National and Local Political Institutions
Ghana is a lower-middle-income country in West Africa. It was colonized by the British in 1872, and later became the first sub-Saharan African country to gain independence in 1957. It has since oscillated between democratic and autocratic rule, including multiple military dictatorships. The 1992 constitution re-introduced multi-party elections.Footnote 3 The country has since held nine national elections; power changed hands in 2000, 2008, 2016, and 2024.
Voters can elect a president, an MP, and a local councilor. Presidential and parliamentary elections are conducted concurrently, while local elections are typically held in between. The president is elected in a majoritarian run-off system. For presidential elections, the nation serves as a single constituency, which means votes count equally across the country. The MPs are elected by plurality rule in one of 276 single-member constituencies. Local councilors are also elected via plurality rule within their electoral districts.Footnote 4
The NDC and the NPP dominate politics at all levels and across the country; together, they routinely capture about 98 percent of the votes in presidential races. This high degree of party system institutionalization, which is somewhat rare in the African context, is a product of the dominance of the Provisional National Defence Council (PNDC) (now NDC) during the transition to democracy, combined with a history of two rival political ideologies – the “liberals” and “socialists” – which date back to the nationalist movements that emerged during the fight for independence.Footnote 5 Both major parties are multi-ethnic and multi-regional in composition, but each has regions of concentrated supportFootnote 6 – the Volta region for the NDC and the Ashanti and Eastern regions for the NPP. Many other regions, and the constituencies within them, remain moderately or highly competitive.
Regional boundaries were changed in 2020, which increased the number of regions from ten to sixteen.Footnote 7 Prior to this, election results were the outcome of voters in four “swing” regions (Central, Western, Brong Ahafo, and Greater Accra). The last two decades have seen some highly competitive presidential races, for example, the election was decided by 0.4 percentage points in 2008, and 3 points in 2012. This compares to a victory margin of 28 percentage points in 1992 presidential election.
3.1.1 Local Governments: How Many Are There, How Are They Funded, and What Do They Do?
The country is divided into districts administered by local governments. When I collected data in 2016 there were 216 districts; by 2019 there were 260. Districts typically correspond to parliamentary constituencies, while some densely populated districts contain two parliamentary constituencies. In accordance with the Local Government Act (1993) and Local Governance Act (2016), local governments are responsible for districts’ overall development, including the provision of basic infrastructure and services. Regional Coordinating Councils monitor and coordinate the performance of local governments in the region. They also provide information to local governments to assist in the formulation of district development plans.Footnote 8
Local government budgets are mostly funded by direct transfers from the central government or international donors. The most significant (and most stable over time) source of funding is the District Assembly Common Fund (DACF). The constitution requires the national government to allocate 5 percent of national revenues to this fund.Footnote 9 An estimated 50 percent of DACF funds are directly allocated to local governments (no strings attached); the remainder is earmarked for specific projects under national policies, the upkeep of district office buildings, and to support the Regional Coordinating Councils. In 2020, approximately $200 million was allocated directly to local governments.Footnote 10
International donors also channel a significant amount of funds to local governments. The most significant fund was the District Development Facility (DDF), which was established in 2009; annual allocations were often nearly $60 million. The Ministry of Local Government and Rural Development managed DDF transfers, which were pegged to sound administrative performance. In 2018, the DACF “Responsiveness Factor Grant” replaced the DDF. Allocations to local governments from this grant change from year to year depending on central government and donor commitments. In 2019, the German development agency (GIZ) allocated about $12 million to local governments, and the World Bank supported projects in a number of urban districts as part of the Secondary Cities Support Program, which provided Urban Development Grants to twenty-five municipal governments.
Local government budgets vary by year, and depend on whether the district is rural or urban. Most local governments in my sample operated with about USD 850,000 during the study period – enough to build twelve new schools each year.Footnote 11
Local governments’ primary mandate is to direct local development: building local capital infrastructure accounts for over 40 percent of total local government spending in Ghana.Footnote 12 Thus mayors, bureaucrats, and local councilors spend most of their time planning and implementing local development projects.
Building new infrastructure involves multiple steps, including meeting with community stakeholders, writing planning documents and budgets, placing advertisements for tenders in newspapers, selecting contractors, and financing and overseeing construction. Local governments submit multi-year development plans (called MTDP) as well as annual budgets and progress reports to the National Development Planning Commission. District Planning Coordinating Units plan local development. Each district’s DCD – the top bureaucrat – chairs this unit, and the planning officer serves as the secretary.
The Public Procurement Act of 2003 (Act 663) and the Public Procurement (Amendment) Act of 2016 (Act 914) guide the procurement of goods and services. Local governments can authorize contracts up to 550,000 GHS. They advertise available contracts in national newspapers, and receive sealed bids from private companies, which the District Tender Committee evaluates. The mayor chairs this committee, while the director of finance, the local MP, the relevant head of the sectoral department (e.g. the district’s head of education), and an appointed lawyer serve as members; the DCD is the secretary. Once contractors have been selected, the District Planning Coordinating Unit and the District Monitoring Team oversee projects. The monitoring team is comprised of the DCD, planning officer, internal auditor, finance/budget officer, and a member of the user agency, for example, from the district health or education departments. I discuss the public procurement process in more detail in Chapter 5.
3.2 The Actors: Politicians, Bureaucrats, and Voters
3.2.1 Politicians
In addition to the president, there are three major groups of politicians – elected MPs, non-elected mayors, and elected and non-elected local councilors.Footnote 13 In this book, I focus on non-elected mayors, who are legally responsible for “the day-to-day performance of the executive and administrative functions” of the local governmentFootnote 14 and are appointed by the president. While presidents nominate mayors, they must obtain support from two-thirds of the district’s local councilors.Footnote 15 Mayors are eligible to serve up to two four-year terms, but can be removed by the president or via a supermajority (two-thirds) vote of local councilors.Footnote 16 Because mayors are nominated by the president they all share their party affiliation.
The country’s constitution and the Local Government Act (1993) allocate significant formal power to mayors. Local governments operate through a committee system, and mayors chair what are arguably the two most important committees. The Executive Committee is the “fulcrum of administration,”Footnote 17 and is responsible for the overall performance of the local government. It works with local bureaucrats and other sub-committees to design and coordinate the implementation of the district development plan. The District Tender Committee awards contracts to private firms to provide public works and services, which gives mayors significant control and the potential ability to capture public funds to engage in non-programmatic distribution.
The theory I present in Chapter 2 partly focuses on how electoral pressures shape politicians’ behavior. While mayors are not elected, they face significant electoral pressures since they automatically lose their position if the incumbent president is not re-elected. Thus, mayors can be seen as proxy candidates for the president in their district. However, the re-election of the president does not guarantee mayors’ reappointment: they must prove that their reappointment benefits the party by working hard to sustain or increase the party’s vote share in the district. Mayors also face accountability pressures since local councilors can remove them at any time through a vote of no confidence.
My theory also discusses how pressures on politicians to obtain public resources to fund election campaigns influence their interactions with the state. The first set of campaign funds that mayors are concerned with is the party’s fund within the district to support the campaign of the incumbent president. Such funds are spent within the district to support a range of activities such as house-to-house canvassing and distributing private goods to voters. If the incumbent party’s presidential candidate visits a district, the mayor and local party organization also foot much of the bill (e.g. paying party workers to mobilize supporters to attend rallies, providing refreshments public events).
The second type of campaign funds mayors are concerned with, are funds to support their political advancement. Mayors often seek to advance their careers by running for parliament. MPs enjoy higher status and pay, and have more secure positions because they are not term limited and cannot be removed during their term. Both major parties hold internal party primaries to select MP candidates. Roughly one-third of mayors run in these primaries. In the 2012 election, 52 of 170 (31%) sitting mayors contested for the party’s parliamentary seat.Footnote 18 Similarly, 30 percent of mayors ran in the 2016 primary elections.
Election campaigns in Ghana are expensive, especially relative to the salaries of both ordinary people and politicians. No public funding is available for parties. Estimates from the Ghana Center for Democratic Development suggest that in the most recent election in 2024 presidential candidates needed as much as USD 150 million to fund their campaigns.Footnote 19 Most parliamentary candidates self-fund their campaigns, although those from the incumbent party receive some party funds. Candidates in parliamentary races report spending money on campaigns in four main areas: (i) rallies and public meetings (30–35% of spending) to allow candidates to personally interact with large numbers of voters; (ii) posters, billboards, and media advertisements (25%); (iii) transportation for the candidate and party workers (25–30%); and (iv) and allowances to party workers, who play a key role in mobilizing citizens to attend rallies (10–15%).Footnote 20 In summary, about three-quarters of campaign expenses relate to physically mobilizing voters via face-to-face meetings. They also engage in extensive house-to-house canvassing. Party representatives visit approximately a third of Ghanaians in their homes.Footnote 21 Surveys of candidates indicate that they hide expenses related to providing private benefits to voters since it is illegal to supply gifts for the purpose of influencing vote choice.Footnote 22 However, roughly 13 percent of citizens (self)-report receiving gifts during campaigns.Footnote 23
Campaign costs for MP primaries and elections have risen substantially over time, potentially due to increased intra- and inter-party competition. Spending on parliamentary primaries has risen from an estimated 15,000 GHS in 2000 to 120,000 GHC ($30,000) in 2016.Footnote 24 Lindberg (Reference Lindberg2003) estimates that parliamentary candidates spent an average of $40,000 on their campaigns in 2004, and $75,000 in 2008.Footnote 25 Women parliamentary candidates reported spending between $38,000 and $100,000 on primary campaigns ahead of the 2016 election.Footnote 26 The annual salary of an MP was approximately $24,000 (post-tax and deductions) in 2010,Footnote 27 increasing to approximately $33,600 in 2016 and $49,000 in 2018.Footnote 28
The high costs of campaigning (particularly for those who run for parliament) have implications for local government operations. Mayors have incentives to fundraise for the incumbent party in order to remain in office, which may involve capturing public resources.
During the election in 2020, parliamentary candidates for the NDC and NPP paid $5,000–9,000 in registration fees to stand in their respective primary races. In competitive constituencies, candidates can spend more on the primary race than the parliamentary election, given that the party’s nominee is virtually guaranteed to be elected. Contested parliamentary primaries are more likely the electorally safer the parliamentary seat.Footnote 29 Multiple candidates (average of two) contested 60 percent of the primaries in 2004 and 2008;Footnote 30 in 2016, the average number of candidates rose to 3.5 per race for the NDC and 2.9 for the NPP.Footnote 31
3.2.2 Bureaucrats
Ghana’s public sector employs nearly half a million individuals, roughly 80 percent of whom are “client-facing” bureaucrats who work in health and education (e.g. doctors, nurses, and teachers). The Constitution of 1992 established fourteen separate services within the public sector. The Local Government Service (LGS) was added in 2003. There are currently 35 ministries and 260 local governments
I focus on bureaucrats who work in local governments – specifically, high-ranking bureaucrats who design and implement policies. In 2016, about 38,000 bureaucrats worked across the 216 local governments and ten Regional Coordinating Councils; this number has likely risen since then.Footnote 32 The top bureaucrat in each district is the DCD. The DCD is assisted by 15–20 core bureaucrats, who each have their own teams of assistants. The core positions are the district finance officer, planning officer, budget officer, district engineer, procurement officer, and welfare officer. Other important bureaucrats are the heads of the devolved ministries, such as the Ministry of Education and Ministry of Health. Thus, each district has a head of education and a head of health. Because many of the projects that local governments commission are in these two sectors, both of these bureaucrats regularly interact with those who work directly for the local government.Footnote 33
All permanent bureaucrats are hired centrally by the LGS in the capital city. Official Scheme of Service documents outline the minimum qualifications for each position. For example, DCDs serve in the administrative class; applicants must have a master’s degree and a minimum of twelve years of work experience in a local government or comparable public service institution.
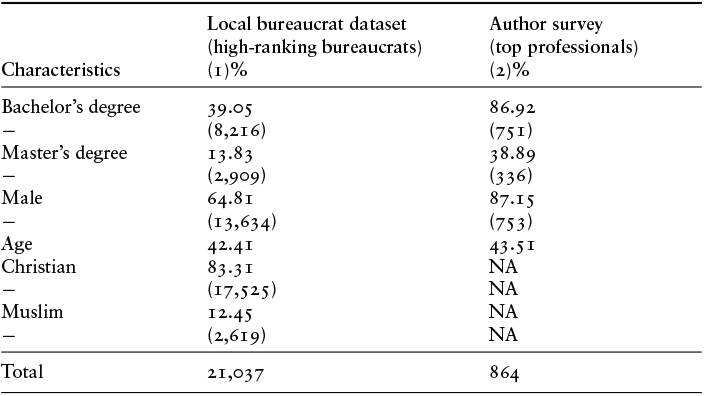
Local government positions can be divided into high-ranking (professional) positions – budget analysts, planning officers, etc. – and low-ranking (menial) jobs – drivers, security guards, etc. Column 1 of Table 3.1 presents the descriptive statistics for all high-ranking positions, drawing on a dataset of local bureaucrats. Column 2 uses alternative data I collected in a survey of the very top bureaucrats (DCDs and directors and heads of department) in eighty districts.Footnote 34 Most local bureaucrats (65%) in high-ranking positions are men (column 1). Gender imbalances become starker when restricted to the very top professionals, of which 87 percent are men (column 2). Roughly 40 percent of high-ranking bureaucrats hold a bachelor’s degree (column 1), and 87 percent of those in top positions (column 2). The average age of bureaucrats is about 43. In keeping with Ghana’s general demographics, the majority of bureaucrats are Christians (83%), while a significant minority (12%) are Muslim.Footnote 35
| Characteristics | Local bureaucrat dataset (high-ranking bureaucrats) (1)% | Author survey (top professionals) (2)% |
|---|---|---|
| Bachelor’s degree | 39.05 | 86.92 |
 | (8,216) | (751) |
| Master’s degree | 13.83 | 38.89 |
 | (2,909) | (336) |
| Male | 64.81 | 87.15 |
 | (13,634) | (753) |
| Age | 42.41 | 43.51 |
| Christian | 83.31 | NA |
 | (17,525) | NA |
| Muslim | 12.45 | NA |
 | (2,619) | NA |
| Total | 21,037 | 864 |
Note: The number of bureaucrats is presented inside parentheses.
All local government salaries are above the country’s median income. The DCDs receive around $15,000 per year, and planning and finance officers around $10,000. Telephonists, drivers, and revenue collectors earn approximately $2,500 per year.Footnote 36 Ghana’s GDP per capita was $2,406 in 2024.Footnote 37
3.2.3 Voters
Understanding voters’ expectations and preferences related to distributive strategies that politicians can pursue is important for my theory. Many voters clearly support politicians who engage in non-programmatic distribution, including dispensing private benefits and targeted local public goods. However, Ghanaian voters have also been shown to evaluate governments and individual politicians according to their ability or potential to engage in programmatic distribution, especially as this relates to securing a stable and growing economy. The fact that voters expect both programmatic and non-programmatic goods bolsters the argument that politicians will likely prefer high levels of both bureaucratic competence and loyalty. In Section 3.2, I present an overview of the relevant political behavior literature and discuss heterogeneity among voters’ preferences.
MPs in Ghana do not face term limits, yet routinely lose their seats: between 2000 and 2012, the average turnover rates for incumbent MPs who sought re-election was 24 percent.Footnote 38 This figure shows that Ghanaians use their votes to reward or punish politicians. A fifth of voters were considered swing voters in the elections of 2005.Footnote 39 Roughly half of Ghanaians surveyed in 2008 reported having voted for different parties or being open to switching parties.Footnote 40 It is also relatively common for voters to “split their ticket” – that is vote for different parties in presidential and parliamentary races.
What do voters expect from politicians, and how do they decide who to vote for? Much of the literature on elections in low- and middle-income democracies focuses on politicians’ use of non-programmatic distribution – particularly the distribution of private benefits (e.g. cash, jobs, loans, and fertilizer). There is no doubt that politicians distribute private goods to voters in Ghana, and that many voters value and expect such goods.Footnote 41
A representative survey of residents in the Greater Accra region, asked voters to list up to three issues that they most wanted the government to address. Over half of respondents (53%) included a demand for a private good; personal employment, scholarships, financial assistance for school fees, and business loans were the most frequently requested.Footnote 42 According to Afrobarometer data, about 12 percent of Ghanaians were offered a handout during the 2004 elections. A post-election survey of about 6,000 voters in 2012 similarly found that roughly 13 percent of voters were offered a gift.Footnote 43 Another study finds that when candidates increase the supply of clientelistic offers, voters are more likely to be persuadable.Footnote 44 However, it would be too simplistic to suggest that electoral swings in Ghanaian elections are the product of variation in which candidates distribute the most private goods. With a secret ballot, voters may simply take private goods from political candidates and vote based on other criteria.
Systematic evidence suggests that in addition to private goods, voters expect politicians and governments to provide local club goods – especially in underserved communities. Nearly two-thirds (64%) of residents of Greater Accra surveyed in 2013 included a local public good in their list of priorities. A comparable survey found that such demands were even higher in rural areas: 75 percent of rural respondents demanded at least one club good.Footnote 45 There is also systematic evidence that voters reward politicians who improve local public infrastructure. One study uses fine-grained data on the provision of roads and schools to estimate linear first-difference models to assess whether changes in the number and quality of this infrastructure influences electoral support for the governing party.Footnote 46 The results indicate that new schools and improved road conditions are associated with significant increases in the vote share of the president’s party.Footnote 47 There is also evidence that politicians internalize these demands. Where elections are cleaner, politicians have been found to invest in providing more local public goods to constituents.Footnote 48
At the same time, there is evidence that voters support programmatic distribution and the provision of universalistic goods. Again, survey evidence from voters in Greater Accra demonstrates that over half of respondents (55%) mentioned one universalistic policy in their list of priorities; more than a third (35%) listed two.Footnote 49 Particularly common were mentions of support for national-level economic issues, national education policies, and support for anticorruption efforts. Multiple studies have also found evidence of economic voting.Footnote 50
A salient universal policy was the NPP’s campaign for (and eventual adoption of) free senior high school in 2017. This was one of the party’s flagship policies and is estimated to have cost about $100 million in the first year of implementation.Footnote 51 Evidence that voters rewarded this policy comes from survey results which show that households that benefited from the program were significantly more likely to vote for the NPP.Footnote 52
In summary, prior work indicates that Ghanaian voters expect private goods but also demand local public goods and universal policies. There is evidence of variation across voters. Middle-class voters are more likely to demand universal goods, and rural voters are more likely to prefer local public goods than their urban counterparts.Footnote 53 These diverse preferences illustrate that local and national politicians must engage in multiple forms of distribution. The evidence presented here supports the idea that electoral pressures push politicians to prioritize both bureaucratic loyalty and bureaucratic competence. In Section 3.3, I offer evidence that bureaucrats are increasingly selected based on merit.
3.3 Recruitment of Bureaucrats into Local Governments
To assess the theory I present in Chapter 2, I focus on the performance of sub-national units (local governments) for multiple substantive and methodological reasons. Substantively, local governments are important institutions because their mandate to deliver development has the potential to improve the livelihoods of ordinary Ghanaians. Relatedly, most citizens are much more likely to interact with local politicians and bureaucrats than those in the central government, which again highlights their relevance. For example, Afrobarometer data shows that Ghanaians are nearly twice as likely to have recently contacted their local councilor as they are to have reached out to their MP.Footnote 54
Methodologically, studying sub-national units has the advantage of allowing me to measure the impact of theoretically important variables, such as electoral competition, on governance. Studying sub-national units within Ghana brings additional advantages because the political system holds constant alternative potentially relevant variables across units. The appointment process ensures that the political leaders of local governments (mayors) are all members of the ruling party. In addition, all top-ranked local bureaucrats are recruited through the same national recruitment process, as opposed to being directly recruited by local governments.
The 1992 Constitution re-established the Public Services Commission as the main institution in charge of recruitment. It has the authority to supervise and regulate entrance and promotion exams, and to establish standards and guidelines on the terms and conditions of employment.Footnote 55
Patronage in recruitment involves supplying a public sector job in return for political support. Meritocratic recruitment is a system in which “individual merits – such as education, knowledge, skills and job-related experience  constitute the main grounds for hiring to bureaucratic positions.”Footnote 56 Measuring the extent to which a political system supports meritocratic versus patronage hiring is challenging. Generally, scholars have adopted three methods: (i) expert surveys, (ii) bureaucrat surveys, and (iii) analysis of HR data. Analysis of data collected via each of these methods suggests that, like many low- and middle-income countries, public sector recruitment in Ghana is somewhere between completely meritocratic and completely captured by politicians and political parties.Footnote 57 The data suggests that political interference is most common in appointments to the very top public sector positions and for low-ranking positions. The bulk of bureaucrats who occupy mid- and high-level positions are recruited largely on merit.
3.3.1 Expert Perceptions of Meritocracy in Ghana’s Public Sector
Since expert surveys are generally inexpensive to conduct, it is relatively easy to build a dataset that covers a large number of countries.Footnote 58 However, experts are likely to use different benchmarks when making their assessments, which can limit the reliability of cross-national comparisons. There is also the worry that experts may not accurately perceive levels of meritocratic versus patronage recruitment. Experts working outside of the public sector are likely to base their opinions on media stories that flag politicized appointments, and may struggle to gain first-hand knowledge of how the typical bureaucrat is recruited. These concerns aside, expert surveys are helpful in understanding general public perceptions on the extent of meritocracy in any particular country.
Three different sets of expert surveys have evaluated levels of meritocracy in Ghana. One set of surveys was conducted by political scientist Petr Kopecky, while the other two surveys were conducted by the QoG Institute, based in Gothenburg (Sweden), and the African Institute for Development Policy, based in Lilongwe (Malawi) and Nairobi (Kenya), under their African Integrity Initiative.
Kopecky used interviews with academics, journalists, Non-Governmental Organizations (NGOs), and civil servants, to evaluate the level of meritocracy in Ghana’s bureaucracy.Footnote 59 Overall, his evaluation was based on responses from forty-five individuals. Specifically, this study asked respondents whether parties make appointments in various institutions and policy areas, and how deep politicized appointments reach (0 = less political interference, 1 = more political interference). Across sectors, he finds an average score of 0.40.
The QoG Institute also administers surveys with country experts, most of whom are university professors. The QoG Expert Survey 2015 produced 59 country-level indicators for 159 countries. In the 2015 release of the QoG dataset (Wave II), the number of experts per country ranged from 1 to 61, with a median of 6; 21 experts were surveyed for Ghana.
The QoG survey conclusions were similar to those reached by Kopecky: the data suggests that Ghana is neither a wholesale meritocracy nor that merit is a totally absent criteria in selecting bureaucrats. One question asked: When recruiting public sector employees, the skills and merits of the applicants decide who gets the job (1 = “hardly ever”; 7 = “almost always”). The aggregate score for Ghana was 4.1, compared to a global mean of 4.4 and a mean for sub-Saharan Africa of 3.6. For the question on the extent to which Public sector employees are hired via a formal examination system, experts rated Ghana 4.2 compared to a global mean of 4.4 and a continental average of 3.9.
Expert assessments often treat the public sector as a single unit, so it is unclear which jobs are prone to political interference and which rely on meritocratic criteria. Yet bureaucrats are recruited into a number of different agencies and departments – and into top-tier, mid-level, and low-level positions – and interference may vary accordingly.
The African Integrity Indicators (AII) compiled by the African Institute for Development Policy also uses experts to assess various aspects of the public sector across countries.Footnote 60 Their dataset includes comments that summarize details provided by interviewees. These comments permit further investigation into the types of jobs that parties use as patronage. Their data suggests that in Ghana, political connections are relevant for the very top public sector positions, but less so for other jobs. Comments collected during the 2020 round stated that:
In practice, civil servants are employed through a rigorous process that starts with the advertisement of vacancies, usually placed in state media outlets like the Daily Graphic and Ghanaian Times for five days. Depending on the nature of the job, applicants may sit for examinations or attend interviews, or go through a mix of the two. After the interview, successful applicants are usually those who come out on top among the candidates. (Comments provided in the AII dataset from African Integrity Indicators (2014–2020).)
A similar conclusion was reached the year later (2021):
In practice, the appointment of civil servants follows different formats depending on whether the position to be occupied is high level or not. In the case of junior civil servants, the engagement process starts with the publication of vacancy adverts in the media. The Public Service Commission, which oversees the Civil Service, also has introduced an online application for the service. Applicants are then either interviewed or made to sit for examinations. Those who come out on top gain employment. This system is quite meritorious. However, in the case of heads of institutions, their appointments follow a process in which the president swears them in. In the case of senior civil servants, their appointments can be determined by politics. (Comments provided in the AII dataset from African Integrity Indicators (2014–2020).)
The main concern flagged by the experts AII interviewed is that heads of state departments and agencies are political, and sometimes these individuals do not have sufficient (or any) experience working in the public sector. Overall, expert opinions from the AII initiative suggest a nuanced picture regarding levels of patronage versus meritocracy. To further explore these nuances, it is useful to survey bureaucrats.
3.3.2 Bureaucratic Survey Data on Meritocracy in Ghana’s Public Sector
Surveying bureaucrats is another popular method of assessing recruitment processes. Surveys can provide more objective information than surveys based on experts opinions. Surveys with bureaucrats also allow for more detailed interrogations into particular topics. For example, questions can include whether a public servant took an exam to enter the civil service, and whether they think promotions are free of political interference.Footnote 61 Negatively, compared to expert surveys with smaller samples, it can be costly to contact large numbers of civil servants. Consequently, studies based on bureaucrat surveys often present data from only one or two countries.Footnote 62 In Section 3.3, I review data from two surveys of bureaucrats in Ghana. The first survey was conducted by political scientist Rachel Sigman, while the latter survey was conducted by myself as part of this project.
Sigman surveyed 514 public servants enrolled in night or weekend training programs who work in a variety of departments and agencies across Ghana.Footnote 63 While she did not randomly select respondents, her data is perhaps more objective than the potentially inaccurate or biased opinions of experts. The sample is composed of bureaucrats who work in ministries (44.79%), semi-autonomous agencies (23.97%), regional or local governments (20.43%), and other positions (10.81%).
She asked civil servants whether they were hired (i) through a family member or friend, (ii) through their involvement in a political party, or (iii) through a competitive exam or interview process.Footnote 64 Fewer than 1 percent of respondents said political affiliation was important for their recruitment.Footnote 65 The vast majority of respondents (88%) said they were recruited via an exam or interview. Another indication that most bureaucrats are not recruited because of their partisan ties is a question about party activism. She finds that only 7% of bureaucrats campaigned for a candidate or party in the last election; in Benin, over 50% of bureaucrats did so.Footnote 66
Similar to Sigman, for this study, I surveyed 864 high-ranking bureaucrats who work across a random selection of 80 local governments.Footnote 67 I asked bureaucrats which, if any, competitive processes they took part in when they were first recruited into the public sector. Table 3.2 displays the share of local bureaucrats who were recruited via exams and competitive interviews in each decade. Exams were a common recruitment tool in the 1970s: nearly half (47%) of bureaucrats were recruited in this way.Footnote 68 Exams then became less popular; roughly one-third of civil servants were recruited via exams between 1980 and 2010. However, 67 percent of bureaucrats hired between 2010 and 2016 were recruited following an exam administered by the Public Service Commission.
| N | Exam (%) | Interview (%) | |
|---|---|---|---|
| 1970s | 34 | 47.1 | 41.2 |
| 1980s | 130 | 26.9 | 57.7 |
| 1990s | 212 | 36.6 | 80.2 |
| 2000s | 257 | 28.4 | 89.5 |
| 2010s | 231 | 66.7 | 94.4 |
Note: The date of the last bureaucrat hired in this data is 2016.
There has also been a gradual increase in the share of civil servants recruited via interviews, from 41% in the 1970s to 94% in the 2010s. The figures in Table 3.2 suggest that since 2010 it has become routine for civil servants to take an exam and be interviewed before they are hired. In general, this data supports the idea that most rank-and-file bureaucrats are recruited via competitive procedures.
3.3.3 Bureaucrat Hiring Data on Meritocracy in Ghana’s Public Sector
A final way to probe levels of meritocracy is to use HR data to analyze variation in hiring patterns over time. There are three benefits to such data. First, unlike bureaucrat surveys – especially those conducted using snowball samples – they provide a more representative picture of the bureaucracy; indeed, HR data should encompass the universe (or near universe) of bureaucrats. Second, it avoids concerns of survey response bias in surveys.Footnote 69 Third, and related, HR data can provide objective information on certain variables, for example, the selection methods used during recruitment (i.e. exams or interviews), which bureaucrats may forget over time.
I use HR data on bureaucrats who work in local governments to assess levels of meritocracy. This data constitutes a (near) complete listing of every bureaucrat who worked in a local government in 2015. These data were compiled as part of a European Union-funded project focused on local government staffing and capacity building. It includes information on the year each bureaucrat was recruited into the public sector and their qualifications. I restrict the data to analyze the educational backgrounds of bureaucrats who occupy high-ranking positions: those who are responsible for implementing public policy.
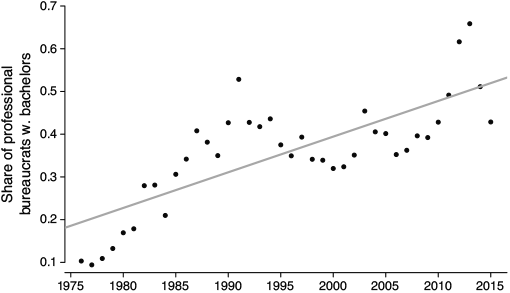
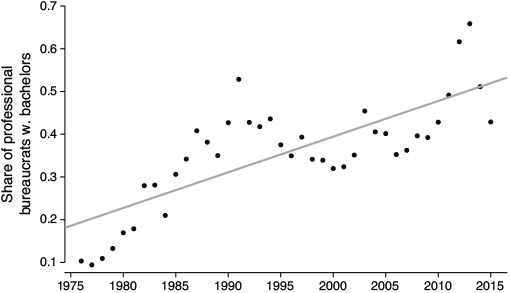
Figure 3.1 indicates that the share of local bureaucrats recruited each year who hold a bachelor’s or master’s degree increased nearly every year between 1975 and 2013 – from about 8% in 1975 to 63% in 2013. While it may be the case that politicians interfere with the process of recruiting well-educated partisans, this is less concerning than hiring based purely on partisan criteria with no regard for education.
Share of highly ranked, local bureaucrats hired in each year with tertiary education
Using these data, I adopt an alternative approach to assess meritocratic recruitment. I leverage a change in the ruling party following the December 2008 elections to investigate hiring patterns before and after this alternation. If an individual’s party affiliation influences the likelihood of their being hired, we should observe that different governing parties hire bureaucrats with different characteristics, as Ghana’s two major parties are aligned with different ethnic and regional groups.
The HR data includes the name and home region of each bureaucrat; I use these two pieces of information as proxies for bureaucrats’ likely partisanship. I use hiring in the term following the December 2004 election (2005–2008) as the baseline for comparison with hiring patterns after the December 2008 election. After this election, power switched hands from the incumbent NPP to the opposition NDC. My study sample consists of all local bureaucrats hired during these two terms ( 17,942).Footnote 70
I use bureaucrats’ ethnicity as the first proxy for partisanship. As ethnicity is not explicitly stated in the dataset, I adopt two approaches, both based on names, to attempt to accurately code each person’s ethnic group. The first approach uses informed, local research assistants (RAs). These RAs coded individuals into one of seven ethnic groupings.Footnote 71 The second approach is algorithmic. Specifically, the algorithm uses data from two sources: (i) Ghana’s complete voter register from 2015 and (ii) tract-level census data from 2010. The census data contains the ethnic breakdown of individuals within each census tract. Because Ghanaian voters are registered to vote at a particular polling station, once polling stations are geo-located within census tracts, it becomes possible to link name fragments to particular ethnic groups.Footnote 72 It should be noted that not all names are ethnically distinct. When names are not distinct, they are dropped from the analysis.Footnote 73
After matching bureaucrats’ names to ethnic groupings, I use Afrobarometer survey data to link ethnic groups to political parties.Footnote 74 Based on these data, I code bureaucrats who are Akans as pro-NPP, and those from the Ewe and Northern ethnic groups as being aligned with the NDC.Footnote 75
An alternative proxy for bureaucrats’ partisanship is their home region. I define party strongholds as regions in which the majority of citizens voted for the same party in both the elections I analyze (2004 and 2008). Accordingly, I code pro-NDC bureaucrats as those from the Northern, Volta, Upper West, or Upper East regions, and pro-NPP bureaucrats as those from either the Ashanti or Eastern regions.
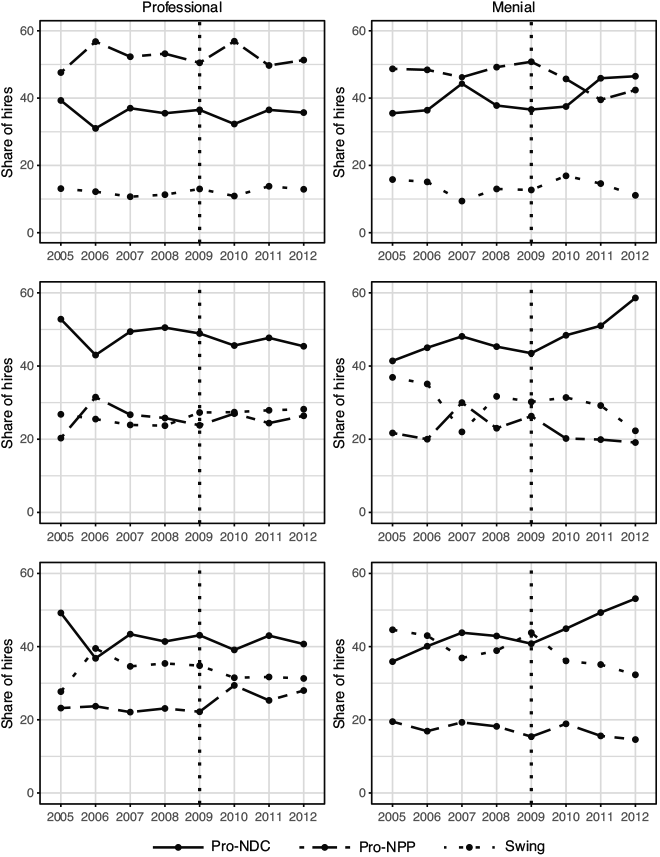
Figure 3.2 categorizes bureaucrats’ partisanship as pro-NDC, pro-NPP, or swing based on either their ethnicity (using either RA coding or algorithmic coding) or home region. The swing category indicates bureaucrats who belong to one of the politically unaligned ethnic groups (Fante, Ga, Dangme, or Guan) or regions (Central, Accra, Western, or Brong Ahafo).Footnote 76 The plots on the left-hand side display trends for high-skilled positions, while the plots on the right-hand side display trends for low-skilled positions. The dotted lines indicate the change in the ruling party in December 2008.
Share of bureaucrat types across two electoral periods (2005–8 and 2009–12)
Note: In Figure 3.2 employees are categorized as pro-NDC, pro-NPP, or Swing. Each plot displays the share of new hires from each group. Bureaucrats are coded according to their ethnic group. The left plot displays trends for high-skilled positions, and the right plot displays trends for low-skilled positions. The dotted line corresponds to the election of the NDC in December 2008. The top plots are based on a manual coding of ethnicity, the middle plots the algorithmic coding, and the bottom plots the regional coding.
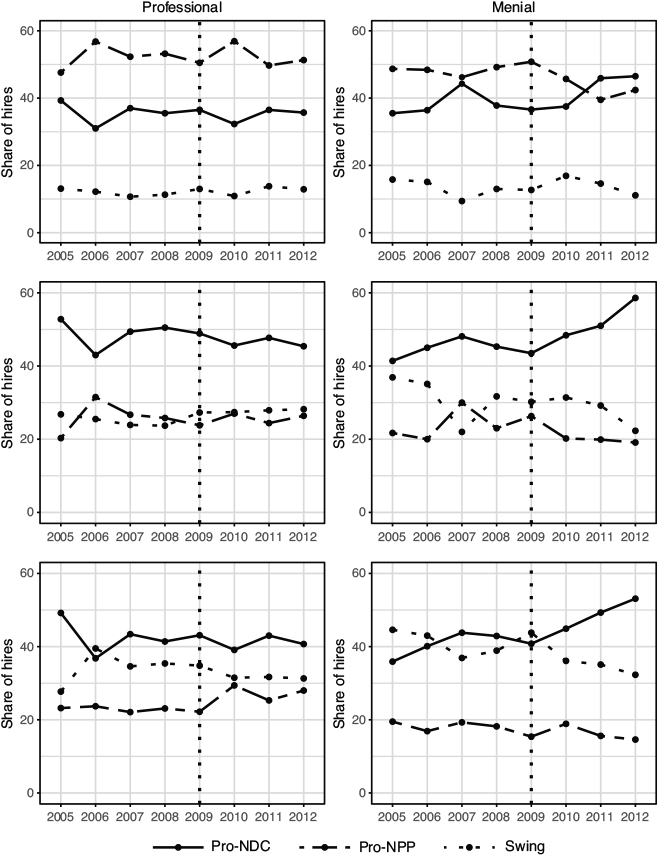
The plots on the left provide evidence that the characteristics of bureaucrats recruited to high-skilled, professional positions are fairly static across the two electoral periods. This stability is observed across each of the three ways I classified bureaucrats’ most likely partisanship. In other words, the change in governing party does not appear to alter hiring patterns for professional jobs, which suggests that professional bureaucrats were hired independent of their partisan affiliation, and points to competitive, meritocratic processes. In contrast, the right-hand plots in Figure 3.2 suggest that there was a steady increase in the share of NDC-aligned bureaucrats hired for low-skilled positions after the NDC government was elected in 2008. This suggests that menial jobs were not distributed according to merit, but rather that the new government used low-skilled bureaucratic positions to recruit politically loyal bureaucrats, potentially as patronage.
A series of logistic regression analyses adds further credibility to the results in Figure 3.2. In these models, the dependent variables are dummy variables that indicate bureaucrats’ partisan type. The two main explanatory variables are a dummy variable that distinguishes between the two hiring periods – the change in ruling party – and an indicator of whether the job is low-skilled. I also interact these two variables. A positive coefficient on the interaction term would indicate that the new ruling party distributed more low-skilled than high-skilled posts to their co-partisans. In these models, I hold constant gender, age, and highest level of education.
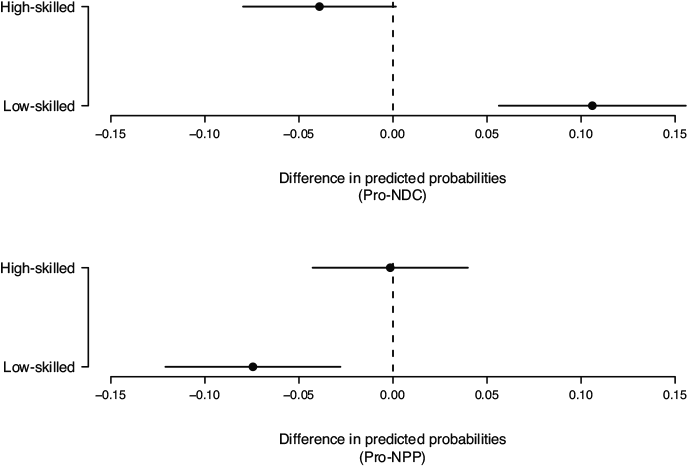
Figure 3.3 displays the substantive significance of the results.Footnote 77 I calculate the predicted probabilities of a pro-NDC bureaucrat being hired to (a) a high-skilled position and (b) a low-skilled position in the two time periods. This figure shows the difference in these predicted probabilities and the associated 95% confidence intervals. It demonstrates that the change in government is not associated with a change in the likelihood of pro-NDC workers being hired for high-skilled positions. In other words, if anything, the evidence suggests they were less likely to be hired into such positions.
Difference in the predicted probability of a pro-NDC and pro-NPP bureaucrat being hired in each term (2005–8 and 2009–12)
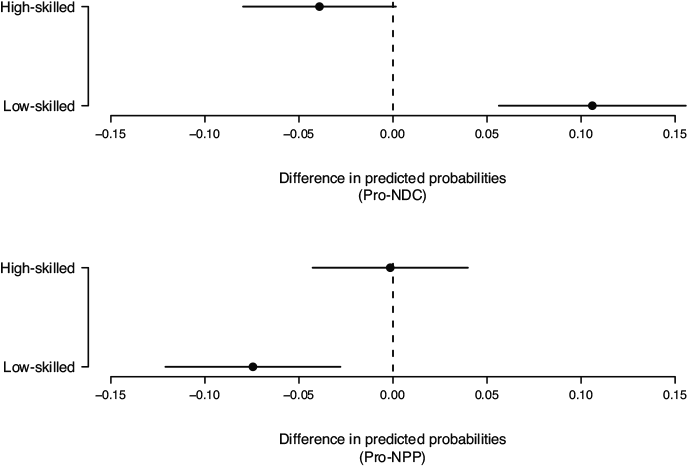
In contrast, pro-NDC bureaucrats were 11 percentage points more likely to be hired for low-skilled positions after the NDC came to power at the end of 2008. Figure 3.3 suggests that when the NDC was in power, it was less likely to hire pro-NPP bureaucrats to low-skilled positions. The change in predicted probabilities is about 7 percentage points. The NDC government was neither more nor less likely to hire pro-NPP bureaucrats for high-skilled positions. In summary, the results suggest that the partisanship of bureaucrats did not influence who got hired for high-skilled positions, but did influence selection into low-skilled positions.
3.4 Conclusion
Chapter 3 provided an overview of key facts about Ghana’s political and electoral landscape, as well as a detailed description of the operation of local governments. I discuss the roles that mayors and local bureaucrats play within these local governments in delivering infrastructure projects to local communities. Section 3.3 of the chapter assesses the extent of meritocratic hiring in the public sector. Expert opinions, bureaucrat survey data, and HR data all provide evidence of high degrees of meritocracy for middle and high-ranked positions. Significantly, when surveyed, the vast majority of bureaucrats (over 95% of respondents) do not think that either their recruitment or the recruitment of their colleagues was influenced by individual partisan affiliation.Footnote 78 Data from experts suggests that partisanship may play a role in the hiring of the very top civil servants within national ministries.
It is important for discussions in later chapters to establish that the bulk of bureaucrats in highly ranked positions within local governments are not recruited due to their partisan alignment. Homing in on such bureaucrats, I find that the vast majority are hired after completing a competitive interview and examination process. My survey data of local bureaucrats in top positions indicate that while 27% of recruits in the 1980s took an exam, this increased to 67% hired in the 2010s. Interview rates similarly increased from 58% to 95% over the same period. Leveraging a change in ruling party in 2008, I demonstrate stability in the characteristics of bureaucrats in professional positions. This analysis further suggests that such bureaucrats are likely hired on the basis of merit and independent of partisan ties.
In Chapter 4, I show that, despite evidence of meritocratic recruitment, politicians’ ability to enact (or threaten to enact) tools of career control generates bureaucratic loyalty. Furthermore, I demonstrate that there are high levels of administrative interference and corruption across local governments. In Chapters 5 and 6, I further illustrate the negative consequences of politicians’ ability to interfere with bureaucrats’ careers in two areas: the awarding of public contracts to private firms and the geographic placement of local public goods within districts.

 Open access