


Introduction
Radio-echo sounding (RES) is a widely used tool in glaciology, which provides observational constraints on englacial and subglacial conditions (Bingham and Siegert, Reference Bingham and Siegert2007; Schroeder and others, Reference Schroeder2020). Through analysis of the amplitude and phase of echoes from englacial layers and the ice-bed interface, information about basal material properties and thermal state, ice crystal orientation and ice temperature can be extracted (Jezek and others, Reference Jezek, Clough, Bentley and Shabtaie1978; Murray and others, Reference Murray, Stuart, Fry, Gamble and Crabtree2000; Winebrenner and others, Reference Winebrenner, Smith, Catania, Conway and Raymond2003; Drews and others, Reference Drews2016; Tulaczyk and Foley, Reference Tulaczyk and Foley2020; Oraschewski and others, Reference Oraschewski, Ershadi and Drews2025). Long-offset, relative to ice thickness, radar surveys in glaciated regions are relatively rare, with most radar data being collected using zero- or small-offset arrays of antennas that are easily mounted on an aircraft or towed behind a snowmobile to rapidly image large areas (King and others, Reference King, Hindmarsh and Stokes2009; MacGregor and others, Reference MacGregor2021). However, this prevents the full use of powerful array-based multi-offset analysis methods developed in seismology from being applied to RES data (Peters and others, Reference Peters, Anandakrishnan, Alley and Smith2007; Shadlow, Reference Shadlow2014).
Multi-offset radar data have been previously collected in glaciated regions to estimate the dielectric permittivity of glacier ice by inferring the radio wave velocity (Jezek and others, Reference Jezek, Clough, Bentley and Shabtaie1978), which, in turn, can be used to infer englacial water content (Murray and others, Reference Murray, Stuart, Fry, Gamble and Crabtree2000) and near-surface density profiles (Drews and others, Reference Drews2016). Multi-offset radar surveys have also been used to estimate englacial attenuation rates, a proxy for englacial temperature (Winebrenner and others, Reference Winebrenner, Smith, Catania, Conway and Raymond2003; Holschuh and others, Reference Holschuh, Christianson, Anandakrishnan, Alley and Jacobel2016). Additionally, collecting radar data at large offsets in multiple polarizations could improve constraints on ice crystal orientation by overcoming the inherent ambiguities in monostatic measurements (Ershadi and others, Reference Ershadi2022; Rathmann and others, Reference Rathmann, Lilien, Grinsted, Gerber, Young and Dahl-Jensen2022). This ambiguity has significant implications within the context of ice sheet modeling as ice viscosity is highly dependent on crystal fabric orientation (Shoji and Langway, Reference Shoji, Langway, Langway, Oeschger and Dansgaard1985), but this effect is difficult to quantify in the absence of constraints on the vertical fabric component (Jordan and others, Reference Jordan, Martín, Brisbourne, Schroeder and Smith2022). While this limitation is well known within the glaciological community, the collection of multi-offset radar to directly address this concern is a recent development. Oraschewski and others (Reference Oraschewski, Ershadi and Drews2025) present polarimetric multi-offset data collected up to 200 m offset (0.77 ice thicknesses) on the Ekström Ice Shelf and develop an inversion framework to infer all components of ice fabric. This new phase-focused analysis of multi-offset radar data represents an exciting step forward in ice fabric studies.
As ice thickness increases, longer offsets, ideally up to four times the ice thickness, are needed to perform attenuation tomography or conduct amplitude-versus-offset (AVO) analysis of the bed (Bienert and others, Reference Bienert, Schroeder and Summers2023). This is to ensure that there is sufficient variation in the path lengths through the ice column to robustly infer attenuation rates from the drop in signal power with increasing ray path length in the ice. This is akin to monostatic methods that rely on variations in ice thickness over a domain to infer attenuation rates from reflection power versus ice thickness plots (Jacobel and others, Reference Jacobel, Lapo, Stamp, Youngblood, Welch and Bamber2010). Additionally, for AVO analysis, incident angles at the bed must be sufficiently large in range and magnitude to capture the polarization-dependent reflectivity of typical bed materials (Bienert and others, Reference Bienert, Schroeder and Summers2023). Similarly, application of multi-offset phase-analysis techniques, such as those proposed by Oraschewski and others (Reference Oraschewski, Ershadi and Drews2025), will also require larger offsets as ice thickness increases.
Long-offset radar surveys on thick ice often employ impulsive systems that trigger acquisition based on detection of the direct arrival between the transmitter and receiver (Lilien and others, Reference Lilien, Hills, Driscol, Jacobel and Christianson2020). Thus, the maximum offset between source and receiver is limited by the ability to detect this direct arrival, with previous studies with impulsive systems obtaining offsets up to ~1.3 km (Holschuh and others, Reference Holschuh, Christianson, Anandakrishnan, Alley and Jacobel2016). Simply incorporating more powerful amplifiers into these impulsive systems would extend maximum attainable offsets; however, this increases system weight, complexity and power demands. While weight is less of an issue for stationary long-offset measurements, increased complexity and power consumption would pose issues for long-term deployments. Additionally, removing the dependence on the air wave for synchronization would be critical for measurements without a direct line-of-sight between receiver and transmitter, such as in the case of borehole radar surveys (Murray and others, Reference Murray, Stuart, Fry, Gamble and Crabtree2000) or glaciers with significant surface topography.
An alternative to time alignment of repeat measurements by direct path detection is through a cabled connection between the receiver and transmitter; however, standard copper-based coaxial cables used in radio-frequency applications are too lossy to be practical at long offsets. For example, even commonly used low-loss coaxial cables will incur attenuation losses ranging from 19 to 177 dB km-1 at 220 MHz (Times Microwave Systems, 2023). As an alternative to in-the-field synchronization through direct path detection or cabled connection, Bienert and others (Reference Bienert, Schroeder, Peters, MacKie and Dawson2022) demonstrated passive synchronization for software-defined radios (SDRs) that passively record a chirped signal transmitted by an autonomous phase-sensitive radio-echo sounder (ApRES). In this setup, synchronization occurs post-acquisition through phase alignment of each chirp prior to stacking. Through simulations of radio wave propagation in ice, Bienert and others (Reference Bienert, Schroeder, Peters, MacKie and Dawson2022) also show that, unlike in the case of airborne RES, total internal reflection (TIR) at the ice-air interface is not a limiting factor for ground-based long-offset radar due to the presence of evanescent waves extending up to 6 $\lambda$ above the glacier surface. In contrast, airborne RES is constrained by the critical angle at the ice-air interface. As demonstrated by Holschuh and others (Reference Holschuh, Christianson and Anandakrishnan2014), steeply dipping englacial layers can fall beyond this refraction limit and therefore remain invisible to an airborne sounder. Since a ground-based antenna is coupled to the ice-surface and, thus, is within 6 $\lambda$ of the ice, total internal reflection occurs within the antenna near-field, allowing detection of the evanescent wave. This was demonstrated in the field using the SDR-based system on Store Glacier, Greenland, where bed reflections up to 1.45 km (1.4 ice thicknesses), just beyond the theoretical point of total internal reflection, were detected (Bienert and others, Reference Bienert, Schroeder, Peters, MacKie and Dawson2022). However, this system was designed for all data processing to occur post-acquisition, meaning that, in this configuration, the SDR must continuously record during deployment resulting in large data volumes. With such a post-processing implementation, data acquisition is limited by the write speeds of the SDR placing constraints on sampling rate and, thus, signal bandwidth and radar duty cycle.
To expand these capabilities, we collected long-offset radar measurements with a low-loss fiber optic link between a receive antenna and an ApRES. Using a fiber optic link circumvents the issue of signal attenuation associated with copper coaxial cables, while also allowing the strengths of the ApRES, such as its 100% duty cycle, 200 MHz bandwidth and low required sample rate (40 kHz), to be fully exploited. This requires the integration of hardware to allow for the conversion of radio-frequency signals to optical signals, and vice-versa (Paden and others, Reference Paden, Allen, Gogineni, Jezek, Dahl-Jensen and Larsen2005). Such radio frequency-over-fiber (RFoF) technology is readily used and available in the field of telecommunications and, thus, offers an accessible, off-the-shelf solution.
In order to demonstrate the implementation and potential of this approach, we present the results from polarimetric multi-offset radar surveys carried out with our RFoF-modified ApRES on Eastwind Glacier on Ross Island and the McMurdo Ice Shelf in Antarctica during the 2023–24 austral summer, highlighting the potential to perform radiometric analysis of reflection amplitudes using ApRES data to infer englacial and subglacial properties. We compare these data with co-located measurements collected with a cable-less SDR-based receiver adapted from Bienert and others (Reference Bienert, Schroeder, Peters, MacKie and Dawson2022) for validation and benchmarking. Finally, we demonstrate the ability to collect long-offset data, up to 4 km, on thick ice (~2.2. km) with field measurements taken across the eastern shear margin of Thwaites Glacier using the fiber optic-based approach.
Radar system modification and configurations
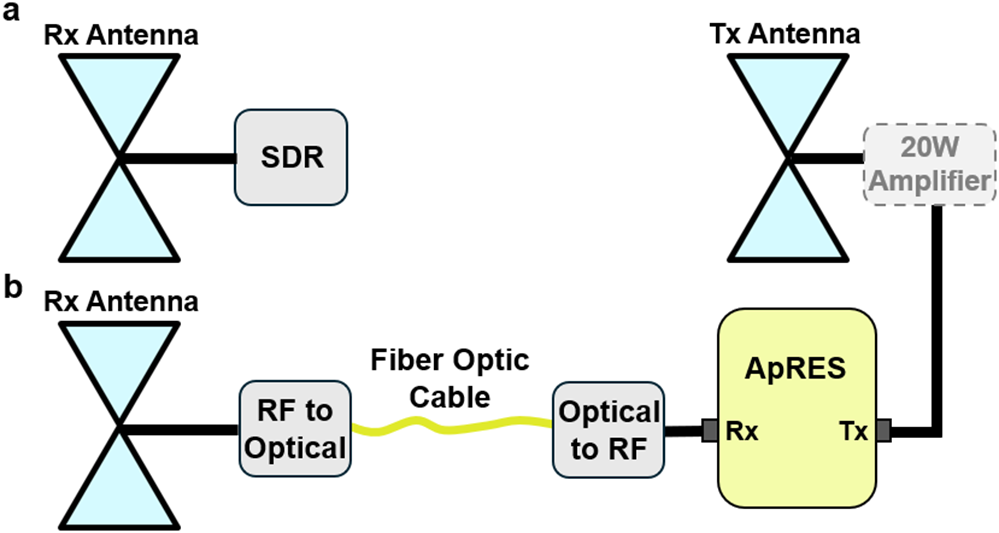
We deployed two radar systems, shown in Figure 1, to collect co-located polarimetric multi-offset common midpoint surveys. In both setups, the transmit and receive antennas used were cavity-backed bowtie antennas with aluminum reflectors, as described by Nicholls and others (Reference Nicholls, Corr, Stewart, Lok, Brennan and Vaughan2015). The first radar system consisted of an ApRES modified with off-the-shelf, active RFoF modules operating at 1550 nm with integrated low-noise amplifiers (RF Optic Programmable 2.5 GHz RF-over-Fiber Module) with a low-loss (0.18 dB km-1) single-mode fiber optic cable (Corning SMF-28 Ultra) in between. The ApRES operated at 100% duty cycle transmitting a 200 MHz chirp with a center frequency of 300 MHz.
a) Cable-less SDR-based receiver connected to a cavity-backed bowtie antenna continuously recording ApRES transmission without in-field synchronization. b) Fiber optic system using a 1 km fiber optic cable and off-the-shelf RFoF hardware to perform in-field synchronization. Receive antennas were co-located throughout the Eastwind Glacier and McMurdo Ice Shelf surveys and shared the same transmit hardware. A 20 W amplifier was placed on the transmit side, and a 4 km fiber optic link was used for the survey on Thwaites Glacier.

The ApRES system is a frequency-modulated continuous wave (FMCW) radar that mixes the received signal with a copy of the transmitted chirp, thereby producing a beat frequency proportional to the range of the reflector. Prior to digitization, the ApRES applies a beat frequency-dependent gain using an active bandpass filter (Lok and others, Reference Lok, Brennan, Ash and Nicholls2015). Since the beat frequency of a reflection depends on both the range to the target and the chirp slope, reflections from greater ranges, such as those at larger offsets, occur at higher beat frequencies due to longer travel paths through the ice and cables. If the approximate ice thickness is known, the chirp slope can be selected to ensure that bed reflections from all offsets fall within the band of maximum gain. In our surveys, the chirp bandwidth was held constant, so the chirp slope was controlled by varying the chirp duration: 0.55–0.75 s for surveys on Eastwind Glacier and the McMurdo Ice Shelf (thinner ice) and 3.8 s on Thwaites Glacier (thicker ice). Ice thicknesses used to select the chirp length at these locations were derived from zero-offset ApRES measurements.
In order to provide a baseline to which the fiber optic-equipped ApRES can be compared, we deployed a second radar system based on Bienert and others (Reference Bienert, Schroeder, Peters, MacKie and Dawson2022). This consisted of an Ettus USRP b205-mini SDR using the Open Radar Code Architecture (ORCA) (Teisberg and others, Reference Teisberg, Broome and Schroeder2024) and equipped with analog filters (310–340 MHz passband) serving as a receiver continuously recording the signal transmitted by the same ApRES described in the first system. The B205-mini SDR was configured to record from 320 to 340 MHz with a 45% duty cycle, and, thus, did not record the full 200 MHz chirp transmitted by the ApRES. While the ApRES can be configured to transmit between 320 to 340 MHz, we opted to transmit the full 200 MHz signal to prioritize using the fiber optic-based system to its fullest potential. However, a higher-end SDR could be used to accommodate the full 200 MHz chirp, thereby achieving similar results in terms of range resolution and signal-to-noise ratio (SNR).
Survey and site description
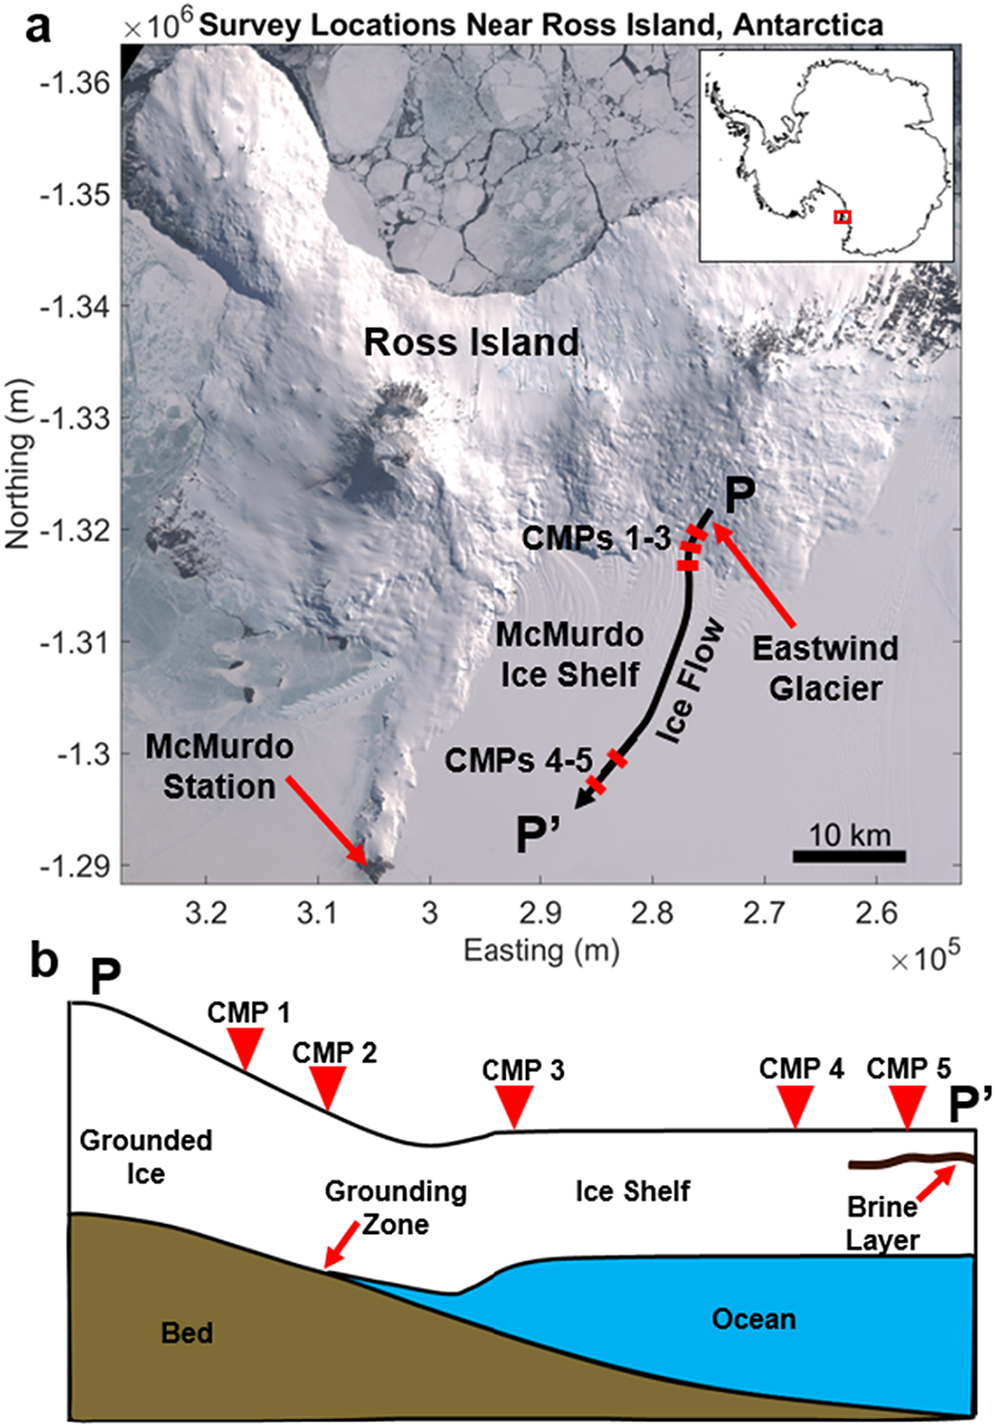
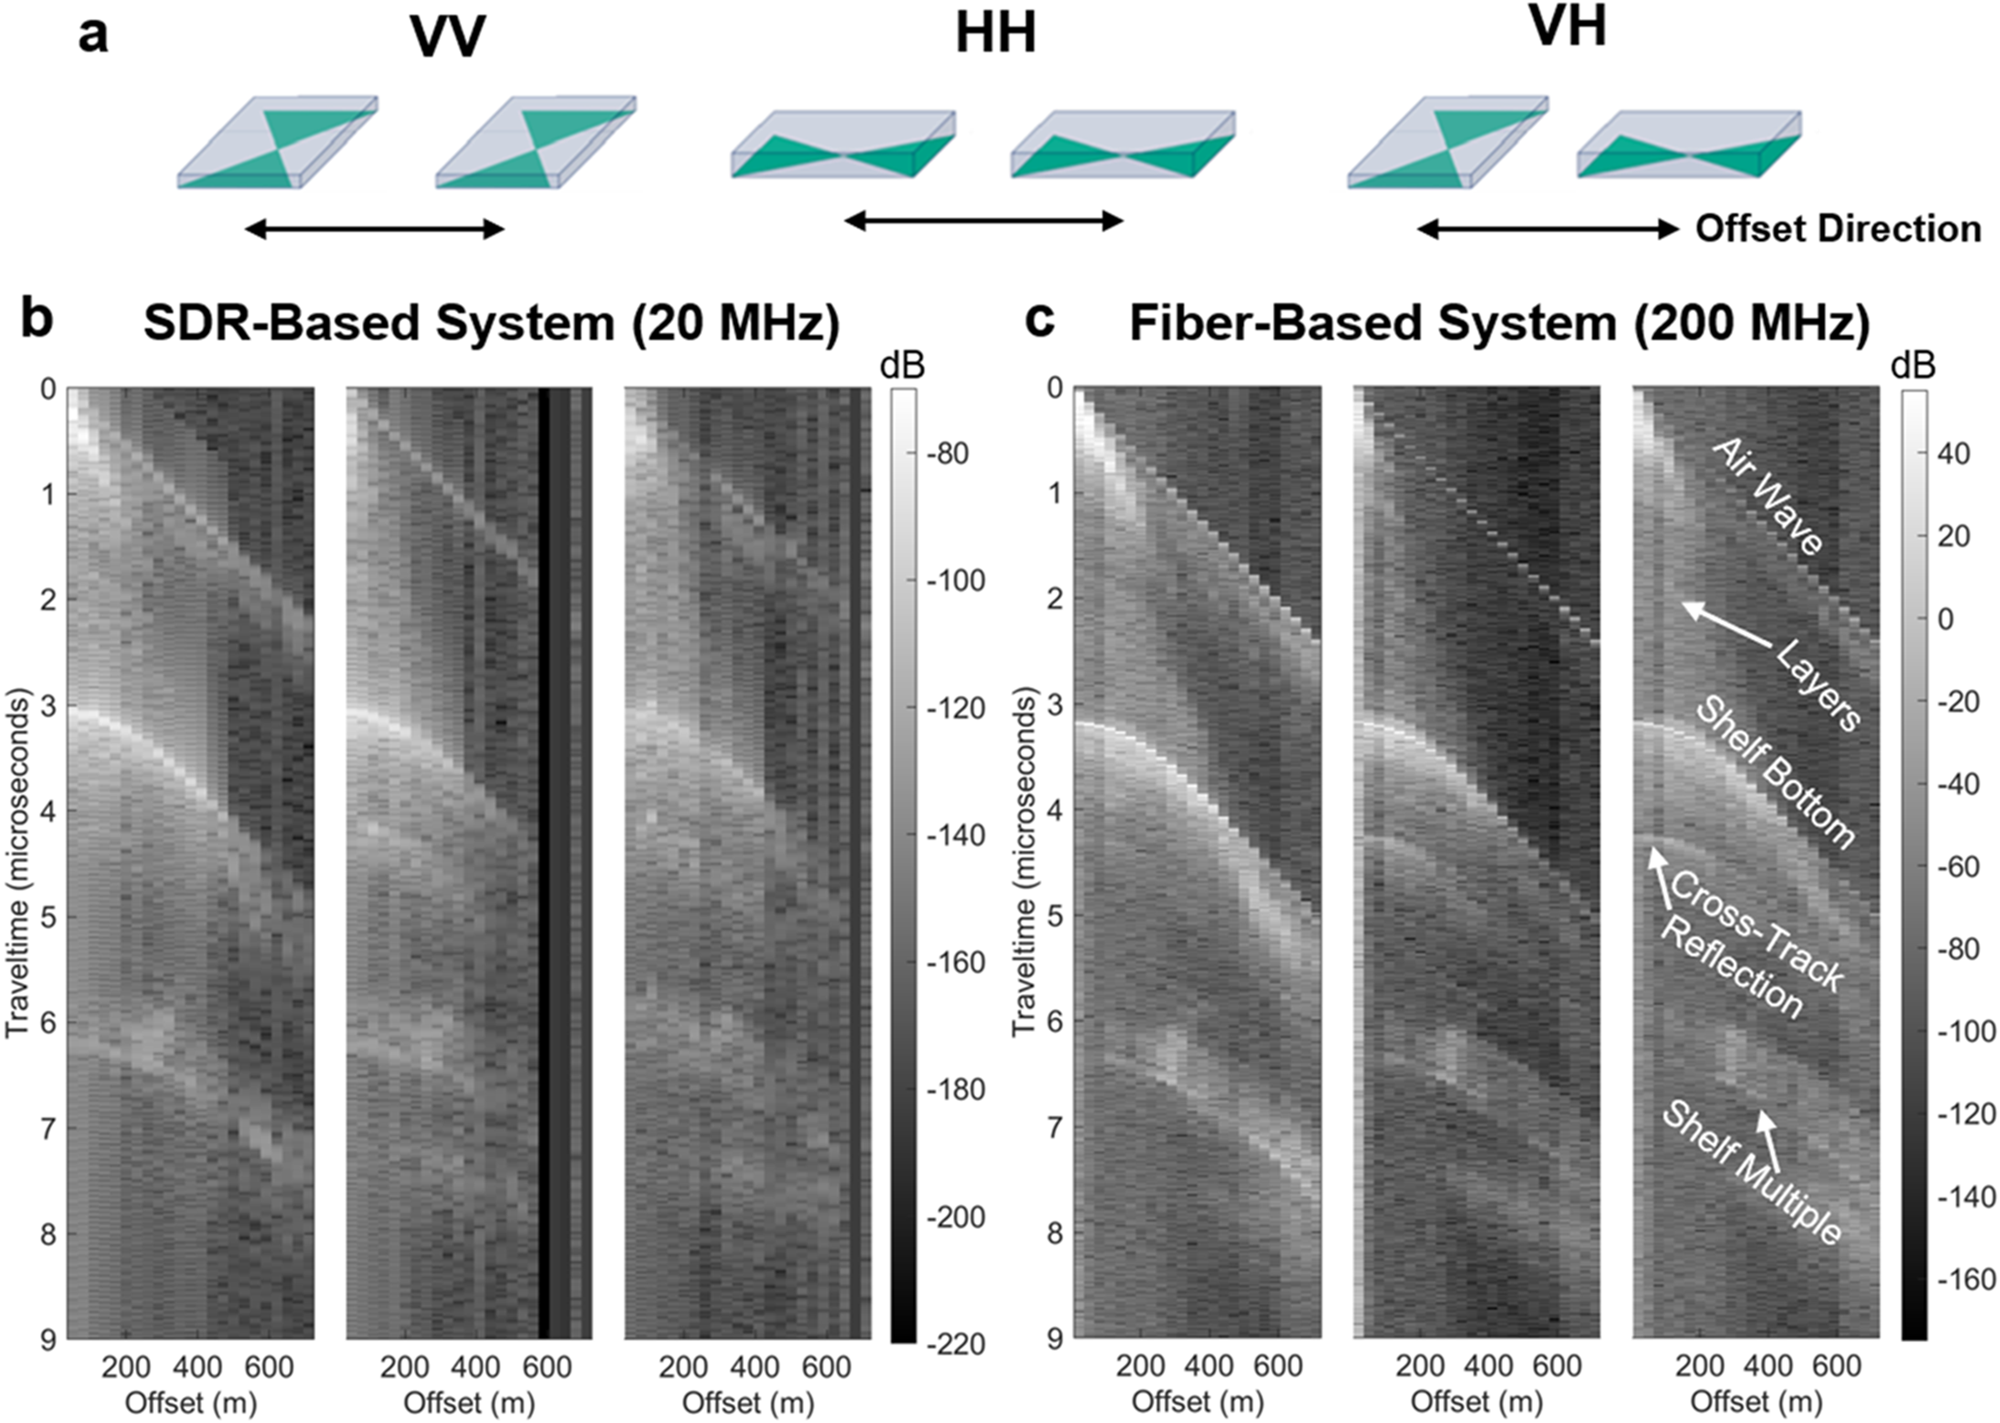
Eastwind Glacier is located on the southeastern side of Ross Island, where it flows into the McMurdo Ice Shelf. In total, 5 common-midpoint (CMP) surveys were collected on Eastwind Glacier and the McMurdo Ice Shelf, with each individual survey line oriented perpendicular to the direction of ice flow (Fig. 2). The CMPs were collected over grounded ice, the grounding zone and three locations on the ice shelf, one of which coincided with a shallow brine layer as described by Campbell and others (Reference Campbell, Courville, Sinclair and Wilner2017). Surveyed ice thicknesses, inferred from zero-offset measurements, range from 200 to 275 m across these sites, with the glacier thickening as it goes afloat and then gradually thinning along the flowline. CMPs 1 through 3, located on or near Eastwind Glacier, had maximum offsets of up to 710 m, limited by the extent of the area deemed to be crevasse-free. CMPs 4 and 5, located on the McMurdo Ice Shelf, had maximum offsets up to 1 km due to lower risk of encountering crevasses. Two co-polarized measurements, denoted VV and HH (Fig. 3a), and one cross-polarized measurement, denoted VH (Transmitter in V, Receiver in H), were collected at each point for all surveys except CMP 2, where only co-polarized measurements were taken due to time constraints.
a) Map of Ross Island showing the survey locations on Eastwind Glacier and the McMurdo Ice Shelf (as defined by Hill and others (Reference Hill, Schild, Campbell and Child2022)) relative to McMurdo Station (U.S. Geological Survey, 2023). All CMPs were collected perpendicular to ice flow (black arrow). b) Simple cross-section (not to scale) showing the subglacial target at each CMP location.

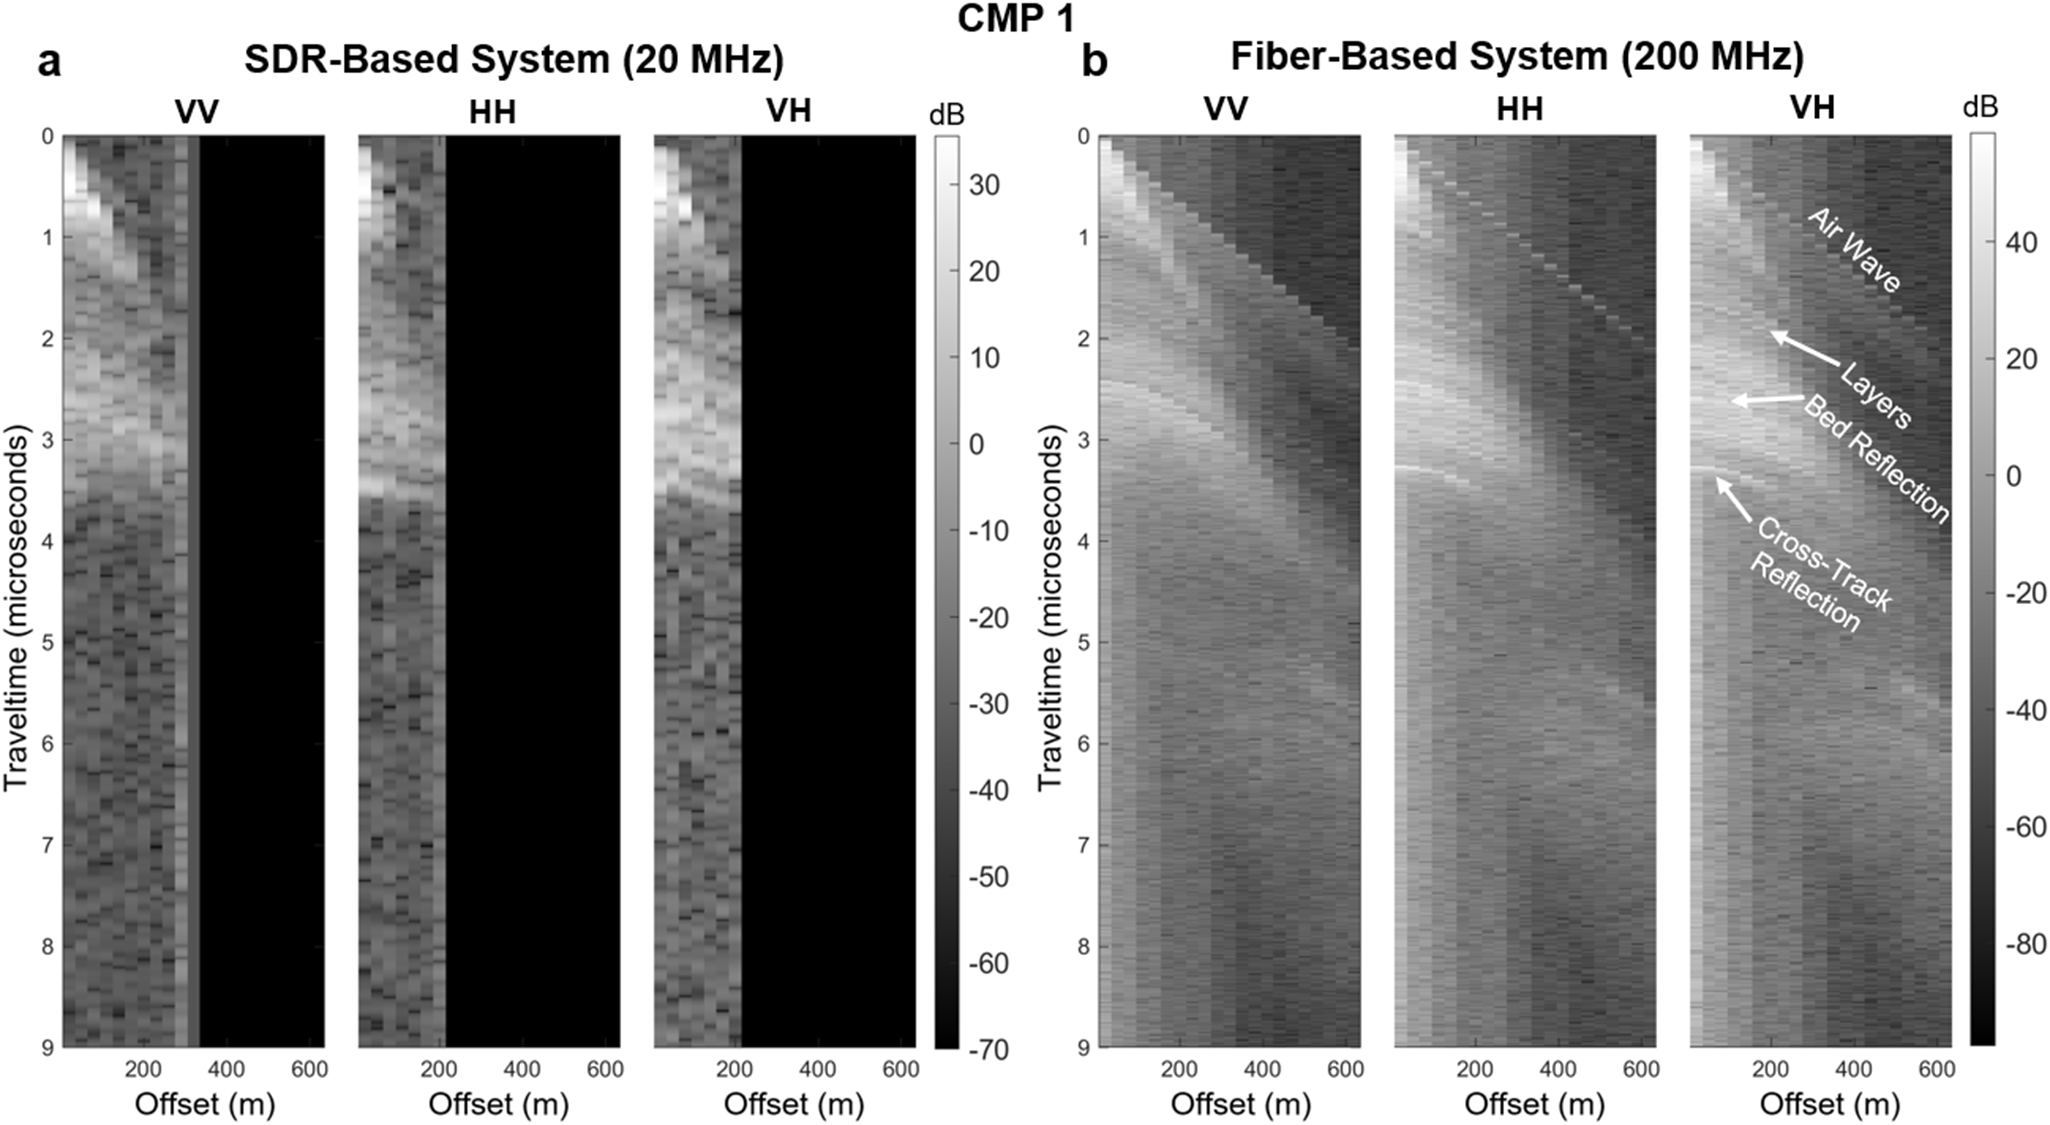
a) Antenna orientation naming convention. Data collected on the ice shelf near Eastwind Glacier (CMP 3) with three antenna orientations using b) the SDR-based system and c) the fiber optic-based system. Offsets ranged from 20 to 710 m with increments of 30 m. Note, the offset axis represents transmitter/receiver offset on a survey line perpendicular to ice flow. Thus, the cross-track reflection is interpreted as coming from either up- or downstream of the survey line.

Results
Eastwind Glacier: radar system comparison
Figure 3 shows variable offset data collected on the ice shelf in front of Eastwind Glacier (CMP 3) using the two radar systems. We focus our analysis on CMP 3 due to the high-quality data obtained using both the fiber optic- and SDR-based systems and the lack of a brine layer allowing detection of the bottom of the ice shelf; however, data from the four other surveys can be found in Appendix A, Figures A1-A4. For each survey point, measurements were taken using VV, HH and VH orientations. The number of chirps stacked generally increased with offset to overcome the increased losses associated with longer travel paths. For CMP 3, 150 chirps were collected for each polarization at 20 m offset, with this increasing to 500 chirps at 710 m offset. Selecting the appropriate number of chirps to stack is highly site dependent, as target depth, estimated englacial attenuation rate and bed reflectivity must all be considered. Figures 3b and 3c show the polarimetric common midpoint data collected using the SDR (20 MHz bandwidth) and the fiber optic system (200 MHz bandwidth), respectively.
Subsurface reflections are recorded with greater range resolution by the fiber optic-based system due to the larger bandwidth. The increased duty cycle of the fiber optic-based radar also results in improved SNR due to greater number of chirps stacked. Nevertheless, similar features are recorded by both systems, including the direct path through the air and the primary and multiple reflections from the ice-ocean interface. Some weak englacial reflections and an additional hyperbolic reflection, interpreted as energy from across-track, can also be seen on both systems. Using standard normal moveout analysis of the primary reflection hyperbola, we found a value of  $\varepsilon'$ = 3.01 for the dielectric permittivity of the bulk ice column, giving an estimated ice thickness of ~275 m.
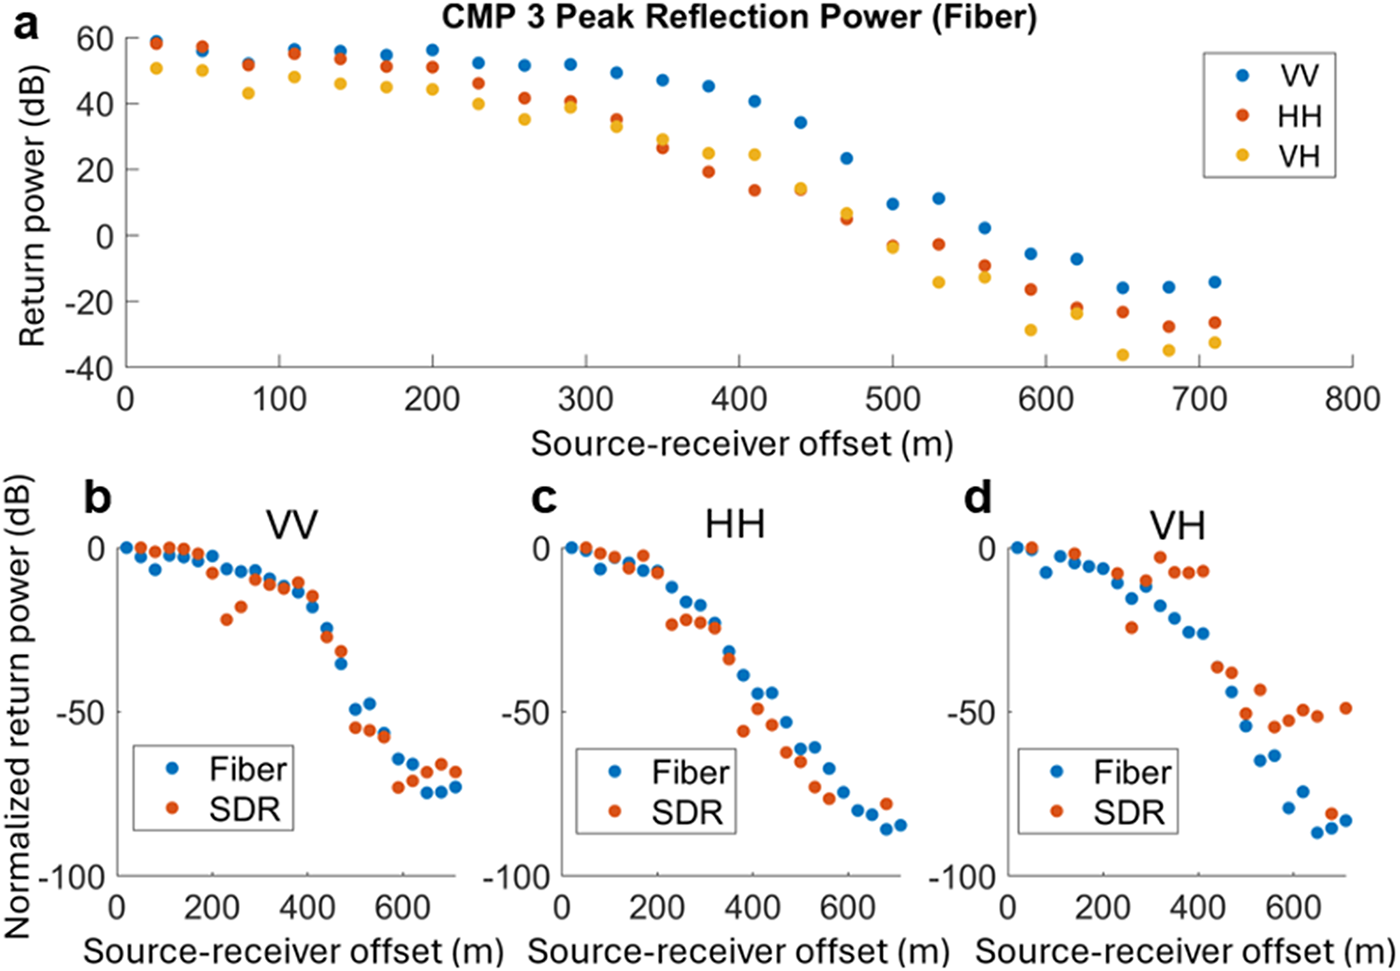
The peak amplitudes along the primary reflection hyperbola for the VV, HH and VH orientations are shown in Figure 5 for both datasets. The general trends in the amplitude decay as a function of offset agree across the two systems, with the VV and HH amplitudes initially showing a gradual decrease with offset before more rapidly dropping off after an offset of around 300 m and 400 m, respectively. In the cross-polarized data, VH amplitudes drop off in a similar manner on the fiber optic system around 300 m offset. While overall the SDR amplitudes for the VH orientation decay with offset, peak power occasionally plateaus. This less smooth decay could be a result of poorer SNR, as fewer chirps were averaged as a result of reduced duty cycle, as well as clutter within the same range-gate as the primary reflection. Overall, the total drop-off in peak reflection power, from shortest to longest offset, observed on both systems is approximately 75, 80 and 85 dB for the VV (Fig. 5b), HH (Fig. 5c) and HV (Fig. 5d) orientations, respectively.
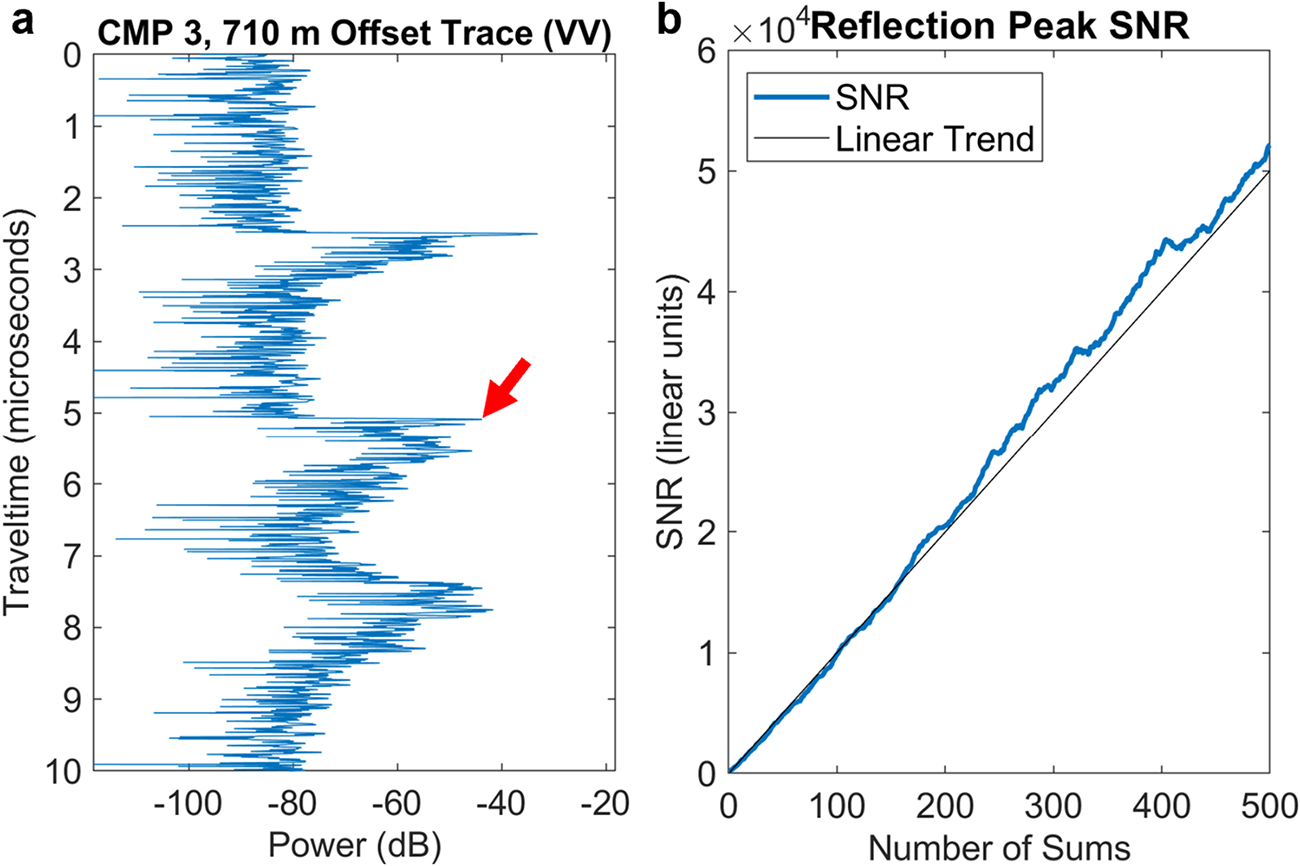
Finally, since ensuring phase stability is critical in the development of glaciological radar systems, as polarimetric phase differences encode information on properties such as ice crystal fabric, we demonstrate this stability in Figure 4. Figure 4a shows the measurement taken at 710 m offset at the location of CMP 3 with the primary reflection peak marked with a red arrow. Summation of repeat measurements is defined to be coherent when SNR increases linearly with the number of sums, indicating that the signals of interest in repeat measurements are in-phase (Bienert and others, Reference Bienert, Schroeder, Peters, MacKie and Dawson2022; Teisberg and others, Reference Teisberg, Broome and Schroeder2024). Figure 4b shows that the SNR of the main reflection peak increases linearly, indicating that the reflection peaks in each repeat measurement are in-phase and, thus, that the RFoF hardware does not distort the phase information.
a) Measurement collected at 710 m offset as part of CMP 3 on the McMurdo Ice Shelf near Eastwind Glacier. Red arrow marks the primary reflection peak from the ice bed interface. b). Growth in the signal-to-noise ratio as repeat measurements are summed together. The linear increase in SNR indicates the coherent summation of repeat measurements, indicating the phase-stability of the RFoF hardware.

Polarimetric amplitude-versus-offset analysis
Figure 5 demonstrates that similar amplitude information is collected using our ApRES modified with fiber optic hardware as with the SDR-based receiver. In order to illustrate the richness of the information in the amplitudes of multi-offset polarimetric radar, we investigate the cause of the observed total power drop in the co-polarized, VV (~75 dB drop) and HH (~80 dB drop) measurements. In general, variation of amplitude with offset is due to path length differences, causing increased losses from englacial attenuation and geometric spreading at larger offsets, birefringence losses, non-isotropic antenna radiation patterns and incidence angle dependent reflectivity of the subglacial interface (Ulaby and Ravaioli, Reference Ulaby and Ravaioli2015; Haynes, Reference Haynes2020). However, attenuation and spreading losses are independent of polarization, and for this analysis, we follow the common assumption that birefringence effects are small (Matsuoka and others, Reference Matsuoka, MacGregor and Pattyn2012). Furthermore, differences in antenna radiation pattern with incidence angle and antenna orientation (V or H) can be accounted for using theoretical radiation patterns (Holschuh and others, Reference Holschuh, Christianson, Anandakrishnan, Alley and Jacobel2016). Thus, analyzing the difference in VV and HH peak power vs offset (polarimetric AVO analysis) isolates the effects of polarization-dependent reflectivity and, therefore, can provide insight into the dielectric properties of englacial and subglacial materials. The polarization-dependent reflectivity of an interface is given by the Fresnel reflectivity equations (Zahn, Reference Zahn1979; Ulaby and Ravaioli, Reference Ulaby and Ravaioli2015)
 \begin{equation}
\Gamma_{VV}=\left|\frac{\eta_2 \cos \left(\theta_i\right)-\eta_1 \cos \left(\theta_t\right)}{\eta_2 \cos \left(\theta_i\right)+\eta_1 \cos \left(\theta_t\right)}\right|^2,
\end{equation}
\begin{equation}
\Gamma_{VV}=\left|\frac{\eta_2 \cos \left(\theta_i\right)-\eta_1 \cos \left(\theta_t\right)}{\eta_2 \cos \left(\theta_i\right)+\eta_1 \cos \left(\theta_t\right)}\right|^2,
\end{equation} \begin{equation}
\Gamma_{HH}=\left|\frac{\eta_2 \cos \left(\theta_t\right)-\eta_1 \cos \left(\theta_i\right)}{\eta_2 \cos \left(\theta_t\right)+\eta_1 \cos \left(\theta_i\right)}\right|^2,
\end{equation}
\begin{equation}
\Gamma_{HH}=\left|\frac{\eta_2 \cos \left(\theta_t\right)-\eta_1 \cos \left(\theta_i\right)}{\eta_2 \cos \left(\theta_t\right)+\eta_1 \cos \left(\theta_i\right)}\right|^2,
\end{equation}where
 \begin{equation}
\eta=\sqrt{\frac{\mu}{\epsilon^{\prime}}}(1-j \tan \delta)^{-1 / 2},
\end{equation}
\begin{equation}
\eta=\sqrt{\frac{\mu}{\epsilon^{\prime}}}(1-j \tan \delta)^{-1 / 2},
\end{equation} \begin{equation}
\cos \left(\theta_t\right)=\sqrt{1-\frac{\mu_1 \epsilon_1^{\prime}\left(j \tan \delta_1-1\right)}{\mu_2 \epsilon_2^{\prime}\left(j \tan \delta_2-1\right)} \sin ^2\left(\theta_i\right)},
\end{equation}
\begin{equation}
\cos \left(\theta_t\right)=\sqrt{1-\frac{\mu_1 \epsilon_1^{\prime}\left(j \tan \delta_1-1\right)}{\mu_2 \epsilon_2^{\prime}\left(j \tan \delta_2-1\right)} \sin ^2\left(\theta_i\right)},
\end{equation} \begin{equation}
\tan \delta = \frac{\sigma_s + \omega \epsilon^{\prime\prime}}{\omega \epsilon^{\prime}},
\end{equation}
\begin{equation}
\tan \delta = \frac{\sigma_s + \omega \epsilon^{\prime\prime}}{\omega \epsilon^{\prime}},
\end{equation} where  $\eta$ is the intrinsic impedance, $\theta_i$ is the angle of incidence at an interface, $\theta_t$ is the angle of transmission at an interface, $\mu$ is the magnetic permeability, $\varepsilon'$ is the real part of the dielectric permittivity, tan $\delta$ is the loss tangent, $\sigma_s$ is the static conductivity, $\omega$ is the angular frequency and $\varepsilon^{\prime\prime}$ is the imaginary part of the dielectric permittivity. Note, the cosines will be complex values when the critical angle is reached, corresponding to total internal reflection. However, Bienert and others (Reference Bienert, Schroeder, Peters, MacKie and Dawson2022) show that reflections are still detected beyond this point by ground-based antennas due to the presence of an evanescent wave. While this wave decays with height above the ice surface, it is assumed to be equal to the incident energy for a ground-based receiver.
a) Peak bed reflection power as a function of offset in VV, HH and VH antenna configurations detected using the fiber optic-based system. Comparison of peak bed power between the two radar systems, normalized by the peak power at the smallest offset, for b) VV, c) HH and d) VH antenna configurations. Data is from the CMP 3 survey at Eastwind Glacier.

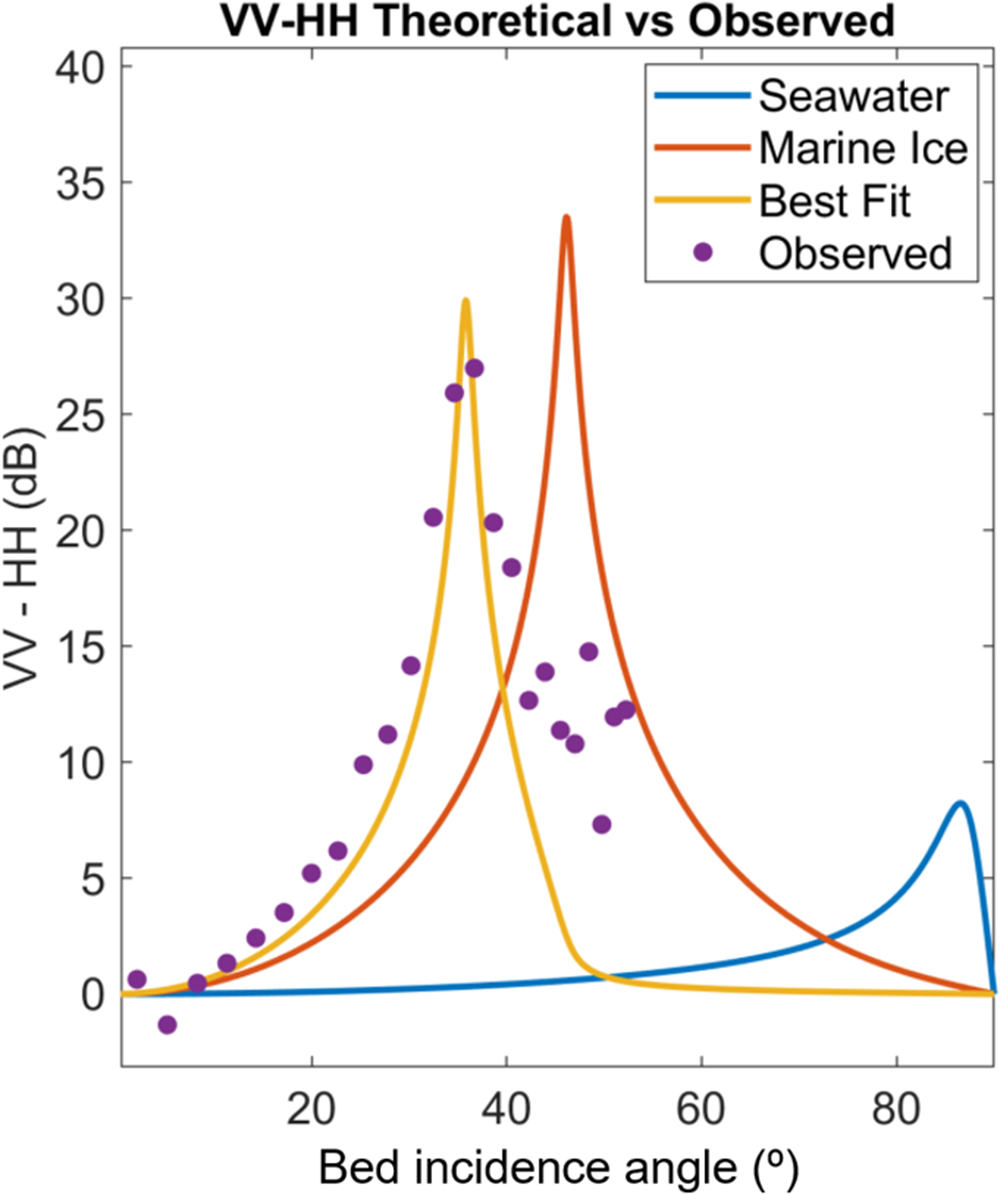
Figure 6 shows how the difference in the VV and HH reflectivity varies with incidence angle for glacier ice ( $\varepsilon' = 3.17$, tan $\delta = 0.0062$) overlying seawater ( $\varepsilon' = 77$, tan $\delta = 11.3$) and marine ice ( $\varepsilon' = 3.43$, tan $\delta = 0.05$), respectively (Peters and others, Reference Peters, Blankenship and Morse2005). Figure 6 also shows the observed difference in peak reflection power between polarizations as a function of offset. As neither material provides a good fit, we perform a grid search to find the difference curve which best fits the observed data, giving optimal values of $\varepsilon' = 1.65$ and tan $\delta = 0.05$ (see geophysical interpretation in the Discussion section).
Differences in VV and HH reflectivity for a meteoric ice-seawater interface (blue) and a meteoric ice-marine ice interface (red) compared to the observed VV-HH power difference (purple dots). The combination of  $\varepsilon' = 1.65$, tan $\delta = 0.05$ provides the best fitting VV-HH reflectivity curve (yellow). The following dielectric properties were used: meteoric glacier ice ( $\varepsilon' = 3.17$, tan $\delta = 0.0062$), seawater ( $\varepsilon' = 77$, tan $\delta = 11.3$) and marine ice ( $\varepsilon' = 3.43$, tan $\delta = 0.05$) (Peters and others, Reference Peters, Blankenship and Morse2005).

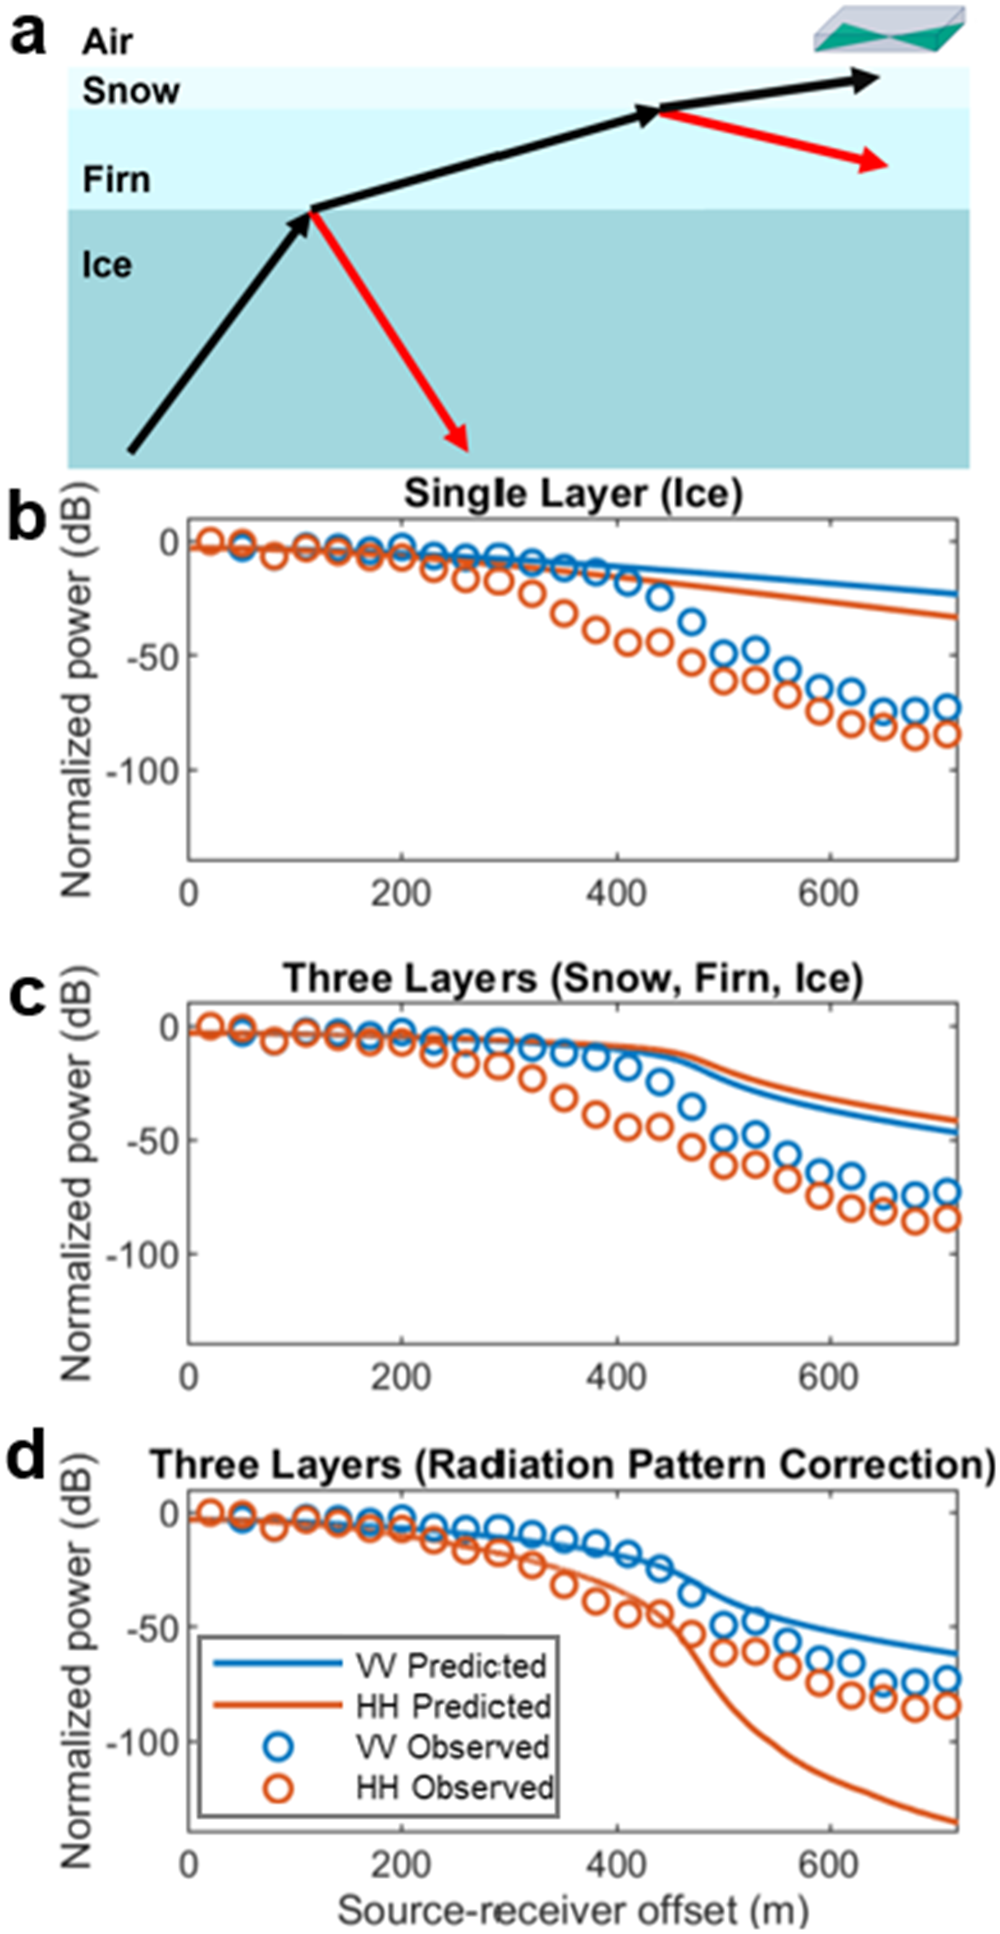
To further explore factors influencing the observed amplitude behavior, specifically the ~70-85 dB drop-off in power between the shortest and longest offset, which cannot be explained by geometric spreading and attenuation losses alone (Fig. 7b), we modeled a three-layer ice column consisting of snow, firn and glacier ice. Figure 7a shows such a three-layered model consisting of a thin snow layer ( $\varepsilon' = 1.2$, tan $\delta = 0.0001$, $h = 1.5m$, where $h$ is layer thickness), over firn ( $\varepsilon' = 2.2$, tan $\delta = 0.003$, $h = 50m$), over glacier ice ( $\varepsilon' = 3.17$, tan $\delta = 0.0062$, $h = 223.5m$), keeping the total column thickness at 275 m. Since our measurement spacing was too coarse to resolve near-surface properties, values for the real permittivity of dry-snow and firn were taken from Kovacs and others (Reference Kovacs, Gow and Morey1995) and Campbell and others (Reference Campbell, Courville, Sinclair and Wilner2017). Values for tan $\delta$ of glacier ice and snow were taken from Peters and others (Reference Peters, Blankenship and Morse2005) and Tiuri and others (Reference Tiuri, Sihvola, Nyfors and Hallikainen1984), respectively, and an intermediate value was selected for the firn. At each interface, up-going and down-going transmission losses, calculated as $1-\Gamma$, where $\Gamma$ is the polarization-dependent reflectivity in (1) and (2), occur. $\Gamma_{VV}$ and $\Gamma_{HH}$ as a function of offset for the three interfaces of interest, ice-ocean, ice-firn and firn-snow are shown in Figure 8c. Including these losses results in a sharper drop-off in observed power around ~ 450 m offset, as is shown in Figure 7c.
a) Three-layer model showing the path taken by an up-going ray after reflection at the ice-bed interface. Observed (circles) drop in power with offset compared to the predicted drop for b) a homogeneous ice column with losses from attenuation (30 dB km-1), spreading and bed reflectivity, c) effect of adding transmission losses associated with the three-layer model and d) applying a radiation pattern correction to the three-layer model.

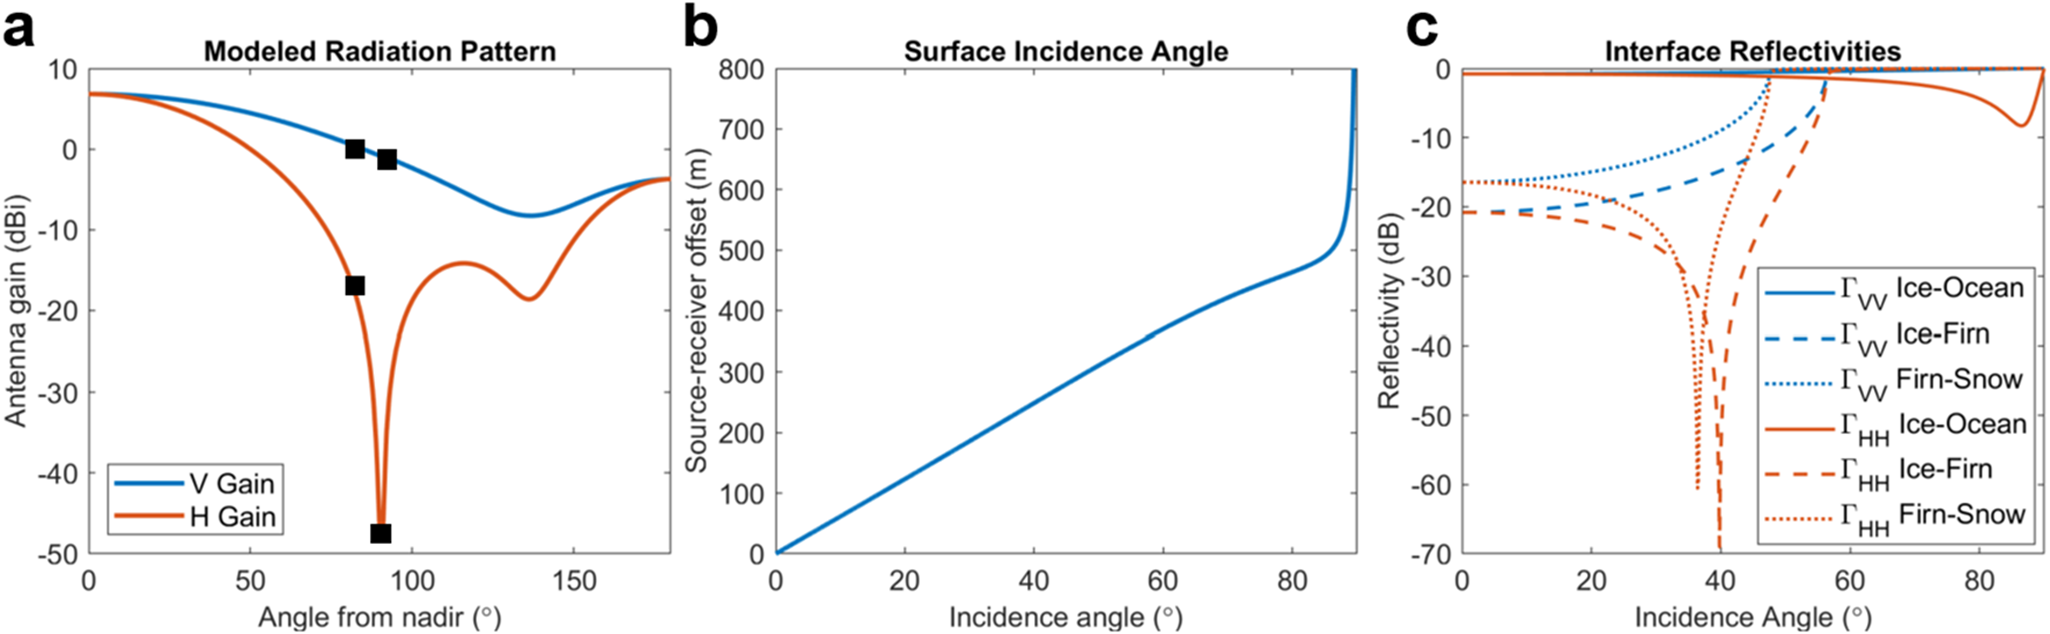
Finally, Figure 7d shows the expected power versus offset curve after correcting for angle- and polarization-dependent antenna radiation patterns using the calculated antenna incidence angle in the snow layer (Fig. 8). This correction improves agreement with the observed power drop in the VV polarization across all offsets and also results in a difference in VV and HH power around 400 m that is more consistent with the observations in Figure 6. However, at offsets greater than 450 m, the predicted drop in HH peak power exceeds the observed power drop.
a) Radiation pattern for a bowtie antenna with reflector in air modeled using Matlab’s Antenna Toolbox (The MathWorks Inc., 2023). Black squares mark the points along the curve at 80 and 90 degrees from nadir, demonstrating the rapid gain fall-off modeled for the H orientation relative to the V orientation. b) Incidence angle at the antenna as a function of offset for the modeled three-layer ice column. c) Polarization-dependent interface reflectivities,  $\Gamma_{VV}$ and $\Gamma_{HH}$ for ice-ocean, ice-firn and firn-snow transitions.

Thwaites Glacier deployment
While a thin ice shelf allows the detection of bed echoes at large incidence angles with high SNR, many targets of interest are in regions of thicker, warmer ice overlaying rough beds with low reflectivity. In these environments, obtaining incidence angles sufficient for amplitude-vs-offset analysis or thermal tomography requires offsets on the order of several kilometers.
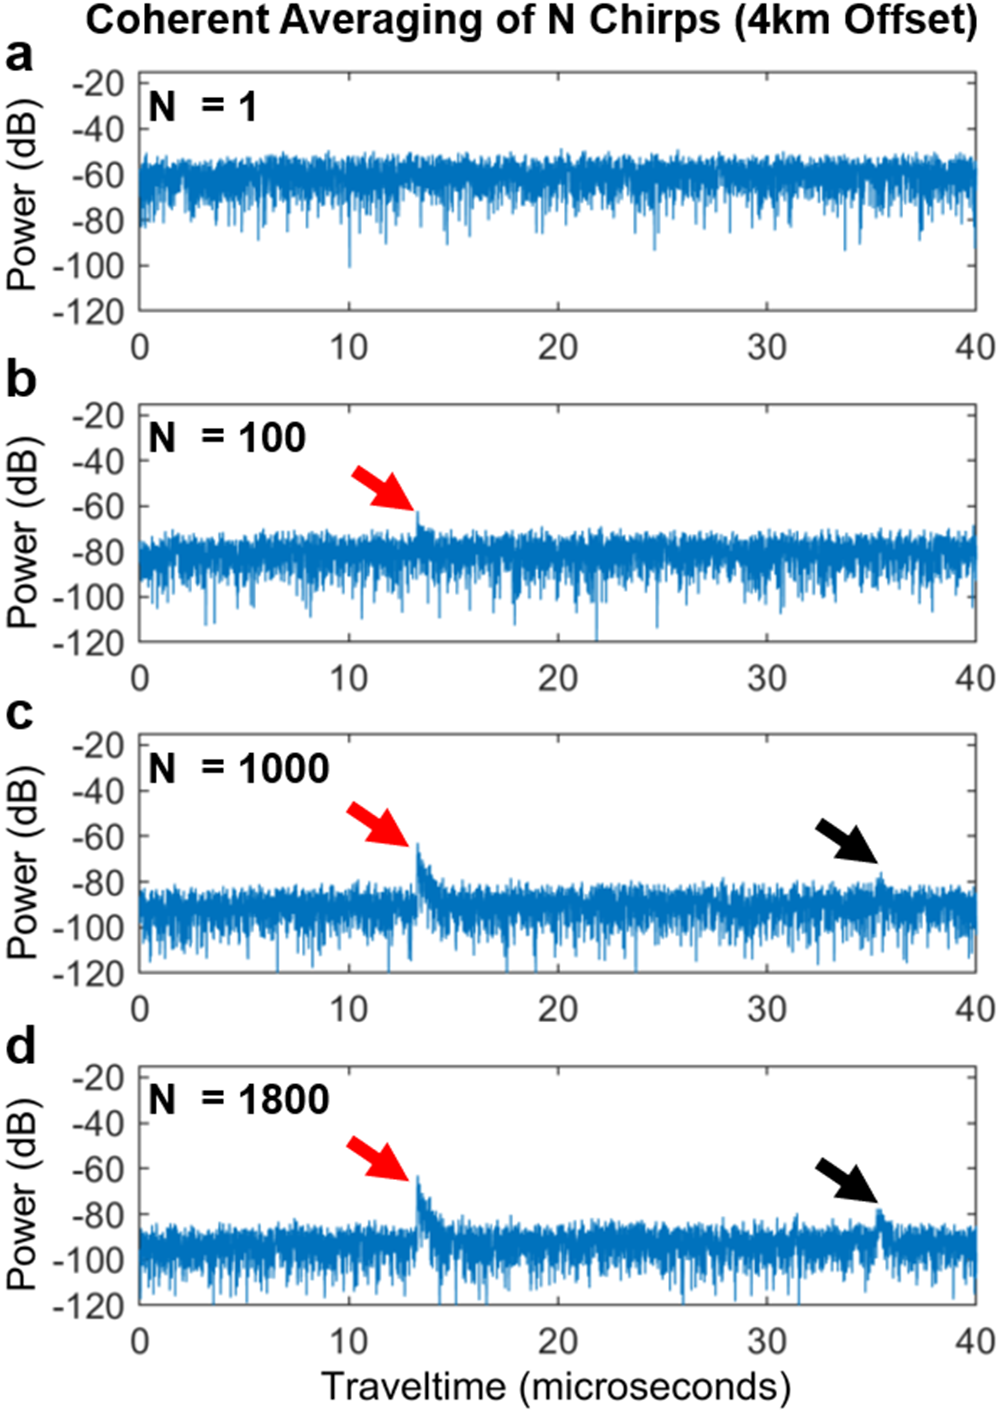
In order to demonstrate and evaluate the performance over thick ice, we present 4 km-offset (1.8 ice thicknesses) measurements collected at the eastern shear margin of Thwaites Glacier where detection of bed reflections is hindered by large ice thicknesses (~ 2.2 km, inferred from the bed echo traveltime of 35.3  $\mu$s and assuming $\varepsilon' = 3.17$ in the ice column) and potential elevated englacial temperatures due to frictional heating. We used the same fiber optic-based system described previously (Fig. 1b), with the addition of a 20 W high power amplifier (ZHL-20W-13+) on the transmit side, to collect long-offset data using a 4 km length of fiber optic cable deployed perpendicular to the shear margin and centered at the point of maximum shear strain. Figure 9a shows that with a single chirp neither the bed reflection nor the direct path is detected. In cable-less impulsive systems, the direct path is used for triggering a recording as well as time synchronization of repeat measurements after which stacking can be carried out. The cabled approach does not require triggering based on the direct wave and allows for time synchronization of repeat measurements to be done without the direct path. In this case, 1800 measurements (114 minutes of recording) were coherently averaged, revealing a reflection from the ice-bed interface, as well as some weak englacial reflections arriving shortly after the direct path.
a) Radargram from a single chirp (3.8 s) collected at the eastern shear margin of Thwaites Glacier with a transmit-receive offset of 4 km. Neither a bed echo nor the direct path is detected despite the use of a 20 W amplifier. Coherently averaging b) 100 (6.3 minutes recording), c) 1000 (63.3 minutes recording), d) 1800 (114.0 minutes recording) chirps at the same location improves SNR such that the direct path (red arrow) and bed echo (black arrow) are detectable.

Discussion
Figure 5 shows that the drop-off in observed reflection power with amplitude is consistent both in terms of magnitude and general trend, demonstrating that the integration of off-the-shelf RFoF hardware into an ApRES does not present an issue for interpreting amplitudes of englacial and subglacial reflections. Furthermore, Figure 4 demonstrates that phase information is not distorted by the integration of RFoF hardware. Thus, our modified ApRES provides a novel capacity to collect polarimetric multi-offset surveys with a low-cost, low-data-volume radar system that has been extensively field-tested.
Our initial AVO analysis (Fig. 6) shows that a simple homogeneous ice column overlying either seawater or a marine ice layer, the subglacial materials most likely to be encountered beneath the McMurdo Ice Shelf (Campbell and others, Reference Campbell, Courville, Sinclair and Wilner2017), does not explain the difference in the observed VV and HH peak reflection power. While providing an improved fit to the observed difference in the VV and HH amplitudes, the best-fit value of  $\varepsilon' = 1.65$ does not correspond to any realistic subglacial material, suggesting that modeling the ice shelf as homogeneous ice column is too simplistic. Furthermore, the drop in power between the smallest and largest offsets within a polarization, shown in Figure 5a, is approximately 70 to 85 dB: too large to be attributed solely to the variation in offset-dependent losses from englacial attenuation (modeled with a one-way attenuation rate of 30 dB km-1 ), geometric spreading and ice-ocean interface reflectivity (Fig. 7b). Note, the true attenuation rate will vary throughout the ice-column; however, as we are unable to constrain this variability from our dataset, we assume a constant attenuation rate for our model. After including losses from internal reflections associated with the three-layered ice column, the shape of the predicted loss curve in Figure 7c more closely resembles the rather abrupt drop-off in power at ~ 450 m offset. This three-layered ice column model also results in increased surface-incidence angles due to refraction-induced bending of rays, impacting radiation pattern corrections.
While applying this radiation pattern correction further improves agreement between modeled and observed VV amplitudes, predicted HH amplitudes are significantly lower than what is observed at the largest offsets (Fig. 7d). This mismatch between expected and observed peak power in the HH orientation could be due to discrepancies between the modeled and true radiation patterns, as the radiation pattern of an antenna on a dielectric medium can be significantly different when modeled in air (Langhammer and others, Reference Langhammer2019; Hunziker and others, Reference Hunziker, Slob and Irving2023). In general, the radiation pattern in V orientation is smoother with a less significant drop in gain compared to the radiation pattern in H orientation, suggesting that distortion due to interaction with the dielectric medium may be less severe in the V orientation. Furthermore, between 80 and 90 degrees, there is a rapid drop-off in the H radiation pattern, with gains lower than -40 dBi, which will be incurred twice, both at the receiver and transmitter. Thus, even if the drop-off in the modeled H radiation pattern is slightly overestimated, this will have significant impact on the expected HH loss at large incidence angles. At offsets beyond ~ 450 m in our surveys near Ross Island, the inferred incidence angles at the antenna exceed 80 degrees, leading to significant expected decrease in observed power and, thus, a large radiation pattern correction.
Thus, we attribute the large drop and polarization-dependent variation in power to incomplete transmission of energy due to reflection at englacial interfaces such as the transitions from ice to firn and between firn and low-density snow layers at the glacier surface. In addition to causing some of the up-going energy from a subglacial reflection to be reflected back toward the ice-bed interface, these changes in dielectric permittivity cause bending of the ray paths, due to refraction, leading to large incidence angles at the surface. The modeled drop-off in gain of the cavity-backed antennas used here is more extreme at these higher angles, leading to a rapid drop in power received. Furthermore, at large angles, the radiation pattern correction term, based on simulations of the antenna in free space, is likely to be less accurate due to warping of the true radiation pattern due to the dielectric permittivity of the surface materials.
Several factors beyond those considered here may also contribute to the mismatch between the modeled VV and HH reflection amplitudes. For example, strong firn anisotropy (Fujita and others, Reference Fujita, Goto-Azuma, Hirabayashi, Hori and Iizuka2016; Oraschewski and others, Reference Oraschewski, Ershadi and Drews2025) could have a polarization-dependent influence on ray path geometry. This would change incidence angles at reflection interfaces and the antennas, thereby influencing transmission losses and effective antenna gain. Though birefringence losses associated with obliquely propagating radio waves seem unlikely to fully account for the up to 25 dB discrepancy between VV and HH reflection peak return power (Matsuoka and others, Reference Matsuoka, Wilen, Hurley and Raymond2009). Similarly, mismatch between the observed and modeled losses could be in part due to clutter within the same range gate as the reflection peak, as well as spatial variability in englacial attenuation rate in the ice column. However, in the case of the former, higher bandwidth systems would be less sensitive to the effect of clutter on the amplitude of the signal of interest due to finer range resolution. Thus, clutter may in part explain the less smooth change in return power with offset in data collected with the low-bandwidth SDR system in the VH orientation (Fig. 5d).
We find that reflection amplitudes are incredibly sensitive to near-surface conditions providing useful insight for future surveys. However, because this was a bed-focused experiment, the CMP surveys used widely spaced measurements to sample a broad range of bed incidence angles. Despite detecting some reflected energy from shallow englacial layers, this coarse spacing limits our ability to resolve near-surface ice structure in sufficient detail to realistically model in-field antenna radiation patterns, trace the true paths of refracting rays and fully quantify transmission losses at internal interfaces. Future surveys could incorporate initial CMP surveys with fine spatial sampling in order to obtain near-surface profiles of dielectric properties (Drews and others, Reference Drews2016), prior to bed-focused acquisition with larger offsets. In addition to providing detailed information about the shallow structure, which is itself useful for studying firn and other near-surface processes, an initial near-surface survey could improve the ability to derive information about the ice-bed interface. This approach, combined with more sophisticated ray tracing for ice column models with an arbitrary number of layers, could allow for the AVO reflectivity signature of the bed to be extracted.
Finally, all data presented here were collected by relocating a single transmitter and receiver after each measurement, resulting in relatively sparse spatial sampling. However, integration of fiber optic switches on both the transmit and receive sides of the ApRES would allow for an arbitrarily large number of transmit and receive antennas to be deployed across the glacier surface. This large range of offsets would approach acquisition geometries commonly used in exploration seismology, allowing powerful imaging techniques to be applied to radar data (Peters and others, Reference Peters, Anandakrishnan, Alley and Smith2007; Shadlow, Reference Shadlow2014). Taking advantage of the stationary array’s ability to boost SNR with large integration times and the autonomous nature and intrinsic coherence and synchronization of the ApRES, large fiber optic-based radar arrays could be used to create high resolution 3D time-lapse images of englacial and subglacial processes such as the seasonal evolution of hydrological systems, isostatic rebound, formation of ice shelf terraces, as well as subglacial erosion. This is true even for traditionally difficult-to-image targets, as demonstrated by our detection of bed reflections over 2.2 km ice at Thwaites Glacier at offsets up to 4 km, assuming required integration times remain below the time scale of the process being studied.
Conclusion
We demonstrate the modification of an ApRES with off-the-shelf RFoF hardware to enable the collection of multi-offset RES data in the vicinity of Ross Island, Antarctica and validate its performance by comparing it to co-located measurements collected with an established SDR receiver with post-processing synchronization. Additionally, we used the fiber optic-based system to collect long-offset radar data across the eastern shear margin of Thwaites Glacier, detecting bed reflections up to offsets of 4 km over ~ 2.2 km thick ice. On the ice shelf, both systems detect bed reflections at offsets much greater than the theoretical point of total internal reflection but see a ~70-85 dB drop off in power from the smallest to largest offsets that cannot be accounted for solely by geometric spreading, attenuation and angle-dependent reflectivity derived from a simple homogeneous ice column overlaying the bed. We demonstrate that this signature could be the result of an ice column with a three-layer structure.
We show that differences in antenna radiation pattern, refraction in the near-surface and power loss due to internal reflection at the ice-firn and other near-surface interfaces can mask the differences in polarization-dependent bed reflectivity. While these effects make interpretation of reflection amplitudes less straightforward, they encode valuable information about near-surface structure and, thus, may provide insight into firn and other near-surface processes. Therefore, while total internal reflection does not present a hard limit on the maximum achievable radar offsets, using amplitude information from bed reflections beyond this point may require additional corrections to fully capture information about englacial attenuation and bed reflectivity. A combination of improved radiation pattern modeling and characterization of the near-surface permittivity structure could allow more accurate corrections to be applied prior to AVO analysis, providing a more comprehensive understanding of the dielectric properties of the entire ice column and underlying materials.
Acknowledgements
We acknowledge the logistical support of the National Science Foundation and the United States Antarctic Program in conducting this fieldwork in the area around McMurdo Station and Eastwind Glacier. We would especially like to thank the Mechanical Equipment Center and Berg Field Center for supporting this fieldwork. This work is from the TIME project, a component of the International Thwaites Glacier Collaboration (ITGC). Support from the National Science Foundation (NSF: Grant PLR 1739027) and the Natural Environment Research Council. Logistics provided by NSF-U.S. Antarctic Program and NERC-British Antarctic Survey. ITGC Contribution No. ITGC-149. Anna L. Broome was with the Department of Electrical Engineering, Stanford University, Stanford, CA 94305 USA. She is now with Sandia National Laboratories, Albuquerque, NM 87123 USA. We are grateful for the constructive feedback provided by the scientific editor, Oliver Marsh and two anonymous reviewers throughout the editorial process.
Appendix A. Additional common midpoint radar data
Data collected over grounded ice on Eastwind Glacier (CMP 1) with three antenna orientations (VV, HH, VH) using a) the SDR-based system and b) the fiber optic-based system. Offsets ranged from 20 to 610 m in increments of 30 m. Beyond 260 m, the direct arrival was too weak to be detected by the SDR-based receiver due to high surface topography between the transmitter and receiver. Thus, no useful data were collected beyond this offset.

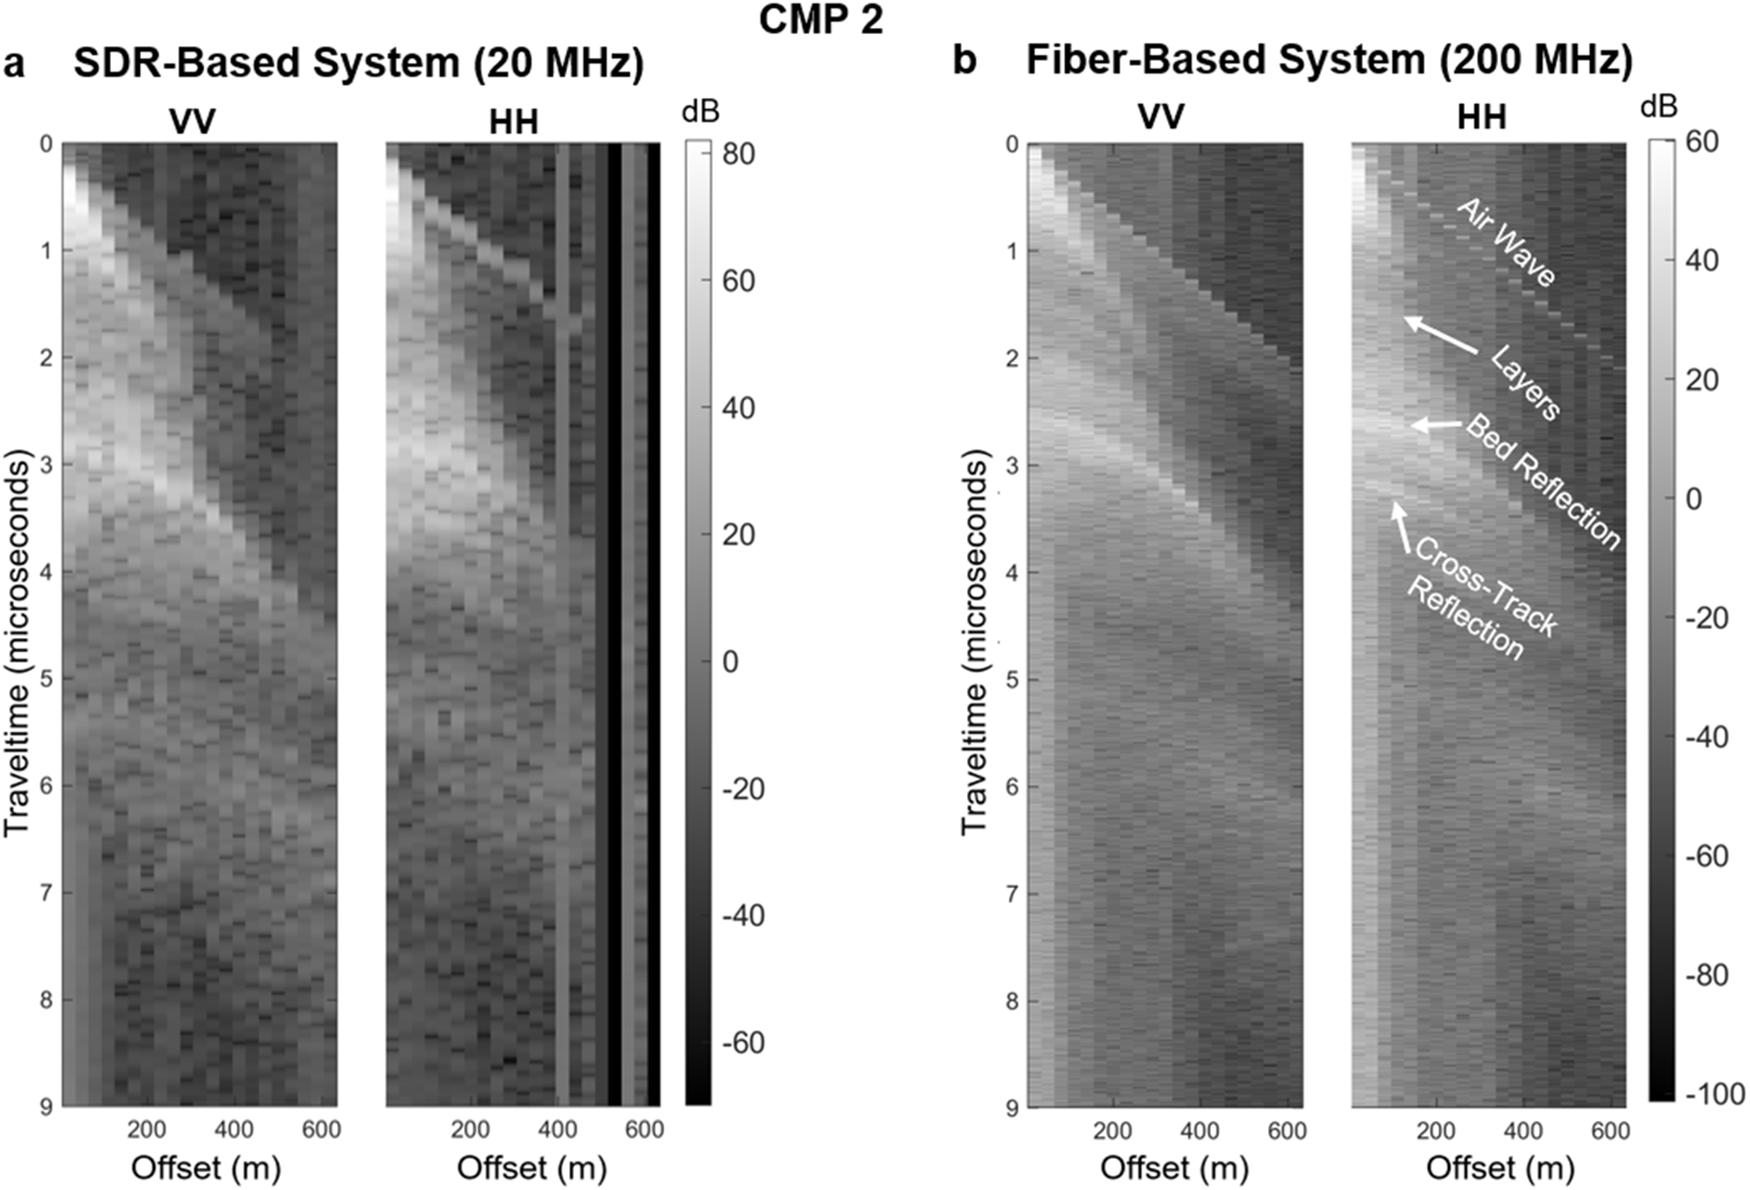
Data collected over the grounding zone at Eastwind Glacier (CMP 2) with two antenna orientations (VV, HH) using a) the SDR-based system and b) the fiber optic-based system. Offsets ranged from 20 to 610 m in increments of 30 m. Data in the VH polarization were not collected due to time constraints.

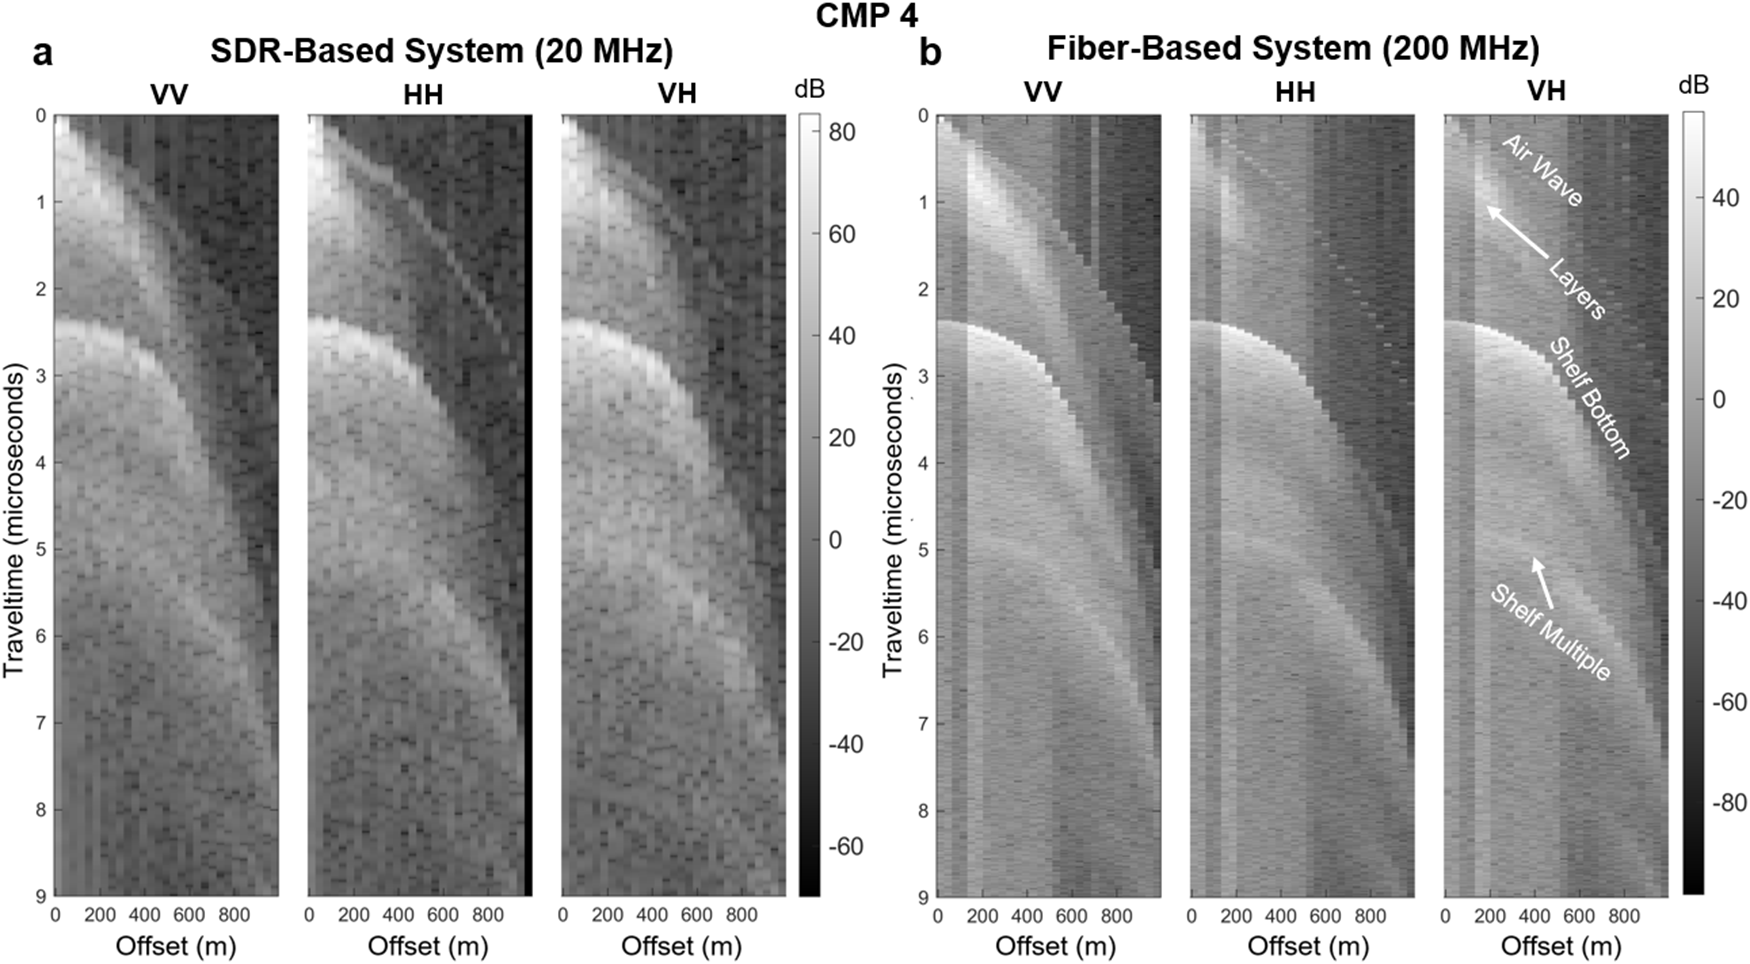
Data collected on the McMurdo Ice Shelf (CMP 4) between McMurdo Station and Eastwind Glacier with three antenna orientations (VV, HH, VH) using a) the SDR-based system and b) the fiber optic-based system. Offsets ranged from 10 to 980 m with variable spacing between offsets (increasing from 30 to 80 m as offsets increased). Note, the x-axis in this figure does not take into consideration this variable offset.

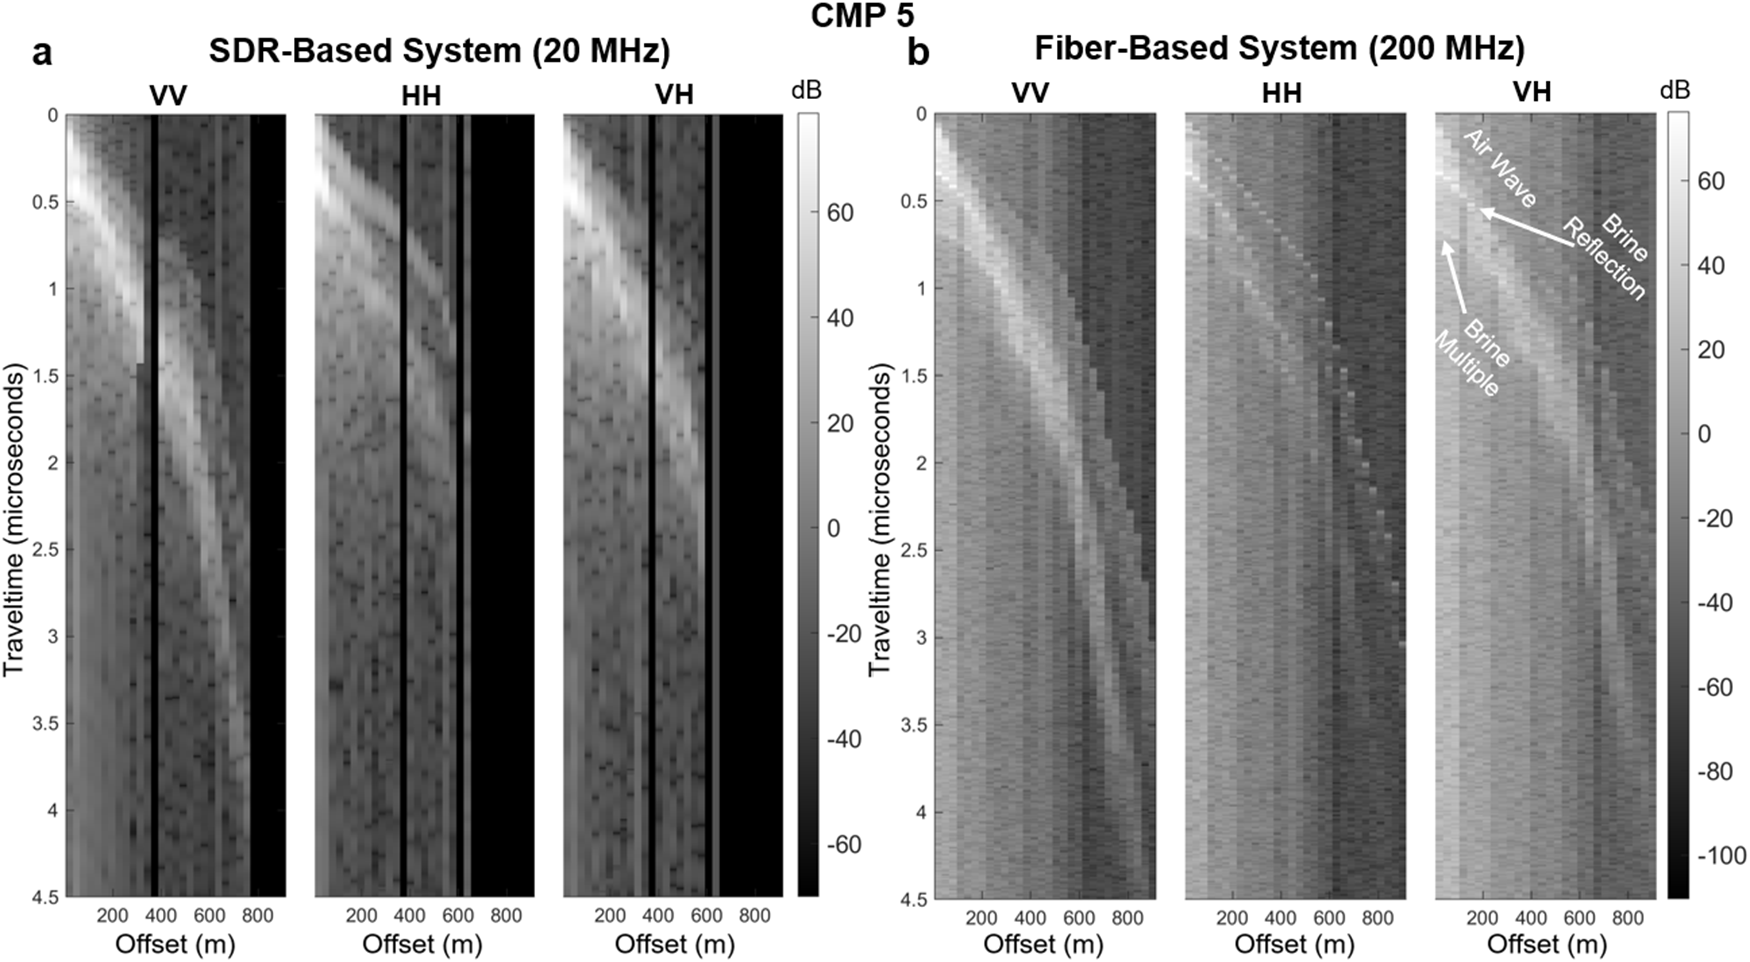
Data collected on the McMurdo Ice Shelf over a previously identified brine layer (Campbell and others, Reference Campbell, Courville, Sinclair and Wilner2017) (CMP 5) with three antenna orientations (VV, HH, VH) using a) the SDR-based system and b) the fiber optic-based system. Offsets ranged from 20 to 900 m with variable spacing between offsets (increasing from 15 to 100 m as offsets increased). Note, the x-axis in this figure does not take into consideration this variable offset.


 Open access