


Introduction
Conditions of life during the growth period shape body dimensions, especially height (Lasker and Mascie Taylor, Reference Lasker and Mascie-Taylor1989; Mascie-Taylor, Reference Mascie-Taylor1991; Peck and Lundberg,Reference Peck and Lundberg1995; Steckel, Reference Steckel1995; Cole, Reference Cole2003; Eiben and Mascie-Taylor, Reference Eiben and Mascie-Taylor2004). Studies on modern societies have demonstrated that many factors such as parental education level, welfare level, industrialization, heavy work, hygiene conditions, nutrition, and diseases during growth affect the formation of body dimensions (Hauspie et al., Reference Hauspie, Vercauteren and Susanne1997; Lindgren, Reference Lindgren, Ulijaszek, Johnston and Preece1998; Eveleth, Reference Eveleth, Dasgupta and Hauspie2001; Cole, Reference Cole2003; Koca Özer, Reference Koca Özer2008; Steckel, Reference Steckel1995, Reference Steckel, Cameron and Bogin2012). Research has shown that members of high socio-economic groups (i.e., advantaged groups) have larger body dimensions, while those from disadvantaged groups have smaller ones (Susanne, Reference Susanne, Johnston, Roche and Susanne1979; Duyar, Reference Duyar1990; Howe et al., Reference Howe, Tilling, Galobardes, Smith, Gunnell and Lawlor2012; Towne et al., Reference Towne, Demerath, Czerwinski, Cameron and Bogin2012; Mumm et al., Reference Mumm, Ipsen and Hermanussen2016; Hancock et al., Reference Hancock, Bettiol and Smith2016; Mumm et al., Reference Mumm, Czernitzki, Bents and Musalek2017; McCrory et al., Reference McCrory, O’Leary, Fraga, Riberio, Barros, Kartiosuo, Raitakari, Kivimäki, Vineis, Layte and Consortium2017).
A change in the socio-economic conditions of a population significantly affects body proportions and height (Kryst et al., Reference Kryst, Żegleń, Dasgupta, Saha, Das and Das2019). In addition, alterations can be observed in the relations of dimensions such as the forearm, leg, thigh length, and body height to each other (Dempster et al., Reference Dempster, Sherr and Prıest1964). Recent studies have shown that leg length, one of the components of height, is sensitive to growth conditions and reflects the stresses experienced in childhood (Gunnell et al.,Reference Gunnell, Smith, Frankel, Kemp and Peters1998; Li et al., Reference Li, Dangour and Power2007; Frisancho, Reference Frisancho2007; Webb et al., Reference Webb, Kuh, Peasey, Pajak, Malyutina, Kubinova, Topor-Madry, Denisova, Copkova, Marmot and Bobak2008; Stinson, Reference Stinson2009; Patel et al., Reference Patel, Lawlor, Kramer, Davey Smith, Bogdanovich, Matush and Martin2011; Godina et al., Reference Godina, Khomyakova and Zadorozhnaya2016). The upper and lower parts of the body exhibit different growth patterns depending on variation in growth rate in humans (Dangour et al., Reference Dangour, Schilg, Hulse and Cole2002). The growth rates of sitting height and total lower leg length do not change in the same way over time; instead, while the speed of the growth of the total lower leg length increases, that of the sitting height slows down (Duyar, Reference Duyar1997a). Many studies have stated that the lower part of the body (total lower leg length) has more significant plasticity during growth than the upper part (sitting height) (Johnston, Reference Johnston, Ulijaszek, Johnston and Preece1998; Dangour et al., Reference Dangour, Schilg, Hulse and Cole2002; Živičnjak et al., Reference Živičnjak, Narančić, Szirovicza, Franke, Hrenović and Bišof2003; Webb et al., Reference Webb, Kuh, Peasey, Pajak, Malyutina, Kubinova, Topor-Madry, Denisova, Copkova, Marmot and Bobak2008; Pomeroy et al., Reference Pomeroy, Stock, Stanojevic, Miranda, Cole and Wells2012). Besides the trunk-leg parts, distal limbs segments seem to show more variability than proximal limbs (Holliday and Ruff, Reference Holliday and Ruff2001; Auerbach and Sylvester, Reference Auerbach and Sylvester2011; Koziel et al., Reference Koziel, Gomula and Nowak-Szczepańska2016; Koziel et al., Reference Koziel, Gomula and Malina2019; Kryst et al., Reference Kryst, Żegleń, Dasgupta, Saha, Das and Das2019).
The plasticity observed in body size and proportions is thought to be related to socio-economic level, nutrition, and diseases, as well as to different physical stresses encountered during the growth period. In this regard, studies on child workers in underdeveloped or developing countries, including Turkey, have provided important information on how the morphological structure of the human body is affected by physical stress (Raina et al., Reference Raina, Bhan and Bhat1990; Ambadekar et al., Reference Ambadekar, Wahab, Zodbey and Khandait1999; Hawamdeh et al., Reference Hawamdeh, Spencer and Waterston2001; Duyar and Özener, Reference Duyar and Özener2003; Reference Duyar and Özener2005; Omokhodion and Omokhodion, Reference Omokhodion and Omokhodion2004; Pasdar et al., Reference Pasdar, Darbandi and Nachvak2014; Rahman et al., Reference Rahman, Mistry and Hossain2014; Demir, Reference Demir2018).
The most important results were obtained by Duyar and Özener (Reference Duyar and Özener2003) from studies on child workers. According to them, children doing heavy work fell behind non-working children in growth in height but were ahead in growth in width. They had relatively long bodies and arms, but their legs were short. It is not clear whether this pattern carried over into adulthood because the adaptive biological system of ‘catch-up growth’ can partially or completely remove the effects of deficiencies in growth at other periods (Steckel, Reference Steckel, Komlos and Kelly2016). For this reason, it is important to determine how physical stress shapes the final size and proportions in human growth, which is affected by so many factors.
Studies dealing with how the human body is affected by environmental stresses are generally carried out on individuals in childhood. There have been relatively few studies carried out on adults concerning how physical and physiological stresses are reflected in final dimensions and body proportions (Cortez et al., Reference Cortez, Barbieri, Bettiol, da Silva and Cardoso2007; Dantas and Santana, Reference Dantas and Santana2010), and this issue has not yet been discussed enough.
The aim of this study was to analyse the dimensions and proportions reached in adulthood by individuals who are exposed to different levels of environmental stress (nutrition, labour, health, etc.) from early life and ones living under optimal conditions. In addition, the aim was to investigate how individuals from different socio-economic structures, their sizes, and the proportions of related parts of the body are affected by this structure, and how excessive physical stress in childhood is reflected in the final dimensions in groups having similar socio-economic statuses.
Methods
Why was Samsun chosen for the study?
According to World Bank data, Turkey is a country that has risen to the level of upper middle income. However, the economic disruptions after the 2000s pose a risk to this rise (World Bank, 2021). As a matter of fact, despite the advancement of regional development over the years, economic and social development is still not evenly distributed throughout the country, and this has led to inequalities and distinctions between regions and income groups (Turkey State Planning Organization (DPT), 2003; Selim et al., Reference Selim, Günçavdı and Bayar2014). The data of the last ten years indicates that Turkey has greater inequality than many Organisations for Economic Cooperation and Development (OECD) countries with its Gini coefficient (OECD, 2015).
According to 2020 data, the gross national product (GNP) per capita in Turkey is 8.636 United States dollar (USD) from a total GNP of 720.1 billion USD (World Bank, 2021). The poverty threshold in the country is ∼842 USD (Türkiye İşçi Sendikaları Konferadasyonu (TÜRK-İŞ), 2021), and 14.4% of the population of 83,154,997 people live in relative poverty in 2019 (Turkish Statistical Institute (TURKSTAT), 2020). This income-based inequality also deepens social inequality (Candaş et al., Reference Candaş, Yılmaz, Günseli and Yakut-Çakar2010). Such inequality has significantly triggered growth in child labour in the country. The biggest factor forcing children to work is the lack of income in the household, or in other words, poverty (TURKSTAT and International Labour Organization, (ILO), 1999; Candaş et al., Reference Candaş, Yılmaz, Günseli and Yakut-Çakar2010; TURKSTAT, 2012). Moreover, although Turkey is among the developing countries, it is a country where physical work begins in childhood (ILO, 2020). Reports on children working in different periods have been published, showing the rate of child labour to be 4.4% of 12 million children aged 6-14 in 1999, and 5.9% of 15 million children aged 6-17 in 2012 (TURKSTAT and ILO, 1999; TURKSTAT, 2012). These percentages show that society consists of different groups throughout the country and that these groups can still be determined in terms of similar characteristics. For this reason, it was thought that this economic and social structure of Turkey would help to find answers to the main objectives of the study.
Samsun is located in the Black Sea Region and has a population of 1,335,700. It ranks 16th among the provinces of Turkey in terms of population (Middle Black Sea Development Agency (OKA), 2019). In terms of socio-economic development, it is ranked in the third of six levels, and 31st among the 81 provinces in Turkey (Acar et al., Reference Acar, Meydan, Bilen Kazancık and Işık2019). Samsun has these characteristics, with agricultural potential and seven organized industrial zones. According to 2017 data, 12.45% of its economic activities consist of agriculture, 24.22% of industry, and 63.33% of the service sector. While agricultural activities have been declining recently, the industrial area, which is developing, is at the forefront in the region with medical device production, food, metal industry, and furniture sectors (OKA, 2019). Also, 2015 data showed that Samsun is among the first 30 of the 81 provinces in terms of health, education, civic participation, and social life, and is prominent in the region with its specialization and quality in health services (OKA, 2019).
The demographic transformation process that Turkey is undergoing is heterogeneous in all settlements and regions (Koç et al., Reference Koç, Eryurt, Adalı and Seçkiner2008). Undoubtedly, one of the biggest reasons for this is immigration. There has been intense internal migration from rural to urban areas in Turkey since the 1950s, and external migration to western countries to meet the need for a foreign workforce since the 1960s (Hacettepe University Institute of Population Studies 2014). The main reason for this observed internal migration is economic. The economic transformation observed in the country has changed the structure of urban settlements, and the population has increased to meet the need for labour in these areas (Koç et al., Reference Koç, Eryurt, Adalı and Seçkiner2008). Especially in the 2000s, the rate of urbanization gained momentum (Hacettepe University Institute of Population Studies, 2014). This study could have been carried out in cities such as Istanbul, Kocaeli, Ankara, or Bursa, where there is a lot of heavy industry, and child labour is commoner. However, these cities receive intense immigration from regions of Anatolia that vary in terms of different ecological and ethnic groups (TURKSTAT, 2020).
Cities like Samsun, on the other hand, contain more homogeneous populations in terms of demographic pattern compared to megacities such as İstanbul, Ankara, and İzmir. The population in Samsun has been spatially clustered in provincial and district centres since the 2000s. Although migration is lower for Samsun than for other provinces in the region, people have migrated towards provinces with more opportunities for business, education, and social life. Thus, Samsun is a province that sends out migrants rather than receiving them, and overall migration has been outward (OKA, 2015). On the other hand, the general population structure consists mostly of individuals registered in Samsun and surrounding provinces (mostly Ordu, Trabzon, Amasya, Rize, and Giresun) (TURKSTAT, 2017). The sample of this study also supports demographic records. The birthplace of the sample group was mostly Samsun.
Considering that genetic structure has as much effect as environmental factors on growth and height, the structure of the sample suggested that the social, economic, and labour effects on the human body could be revealed more clearly by relatively avoiding genetic and ecological factors. For this reason, Samsun seemed suitable for the groups that were the target of this study, because of both its socio-economic structure and its population structure.
The sample group consisted of female and male individuals between the ages of 20 and 45 who lived in Samsun, belonged to various socio-economic structures, and grew up under heavy-working conditions. The field survey was carried out cross-sectionally on 623 individuals, comprising 304 females and 319 males, between September 2018 and July 2019.
Information on Socio-economic Level and Business Line
However clear social level divisions may be in a country, there are gaps in knowledge concerning the main dynamics of this division. The shortage of comprehensive studies on understanding Turkey’s socio-economic structure and its change causes restrictions in performing studies (Kalaycıoğlu et al., Reference Kalaycıoğlu, Kardam, Rittersberger-Tılıç, Çelik and Türkyılmaz2008). This makes a retrospective determination of socio-economic level difficult. A retrospective socio-economic condition questionnaire was applied to the individuals to obtain information about their growth conditions in the adulthood stage. This questionnaire was prepared from the Socio-economic Status Index developed by Veri A.Ş. and mentioned in a study published by Kalaycıoğlu et al. (Reference Kalaycıoğlu, Kardam, Tuzun and Ulusoy1998) and was adapted for this research. The reliability of this questionnaire has been tested by in-depth interview, and it has been found that it can be used with the Turkish population. The questionnaire covers the variables of mean parental profession, mean parental education level, appliances in the house, and home ownership. Each variable has one point, and the points of the variables form the total score. The higher and lower strata are determined by the calculated total score. Individuals in the socio-economic strata so determined were at the same time asked about their current occupation and their educational and income levels. In this way, information was obtained on their socio-economic status both during the growth period and in adulthood. Another variable researched in this study was heavy working conditions in childhood. Duyar (Reference Duyar2013), in studies on child workers, called attention to various methodological deficiencies in ‘workforce’ studies, and said that the type of work and working conditions of individuals should be determined as being ‘heavy’ or ‘light’. In these studies, individuals are determined as ‘working’ or ‘not working’ according to their current situation. However, this evaluation is wrong, because individuals’ working situation and length of time working do not allow a complete evaluation in current situations. In addition, studies conducted on this problem in the local and international literature are limited, which restricts evaluation of the results of data analysis. This makes the formation of a control group more important (Duyar, Reference Duyar2013). The sample was first divided into two different groups for the questionnaire: a high socio-economic group (n:202) (HSG) and a low socio-economic group (LSG). To understand the effects of physical stresses, the low socio-economic group was then divided into two subgroups: nonheavy workers (NHWG) (n:210) and heavy workers (HWG) (n:211) during the growth period. With this grouping, the high socio-economic group formed the control group.
In Turkey, a developing country, socio-economic levels vary in terms of gross domestic product (GDP) and GDP per capita. According to World Bank data, per capita national income in Turkey for the age range of the sample (year of birth 1973-1999) was largely stable at 1952 USD. There was a large increase in national income in 2004 and afterwards (World Bank, 2021). Despite this stability and change, income inequality in the country has always been widespread. The income imbalance causes those who are well off to become richer, and the poor to become poorer (Erdoğan, Reference Erdoğan2004).
Table 1 summarizes the data on the families in the sample and their socio-economic structure. Table 1 shows that for both sexes, the socioeconomic conditions of the families are distinguished in both socio-economic sub-groups - from HSG (p<0.05). There is no difference between the NHWG and the HWG in terms of socio-economic characteristics (p>0.05). On the other hand, when socio-economic characteristics are compared between generations, it is seen that individuals’ occupation distributions are similar to those of their parents, particularly the father (p>0.05). Education level is slightly higher in the HWG (p<0.05), but it is still at a low level. This observed increase is a reflection of the ‘continuous education’ policies in the country.
The Distribution of the Sample’s Own and Their Families’ Socio-economic Characteristics in Different Socio-economic Groups
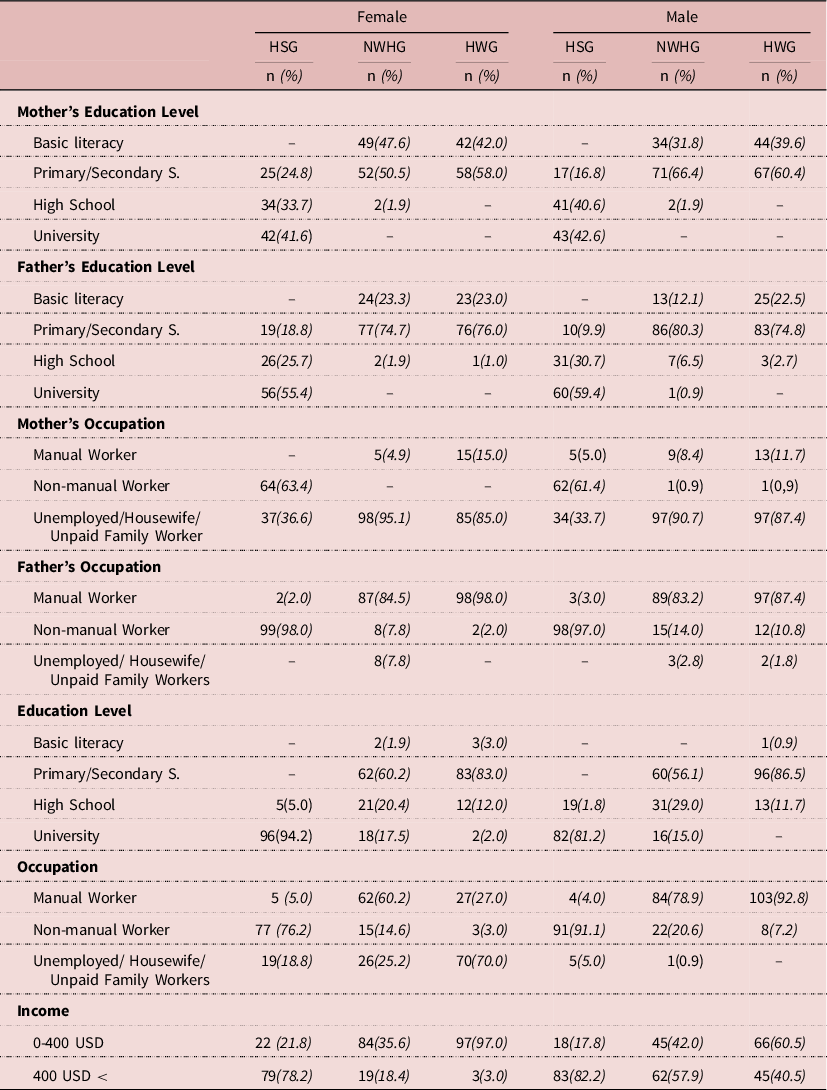
1-Mother’s and father’s educational and professional groups were compared pairwise between groups with the Kruskall-Wallis test HSG-NHWG=p<0.05; HSG-HWG=p<0.05; NHWG-HWG=p>0.05. 2-Individuals’ own education levels, professions and income levels were compared pairwise between groups with the Kruskall-Wallis test HSG-NHWG=p<0.05; HSG-HWG=p<0.05; NHWG-HWG=p<0.05. 3-The groups’ parents’ and their own education and professions were compared with the chi-square test HSG-NHWG=p>0.05; HSG-HWG=p>0.05; NHWG-HWG=p>0.05.
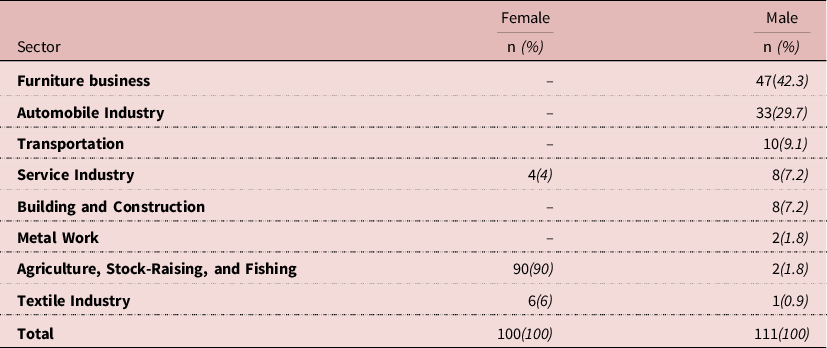
At the time when the study was conducted, the minimum wage in Turkey was less than 400 USD. The income levels of individuals in both LSGs was low (Table 1). Moreover, there is a strong correlation in Turkey between education level and poverty. According to data for 2006, 84% of poor people were either illiterate or had not completed basic education (Aran et al., Reference Aran, Demir, Sarıca and Yazıcı2010). This shows that there is always a socio-economic separation between HSGs and LSGs. At the same time, this data shows that in both LSGs, socio-economic characteristics and the factors pushing individuals into working at an early age have hardly changed, and that they continue in to be poor. All groups were asked about their work status as children. There was no one in the high socio-economic group who had worked in childhood, but in the low socio-economic group manual work such as furniture business, automobile industry etc. was accepted as hard physical work (Kalaycıoğlu et al., Reference Kalaycıoğlu, Kardam, Rittersberger-Tılıç, Çelik and Türkyılmaz2008), and so the heavy working group was included in the low socio-economic group. The occupation distribution of the HWG is shown in Table 2. Furniture making (42.3%) and the auto industry (29.7%) were the highest in males, while agriculture-livestock raising and fishing (90%) were the highest in females. The high frequency of the agricultural sector in females is because agricultural employment is a determining sector for females from childhood to old age in this country (TURKSTAT, 2012; T.C. Aile ve Sosyal Politikalar Bakanlığı, 2014). In the HWG, agriculture was predominant for women and the industrial sector for men. These two sectors play an important role in child employment, and the working conditions are very harsh. In agriculture, children are employed for very low or no pay as family workers. Girls are more often employed without pay than boys (TURKSAT and ILO, 1999). Children working in this sector are exposed to climatic events and biological and chemical substances and have to lift and carry heavy loads. In the industrial sector, children mostly work in small businesses and workshops, and are exposed to ergonomic risks, chemicals, and poor physical and hygienic conditions (Duyar, Reference Duyar2017). In addition to this, the time spent working and the starting age also affect growth.
Occupation Distribution of Females and Males in the Low Socio-Economic Heavy-Worker Group
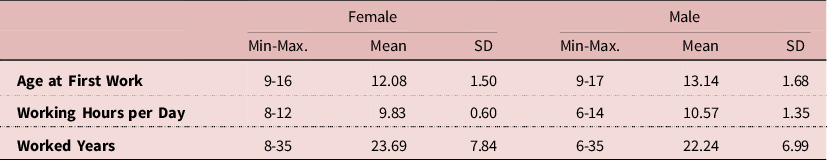
Individuals in the HWG were asked about the age at which they started working and their daily working hours (Table 3). In Turkey, the age range of child workers is from 6 to 17 (TURKSTAT and ILO, 1999; TURKSTAT, 2012). In the HWG, the age of starting work was 12.08 in women and 13.14 in men. With regard to working hours, the number of working hours per week is 47.7 hours. For child workers, working hours in the countryside were longer than in the cities, and shorter for girls than for boys (TURKSTAT and ILO, 1999). In the HWG, daily working hours were 9.38 for women and 10.57 for men. This means an average of 59.85 hours in a six-day working week.
Mean and Standard Deviation Values of Age at First Work, Working Hours per Day, and Worked Years
Anthropometric Measurements
A total of eight measurements of height, total lower leg length (iliospinal height), sitting height, total arm length, upper arm length, forearm length, upper leg length, tibia length were made in millimetres with a Martin-Type Anthropometer following the techniques prescribed by the Anthropometric Standardization Reference Manual (Lohman et al., Reference Lohman, Roche and Martorell1988) and the International Biological Program (Weiner and Lourie, Reference Weiner and Lourie1981). As suggested, measurements were taken from the left side, and it was ensured that individuals had minimum clothing. Repeated measurements were taken in a total of 20 individuals to test the reliability of the measurements and no statistically significant difference was found (p>0.05).
Statistical Analysis
The collected data was transferred to the computer and analysed with the SPSS (21.00) package program. Socioeconomic variables were analysed pairwise with the Kruskal-Wallis test and the Chi-square test. The data from three different socio-economic groups was tested with the Kolmogorov-Smirnov Test regardless of sex and it was found that the sample showed a normal distribution (p>0.05). Homogeneity of Variance was tested for all measures in males and females, and it was determined that variances were homogeneous (Levene’s Test p>0.05). Therefore, in the analysis of data, descriptive statistics, One Way Variance Analysis (ANOVA) and the Tukey test were used to determine inter-group differences. The error level was taken as 0.05.
Sitting height ratio (SHR) (Bogin, Reference Bogin2021), intermembral index, relative tibia length, relative thigh length, relative arm length, relative forearm length, brachial index, and crural index were calculated in order to determine body proportions (Oliver, Reference Oliver1969) (Table 4).

Results
Socio-economic Differences in Anthropometric Measurements
In anthropometric measurement means, except for sitting height in males, the HSG had the highest values. Table 5 shows anthropometric measurement means in all socio-economic groups. In body height, HSG was 40 mm taller in females and 52 mm in males than both LSG (NHWG-HWG). This result was statistically significant (p<0.001). In females, the differences were clear in both parts of the body, and values fell in both LSG. In total lower leg length, the difference between HSG and both LSG was significant (HSG-NHWG:p<0.001, HSG-HWG:p<0.001) (Table 6). In males, the difference between HSG and LSG in both sitting height (HSG-NHWG:p<0.001, HSG-HWG:p<0.001) and total lower leg length (HSG-NHWG:p<0.001, HSG-HWG:p<0.001) was statistically significant (Table 6). In body limbs, differences between HSG and the LSG were statistically significant in tibia length (HSG-NHWG:p<0.001, HSG-HWG:p<0.001), total arm length (HSG-NHWG:p<0.001, HSG-HWG:p<0.001) and upper arm length (HSG-NHWG:p<0.01, HSG-HWG p<0.01) in females, and in all body limbs in males (HSG-NHWG:p<0.001, HSG-HWG:p<0.001).
Mean and Standard Deviation Values of Anthropometric Measurements of Female and Male Individuals from Different Socio-Economic Groups
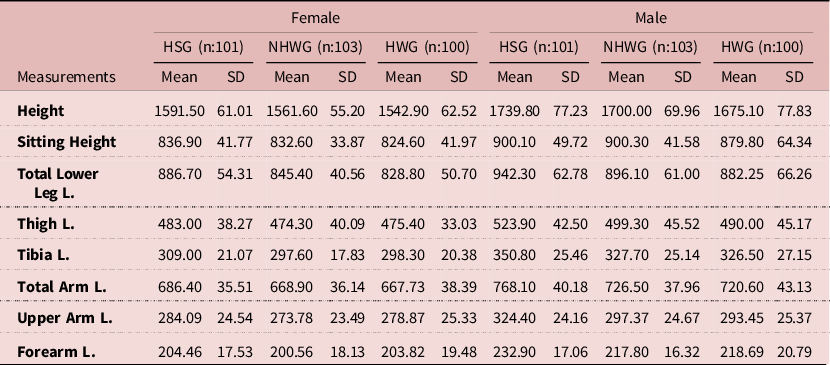
L.: Length HSG: High Socio-Economic Group NHWG: Low Socio-Economic Nonheavy-Worker Group HWG: Low Socio-Economic Heavy-Worker Group
ANOVA and Tukey Test Results of Anthropometric Measures of Female and Male Individuals from Different Socio-Economic Groups
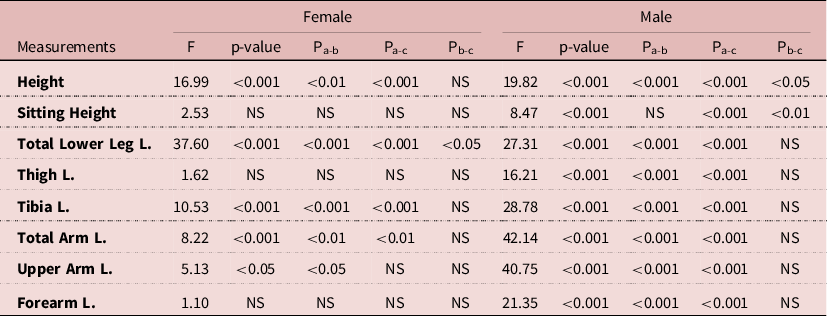
NS: Not Significant L.: Length a: High Socio-Economic Group b: Low Socio-Economic Nonheavy-Worker Group c: Low Socio-Economic Heavy-Worker Group
Socio-economic Differences in Proportional Values
The differences observed between HSG and both LSG were not at the same level for the different body parts. Table 7 gives the estimated proportional values of anthropometric measurements. According to this table, the SHR value was one percentage point higher in both sexes in the LSG. This result was statistically significant both in females (HSG-NHWG:p<0.05,HSG-HWG:p<0.05) and in males (HSG-NHWG:p<0.001, HSG-HWG:p<0.05). Intermembral index HSG was two percentage points longer than both LSG in females, and the differences were statistically significant (HSG-NHWG:p<0.05, HSG-HWG:p<0.001) (Table 8). According to this, upper body and limbs were longer in LSG. In addition, relative arm length values in males were statistically significant (HSG-NHWG:p<0.001, HSG-HWG:p<0.001). Regarding the lower limbs in males, relative tibia and thigh length was one percentage point lower in the LSG, and the difference between these groups was statistically significant (HSG-NHWG:p<0.001, HSG-HWG:p<0.001 and HSG-NHWG:p<0.05, HSG-HWG: p<0.05) (Table 8).
Mean and Standard Deviation Values of Calculated Body Ratios of Female and Male Individuals from Different Socio-Economic Groups
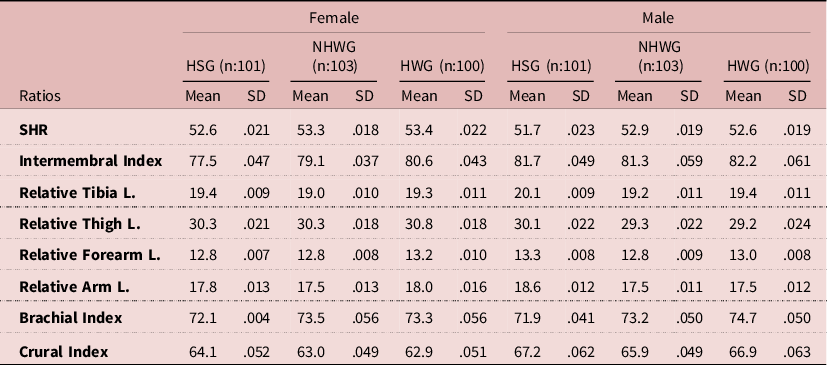
SHR: Sitting Height Ratio L.: Length a: High Socio-Economic Group, b: Low Socio-Economic Nonheavy-Worker Group c: Low Socio-Economic Heavy-Worker Group
Sitting Height Ratio = [Sitting Height /Height]x100, Intermembral Index=[Total Arm Length/Total Lower Leg Length]x100, Relative Tibia Length = [Tibia Length /Height] x 100, Relative Thigh Length=[Thigh Length/Height]x100, Relative Forearm Length = [Forearm Length/Height] x 100, Relative Arm Length = [Arm Length/Height] x 100, Brachial Index= [Forearm Length/Arm Length] x 100, Crural Index = [Tibia Length/ Thigh Length] x 100.
ANOVA and Tukey Test Results of Body Ratios of Female and Male Individuals from Different Socio-Economic Groups

NS: Not Significant L.: Length a: High Socio-Economic Group b: Low Socio-Economic Nonheavy-Worker Group c: Low Socio-Economic Heavy-Worker Group
Table 7 also gives the values of limbs relative to each other. In the upper limbs, according to the brachial index, HSG was one percentage point lower in females, and in males it was two percentage points lower than LSG. In the lower limbs, in the crural index, HSG was one percentage point higher than LSG in females, and two percentage points higher in males’. However, no significant differences were found in this value between the groups in either sex (Table 8).
The Effect of Heavy Working Conditions on the Body in Both Sexes
Table 5 shows that the HSG individuals had greater values for measures of body parts and limbs. Differences between HSG and HWG were highest between the three groups. In both subgroups, nonheavy-working individuals of both sexes had greater height, total lower leg length, sitting height, and total arm length compared to heavy-working individuals (Table 5). In the LSG, the difference between heavy-working and nonheavy-working individuals was statistically significant in total lower leg length (p<0.001) in females, and in height (p<0.001) and sitting height (p<0.01) in males (p<0.05) (Table 6). Heavy working conditions affected height by -19 mm in females and by -25 mm in males. Also, it caused total lower leg length to be 16.6 mm less females and sitting height to be 20.5 mm less in males (Table 5). For body limbs, the difference in the lengths of the upper leg, tibia, upper arm, and forearm in females and the length of the forearm in males was lower, but this was not statistically significant (p>0.05) (Table 6).
Table 7 shows that the intermembral index was 1.5 percentage points greater in heavy-working females and 0.9 percentage points greater in heavy-working males (Table 7). According to Table 6, it was statistically significant in females (p<0.05) (Table 8). In females, relative forearm length and relative arm length were approximately one percentage point greater, and this was statistically significant (p<0.05; p<0.05) (Table 8).
Discussion
Socio-economic Differences
Children from different socio-economic strata have different body sizes at all ages, and the high socio-economic group shows greater values (Tanner, Reference Tanner, Harrison, Tanner, Pılbeam and Baker1988; Lasker and Mascie-Taylor, Reference Lasker and Mascie-Taylor1989; Stinson, Reference Stinson, Stinson, Bogin and O’Rourke2012). In support of other studies, it was found in this study that anthropometric dimensions differed from each other in females and males growing up in different socio-economic conditions, and that the HSG had greater values in all measures. Studies conducted on childhood growth have confirmed that the children of families from high social classes are taller (Tanner, Reference Tanner1981; Peck and Lundberg, Reference Peck and Lundberg1995; Mascie-Taylor, Reference Mascie-Taylor1991; Koziel et al., Reference Koziel, Gomula and Malina2019). According to Kuh et al. (Reference Kuh, Power and Rodgers1991), of those whose father was a qualified worker, unqualified female adults were 1.61cm taller and adult males were 1.97cm taller. Similarly in Switzerland, adults with unqualified worker children were shorter, and adults with children with a seniority salary were taller (Peck and Vågerö, Reference Peck and Vågerö1987). There was also a height difference in this sample of adults who grew up under different socio-economic conditions. In both LSGs (NHWG and HWG), males and females tended to have shorter stature.
In studies conducted in provinces of Turkey such as Istanbul and Ankara, where strata differences are evident, the anthropometric dimensions of children growing up under optimal conditions have shown greater values (Neyzi et al., Reference Neyzi, Yalcındag and Alp1973; Onat and Ertem, Reference Onat and Ertem1995; Duyar, Reference Duyar1990; Nebigil et al., Reference Nebigil, Hizel, Tanyer, Dallar and Coskun1997; Özdemir et al., Reference Özdemir, Erçevik and Çalışkan2005). In contrast, children growing up in poverty are shorter and weaker (Gültekin et al., Reference Gültekin, Hauspie, Susanne and Güleç2006). Unfortunately, there have not been enough studies in Turkey to understand the effects of adverse living conditions on physical development and body composition in the final dimensions (Özener, Reference Özener2010). Özener (Reference Özener2010) determined that poor individuals in the 18-year-old group were weaker and shorter than their wealthy peers. Saatçioğlu (Reference Saatçioğlu1972) found that the anthropometric values of university graduates were greater in a group aged 20-45 comprised of university graduates and skilled and unqualified workers. It was emphasized in that study that the class structures of the sample were similar to those of their families and revealed the relationship between socio-economic level and anthropometric dimensions. The results obtained with these data are comparable to other cross-sectional studies conducted in Turkey (Saatçioğlu, Reference Saatçioğlu1972; Neyzi et al., Reference Neyzi, Yalcındag and Alp1973; Onat and Ertem, Reference Onat and Ertem1995; Duyar, Reference Duyar1990; Nebigil et al., Reference Nebigil, Hizel, Tanyer, Dallar and Coskun1997; Özdemir et al., Reference Özdemir, Erçevik and Çalışkan2005; Özener, Reference Özener2010). It shows that different socio-economic backgrounds lead to significant differences in height in adults.
Socio-economics Differences on Body Parts
A group of studies conducted on children suggested no significant correlation between leg length and socio-economic level (Cankur et al., Reference Cankur, Gülesen, İkiz, Şendemir, Oygucu, Çimen and Erem1993; Tuncer, Reference Tuncer2007; Webb et al., Reference Webb, Kuh, Peasey, Pajak, Malyutina, Kubinova, Topor-Madry, Denisova, Copkova, Marmot and Bobak2008; Kinra et al., Reference Kinra, Sarma, Hards, Smith and Ben-Shlomo2011; Sohn, Reference Sohn2015). It was stated that childhood conditions affected both parts of the body in the same way (Webb et al., Reference Webb, Kuh, Peasey, Pajak, Malyutina, Kubinova, Topor-Madry, Denisova, Copkova, Marmot and Bobak2008), and that leg length was not a sensitive indicator distinct from sitting height (Patel et al., Reference Patel, Lawlor, Kramer, Davey Smith, Bogdanovich, Matush and Martin2011). On the other hand, most of the studies have shown that the variation observed in stature between generations is mainly due to leg length (Himes, Reference Himes1979, Tanner et al., Reference Tanner, Hayashi, Preece and Cameron1982; Ohyama et al., Reference Ohyama, Hisanaga, Inamasu, Yamamoto, Hirata and Ishinishi1987; Takamura et al., Reference Takamura, Ohyama, Yamada and Ishinishi1988; Duyar, Reference Duyar1995; Hauspie et al., Reference Hauspie, Vercauteren and Susanne1997; Cole, Reference Cole2003; Malina et al., Reference Malina, Pena Reyes, Tan, Buschang, Little and Koziel2004; Koca Özer, Reference Koca Özer2007). Leitch (Reference Leitch1951) suggested that good nutritional conditions in infancy and childhood affect leg length and that leg length is associated with improved living conditions. According to Bogin (Reference Bogin and Hermanussen2013), good nutrition and health conditions accelerate the growth of the legs. A longer leg length is always a reflection of advantageous living conditions and good health (Bogin, Reference Bogin, Cameron and Bogin2012). According to Himes (Reference Himes1979), although height depends on bone growth in every part of the body, the growth rates of these two parts differ, and long bones respond more or less to the long-term factor than do the vertebrae. In addition, Wadsworth et al. (Reference Wadsworth, Hardy, Paul, Marshall and Cole2002) found out that leg length was related to breast milk and energy intake. Buschang et al. (Reference Buschang, Malina and Little1986) stated that the differences between a well-nourished and a malnourished group were a result of their leg length, and this also explained their height difference. Some similar studies have argued that leg length increases as socio-economic conditions improve and rise (Bogin et al., Reference Bogin, Smith, Orden, Silva and Loucky2002; Duyar, Reference Duyar1997b), and decreases as socio-economic conditions worsen (Li et al., Reference Li, Dangour and Power2007).
Individuals under optimal conditions are considered to be more advantaged in terms of nutrition and health. Hence, the HSG provides these advantages more easily. In relation to this, in high socio-economic conditions, leg length tends to be affected positively, and this finding provides substantial support to the data previously presented. The SHR value was one percentage point greater in both LSGs, which showed that the low socio-economic group had shorter legs. As a result, it could be assured that the limbs are affected less than other body parts in both low socioeconomic groups.
In this sample, similar to the other studies, leg length was positively affected in the HSG, who had better life conditions in childhood. This observed change is very evident among males. Vercellotti and Piperata (Reference Vercellotti and Piperata2012) argued that intra-population variation is apparent in the body proportions of Amazonian females and males. According to their study, the legs of males are longer than those of females. Oliver (Reference Oliver1969) stated that males have longer dimensions than females of the same height. This distinction is probably due to the differences in growth between the sexes. Bowles (1932 as cited in Himes, Reference Himes1979) observed a difference between parents and children and determined that the difference was more significant in leg length in boys and sitting height in girls. The data of the present study are in parallel with these findings. The fact that females are less affected is related to limited leg growth in the growing period due to the release of the hormone estrogen in the pre-pubertal period (Bostancı, Reference Bostancı1955; Schooling et al., Reference Schooling, Jiang, Heys, Zhang, Lao, Adab, Cowling, Thomos, Cheng, Lam and Leung2008). Therefore, in adolescence, sitting height is greater in girls than in boys, and leg length is greater in boys than in girls (Malina et al., Reference Malina, Pena Reyes, Tan, Buschang, Little and Koziel2004; Bundak, Reference Bundak2010; Hattori et al., Reference Hattori, Hirohara and Satake2011). In addition, although it is not entirely clear, this maturation process in girls brings them closer to adulthood. Therefore, girls have a shorter time to respond to environmental stresses (Bogin, Reference Bogin2021). According to the data obtained, this makeup gained in adolescence may be reflected in limited size.
Socio-economics Differences in Body Limb Proportions
According to Jantz et al. (Reference Jantz, Jantz and Devlin2016), the differences observed in height usually stem from the bones of the limbs. Differences observed in the limbs indicated that the lower limbs of the body exhibited more allometric structure than the upper limbs, and the upper limbs were more isometric with height (Jantz and Jantz Reference Jantz and Jantz1995, Reference Jantz and Jantz1999; Tacar et al., Reference Tacar, Dogruyol and Hatipoglu1999; Kryst et al., Reference Kryst, Żegleń, Dasgupta, Saha, Das and Das2019). Some researchers have even suggested that external factors affected the distal limbs more (radius-ulna and tibia-fibula), especially the tibia length, among all body limbs (Holliday and Ruff, Reference Holliday and Ruff2001; Auerbach and Sylvester, Reference Auerbach and Sylvester2011; Koziel et al., Reference Koziel, Gomula and Nowak-Szczepańska2016). In this study, the allometric structure of the body was evident in the face of socio-economic conditions. Socio-economic conditions affected the lower and upper limbs differently in both sexes. This differentiation was more noticeable in males. Duyar and Pelin (Reference Duyar and Pelin2003) determined that the height also increased as the relative tibia length rose in different socio-economic groups. In the results of the present study, upper leg and tibia lengths decreased as life conditions worsened. The proportional value of the upper leg length and tibia length with height was constant in females, but more variable in males. Therefore, it can be said that different conditions affect the tibia length more. Indeed, as in the Samsun example, Koziel et al. (Reference Koziel, Gomula and Nowak-Szczepańska2016) drew attention to differences in lower leg length in an ethnically homogeneous Polish sample and suggested that this was due to differences observed in social conditions rather than to genetic structure. Also, Duyar (Reference Duyar1997a) stated that the change in the lower limbs making up the leg caused differences within and between societies. The results of this study indicate that the crural index increases in HSG, while the brachial index increases in both LSGs. According to this, it may be proposed that the distal limbs cause variation in arms and legs in males and females.
Effect of Physical Stress on Body Size and Proportions
The underlying causes of outcomes observed in the low socio-economic group have a complex relationship. However, income, nutrition, and intensive work are particularly determinative of height. Extreme poverty and constant malnutrition during growth cause growth retardation and short stature (Steckel, Reference Steckel1995, Reference Steckel, Komlos and Kelly2016). In this study, both LSGs had lower values of height, total lower leg length, sitting height, and overall arm length compared to individuals growing under optimal conditions. In heavy-working individuals in the LSG, these values were even lower (Table 5). Tanner (Reference Tanner1981) stated that the growth retardation seen in child workers in British industrialization was not temporary but continued into adulthood. He emphasized that the reason for this was also poor nutrition and living conditions.
Baysal (Reference Baysal2003) states that the nutrition level of children forced to work by social and economic inequalities is very low. On the other hand, the energy needs of working children are greater than non-working children (Duyar and Özener, Reference Duyar and Özener2003; Etiler et al., Reference Etiler, Caglayan, Cizmecioglu, Yavuz, Hatun and Hamzaoglu2011). Studies conducted on worker groups and child workers demonstrated that working individuals had an unbalanced and inadequate diet (Soydal et al., Reference Soydal, Yıldırım and Aycan2001; Özarslan and Güneyli, Reference Özarslan and Güneyli1983; Tomak et al., Reference Tomak, Coşkun, Elmacıoğlu and Pekşen2009; Kaner et al., Reference Kaner, Soylu, Başmısırlı and İnanç2015), while the most common health problem among working children was malnutrition (Omokhodion and Omokhodion, Reference Omokhodion and Omokhodion2004; Ibrahim et al., Reference Ibrahim, Abdalla, Jafer, Abdelgadir and De Vries2018). In a study on Vietnamese children, O’Donnell et al. (Reference O’Donnell, Rosati and Van Doorslaer2005) stated that working does not affect growth. However, many studies have maintained that working children are shorter and weaker than non-working children (Tanner, Reference Tanner1981; Raina et al., Reference Raina, Bhan and Bhat1990; Ambadekar et al., Reference Ambadekar, Wahab, Zodbey and Khandait1999; Duyar and Özener, Reference Duyar and Özener2003, Reference Duyar and Özener2005; Özener and Duyar, Reference Özener and Duyar2004; Omokhodion and Omokhodion, Reference Omokhodion and Omokhodion2004; Pasdar et al., Reference Pasdar, Darbandi and Nachvak2014; Demir, Reference Demir2018).
Studies on this subject principally concentrate on the relationship between socio-economic level and nutrition in children. However, a study in which Hawamdeh and Spencer (Reference Hawamdeh and Spencer2002) compare children with their siblings is noteworthy. According to the results of the study, the height of children working at the age of 11-15 was significantly less than that of their siblings aged 10-15. Since their siblings were at the same socio-economic level, it was seen that the growth retardation in child workers could not be explained only by nutrition. In the same way, Shah (Reference Shah1984) reported that children who started working at the age of 14 or earlier were 4cm shorter than those who started working after the age of 18. They said that the reason for this was both insufficient nutrition and the increase in long hours of hard work. The social and economic differences between the HWG and the NHWG are broadly similar to this. As Table 1 shows, both groups have caused a continuation of the poverty which they inherited from their families. In this way, it can be said that these two groups have relatively similar probabilities of exposure to physiological stresses such as nutrition and illness. The observed difference in the HWG within this similarity can only be explained by physical pressure connected to conditions of heavy work. In addition to physical pressure, working children are exposed to inadequate lighting, ventilation and heating and poor hygiene conditions, depending on their line of work and work environment (İşeri et al., Reference İşeri, Sözen, Melik, Yavaşcan, Başkesen, Çoker and Yaprak2005; Tor, Reference Tor2010; Göl, Reference Göl2016). All these circumstances cause significant growth retardation, short stature, spinal degeneration, and lifelong deformities in child workers (Çağlayan et al., Reference Çağlayan, Hamzaoglu, Yavuz and Yuksel2010; Rahman et al., Reference Rahman, Mistry and Hossain2014; ILO, 2020; İşeri et al., Reference İşeri, Sözen, Melik, Yavaşcan, Başkesen, Çoker and Yaprak2005; Hawamdeh et al., Reference Hawamdeh, Spencer and Waterston2001).
Among the limited number of studies concerning adults, that of Cortez et al. (Reference Cortez, Barbieri, Bettiol, da Silva and Cardoso2007) claimed that adult females and males aged 23-25 with a working background were shorter in stature. However, Cortez et al. (Reference Cortez, Barbieri, Bettiol, da Silva and Cardoso2007) emphasized that the parameters they determined were insufficient, and therefore their result was controversial. On the other hand, Dantas and Santana (Reference Dantas and Santana2010) found that females and males aged 18-65 with a childhood work history were relatively short. Saatçioğlu (Reference Saatçioğlu1972), in a study conducted in Turkey in general, found that qualified workers were 2cm taller than unqualified males and 1cm taller than unqualified women. Similarly, Walker et al. (Reference Walker, Shaper and Wannamethee1988) reported that professionals aged 40-59 in England were 6cm taller than unskilled manual workers. In a study comparing the anthropometric dimensions of different occupational groups, Hsiao et al. (Reference Hsiao, Long and Snyder2002) discovered that the height of agricultural workers was 2.8 cm less in females and 2.5 cm less in males in all occupations. In this study, height was 19 mm less in females from the HWG and 25 mm less in males from the HWG. This result is also evident in sitting height and total lower leg length. In a study conducted in Japanese society, Kouchi (Reference Kouchi2004) found that the sitting heights of working children had increased rapidly in the previous 30 years. Likewise, Duyar and Özener (Reference Duyar and Özener2003) conducted a comparative study on male child workers in Turkey. They stated that physical strength did not affect the body at the same rate, and that the difference in the total lower leg lengths and tibia lengths was clear (Duyar and Özener, Reference Duyar and Özener2003).
The intermembral index showed the most significant proportional difference. This index value was 1.5 percentage points greater in the HWG females and 0.9 percentage points in males (Table 7). Heavy workers had longer arms than nonheavy workers. This was observed more clearly in females. On the other hand, the SHR was similar in both groups. Similarly, Demir (Reference Demir2018) stated in a comparative study on working girls that the ratio of height to arm and leg lengths developed proportionally in working and non-working individuals. On the contrary, Duyar and Özener (Reference Duyar and Özener2003) found that heavy-working boys had relatively longer bodies and longer arms. Also, in a study comparing different occupational groups, Hsiao et al. (Reference Hsiao, Long and Snyder2002) claimed that females dealing with machinery and repair work had longer upper arms. All these data are a clearer indicator not so much of the mean differences between HGW and NHWG, but of the change created by physical pressure in the observed differentiation.
Duyar and Özener (Reference Duyar and Özener2003) suggest that these observed changes can be explained by the adaptation of the human skeletal structure to stresses. Several studies have determined that length measures are more affected by genetic structure than are width measures (Susanne, Reference Susanne1977; Sharma, Reference Sharma1987; Bogin, Reference Bogin2021). However, as explained in the material and method section, the sample was considered to be genetically homogeneous, the effects of different stresses are also evident in length measures. It has been stated that the diaphyseal bone has plasticity (Trinkaus et al., Reference Trinkaus, Churchill and Ruff1994) and that the transverse dimensions of the bone can change significantly under mechanical stimuli (Ruff et al., Reference Ruff, Trinkaus, Walker and Larsen1993; Trinkaus et al., Reference Trinkaus, Churchill and Ruff1994; Ruff, Reference Ruff, Katzenberg and Grauer2019). Based on Wolf’s Law, ‘bone functional adaptation’ explains the response of the bone to physical stress, i.e., its adaptation and shaping to the mechanical environment (Larsen, Reference Larsen2015; Ruff, Reference Ruff, Katzenberg and Grauer2019). The primary forces affecting the bone are tension, compression, shearing, bending, and torsion (Larsen, Reference Larsen2015). Among these forces, tension and compression can give an idea about the shortening and elongation tendencies of body limbs in the HWG. Tension occurs when equal and opposite forces are applied outward, while the mechanism of the compression is the opposite (Larsen, Reference Larsen2015). Probably, the longer arms of the heavy working group are related to their body and arm heavy working. It may be a result of repeated tension movements in connection with their work, and the shorter lower member length may result from compression from above. This result shows that along with width measurements, lengths can be affected by physical pressures.
The effect levels of physical stresses are also evident between the sexes. While there are no proportional differences in the lower limbs of females, it was seen that especially the distal limbs are affected by physical stresses in males. This distinction observed between females and males stems from the difference in the response of the sexes to stress. It is widely postulated that females are more ‘buffered’ than males in the face of environmental stresses (Stinson, Reference Stinson1985; Bogin, Reference Bogin2021). However, Stinson (Reference Stinson1985) stated that this result is open to testing, and researchers should also consider the cultural environment in which people live. For instance, Vercellotti and Piperata (Reference Vercellotti and Piperata2012) pointed out that although adult Amazonian females had more disadvantages in their bio-cultural background, this was not reflected in their body proportions. This study indeed had a similar outcome. In the rural areas of Samsun, males usually work in paid jobs outside the village, while females share the work in agricultural production, animal care, childcare, and domestic work (Gündüz Hoşgör and Suziki Him, Reference Gündüz Hoşgör and Suziki Him2016). Likewise in this study, the work of heavy-working females was mainly in agriculture. Despite the more intense stress, it is possible that the HWG females were less affected by such physical stresses. On the other hand, traditional Turkish family structure regards boys as socially and economically more functional. Hence, males are valued more with the expectation of this functionality (Kağıtçıbaşı, Reference Kağıtçıbaşı1993). However, this study indicated that males were relatively more affected by external factors despite their socio-cultural advantages. This outcome supports the hypothesis that environmental stresses impact males more (Stinson, Reference Stinson1985; Peck and Vågerö, Reference Peck and Vågerö1987; Vercellotti and Piperata, Reference Vercellotti and Piperata2012; Bogin, Reference Bogin2021).
In conclusion, similar to the numerous studies on children have shown, the effects of different social, economic, and physical stresses were observed in dimensions of adults. The HSG had values representing optimum conditions in all measurements. These differences were observed in body proportions. Leg length was greater in the HSG, while in both LSGs, arms were longer. It can be said that this difference, which was observed in both sexes, originates with distal limbs. According to this, LSG males and females are represented with shorter legs and longer arms. In this, the lower limbs tend to be more affected by external factors, in a way which supports the literature.
This cross-sectional study gives very important information on physical stress on the human body and proportional relations. According to the results of this study, it can be said that in disadvantageous conditions, physical pressures can cause an interruption in growth. Tests were made as to whether labour affected growth and development and it was found that height, sitting height, total lower leg length, and overall arm length were greater in the NHWG. The difference in limbs was relatively small, and this was the case for both sexes. The values of the upper limbs of heavy working individuals were proportionally greater. In particular, the arms of the heavy-working group were relatively longer. Almost no differences were observed in the body and limbs of females, except for their arms. On the contrary, more significant differences were observed in males. It can be concluded that not only the physiological stress related to the socioeconomic situation, but also physical stress, is effective in shaping the body size and proportion. The results of heavy working conditions resulted in long arms and short legs in HWG.
Acknowledgement
This study was produced from a doctoral thesis titled “The Effect of Physical and Physiological Stress on Body Proportion in Different Socioeconomic Groups”. We would like to thank Dr. M Melis Koruyucu for editing the language, and her help, and advice with this article. Thank Dr. Elif B. Aksoy for her contributions in determining the socio-economic level and Demet Delibaş who made the final readings. Thanks to all participants and workers for agreeing to participate in the study in data collection. We are grateful to Hadiye Sönmez, Ömer Faruk Sönmez, Ahmet Karataş and Mehmet Yangın for their assistance during the fieldwork. We would finally like to sincerely thank the reviewer(s) for their comments and suggestions which helped to improve this paper.
Funding
This research received no specific grant from any funding agency, commercial entity, or not-for-profit organization.
Conflict of interest
The authors have no conflicts of interest to declare.
Ethics
The necessary permission was obtained from the Governorship of Samsun Province for the implementation of the study. The study was conducted with the permission of Hacettepe University Non-Interventional Clinical Research Ethics Committee (27.11.2018/1699557-2137).


 Open access