


1. Introduction
How macroeconomic variables or financial variables respond to changes in monetary policy stance has been a long-standing question in economics. In particular, the response of exchange rate to a monetary policy shock has attracted attention from many economists since the seminal work by Eichenbaum and Evans (Reference Eichenbaum and Evans1995). International macroeconomic models based on the uncovered interest rate parity (UIP) hypothesis, such as the Dornbusch (Reference Dornbusch1976) model, often predict that the exchange rate will appreciate instantaneously and depreciate gradually in response to a contractionary monetary policy shock. However, results in many empirical studies are not supportive to this theoretical implication. Employing structural vector autoregression (SVAR) with recursive identification restrictions, Eichenbaum and Evans (Reference Eichenbaum and Evans1995) and subsequent studies have reported that instant appreciation is not clearly observed and, if appreciation occurs, it does so gradually, with its peak occurring a few years after the contractionary monetary policy shock. The first phenomenon is often called as the exchange rate puzzle while the second one has been termed as the delayed overshooting puzzle (see Bjørnland (Reference Bjørnland2009)).
There have been two approaches to address the puzzling response of the exchange rate to a monetary policy shock. The first one provides a theoretical rationale for the empirical findings. Gourinchas and Tornell (Reference Gourinchas and Tornell2004) propose a model in which investors have misperception on the persistence of interest rate differential to explain the delayed overshooting response of the exchange rate and the failure of the UIP. To understand the delayed overshooting reaction, Bacchetta and van Wincoop (Reference Bacchetta and van Wincoop2010) develop a model with infrequent portfolio adjustment. Müller et al. (Reference Müller, Wolf and Hettig2024) show that information rigidities are needed to account for the unclear initial response and delayed overshooting. Gürkaynak et al. (Reference Gürkaynak, Kara, Kisacikoglu and Lee2021) examine whether the information effect can explain the depreciation of the exchange rate in response to tightening monetary policy and find that the information effect plays a role but does not fully account for the puzzling response.
The second approach puts forward alternative empirical specifications to obtain instant appreciation and immediate overshooting in response to a contractionary monetary policy shock as the Dornbusch (Reference Dornbusch1976) model predicts. Unlike Eichenbaum and Evans (Reference Eichenbaum and Evans1995), alternatives to recursive identification strategies have been proposed. Kim and Roubini (Reference Kim and Roubini2000) propose a non-recursive identification restriction, and Bjørnland (Reference Bjørnland2009) applies a hybrid identification restriction combining recursive and long-run restrictions. Although these studies have produced some successes for non-US countries, a number of recent contributions have restored instant overshooting in response to a monetary policy shock in the US setup. Employing sign restrictions proposed by Scholl and Uhlig (Reference Scholl and Uhlig2008), Kim et al. (Reference Kim, Moon and Velasco2017) argue that those puzzles disappear once the period of Volcker chairmanship is dropped from the sample. Forni and Gambetti (Reference Forni and Gambetti2010) find that the delayed overshooting disappears once a structural factor model with 112 time series is applied. Once identifying monetary policy shocks as shifts in entire yield curves, Inoue and Rossi (Reference Inoue and Rossi2019) find favorable evidence to immediate overshooting with the use of daily data. Rüth (Reference Rüth2020) explores a VAR with external instruments, namely high-frequency monetary surprise around policy announcements, and demonstrates that the exchange overshoots immediately. Combining sign restrictions by Scholl and Uhlig (Reference Scholl and Uhlig2008) with narrative restrictions on monetary policy shocks, Rüth and Van der Veken (Reference Rüth and Van der Veken2023) show that the delayed overshooting puzzle becomes mitigated.
In this paper, we attempt to make a contribution to the second approach employing the SVAR approach. Although SVAR is a common methodology in this literature, our approach differs from previous studies in several respects. First, our SVAR system includes not only typical macroeconomic variables such as output, consumer price index (CPI), domestic and foreign interest rates, the excess bond premiumFootnote 1 , and exchange rate, but also uncertainty measures. There have been studies on the relation between monetary policy and uncertainty. Vavra (Reference Vavra2014) demonstrates that the effect of monetary policy depends on the level of uncertainty because higher uncertainty leads to greater price flexibility at the aggregate level. Aastveit et al. (Reference Aastveit, Natvik and Sola2013) also argue that when uncertainty is high, monetary policy becomes less stimulating because firms postpone investment awaiting the resolution of uncertainty. Empirical studies such as Bekaert et al. (Reference Bekaert, Hoerova and Duca2013) present that monetary policy can affect financial uncertainty, while Carriero et al. (Reference Carriero, Clark and Marcellino2021) argue that monetary policy also responds to financial uncertainty shocks. Kang and Park (Reference Kang and Park2024) show that monetary policy interacts with real and financial uncertainties, and the effect of monetary policy depends on uncertainties.
In addition, Lilley et al. (Reference Lilley, Maggiori, Neiman and Schreger2022) show that global risk measures such as the VIX changes have strong connections with exchange rates during the 2000s and 2010s, which implies that uncertainty measures may influence the exchange rate dynamics directly. To reflect both concerns (one is to identify and examine monetary policy shocks correctly and the other is to investigate a possible dynamic link between exchange rates and uncertainties), we have put real uncertainty and financial uncertainty in the SVAR system along with output, CPI, domestic and foreign interest rates, the excess bond premium, and exchange rate.
Second, we impose a shock-restricted identification strategy to identify structural shocks instead of the contemporaneous or sign restrictions used in previous studies while employing the SVAR approach. Introducing uncertainties into the SVAR system, it is not clear how to determine the ordering of the variables in SVAR or how to enter zeros into the contemporaneous relation between variables. That is because no theoretical consensus has been established for the relation between macroeconomic variables and uncertainty measures. More importantly, Ludvigson et al. (Reference Ludvigson, Ma and Ng2021) (LMN, hereafter) demonstrate that real uncertainty is not exogenous but endogenously interacts with macroeconomic variables.
In addition to the endogeneity of uncertainty, Kim and Roubini (Reference Kim and Roubini2000), Bjørnland (Reference Bjørnland2009) and Rüth (Reference Rüth2020) emphasize the contemporaneous interaction between interest rate and exchange rates as a factor in resolving the delayed overshooting puzzle. To account for the potential endogeneity of uncertainty and the possible contemporaneous interaction between variables, we adopt a shock-restricted identification strategy to identify structural shocks instead of recursive or sign restrictions. The shock-restricted SVAR approach was initiated by Ben Zeev (Reference Ben Zeev2018) and has been applied in studies such as LMN, Kang and Park (Reference Kang and Park2024), and Baker et al. (Reference Baker, Bloom and Terry2024). The approach is conceptually similar to the Bayesian approach of Antolín-Díaz and Rubio-Ramírez (Reference Antolín-Díaz and Rubio-Ramírez2018).
Our shock-restricted SVAR consists of event constraints and external variable constraints. While the reduced-form data relationship admits infinitely many shock series, we identify structural shock series that satisfy constraints imposed by key historical events (i.e., event constraints) and constraints on non-zero correlations between structural shocks and variables external to the SVAR (i.e., external variable constraints). The rationale behind the shock-restricted SVAR is that credible identification scheme should generate structural shock estimates consistent with ex-post interpretation of historical events or aligned well with established economic concepts defining the features of a shock. While imposing those constraints, we try to maintain the restriction on the relationship between uncertainties and other variables used in previous studies, such as LMN and Kang and Park (Reference Kang and Park2024) studying the effect of uncertainty in a closed economy setup, to avoid arbitrariness regarding constraints. We also conduct inference by extending the wild-bootstrap procedure developed by Gonçalves and Kilian (Reference Gonçalves and Kilian2004).
Analyzing the structural shock series that satisfy all event and external variable constraints yields several notable findings. First, the US exchange rate appreciates immediately in response to contractionary monetary policy shocks, with peak appreciation occurring within one to two months. Second, even when employing shock-restricted SVAR with event and external variable constraints, exchange rates responses become insignificant if we shut off the contemporaneous responses of uncertainty measures to other shocks or the contemporaneous responses of other variables to uncertainty shocks. This indicates that accounting for uncertainty measures is important not only in closed economy models but also in the analysis of exchange rate behavior. Third, our shock-restricted SVAR allows for the contemporaneous interaction between interest rate and the exchange rate. This is important because exchange rate responses become insignificant when we shut off the contemporaneous interaction between the two variables in a counterfactual analysis. We discuss similarities and differences between our restrictions and the non-recursive identification restrictions employed in previous studies, such as Kim and Roubini (Reference Kim and Roubini2000), Bjørnland (Reference Bjørnland2009), Kim et al. (Reference Kim, Moon and Velasco2017), Rüth (Reference Rüth2020) and Rüth and Van der Veken (Reference Rüth and Van der Veken2023).
The rest of this paper is organized as follows. Section 2 explains the shock-restricted identification strategy employed in this study, while Section 3 briefly discusses the data that are used. Section 4 presents the responses of the exchange rate to a contractionary monetary policy shock which is estimated by the shock-restricted SVAR with both measures of uncertainty. We also show that our main results (instant appreciation and no-delayed overshooting in response to contractionary monetary policy shocks) continue to hold even with various robustness checks. To uncover the source of the puzzle in exchange rate behavior, we investigate the responses of the exchange rate to monetary policy shocks by isolating the uncertainty measures from other variables in the VAR or imposing no contemporaneous interaction between the interest rate and the exchange rate in Section 5. We also compare the contemporaneous relation imposed on our shock-restricted SVAR with those reported in previous studies. Concluding remarks are provided in Section 6.
2. Shock-restricted SVAR model
We consider the following structural relation between the variables of interest:
 \begin{equation}A_{0}X_{t}=a+A_{1}X_{t-1}+A_{2}X_{t-2}+\cdots +A_{p}X_{t-p}+\varepsilon _{t}\end{equation}
where $X_{t}=(U_{{R_{t}}}, Y_{t}, U_{{F_{t}}},p_{t}, i_{t}, q_{t}, ebp_{t},i_{t}^{*})'$
,
$X_{t}=(U_{{R_{t}}}, Y_{t}, U_{{F_{t}}},p_{t}, i_{t}, q_{t}, ebp_{t},i_{t}^{*})'$
, $U_{{R_{t}}}$
is the real uncertainty index,
$U_{{R_{t}}}$
is the real uncertainty index, $Y_{t}$
is the log US industrial production,
$Y_{t}$
is the log US industrial production, $U_{{F_{t}}}$
is the financial uncertainty index,
$U_{{F_{t}}}$
is the financial uncertainty index, $p_{t}$
is the log US CPI,
$p_{t}$
is the log US CPI, $i_{t}$
is the one-year US government bond rate following Gertler and Karadi (Reference Gertler and Karadi2015),
$i_{t}$
is the one-year US government bond rate following Gertler and Karadi (Reference Gertler and Karadi2015), $q_{t}$
is the log US real effective exchange rate,
$q_{t}$
is the log US real effective exchange rate, $ebp_{t}$
is the excess bond premium, and
$ebp_{t}$
is the excess bond premium, and $i_{t}^{*}$
is the trade-weighted foreign interest rate. The source of the data for each variable is explained in Section 3.
$i_{t}^{*}$
is the trade-weighted foreign interest rate. The source of the data for each variable is explained in Section 3. $\varepsilon _{t}=(\varepsilon _{{R_{t}}}, \varepsilon _{{Y_{t}}}, \varepsilon _{{F_{t}}}, \varepsilon _{{p_{t}}}, \varepsilon _{{i_{t}}}, \varepsilon _{{q_{t}}},\varepsilon _{{b_{t}}},\varepsilon _{i_{t}^{*}})'$
contains structural shocks that are serially uncorrelated and
$\varepsilon _{t}=(\varepsilon _{{R_{t}}}, \varepsilon _{{Y_{t}}}, \varepsilon _{{F_{t}}}, \varepsilon _{{p_{t}}}, \varepsilon _{{i_{t}}}, \varepsilon _{{q_{t}}},\varepsilon _{{b_{t}}},\varepsilon _{i_{t}^{*}})'$
contains structural shocks that are serially uncorrelated and $\varepsilon _{t}\sim (0, I_{k})$
where
$\varepsilon _{t}\sim (0, I_{k})$
where $k=8$
.
$k=8$
. $\varepsilon _{{i_{t}}}$
denotes monetary policy shocks.Footnote
2
The structural relation expressed in (1) is usually suggested by theoretical models and/or historical events but is not readily observable. However, the reduced form of (1) is readily observable and can be expressed as follows:Footnote
3
$\varepsilon _{{i_{t}}}$
denotes monetary policy shocks.Footnote
2
The structural relation expressed in (1) is usually suggested by theoretical models and/or historical events but is not readily observable. However, the reduced form of (1) is readily observable and can be expressed as follows:Footnote
3
 \begin{equation}X_{t}=b+B_{1}X_{t-1}+B_{2}X_{t-2}+\cdots +B_{p}X_{t-p}+u_{t}\end{equation}
From equations (1) and (2), $A_{0}^{-1}\varepsilon _{t}=u_{t},$
which implies
$A_{0}^{-1}\varepsilon _{t}=u_{t},$
which implies $A_{0}^{-1}A_{0}^{-1^\prime}=\sum _{u},$
where
$A_{0}^{-1}A_{0}^{-1^\prime}=\sum _{u},$
where $\sum _{u}$
is the covariance matrix of
$\sum _{u}$
is the covariance matrix of $u_{t}$
. To understand the structural relation in (1), we need to determine
$u_{t}$
. To understand the structural relation in (1), we need to determine $k^{2}$
elements in
$k^{2}$
elements in $A_{0}^{-1}$
, but the symmetrical nature of
$A_{0}^{-1}$
, but the symmetrical nature of $\sum _{u}$
provides only
$\sum _{u}$
provides only $\frac{k(k+1)}{2}$
independent elements, which indicates that we need
$\frac{k(k+1)}{2}$
independent elements, which indicates that we need $\frac{k(k-1)}{2}$
restrictions to identify unique
$\frac{k(k-1)}{2}$
restrictions to identify unique $A_{0}^{-1}$
. Previous studies have solved this identification issue by putting
$A_{0}^{-1}$
. Previous studies have solved this identification issue by putting $\frac{k(k-1)}{2}$
zeros at certain points in
$\frac{k(k-1)}{2}$
zeros at certain points in $A_{0}^{-1}$
based on suggestions from theoretical models and historical experience.
$A_{0}^{-1}$
based on suggestions from theoretical models and historical experience.
Unlike previous studies, we take a shock-restricted SVAR approach and do not put zeros in $A_{0}^{-1}$
a priori to identify
$A_{0}^{-1}$
a priori to identify $A_{0}^{-1}$
. Instead, we select
$A_{0}^{-1}$
. Instead, we select $A_{0}^{-1}$
from infinitely many candidates when the corresponding
$A_{0}^{-1}$
from infinitely many candidates when the corresponding $\varepsilon _{t}$
is consistent with historical events and satisfies the correlation conditions with external variables. Hence, the intuition of the shock-restricted SVAR method is that the data itself often offers valuable insights into the quantitatively important shocks observed in the sample. The methodology is based on the premise that a reliable identification system should generate
$\varepsilon _{t}$
is consistent with historical events and satisfies the correlation conditions with external variables. Hence, the intuition of the shock-restricted SVAR method is that the data itself often offers valuable insights into the quantitatively important shocks observed in the sample. The methodology is based on the premise that a reliable identification system should generate $\varepsilon _{t}$
estimates that align well with ex-post interpretation of historical events (event constraints) or conform to accepted economic concepts regarding the defining features of a shock (external variable constraints). The restrictions based on shocks prove beneficial for identification because even if two feasible structural models
$\varepsilon _{t}$
estimates that align well with ex-post interpretation of historical events (event constraints) or conform to accepted economic concepts regarding the defining features of a shock (external variable constraints). The restrictions based on shocks prove beneficial for identification because even if two feasible structural models $A_{0}^{-1}$
and
$A_{0}^{-1}$
and $\tilde{A}_{0}^{-1}$
produce shocks
$\tilde{A}_{0}^{-1}$
produce shocks $\varepsilon _{t}$
and
$\varepsilon _{t}$
and $\tilde{\varepsilon }_{t}$
with similar first and second moment, they may differ in specific time periods or in how they relate to external variables. Therefore, introducing two different types of inequality constraints (event and external variable constraints) directly onto the shocks suggest narrowing down the range of possible solutions.Footnote
4
$\tilde{\varepsilon }_{t}$
with similar first and second moment, they may differ in specific time periods or in how they relate to external variables. Therefore, introducing two different types of inequality constraints (event and external variable constraints) directly onto the shocks suggest narrowing down the range of possible solutions.Footnote
4
Specifically, the strategy employed in our shock-restricted identification is as follows. Let $\hat{P}$
be the unique lower-triangular Cholesky factor of
$\hat{P}$
be the unique lower-triangular Cholesky factor of
![]() . Hence,
. Hence,
![]() . Each rotation begins by obtaining an orthonormal matrix
. Each rotation begins by obtaining an orthonormal matrix $Q$
through the
$Q$
through the $QR$
decomposition of a
$QR$
decomposition of a $k \times k$
matrix
$k \times k$
matrix $M$
drawn from NID (0,1). For a random orthonormal matrix
$M$
drawn from NID (0,1). For a random orthonormal matrix $Q$
, we also have
$Q$
, we also have
![]() , which means that
, which means that $\hat{P}Q$
satisfies the restrictions required for
$\hat{P}Q$
satisfies the restrictions required for $A_{0}^{-1}$
. In our bootstrap replications, we rotate
$A_{0}^{-1}$
. In our bootstrap replications, we rotate $\hat{P}$
ten million times and compute the corresponding
$\hat{P}$
ten million times and compute the corresponding $\hat{\varepsilon }_{t}=(\hat{P}Q)^{-1}\hat{u}_{t}$
for each generated
$\hat{\varepsilon }_{t}=(\hat{P}Q)^{-1}\hat{u}_{t}$
for each generated $Q$
. Of these generated
$Q$
. Of these generated $\hat{\varepsilon }_{t}$
, we consider those
$\hat{\varepsilon }_{t}$
, we consider those $\hat{\varepsilon }_{t}$
that satisfy the conditions for a plausible structural shock and conduct our analysis using those
$\hat{\varepsilon }_{t}$
that satisfy the conditions for a plausible structural shock and conduct our analysis using those $\hat{\varepsilon }_{t}$
. Similar to LMN, the conditions for our shock-restricted SVAR approach consist of event and external variable constraints, which are summarized below.
$\hat{\varepsilon }_{t}$
. Similar to LMN, the conditions for our shock-restricted SVAR approach consist of event and external variable constraints, which are summarized below.
Event constraints:
-
1.
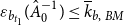
 $\varepsilon _{{F_{{t_{1}}}}}({\hat{A}}_{0}^{-1})\geq {\overline{k}}_{F,\ BM}$
and
$\varepsilon _{{b_{{t_{1}}}}}({\hat{A}}_{0}^{-1})\leq {\overline{k}}_{b,\ BM}$
at
$t_{1}=$
1987:10 (Black Monday).
$\varepsilon _{{F_{{t_{1}}}}}({\hat{A}}_{0}^{-1})\geq {\overline{k}}_{F,\ BM}$
and
$\varepsilon _{{b_{{t_{1}}}}}({\hat{A}}_{0}^{-1})\leq {\overline{k}}_{b,\ BM}$
at
$t_{1}=$
1987:10 (Black Monday). -
2.
$\varepsilon _{{R_{{t_{2}}}}}({\hat{A}}_{0}^{-1})\geq {\overline{k}}_{R, LB}$
and
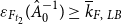
$\varepsilon _{{F_{{t_{2}}}}}({\hat{A}}_{0}^{-1})\geq {\overline{k}}_{F,\ LB}$
at
$t_{2}=$
2008:09 (Collapse of Lehman Brothers). -
3.
$\varepsilon _{{b_{{t_{3}}}}}({\hat{A}}_{0}^{-1})\geq {\overline{k}}_{b,LB}$
at
$t_{3}=$
2008:09 or 2008:10 (Collapse of Lehman Brothers). -
4.
$\sum _{t=2007\colon 12}^{2009\colon 06}\varepsilon _{{Y_{t}}}({\hat{A}}_{0}^{-1})\leq {\overline{k}}_{GR}\leq 0$
(Great Recession). -
5.
$\sum _{t=1985\colon 09}^{1987\colon 01}\varepsilon _{{q_{t}}}({\hat{A}}_{0}^{-1})\leq {\overline{k}}_{PA}\leq 0$
(Plaza Accord).


The first constraint states that a plausible $\varepsilon _{{F_{t}}}$
should be high when the stock market crashed in October 1987. However,
$\varepsilon _{{F_{t}}}$
should be high when the stock market crashed in October 1987. However, $\varepsilon _{{b_{t}}}$
should be low in October 1987 which was emphasized in Caggiano et al. (Reference Caggiano, Castelnuovo, Delrio and Kima2021) in the identification of structural shocks.Footnote
5
The second constraint dictates that
$\varepsilon _{{b_{t}}}$
should be low in October 1987 which was emphasized in Caggiano et al. (Reference Caggiano, Castelnuovo, Delrio and Kima2021) in the identification of structural shocks.Footnote
5
The second constraint dictates that $\varepsilon _{{F_{t}}}$
and
$\varepsilon _{{F_{t}}}$
and $\varepsilon _{{R_{t}}}$
must be high in September 2008 when Lehman Brothers filed for bankruptcy. The third constraint requires that the excess bond premium in September or October 2008 is extremely high. As noted in Ludvigson, et al. (Reference Ludvigson, Ma and Ng2020), the Lehman Brothers collapse triggered a sharp deterioration in financial conditions, with credit spreads surging abruptly. We therefore impose that the structural credit-supply shock is large in September or October 2008. The fourth constraint requires that the sum of the real output shocks during the Great Recession must be below average.Footnote
6
We set
$\varepsilon _{{R_{t}}}$
must be high in September 2008 when Lehman Brothers filed for bankruptcy. The third constraint requires that the excess bond premium in September or October 2008 is extremely high. As noted in Ludvigson, et al. (Reference Ludvigson, Ma and Ng2020), the Lehman Brothers collapse triggered a sharp deterioration in financial conditions, with credit spreads surging abruptly. We therefore impose that the structural credit-supply shock is large in September or October 2008. The fourth constraint requires that the sum of the real output shocks during the Great Recession must be below average.Footnote
6
We set ${\overline{k}}_{F,BM}$
equal to the 60th percentile for
${\overline{k}}_{F,BM}$
equal to the 60th percentile for $\varepsilon _{{F_{t}}}$
in the set of generated structural shocks for the event date
$\varepsilon _{{F_{t}}}$
in the set of generated structural shocks for the event date $t_{1}$
, while setting
$t_{1}$
, while setting ${\overline{k}}_{b,\ BM}$
equal to the 50th percentile for
${\overline{k}}_{b,\ BM}$
equal to the 50th percentile for $\varepsilon _{{b_{t}}}$
at the same date. We also set
$\varepsilon _{{b_{t}}}$
at the same date. We also set ${\overline{k}}_{R,LB}$
, and
${\overline{k}}_{R,LB}$
, and ${\overline{k}}_{F,LB}$
equal to the 50th percentile for
${\overline{k}}_{F,LB}$
equal to the 50th percentile for $\varepsilon _{{R_{t}}}$
and
$\varepsilon _{{R_{t}}}$
and $\varepsilon _{{F_{t}}}$
and
$\varepsilon _{{F_{t}}}$
and ${\overline{k}}_{b,LB}$
equal to the 60th percentile for
${\overline{k}}_{b,LB}$
equal to the 60th percentile for $\varepsilon _{{b_{t}}}$
in the set of generated structural shocks for the event date
$\varepsilon _{{b_{t}}}$
in the set of generated structural shocks for the event date $t_{2}$
and
$t_{2}$
and $t_{3}$
, respectively.Footnote
7
Also, we set
$t_{3}$
, respectively.Footnote
7
Also, we set ${\overline{k}}_{GR}$
the 50th percentile (median) of
${\overline{k}}_{GR}$
the 50th percentile (median) of $\varepsilon _{{Y_{t}}}$
for the great recession. These four constraints are similar to those considered by LMN.Footnote
8
$\varepsilon _{{Y_{t}}}$
for the great recession. These four constraints are similar to those considered by LMN.Footnote
8
The last event constraint requires that the sum of $\varepsilon _{{q_{t}}}$
be non-positive, which reflects the depreciation of the US dollar, from the time of the agreement of the Plaza Accord until it was replaced by the Louvre Accord in 1987. The Plaza Accord was a joint agreement signed by five countries to depreciate the US dollar against the Japanese Yen and the Deutsche mark via intervention in currency markets.Footnote
9
As shown in Figure C2, the US real effective exchange rate depreciated by almost 21% during the Plaza Accord period due to the interventions of participating central banks. This final constraint requires that the sum of
$\varepsilon _{{q_{t}}}$
be non-positive, which reflects the depreciation of the US dollar, from the time of the agreement of the Plaza Accord until it was replaced by the Louvre Accord in 1987. The Plaza Accord was a joint agreement signed by five countries to depreciate the US dollar against the Japanese Yen and the Deutsche mark via intervention in currency markets.Footnote
9
As shown in Figure C2, the US real effective exchange rate depreciated by almost 21% during the Plaza Accord period due to the interventions of participating central banks. This final constraint requires that the sum of $\varepsilon _{{q_{t}}}$
during the Plaza Accord period be below zero, which corresponds to the 25th percentile for
$\varepsilon _{{q_{t}}}$
during the Plaza Accord period be below zero, which corresponds to the 25th percentile for $\varepsilon _{{q_{t}}}$
in the set of generated structural shock, to reflect this trend in the US exchange rate.
$\varepsilon _{{q_{t}}}$
in the set of generated structural shock, to reflect this trend in the US exchange rate.
External Variable Constraints:
-
1.
$corr(\varepsilon _{{F_{t}}}, S_{1t})\leq {\overline{k}}_{corr(F,{S_{1}})}\leq 0$
. -
2.
$corr(\varepsilon _{{R_{t}}}, S_{2t})\geq {\overline{k}}_{corr(R,{S_{2}})}\geq 0$
. -
3.
$corr(\varepsilon _{{i_{t}}}, S_{3t})\geq {\overline{k}}_{corr(i,S_{3})}\geq 0$
.


 $S_{1t}$
denotes the real return of the S&P 500 index,
$S_{1t}$
denotes the real return of the S&P 500 index, $S_{2t}$
is the intra-daily changes in the price of gold measured in Piffer and Podstawski (Reference Piffer and Podstawski2018), and
$S_{2t}$
is the intra-daily changes in the price of gold measured in Piffer and Podstawski (Reference Piffer and Podstawski2018), and $S_{3t}$
represents the federal funds rate shock identified in Nakamura and Steinsson (Reference Nakamura and Steinsson2018). All of these variables are external to the SVAR system described above. The first external variable constraint states that
$S_{3t}$
represents the federal funds rate shock identified in Nakamura and Steinsson (Reference Nakamura and Steinsson2018). All of these variables are external to the SVAR system described above. The first external variable constraint states that $\varepsilon _{{F_{t}}}$
should be negatively correlated with the aggregate stock returns. That is, when
$\varepsilon _{{F_{t}}}$
should be negatively correlated with the aggregate stock returns. That is, when $\varepsilon _{{F_{t}}}$
raises the financial uncertainty, the S&P 500 index returns tend to fall. The second constraint requires that, when real uncertainty in the US rises due to
$\varepsilon _{{F_{t}}}$
raises the financial uncertainty, the S&P 500 index returns tend to fall. The second constraint requires that, when real uncertainty in the US rises due to $\varepsilon _{{R_{t}}}$
, the gold price also tends to rise.Footnote
10
The third constraint means that the monetary policy shock
$\varepsilon _{{R_{t}}}$
, the gold price also tends to rise.Footnote
10
The third constraint means that the monetary policy shock $\varepsilon _{{i_{t}}}$
identified in this study is (at least mildly) correlated with the federal funds rate shock identified using the different approach by Nakamura and Steinsson (Reference Nakamura and Steinsson2018). The first two external variable constraints are similar to those in LMN while the third constraint is consistent with those considered by Kang and Park (Reference Kang and Park2024). Table 1 shows the parameter values for all shock-based restrictions to obtain the results for the benchmark case.
$\varepsilon _{{i_{t}}}$
identified in this study is (at least mildly) correlated with the federal funds rate shock identified using the different approach by Nakamura and Steinsson (Reference Nakamura and Steinsson2018). The first two external variable constraints are similar to those in LMN while the third constraint is consistent with those considered by Kang and Park (Reference Kang and Park2024). Table 1 shows the parameter values for all shock-based restrictions to obtain the results for the benchmark case.
Parameter values and percentiles for shock-based restrictions in the benchmark case

Notes: Table shows parameter values for event constraints and external variable constraints in the benchmark case for the shock-restricted SVAR. $\Phi ^{-1}(\cdot )$
denotes the inverse of cumulative density functions for structural shocks on the event time point.
$\Phi ^{-1}(\cdot )$
denotes the inverse of cumulative density functions for structural shocks on the event time point. $\Theta ^{-1}(\cdot )$
denotes the inverse of cumulative density functions for the correlation in interests.
$\Theta ^{-1}(\cdot )$
denotes the inverse of cumulative density functions for the correlation in interests.
To account for parameter and sampling uncertainty, we also conduct inference using the wild bootstrap method developed by Gonçalves and Kilian (Reference Gonçalves and Kilian2004). We extend the wild bootstrap procedure to our setting following Berthold (Reference Berthold2023). A detailed description of the bootstrap implementation is provided in Appendix.
The approach employed in this study is distinct from other studies examining the exchange rate response to monetary policy shocks with SVAR approach. First, the inclusion of uncertainties in the VAR system not only reflects recent findings about the effect of uncertainties on economic activity but also delineates more precise dynamics of monetary policy shocks. Second, the shock-restricted SVAR approach in this study can allow contemporaneous relation between variables, especially between interest rate and exchange rate, in the VAR system.
3. Data
The real and financial uncertainty measures used in this study are those proposed by Jurado et al. (Reference Jurado, Ludvigson and Ng2015) and used in previous studies such as Aastveit et al. (Reference Aastveit, Natvik and Sola2013) and LMN. These uncertainty measures demonstrate the degree of the difficulty in forecasting real activity variables or financial variables, which can be formulated as follows:
 \begin{equation}U_{jt}^{C}(h)\equiv \sqrt{E[(y_{jt+h}^{C}-E(y_{jt+h}^{C}\left| I_{t})^{2}\right| I_{t}]}\end{equation}
where $y_{j}^{C}$
is a variable related to the real and financial variables, category indicator
$y_{j}^{C}$
is a variable related to the real and financial variables, category indicator $C\in \{R,F\}$
, and
$C\in \{R,F\}$
, and $I_{t}$
represents all information available at time
$I_{t}$
represents all information available at time $t$
. The real and financial uncertainty measures are the weighted average of these squared forecast errors, and we use a one-month forecast horizon as in LMN.Footnote
11
The real and financial uncertainty measures are presented in Figure C3 in the Appendix. As shown in Figure C3, both uncertainty measures are countercyclical and are notably high during the Great Recession, while the financial uncertainty is also notable in October 1987.
$t$
. The real and financial uncertainty measures are the weighted average of these squared forecast errors, and we use a one-month forecast horizon as in LMN.Footnote
11
The real and financial uncertainty measures are presented in Figure C3 in the Appendix. As shown in Figure C3, both uncertainty measures are countercyclical and are notably high during the Great Recession, while the financial uncertainty is also notable in October 1987.
We use the monthly industrial production index for the output data. The monthly CPI is used for the price. Industrial production, CPI, and the one-year US government bond data are taken from the website for the Federal Reserve Bank of St. Louis.Footnote 12
Data for the US real and nominal effective exchange rates are obtained from the Bank for International Settlements (BIS).Footnote 13 Other countries’ central bank policy rates are also extracted from the BIS website. We calculate US trade weights for the top 20 countries that the US trades with each year.Footnote 14 We then multiply the central bank policy rates with the relative trade weights for these countries to produce the trade-weighted foreign policy rate for the US.Footnote 15 The sum of the trade weights for the countries included in the construction of the trade-weighted foreign policy rate for the US covers most of the total trade for the US during the sample period. For example, the sum of trade weights for countries included in the construction of the trade-weighted foreign policy rate for the US is above 82% of the US total trades in 2019. The sample period of this study is January 1985–December 2019. We exclude the COVID-19 period when unconventional monetary policy was conducted not only in the US but also in most countries. Figure C4 plots the US industrial production, CPI, the excess bond premium, the US interest rate, and the trade-weighted foreign policy rate.
4. Dynamic responses to monetary policy shocks under shock-restricted SVAR
This section provides empirical results from shock-restricted SVAR for eight variables, $X_{t}=(U_{{R_{t}}}, Y_{t}, U_{{F_{t}}},p_{t}, i_{t}, q_{t}, ebp_{t},i_{t}^{*})'$
. With randomly generated orthonormal matrices
$X_{t}=(U_{{R_{t}}}, Y_{t}, U_{{F_{t}}},p_{t}, i_{t}, q_{t}, ebp_{t},i_{t}^{*})'$
. With randomly generated orthonormal matrices $Q$
, we rotate
$Q$
, we rotate $\hat{P}$
(where
$\hat{P}$
(where ![]() ) and generate the same number of structural shocks
) and generate the same number of structural shocks $\hat{\varepsilon }_{t}$
. Figures 1 and 2 present the time series of the structural shocks
$\hat{\varepsilon }_{t}$
. Figures 1 and 2 present the time series of the structural shocks $\varepsilon _{t}=(\varepsilon _{{R_{t}}}, \varepsilon _{{Y_{t}}}, \varepsilon _{{F_{t}}}, \varepsilon _{{p_{t}}}, \varepsilon _{{i_{t}}}, \varepsilon _{{q_{t}}},\varepsilon _{{b_{t}}},\varepsilon _{i_{t}^{*}})'$
for one solution satisfying all constraints. All identified shocks are negatively skewed and show excess kurtosis, which is similar to the results in LMN.
$\varepsilon _{t}=(\varepsilon _{{R_{t}}}, \varepsilon _{{Y_{t}}}, \varepsilon _{{F_{t}}}, \varepsilon _{{p_{t}}}, \varepsilon _{{i_{t}}}, \varepsilon _{{q_{t}}},\varepsilon _{{b_{t}}},\varepsilon _{i_{t}^{*}})'$
for one solution satisfying all constraints. All identified shocks are negatively skewed and show excess kurtosis, which is similar to the results in LMN. $\varepsilon _{{F_{t}}}$
record large shocks in magnitude around October 1987. Large shocks are also noted for
$\varepsilon _{{F_{t}}}$
record large shocks in magnitude around October 1987. Large shocks are also noted for $\varepsilon _{{Y_{t}}}$
,
$\varepsilon _{{Y_{t}}}$
, $\varepsilon _{{R_{t}}}$
,
$\varepsilon _{{R_{t}}}$
, $\varepsilon _{{F_{t}}}$
, and
$\varepsilon _{{F_{t}}}$
, and $\varepsilon _{{b_{t}}}$
in September 2009 when Lehman Brothers filed for bankruptcy. Moreover, there is a large variation in
$\varepsilon _{{b_{t}}}$
in September 2009 when Lehman Brothers filed for bankruptcy. Moreover, there is a large variation in $\varepsilon _{{q_{t}}}$
during Plaza Accord from September 1985 to January 1987.
$\varepsilon _{{q_{t}}}$
during Plaza Accord from September 1985 to January 1987.
One solution of structural shocks to real uncertainty, output, financial uncertainty, excess bond premium. Notes: Figure reports the time series of $\varepsilon _{{R_{t}}}$
,
$\varepsilon _{{R_{t}}}$
, $\varepsilon _{{Y_{t}}}$
,
$\varepsilon _{{Y_{t}}}$
, $\varepsilon _{{F_{t}}}$
, and
$\varepsilon _{{F_{t}}}$
, and $\varepsilon _{{b_{t}}}$
for one solution satisfying all constraints.
$\varepsilon _{{b_{t}}}$
for one solution satisfying all constraints.

One solution of structural shocks to CPI, monetary policy, real exchange rate, and foreign interest rate. Notes: Figure reports the time series of $\varepsilon _{{p_{t}}}$
,
$\varepsilon _{{p_{t}}}$
, $\varepsilon _{{i_{t}}}$
,
$\varepsilon _{{i_{t}}}$
, $\varepsilon _{{q_{t}}}$
, and
$\varepsilon _{{q_{t}}}$
, and $\varepsilon _{i_{t}^{*}}$
for one solution satisfying all constraints.
$\varepsilon _{i_{t}^{*}}$
for one solution satisfying all constraints.

Figure 3 presents the median impulse responses of each variable in the SVAR to contractionary monetary policy shocks, along with 68% confidence intervals constructed using the wild bootstrap method.Footnote 16 , Footnote 17 In general, contractionary monetary policy shocks are expected to raise the interest rate but lower output and the price level. The impulse responses in the first row of Figure 3 are consistent with these predictions. Output declines immediately in response to a contractionary monetary policy shock, with the maximum reduction occurring within 12 to 18 months. The CPI drops instantly in response to a contractionary monetary policy shock, which is consistent with the common theoretical prediction. The US interest rate rises immediately in response to a tighter US monetary policy stance but the initial impact disappears within 10 months, which indicates a temporary increase in the interest rate. The trade-weighted foreign interest rate also rises temporarily, which is consistent with the results in Rüth (Reference Rüth2020). The propagation of the effect of tightening monetary policy shown in the first row of Figure 3 is consistent with the predictions in the literature, which supports the validity of the identification strategy employed in this study.
Impulse response to contractionary monetary policy shocks. Notes: Figure presents impulse responses to contractionary monetary policy shocks identified through the shock-restricted SVAR. The confidence intervals and median response are derived using the extension of the wild bootstrap procedure described in Section 2 and Appendix A.

The first two panels of the second row in Figure 3 present the dynamic effect of contractionary monetary policy shocks on real and financial uncertainty measures. Both uncertainty measures rise in response to tightening monetary policy shocks. In the median response, real uncertainty rises gradually, peaks at four months, and then declines gradually. This response may be related to the delay in investment and consumption decisions caused by the temporarily higher interest rate accompanied by a contractionary monetary policy shock. Financial uncertainty rises significantly in response to tightening monetary policy, with its median response peaking after three months, which is similar to Bekaert et al. (Reference Bekaert, Hoerova and Duca2013). As shown in the third panel of the second row, the excess bond premium also increases following positive monetary policy shocks, broadly consistent with the literature.
The last panel of the second row in Figure 3 shows the response of the real effective exchange rate to contractionary monetary policy shocks. The US real effective exchange rate appreciates immediately in response to tighter monetary policies, and the appreciation is statistically significant from one to fourteen-month horizons. In contrast to previous studies that have reported that real appreciation peaks two to three years after a shock, the maximum appreciation in Figure 3 occurs almost immediately. The last panel of the second row in Figure 3 also shows the point-wise median response (the black-thick line) of the US real effective exchange rate to contractionary monetary policy shocks. In the median response, the US real effective exchange rate appreciates immediately, with appreciation peaking at one month. After peaking, the real exchange rate gradually depreciates back toward its initial level, which is consistent with the Dornbusch (Reference Dornbusch1976) model.
We have tested the robustness of our results in various aspects in the following sub-sections.
4.1. Robustness checks: nominal effective exchange rate
We further examine whether the main results hold when substituting the US real effective exchange rate with the US nominal effective exchange rate, denoted by $e_{t}$
, in the SVAR system. Specifically, we consider
$e_{t}$
, in the SVAR system. Specifically, we consider $X_{t}=(U_{{R_{t}}}, Y_{t}, U_{{F_{t}}},p_{t}, i_{t}, e_{t}, ebp_{t},i_{t}^{*})'$
in the shock-restricted SVAR. The first panel in Figure 4 shows the impulse response of the US nominal effective exchange rate to contractionary monetary policy shocks.Footnote
18
The US nominal exchange rate appreciates instantly and peaks within one to two months after monetary policy shocks occur, which aligns with the benchmark result in Figure 3.
$X_{t}=(U_{{R_{t}}}, Y_{t}, U_{{F_{t}}},p_{t}, i_{t}, e_{t}, ebp_{t},i_{t}^{*})'$
in the shock-restricted SVAR. The first panel in Figure 4 shows the impulse response of the US nominal effective exchange rate to contractionary monetary policy shocks.Footnote
18
The US nominal exchange rate appreciates instantly and peaks within one to two months after monetary policy shocks occur, which aligns with the benchmark result in Figure 3.
Robustness checks (nominal exchange rate, $\Psi _{t}$
, FF future rates, one-year forecast horizon uncertainties, EPU, shadow rate). Notes: Figure presents the impulse response of the US effective exchange rate to contractionary monetary policy shocks across various robustness check cases. The confidence intervals and median response are derived using the extension of the wild bootstrap procedure described in Section 2 and Appendix A.
$\Psi _{t}$
, FF future rates, one-year forecast horizon uncertainties, EPU, shadow rate). Notes: Figure presents the impulse response of the US effective exchange rate to contractionary monetary policy shocks across various robustness check cases. The confidence intervals and median response are derived using the extension of the wild bootstrap procedure described in Section 2 and Appendix A.

Using the nominal effective exchange rate in the SVAR system also allows us to examine its consistency with the UIP. We define $\Psi$
as the excess return of US dollar currency, which is given by
$\Psi$
as the excess return of US dollar currency, which is given by $\Psi _{t+1}=12\times (e_{t+1}-e_{t})- (i_{t}-i_{t}^{*})$
. According to the UIP hypotheses, the conditional expectation of the excess return,
$\Psi _{t+1}=12\times (e_{t+1}-e_{t})- (i_{t}-i_{t}^{*})$
. According to the UIP hypotheses, the conditional expectation of the excess return, $E_{t}\Psi _{t+s}$
, should be zero for all
$E_{t}\Psi _{t+s}$
, should be zero for all $s\gt 0$
when a monetary policy shock occurs at
$s\gt 0$
when a monetary policy shock occurs at $s=0$
. The second panel in Figure 4 shows the dynamic response of the excess return,
$s=0$
. The second panel in Figure 4 shows the dynamic response of the excess return, $\Psi _{t+s}$
, to contractionary monetary policy shocks. On impact,
$\Psi _{t+s}$
, to contractionary monetary policy shocks. On impact, $\Psi _{t}$
shows a significantly positive response; thereafter,
$\Psi _{t}$
shows a significantly positive response; thereafter, $\Psi _{t}$
oscillates around zero. This pattern in the response is qualitatively identical to the results in Rüth (Reference Rüth2020).
$\Psi _{t}$
oscillates around zero. This pattern in the response is qualitatively identical to the results in Rüth (Reference Rüth2020).
4.2. Robustness checks: alternative monetary policy shocks as an external variable
The external variable constraints under the shock-restricted SVAR approach require that estimated structural shocks have reasonable correlations with variables not included in the SVAR system.Footnote
19
Hence, the monetary policy shocks identified in this study must correlate not only with the federal funds rate shocks of Nakamura and Steinsson (Reference Nakamura and Steinsson2018) but also with monetary policy shocks reasonably identified through alternative approaches. To test this, we replace federal funds rate shocks from Nakamura and Steinsson (Reference Nakamura and Steinsson2018) with surprises in Federal funds futures, commonly used as monetary policy shocks in studies such as Gertler and Karadi (Reference Gertler and Karadi2015) and Rüth (Reference Rüth2020), for $S_{3t}$
. Specifically, we use surprises in three-month-ahead federal funds futures as an alternative measure for
$S_{3t}$
. Specifically, we use surprises in three-month-ahead federal funds futures as an alternative measure for $S_{3t}$
. The results, plotted in the third panel of the first row of Figure 4 under the benchmark threshold values, show that the real exchange rate appreciates immediately in response to tightening monetary policy shocks and peaks within one month in the median response.Footnote
20
These findings align closely with the benchmark result shown in Figure 3, confirming the robustness of our approach.
$S_{3t}$
. The results, plotted in the third panel of the first row of Figure 4 under the benchmark threshold values, show that the real exchange rate appreciates immediately in response to tightening monetary policy shocks and peaks within one month in the median response.Footnote
20
These findings align closely with the benchmark result shown in Figure 3, confirming the robustness of our approach.
4.3. Robustness checks: alternative uncertainty measures with one-year forecast horizon
Since the inclusion of uncertainty measures makes this study distinct from previous studies, the robustness tests with alternative uncertainty measures are considered. Accordingly, we extend the forecast horizon for both real and financial uncertainty from one month to one year. The result, plotted in the first panel of the second row in Figure 4, under the benchmark threshold values, shows that the real exchange rate appreciates immediately in response to tightening monetary policy shocks and the pattern is qualitatively identical to the benchmark result in Figure 3. Although we do not report additional figures to conserve the space, we also re-estimate using both uncertainty measures with three-month forecast horizons or replacing real uncertainty with the macro uncertainty in LMN. In all cases, the real effective exchange rate responds similarly to monetary policy shocks. The results are available upon request.
4.4. Robustness checks: economic policy uncertainty
To check the robustness of our results, we consider the Economic Policy Uncertainty (EPU) index proposed by Baker et al. (Reference Baker, Bloom and Davis2016) as an alternative of real uncertainty. Because EPU captures the degree of how uncertain people perceive government economic policies to be, we modify the event constraints so that the EPU shock is large at the debt-ceiling crisis in 2011 but not necessarily large in 2008 when Lehman Brothers filed for bankruptcy. Hence, the modified event constraint can be written as follows:Footnote 21
-
1.
$\varepsilon _{{F_{{t_{1}}}}}({\hat{A}}_{0}^{-1})\geq {\overline{k}}_{F,\ BM}$
and
$\varepsilon _{{b_{{t_{1}}}}}({\hat{A}}_{0}^{-1})\leq {\overline{k}}_{b,\ BM}$
at
$t_{1}=$
1987:10 (Black Monday). -
2.
$\varepsilon _{{F_{{t_{2}}}}}({\hat{A}}_{0}^{-1})\geq {\overline{k}}_{F,\ LB}$
at
$t_{2}=$
2008:09 (Collapse of Lehman Brothers). -
3.
$\varepsilon _{{b_{{t_{3}}}}}({\hat{A}}_{0}^{-1})\geq {\overline{k}}_{b,LB}$
at
$t_{3}=$
2008:09 or 2008:10 (Collapse of Lehman Brothers). -
4.
$\varepsilon _{{epu_{{t_{4}}}}}({\hat{A}}_{0}^{-1})\geq {\overline{k}}_{epu,DC}\geq 0$
at
$t_{4}\in$
[2011:07, 2011:08] (Debt-ceiling Crisis). -
5.
$\sum _{t=2007\colon 12}^{2009\colon 06}\varepsilon _{{Y_{t}}}({\hat{A}}_{0}^{-1})\leq {\overline{k}}_{GR}\leq 0$
(Great Recession). -
6.
$\sum _{t=1985\colon 09}^{1987\colon 01}\varepsilon _{{q_{t}}}({\hat{A}}_{0}^{-1})\leq {\overline{k}}_{PA}\leq 0$
(Plaza Accord).


The response of the real exchange rate to contractionary monetary policy shocks, shown in the second panel of the second row in Figure 4, is instantly significant and broadly consistent with the benchmark result.
4.5. Robustness checks: Wu–Xia shadow rate
Since our sample period includes the period when the US interest rate was at the zero lower bound (ZLB), the US interest rate may fail to fully reflect the stance of US monetary policy around the ZLB episode. To check this possibility, we replace the one-year US government bond rate with the Wu and Xia (Reference Wu and Xia2016) shadow rate in the SVAR.Footnote 22 As shown in the last panel of Figure 4, the real exchange rate rises immediately and significantly to positive monetary policy shocks, confirming the robustness of benchmark and other results in Figure 4.
5. Potential sources of anomalous exchange rate response
The impulse responses of exchange rates presented in Figures 3 through 4 differ from the ambiguous instant response and delayed overshooting reported in many existing studies. The last panel in Figures 3 through 4 show immediate appreciation and no delayed overshooting of the exchange rate in response to contractionary monetary policy shocks. In this section, we investigate whether this difference arises from the use of novel uncertainty measures in the SVAR or from the identification strategy employed in the shock-restricted SVAR.
5.1. Role of uncertainty measures
We isolate both real and financial uncertainties from other variables in the SVAR to understand their roles in producing the immediate appreciation of the exchange rate following contractionary monetary policy shocks discussed in the previous sections. Specifically, we mute endogenous responses of real and financial uncertainties to other structural shocks by constraining the elements that govern their contemporaneous responses in the $\hat{P}Q=A_{0}^{-1}$
matrix. We then compare the results of this experiment with those from the benchmark case. The first panel of Figure 5 presents an insignificant response of the real effective exchange rate to tightening monetary policy shocks when the endogenous responses of both uncertainties are shut off. Similar insignificant responses appear when we mute the endogenous response of either real uncertainty or financial uncertainty, as shown in the second and third panels of the first row in Figure 5. We also shut off the contemporaneous effect caused by
$\hat{P}Q=A_{0}^{-1}$
matrix. We then compare the results of this experiment with those from the benchmark case. The first panel of Figure 5 presents an insignificant response of the real effective exchange rate to tightening monetary policy shocks when the endogenous responses of both uncertainties are shut off. Similar insignificant responses appear when we mute the endogenous response of either real uncertainty or financial uncertainty, as shown in the second and third panels of the first row in Figure 5. We also shut off the contemporaneous effect caused by $\varepsilon _{{R_{t}}}$
or
$\varepsilon _{{R_{t}}}$
or $\varepsilon _{{F_{t}}}$
on other variables in the SVAR by restricting relevant elements in
$\varepsilon _{{F_{t}}}$
on other variables in the SVAR by restricting relevant elements in $\hat{P}Q=A_{0}^{-1}$
, and then examine the response of the exchange rate to monetary policy shocks. The panels of the second row in Figure 5 show an insignificant response of the exchange rate to contractionary monetary policy shocks.
$\hat{P}Q=A_{0}^{-1}$
, and then examine the response of the exchange rate to monetary policy shocks. The panels of the second row in Figure 5 show an insignificant response of the exchange rate to contractionary monetary policy shocks.
Response of the real effective exchange rate to contractionary monetary policy shocks when uncertainty measures are isolated from other variables in the SVAR. Notes: Figure presents the impulse response of the US real effective exchange rate to contractionary monetary policy shocks acrossr various cases designed to isolate real or financial uncertainty from other variables in the SVAR. The confidence intervals and median response are derived using the extension of the wild bootstrap procedure described in Section 2 and Appendix A.

All panels in Figure 5 show that accounting for both real and financial uncertainties is essential to obtain the significant immediate appreciation of the exchange rate following tightening monetary policy shocks, which is consistent with theoretical models such as Dornbusch (Reference Dornbusch1976). In addition to the results shown in Figure 5, isolating real or financial uncertainty from other variables in the SVAR yields an insignificant response of the CPI to contractionary monetary policy shocks.Footnote 23 These findings imply that including uncertainty measures in the VAR system clarifies the impact and propagation mechanism of monetary policy shocks. These results also align with Kang and Park (Reference Kang and Park2024), who emphasize that including uncertainty measures is crucial for successfully identifying the effect of US monetary policy.
5.2. Identification restrictions without contemporaneous interaction between the interest rate and the exchange rate
The previous sub-section highlights the importance of uncertainty measures for understanding the responses of the exchange rate to tighter monetary policy. In this sub-section, we examine the response of the real effective exchange rate to contractionary monetary policy shocks when the uncertainty measures are incorporated under recursive identification restrictions rather than the shock-restricted SVAR constraints.
To impose the recursive identification restrictions, we order of the eight variables in the SVAR as $X_{t}=(i_{t}^{*}, U_{{R_{t}}}, U_{{F_{t}}},Y_{t}, p_{t}, i_{t}, ebp_{t},q_{t})'$
. In this ordering, the foreign interest rate is treated as exogenous, consistent with previous studies such as Bjørnland (Reference Bjørnland2009). Following the recursive identification assumptions in Bloom (Reference Bloom2009) and subsequent studies, we place the uncertainty measures ahead of the other macro variables. The impulse response of the real exchange rate to contractionary monetary policy shocks under this recursive restriction is plotted with the 68% confidence interval in the first panel of Figure 6. Although the response shows an instant appreciation, it subsequently exhibits delayed overshooting, with the peak occurring after 24 months, a pattern reported as a puzzle in earlier studies.
$X_{t}=(i_{t}^{*}, U_{{R_{t}}}, U_{{F_{t}}},Y_{t}, p_{t}, i_{t}, ebp_{t},q_{t})'$
. In this ordering, the foreign interest rate is treated as exogenous, consistent with previous studies such as Bjørnland (Reference Bjørnland2009). Following the recursive identification assumptions in Bloom (Reference Bloom2009) and subsequent studies, we place the uncertainty measures ahead of the other macro variables. The impulse response of the real exchange rate to contractionary monetary policy shocks under this recursive restriction is plotted with the 68% confidence interval in the first panel of Figure 6. Although the response shows an instant appreciation, it subsequently exhibits delayed overshooting, with the peak occurring after 24 months, a pattern reported as a puzzle in earlier studies.
Impulse responses under recursive identification or no contemporaneous interaction between the interest rate and the exchange rate. Notes: Figure presents the dynamic effects of contractionary monetary policy shocks on the real effective exchange rate under recursive restrictions (left panel) and in the case where the contemporaneous interaction between the interest rate and the exchange rate is shut off (right panel). The confidence intervals and median response are derived using the extension of the wild bootstrap procedure described in Section 2 and Appendix A.

Studies such as Kim and Roubini (Reference Kim and Roubini2000), Bjørnland (Reference Bjørnland2009), and Rüth (Reference Rüth2020) emphasize the contemporaneous interaction between interest rate and the exchange rate in the identification strategy, an interaction that recursive identification restrictions cannot accommodate, and they argue that the delayed overshooting puzzle can be resolved with non-recursive restrictions on $A_{0}^{-1}$
. Because the shock-restricted SVAR permits contemporaneous interaction between the interest rate and the exchange rate is possible, we shut off this contemporaneous interaction by restricting the relevant elements in
$A_{0}^{-1}$
. Because the shock-restricted SVAR permits contemporaneous interaction between the interest rate and the exchange rate is possible, we shut off this contemporaneous interaction by restricting the relevant elements in $\hat{P}Q=A_{0}^{-1}$
to assess its role in our benchmark results. The second panel of Figure 6 shows the response of the real exchange rate to tightening monetary policy shocks after we shut off the contemporaneous interaction between the interest rate and the exchange rate. The response of the real exchange rate is not significant, and the overshooting is delayed relative to the benchmark case.
$\hat{P}Q=A_{0}^{-1}$
to assess its role in our benchmark results. The second panel of Figure 6 shows the response of the real exchange rate to tightening monetary policy shocks after we shut off the contemporaneous interaction between the interest rate and the exchange rate. The response of the real exchange rate is not significant, and the overshooting is delayed relative to the benchmark case.
In summary, the impulse responses in Figure 6 indicate that delayed overshooting persists under recursive identification restrictions, even when uncertainty measures are included in the SVAR or when identification restrictions prevent contemporaneous interaction between the interest rate and the exchange rate. These results imply that delayed overshooting is a consequence of strong identification restrictions that disallow contemporaneous interactions between certain variables, especially between the interest rate and the exchange rate.
5.3. Discussion of competing identification strategies
The results presented in previous sub-sections indicate that anomalies in exchange rate responses to monetary policy shocks can be an artifact arising from recursive identification restrictions and the failure to control for uncertainty. This sub-section connects our shock-restricted SVAR to competing SVAR identification strategies proposed in the literature for resolving the puzzling response of the exchange rate to shifts in monetary policy stance, although a clear comparison is difficult because different studies include different variables in their SVARs.
Studies such as Kim and Roubini (Reference Kim and Roubini2000) and Bjørnland (Reference Bjørnland2009) impose non-recursive restrictions on $A_{0}^{-1}$
rather than recursive ones to identify monetary policy shocks. Even with non-recursive identification,
$A_{0}^{-1}$
rather than recursive ones to identify monetary policy shocks. Even with non-recursive identification, $\frac{8\cdot 7}{2}=28$
restrictions are required to identify a unique structural shock under their strategies. In addition to this large number of restrictions, Kim and Roubini (Reference Kim and Roubini2000) and Bjørnland (Reference Bjørnland2009) treat the foreign interest rate in the SVAR as exogenous to permit contemporaneous interaction between the interest rate and the exchange rate in the identification strategy. However, this is counterintuitive because central banks in non-US countries often base monetary policy decisions on the Federal Reserve’s actions. Our shock-restricted SVAR requires fewer restrictions. Moreover, as shown in Figure 3, the foreign interest rises in response to a contractionary monetary policy shock in the US, which is consistent with the results in Rüth (Reference Rüth2020).
$\frac{8\cdot 7}{2}=28$
restrictions are required to identify a unique structural shock under their strategies. In addition to this large number of restrictions, Kim and Roubini (Reference Kim and Roubini2000) and Bjørnland (Reference Bjørnland2009) treat the foreign interest rate in the SVAR as exogenous to permit contemporaneous interaction between the interest rate and the exchange rate in the identification strategy. However, this is counterintuitive because central banks in non-US countries often base monetary policy decisions on the Federal Reserve’s actions. Our shock-restricted SVAR requires fewer restrictions. Moreover, as shown in Figure 3, the foreign interest rises in response to a contractionary monetary policy shock in the US, which is consistent with the results in Rüth (Reference Rüth2020).
Studies such as Faust and Rogers (Reference Faust and Rogers2003), Scholl and Uhlig (Reference Scholl and Uhlig2008), and Kim et al. (Reference Kim, Moon and Velasco2017) directly impose sign restrictions on impulse responses and therefore obtain non-unique structural shocks that satisfy those restrictions. However, our approach differs in that we do not impose any restrictions on the shape of an impulse response a priori. Our restrictions are imposed on the characteristics of structural shocks based on historical experience and correlations with variables that are external to our SVAR. In addition, Kim et al. (Reference Kim, Moon and Velasco2017) argue that the delayed overshooting phenomenon disappears once the Volcker period is excluded from the sample. The sample period of our study is January 1985–December 2019, which is mostly outside the Volcker era. However, we show that the delayed overshooting phenomenon can be observed when the contemporaneous interaction between the interest rate and the exchange rate is not allowed even during our sample period. Hence, the results in our study imply that the exclusion of the Volcker period may not be a necessary condition to obtain the immediate overshooting.
Rüth (Reference Rüth2020) employs a proxy-SVAR approach using surprises in federal funds futures as monetary policy shocks, and demonstrates that the exchange rate exhibits instant overshooting in response to contractionary monetary policy shocks. Our study is similar to Rüth (Reference Rüth2020) in the sense that the contemporaneous interaction between the interest rate and exchange rate is allowed. However, our shock-restricted SVAR does not require the relevance condition and exogeneity condition that are required for the proxy-SVAR to be valid. Furthermore, our shock-restricted SVAR additionally incorporates real and financial uncertainties, which Kang and Park (Reference Kang and Park2024) identify as crucial for evaluating the effect of monetary policy correctly. The results in Figure 5 indicate that it is difficult to obtain a significant immediate response of the exchange rate when we shut off the contemporaneous interactions between uncertainties and other variables in the SVAR.
Rüth and Van der Veken (Reference Rüth and Van der Veken2023) combine the sign restriction approach with a narrative approach which is similar to the event constraints in our study. However, our approach differs in that we do not impose any restrictions on the shape of an impulse response a priori and that we use other historical events rather than the Volcker reform to narrow the set of plausible structural shocks, since the Volcker appointment falls outside our sample period.
6. Conclusion
Previous studies have had difficulty explaining the discrepancy between the estimated responses of the exchange rate to monetary policy shocks reported in empirical studies and theoretical predictions of these responses. We revisit this issue employing the recently developed shock-restricted SVAR with real and financial uncertainty measures. We demonstrate that the US exchange rate appreciates immediately following contractionary monetary policy shocks, with the maximum appreciation occurring within one to two months. Our findings suggest that the puzzling response of the exchange rates to contractionary monetary policy shocks observed in many previous studies may stem from the use of recursive identification restrictions and the omission of uncertainty measures. While studies such as Kim and Roubini (Reference Kim and Roubini2000), Bjørnland (Reference Bjørnland2009) and Rüth (Reference Rüth2020) emphasize the contemporaneous interactions between interest rate and exchange rates, our analysis shows that both these interactions and the inclusion of uncertainty measures are crucial for empirically resolving the delayed overshooting puzzle. Hence, this study also underscores the broader significance of uncertainty, not only in understanding business cycle dynamics in closed-economy setup but also in analyzing the exchange rate’s response to monetary policy shocks in open-economy setup.
Supplementary material
The supplementary material for this article can be found at https://doi.org/10.1017/S136510052610090X.
Acknowledgments
We are grateful to an associate editor and two anonymous referees for valuable comments. We also thank Kwangyong Park and conference and seminar participants at KERIC 2021, Bank of Korea, Korea University, and Korea University at Sejong for helpful comments and discussions. The usual disclaimers apply.
Data availability statement
Data and replication package are available at https://github.com/SeungyooShin/Shock-restricted-SVAR.


 Open access