


1. Introduction
Near-contact binaries (NCBs) are eclipsing binaries that show following characteristics commonly: continuous EB-type light variations, facing surface less than 0.1 orbital radius apart, short period (less than 1 d), and one or two components at or near their Roche lobes (Shaw Reference Shaw1994). According to their geometric structure, NCBs can be classified into following sub-classes: semi-detached systems with one component filling its critical Roche lobe (including SD1 and SD2 types, which represent systems with primaries and secondaries filling their critical Roche lobes, respectively), marginal contact, and marginal detached systems (Zhu & Qian Reference Zhu and Qian2009). Mass transfer occurs in such binaries frequently. NCBs have been the significant transition targets between tidal-locked detached systems and W UMa-type overcontact systems.
TT Cet was confirmed as one  $\beta$ Lyraes candidate system by Hoffman et al. (Reference Hoffman, Harrison, Coughlin, McNamara, Holtzman, Taylor and Vestrand2008), and the light curve showed EB-type characteristic (Deb & Singh Reference Deb and Singh2011). Brancewicz & Dworak (Reference Brancewicz and Dworak1980) obtained the geometric and physical parameters of this target using the iterative method. Duerbeck & Rucinski (Reference Duerbeck and Rucinski2007) acquired the preliminary orbit parameters through the radial velocity (RV) measurement. According to their investigation, the mass ratio was determined as $q_{sp}=0.39\pm0.07$, and the spectral type of the primary star was estimated as F4 V. Then Pribulla et al. (Reference Pribulla2009) measured the RVs of both components and confirmed a same spectra type for primary star as Duerbeck & Rucinski (Reference Duerbeck and Rucinski2007). Using the photometric and spectroscopic data of All Sky Automated Survey-3 project, new estimation of physical and absolute parameters (including a updated period of 0.485952 d) were made by Deb & Singh (Reference Deb and Singh2011). TT Cet was marked as a contact binary in the catalogue of Giuricin, Mardirossian, & Mezzetti (Reference Giuricin, Mardirossian and Mezzetti1983) and as a near-contact binary (NCB) in the catalogue of Shaw (Reference Shaw1994). Duerbeck & Rucinski (Reference Duerbeck and Rucinski2007) found that TT Cet might be a detached system rather than a semi-detached system with a quite faint and cool secondary component.
In this study, the first multi-colour high-precision light curves, low-resolution spectrum, and O–C diagram were acquired. The detailed light curve analysis, spectra fitting, and period investigation were presented. We also collected all known SD1-type NCBs with absolute parameters from the literatures. The relations of these parameters are summarised for these rare systems.
2. Observation and data reduction
2.1. Photometric observations
New light curve in Cousin  $I_c$ band (Bessell Reference Bessell1983) was observed on 2005 November 29, December 7, and 2006 February 3 with the Andor DW436 2K Charge Coupled Device (CCD) camera mounted on the 1-m telescope (labelled as ‘D1 m’) at Yunnan Observatories (YNO), Chinese Academy of Sciences (CAS). The first multi-colour light curves of this target in Johnson $-$Cousin $BVR_{c}I_{c}$ filters (Ažusienis & Straižys Reference Ažusienis and Straižys1969; Bessell Reference Bessell1983) were observed with the Andor DW936 2K CCD camera mounted on the 70-cm Sino-Thai telescope (labelled as ‘D70 cm’) locating at Lijiang Observing Station of YNO on 2018 December 25, 31 and 2019 January 24, 27. The detailed observation log is given in Table 1. PHOT package of IRAF was used to process all observation images.
Photometric observation Log of TT Cet

Observed CCD image of TT Cet. ‘Variable star’, ‘Comparison star’ are marked with ‘V’ and ‘C’, respectively. Ch(1 m) and Ch(70 cm) represent the corresponding check stars for light curves observed with ‘D1 m’ and ‘D70 cm’, respectively.

In order to distinguish the two sets of light curves, the light curve in the  $I_c$ band observed with 1-m telescope and light curves in the $BVR_{c}I_{c}$ band obtained with 70-cm telescope are labelled as ‘ $LC_{D1\,{\text{m}}}$’ and ‘ $LC_{D70\,{\text{cm}}}$’, respectively. The nearby invariable comparison star and check stars were chosen to determine the differential magnitudes. TYC 5278-951-1 was chosen as comparison star for the two sets of light curves. Because the field of views of the two telescopes are different, TYC 5277-893-1 and Gaia DR2 2464167327789832960 (Gaia Collaboration et al. 2018) ( ${\alpha}_{2000}={01}^{\text{h}}{47}^{\text{m}}{08}^{\text{s}}.34, \,{ \delta}_{2000}={-09}^{\circ}{45}^{\prime}{14}^{\prime\prime}.50$,) were chosen as check stars for light curves $LC_{D1\,{\text{m}}}$ and $LC_{D70 \,{\text{cm}}}$, respectively. The information of comparison and check stars along with the target TT Cet are listed in Table 2. In the table, the V band magnitudes were taken from the Tycho-2 Catalog (Høg et al. Reference Høg2000) and the G band magnitude of the check star $Check(Ch)_{LC_{1\,{\text{m}}}}$ was acquired from the Gaia DR2 data (Gaia Collaboration et al. 2018). The B–V colour indices of the variable star and comparison star are 0.44 and 0.56 (Høg et al. Reference Høg2000), respectively.
One observation image is shown in Figure 1. In the figure, variable star is marked with ‘V’, comparison star is marked with ‘C’, and check stars are marked with Ch(1 m) and Ch(70 cm), respectively. The light curves observed with telescope ‘D1 m’ and ‘D70 cm’ are shown in Figures 2 and 3, respectively. Different colours represent the data observed on different night. The square, circle, triangle, and rhombus signs show the B, V,  $R_c$, and $I_c$ band data, respectively. The magnitude difference of the comparison star and check star are shown in the bottom of the figures. The standard deviation of magnitude difference is about 0.009, 0.01 in the $LC_{D1\,{\text{m}}}$ and $LC_{D70\,{\text{cm}}}$, respectively. In Figures 2 and 3, one can see that the light curves are asymmetry, which show obvious O’Connell effect. Take the $LC_{D70\,{\text{cm}}}$, for example, the luminosity difference (i.e. Max.I $-$Max.II) of $BVR_cI_c$ bands are about 0.049, 0.046, 0.044, and 0.040 mag, respectively. And Max.I and Max.II are the maximum brightness at 0.25 and 0.75 phase of the light curve from the primary eclipse, respectively. We note that the luminosity differences of short-wavelength bands are larger than those of long-wavelength bands (i.e. short-wavelength bands are more sensitive to the perturbation causing O’Connell phenomenon than long-wavelength bands).
Light curve of TT Cet on the  $I_c$ band observed by ‘D1 m’.

Light curves of TT Cet on  $BVR_cI_c$ bands observed by ‘D70 cm’.

Spectrum of TT Cet observed on 2018 September 30. The black and red lines in the top panel represent the observed and fitted spectrum, respectively.

2.2. Spectra observation
The spectra observation was performed on 2018 September 30 with the Beijing Faint Object Spectrograph and Camera (BFOSC) mounted on the 2.16-m telescope of Xinglong station of National Astronomical Observatories of China (NAOC), CAS. Low-dispersion spectrometer BFOSC and grism G7 were used. The slit width and the line dispersion of grism G7 are 1.8 arcsec and 95  ${\AA} {\text{mm}}^{-1}$, respectively. The observation wavelength range is $400{-}680 {\text{nm}}$ (Fan et al. Reference Fan2016). IRAF was used to process the observation images and extract the spectra. Normalised flux was obtained and the atmospheric absorption lines were corrected. Because of the low resolution, the observed spectrum can only show the spectral lines of the primary star, and the lines of the secondary star may be too faint to be detected. The observed spectrum is shown in Figure 4 with black line. University of Lyon Spectroscopic analysis Software (ULySS) (Koleva et al. Reference Koleva, Prugniel, Bouchard and Wu2009) was employed to acquire the atmospheric parameters through full spectra fitting with model spectra generated by an interpolator with the ELODIE library (Prugniel & Soubiran Reference Prugniel and Soubiran2001). The red line in the Figure 4 shows the fitted spectrum. The stellar atmospheric parameters of the primary star of TT Cet were derived as: $T_{eff}=7\,091\pm124\, {\text{K}}$, $\log g=4.15\pm0.33\,{\text{cm}}/{\text{s}}^2$, $[Fe/H]=-0.23\pm0.04\,{{\text{d}}ex}$. The same method was used to analyse the data from the Large Sky Area Multi-Object Fiber Spectroscopic Telescope spectroscopic survey, and stellar atmospheric parameters of many binary systems were derived (Qian et al. Reference Qian, He, Zhang, Zhu, Shi, Zhao and Zhou2017, Reference Qian, Zhang, He, Zhu, Zhao, Shi, Zhou and Han2018, Reference Qian2019). Because the secondary star is quite faint and the primary star contributes the most light to the total system, the atmospheric parameters obtained by ULySS can be used to describe the atmospheric characteristic of the primary star. The temperature of the primary star can be adopted as 7 091 K. The comparisons of our calibrated spectrum with three standard spectra from the Sloan Digital Sky Survey (SDSS) (Vanden Berk et al. Reference Vanden Berk2001) are shown in Figure 5. From the figure, we can see that the primary component should be a F7-type star, which is agreed well with its colour ( $B-V=0.44$) (Cox & Pilachowski Reference Cox and Pilachowski2000).
Information of TT Cet and the corresponding comparison and check stars

Calibrated spectrum of TT Cet and the A9V, F7, G0 standard spectra from SDSS (Vanden Berk et al. Reference Vanden Berk2001)

3. O–C diagram analyses
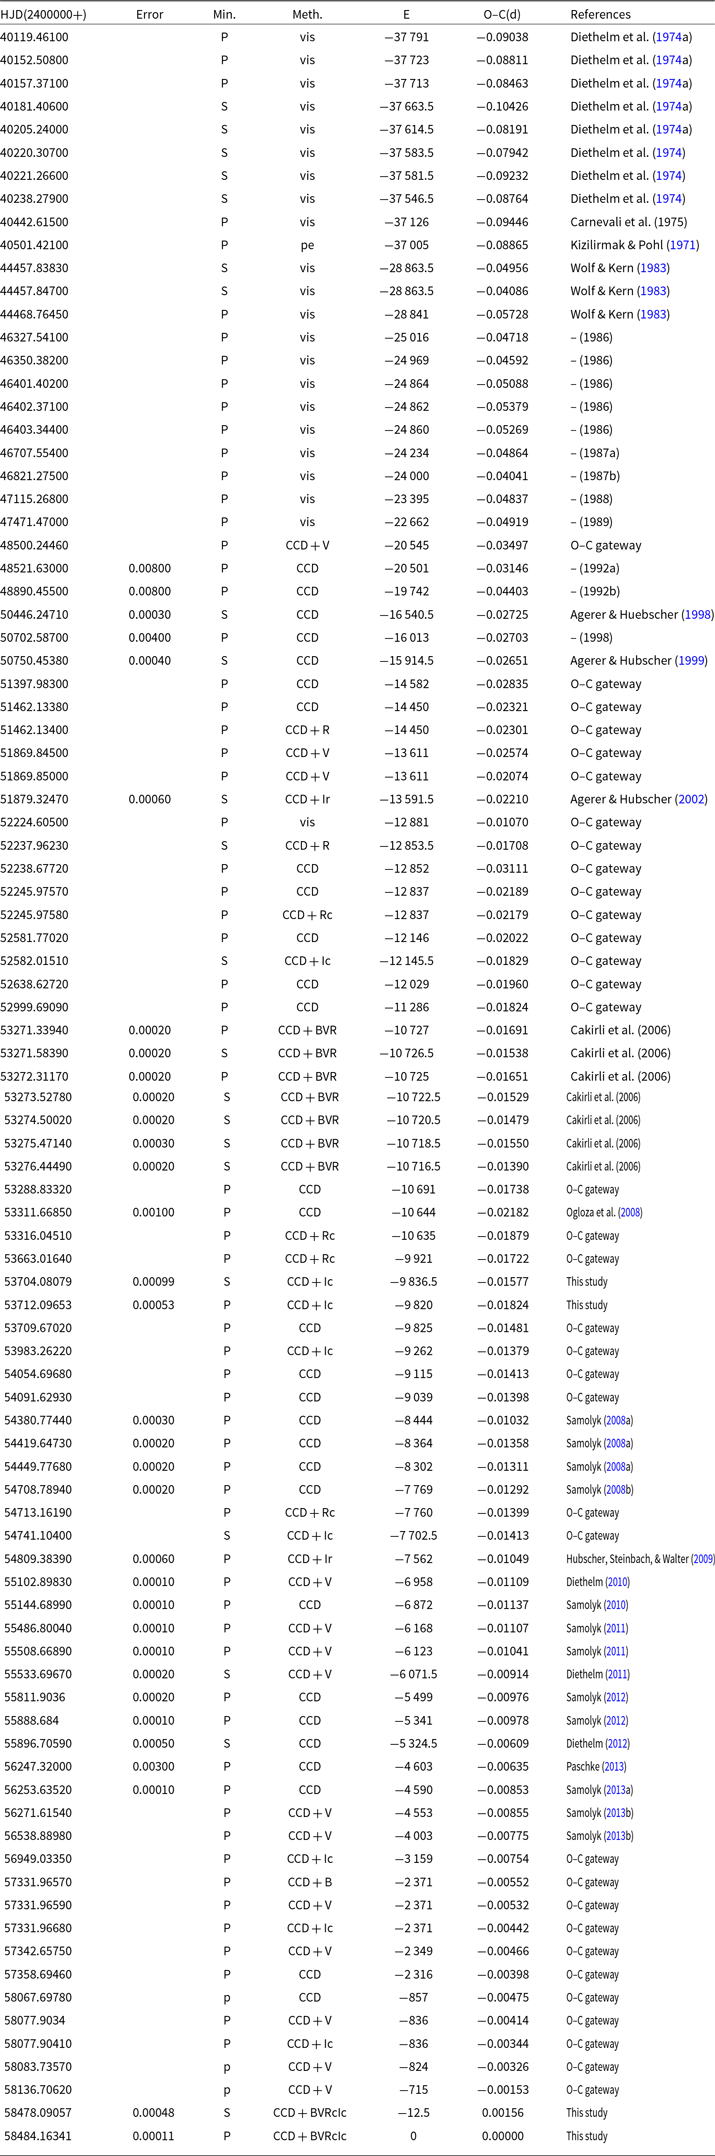
We collected all available times of light minimum with error. Combined with four eclipse times observed by us, totally 92 eclipse times crossing about 50 yr were used to construct the O–C diagram. All eclipse times with available error used for the period analysis are listed in Table 3, in which P and S marked the primary and secondary eclipse times, respectively. The O–C gateway in the reference column means that the data were collected from the O–C gateway web and the original publications are unavailable on line. The corresponding O–C and cycle E were computed with follow ephemeris.
 \begin{eqnarray}Min \emph{I}=HJD 2458484.16341+0.485952^{d}\times E.\end{eqnarray}
The O–C diagram of TT Cet is plotted in Figure 6 with error bars, in which the cross, triangle, and circle dot signs represent the data obtained with visual (vis), photoelectricity (Pe), and CCD-type detectors, respectively. A weight of 1 for vis data and a high weight of 5 for Pe and CCD data were applied in the O–C analysis. Based on the least-squares method, the following equation can be used to describe the O–C diagram:
 \begin{eqnarray}Min \emph{I}=HJD\,2458484.16134(.00009)\end{eqnarray}
 \begin{eqnarray} \quad\qquad +\,0.485953({\pm}0.001321)\times{E}\end{eqnarray}
 \begin{eqnarray} \quad\qquad -\,3.33({\pm}0.04)\times 10^{-11}\times{E}^{2}.\end{eqnarray}
The quadratic term in the equation signifies that the period is undergoing a long-term decrease at a rate of  $dP/dt=-5.01({\pm}0.06)\times 10^{-8}\,{{\text{d}} \cdot{yr}}^{-1}$. The fitted curve was plotted in Figure 6 with black line and the residuals were shown in the bottom. There is no other change in the residuals and no third body was detected through our period analysis.
Times of light minima of TT Cet
O–C diagram of TT Cet

4. Light curve analyses
The multi-colour light curves of TT Cet were obtained for the first time. In order to acquire the phased light curves more accurately, different linear ephemerides were used for two sets of light curves. For the light curve  $LC_{D1 \,{\text{m}}}$, the following linear ephemeris was used:
 \begin{eqnarray}Min \emph{I}=HJD\,2453712.09653(99)+0.485952^{d}\times E.\end{eqnarray}
While for the light curves  $LC_{D70 \,{\text{cm}}}$, the following linear ephemeris was used:
 \begin{eqnarray}Min \emph{I}=HJD\,2458484.16341(11)+0.485952^{d}\times E,\end{eqnarray}
in these equations, epoch 2453712.09653(99) and 2458484.16341(11) are the primary eclipse times observed during the corresponding light curve observation. $\sum\,{-}\,q$ curves.

Wilson–Devinney (W–D) program (Wilson & Devinney Reference Wilson and Devinney1971; Wilson Reference Wilson1990, Reference Wilson2012) was used to analyse the light curves. During the solution process, the effective temperature of the primary star was fixed at 7 091 K, which was estimated from our spectral analysis. The RV data of two components acquired from Duerbeck & Rucinski (Reference Duerbeck and Rucinski2007) and Pribulla et al. (Reference Pribulla2009) were applied in the WD modelling, which can help to obtain more reliable measurements of the components, such as masses. The phase of the data was recalculated using a more appropriate epoch 2450702.587(4) and a period of 0.475852 d. The gravity-darkening coefficients of the components are adopted as  $g_1=g_2=0.32$. The bolometric albedos are taken as $A_1=A_2=0.5 $ (Ruciński Reference Ruciński1969) according to the convective envelopes ( $T<7\,200$ K) of both components. Meanwhile, the bandpass limb-darkening coefficients [taken from van Hamme (Reference van Hamme1993)] and the logarithmic bolometric coefficients were applied. As we can see in Figures 2 and 3, the light curves show obvious O’Connell effect with brightness enhancement at the primary light maximum. The asymmetry means that the light curves have been disturbed by some perturbation caused by the photospheric activity of the component. We note that the short-wavelength bands behaved more sensitive to the perturbation than long-wavelength bands. Moreover, for such late type system, hot spot model should be more convictive to explain the brightness enhancement around phase 0.10–0.40. The convergent solutions with mode 4 (the semi-detached case with the primary component filling the critical Roche lobe) and mode 3 (over contact case) with a hot spot were acquired. Spot model was employed for the light curve fit with four adjustable parameters: the latitude of spot center ( $\theta$) in degree; the longitude of spot center ( $\phi$) in degree; spot angular radius (r) in radian; and the spot temperature fact $T_f$ ( $T_f=T_s/T_\ast$, in which $T_s$ is the spot temperature and $T_\ast$ is the photosphere surface temperature of the star). The adjustable parameters of mode 4 are as follow: the monochromatic luminosity of primary star, $L_{1B}$, $L_{1V}$, $L_{1R_c}$, $L_{1I_c}$; the orbital inclination, i; the mean temperature of secondary star, $T_2$; and the dimensionless potential of the secondary star, $\Omega_2$. Compared with mode 4, the only one different adjustable parameter of mode 3 is the dimensionless potential of the components $\Omega_1=\Omega_2$. The third light $L_3$ was adjustable parameter at each mode, but no converged result was obtained. In order to confirm a more reliable mass ratio, the photometric solutions based on a group of assumed mass ratio values from 0.01 to 1 were obtained with the differential correction program. The search step length is 0.01. For all assumed values of q, the sums of weighted square deviations ( $\sum{(O-C)_i}^2$) with mode 3 and mode 4 are displayed in Figure 7. One can see from this figure, the minimal values achieved at $q=0.43$ and $q=0.42$ with mode 4 and mode 3, respectively. Then, the mass ratio was made as one adjustable parameter. The theoretical light curves obtained from mode 3 and mode 4 are shown in Figure 8 with green lines and black lines, respectively. The spotted theoretical light curves with both modes fitted the observed light curves very well. The final converged photometric solutions show that the brightness enhancement can be explained by the appearance of a hot spot near the facing surface of the secondary component due to the mass transfer. All converged photometric solutions are listed in Table 4. The uncertainty of mass ratio in the table was given by WD program with the standard method. In addition, the q-search curve bottom can be used to confirm the uncertainty of the mass ratio. It can be seen from Figure 7, the q-search bottom with mode 3 is clearly sharp around 0.420(1), the uncertainty may be 0.01. The q-search bottom with mode 4 is narrow (visually, from 0.42 to 0.44), so the mass ratio 0.430(4) may have an uncertainty of 0.04. The geometric structure in 3D view with mode 4 is shown in Figure 9, and the bolding region shows the position of the hot spot.
Spotted photometric solutions of TT Cet

LC, light curve
The theoretical light curves with hot spot of TT Cet with mode 3 and mode 4.

Geometrical structure of TT Cet with bolding region marking the position of the hot spot with mode 4.

5. Discussion and conclusion
5.1. Investigation on TT Cet
The atmosphere parameters of the primary component obtained from the spectra fit are as follows:  $T_{eff}=7\,091\pm124 \,{\text{K}}$, $\log g=4.15\pm0.33 \,\text{cm}/\text{s}^2$, and $[Fe/H]=-0.23\pm0.04 \,\text{dex}$. The light curves of this target show $\beta$ Lyrae characteristics. The asymmetrical light curves show obvious O’Connell effect with about 0.05 mag brightness enhancement around the primary light maximum. The spotted theoretical light curves with mode 3 and mode 4 fitted the light curves quite well. The brightness enhancement around phase 0.10–0.40 could be explained by a hot spot near the facing surface of secondary component causing by the mass transfer from the primary component. The solution with over contact mode shows that the system should be an extremely shallow contact binary with $f=0.013(7)$. Therefore, the semi-detached mode, with the primary component filling its Roche lobe, may be more reasonable than the contact model. TT Cet should be one SD1-type near-contact binary. Such brightness enhancement also appears in other SD1-type NCBs, such as BL And (Zhu & Qian Reference Zhu and Qian2006), BS Vul (Zhu et al. Reference Zhu, Zejda, Mikulášek, Liška, Qian and de Villiers2012), GR Tau (Qian Reference Qian2002a), and V473 Cas (Zhu et al. Reference Zhu, Qian, Zola and Kreiner2009). The solutions with semi-detached mode show that the primary component of TT Cet has already filling its Roche lobe and the secondary is nearly filling the Roche lobe with a fill-degree factor $f(fill-degree)_2=0.966(53)$. The orbital inclination is $i=82.59(29)^\circ$, which means that the system is totally eclipse and the photometric solutions are reliable. The temperaturedifference between the components is about 1700 K. TT Cet should consist of a F7-type primary star and a G7-type secondary star (Cox & Pilachowski Reference Cox and Pilachowski2000). The semi-major axis was estimated as $a=3.405282{\text{R}}_\odot$ through the WD progress, which can be used to compute the total mass M of the binary system
 \begin{eqnarray}M=M_1+M_2=\displaystyle\frac{4\pi^2a^3}{GP^2},\end{eqnarray}
then, using the determined photometric solutions of mode 4, the absolute parameters can be estimated as follows:  $M_1=1.573 ({\pm}0.044){\text{M}} _\odot$, $M_2=0.677 ({\pm}0.082){\text{M}}_\odot$, $R_1=1.551 ({\pm}0.002){\text{R}}_\odot$, $R_2=1.039 ({\pm}0.002){\text{R}}_\odot$, $L_1=5.464 ({\pm}0.394){\text{L}}_\odot$, and $L_2=0.972({\pm}0.003){\text{L}}_\odot$.
All available eclipse times were used to investigate the variations of the orbital period by analyzing the O–C diagram. The O–C analysis found that the period of TT Cet is decreasing at a rate of  $dP/dt=-5.01({\pm}0.06)\times 10^{-8}\,{{\text{d}} \cdot{yr}}^{-1}$. Such long-term period decrease may be the results of mass transfer from the primary component to the secondary one and the angular momentum loss (AML) from the binary system [e.g., Zhu et al. (Reference Zhu and Qian2009), (Reference Zhu, Zejda, Mikulášek, Liška, Qian and de Villiers2012), Liao et al. (Reference Liao, Qian, Li, Zhou, Zhao and Zhang2017), Liao, Qian, & Sarotsakulchai (Reference Liao, Qian and Sarotsakulchai2019)]. Case A mass transfer from primary to the secondary component occurs commonly in SD1-type semi-detached systems, such as BL And (Zhu & Qian Reference Zhu and Qian2006). The thermal timescale and nuclear timescale of the primary star are $\tau_{th}=2\times10^7 {M_2}^2/{L_2}{R_2}=9.08\times10^6$ yr and $\tau_N=10^{10}{M_2}/{L_2}=6.97\times10^9$ yr, respectively. The timescale of period decrease is $\tau_p=P/\dot{P}=9.7\times10^6$ yrs, which is more close to the thermal timescale of the primary star. It means that the mass transfer in TT Cet is occurring on the thermal timescale of the primary star. Assuming the conservation of mass, the following equation can be used to calculate the rate of mass transfer:
 \begin{eqnarray}\centering \dot{P}/{P}=3(1-{M_2}/{M_1})\cdot{M_2}/{M_2.} \end{eqnarray}
This leads to  $\dot{M_2}/{M_2}=6.03({\pm}0.12)\times 10^{-8} {\text{yr}}^{-1}$, and the timescale of mass transfer is $\tau \sim{M_2}/\Delta {M_2}\sim1.67\times 10^{7}$ yrs. We note that such a period change may also be one part of a cyclic variation caused by the third body with a much longer period, such as 250 yr, while this possibility also needs more observation evidence.
Using the Kepler third law and the photometric solutions with mode 4, the mean densities of the primary and secondary star were calculated as  $\rho_1=0.420\rho_\odot$ and $\rho_2=0.601\rho_\odot$, respectively. The corresponding logarithm values are $\log \rho_1/\rho_\odot=-0.377$ and $\log \rho_2/\rho_\odot=-0.221$. Compared with the main sequence stars with same spectra type (Cox & Pilachowski Reference Cox and Pilachowski2000), the mean densities of both components are quite lower, which indicates that the components may evolved away from the zero age main sequence (ZAMS) line.
The asymmetrical light curves of TT Cet show obvious brightness enhancement around the primary light maximum, which may be caused by the hot spot on the surface of the secondary component. Accretion stream caused by the long-term mass transfer from the primary star will emerge on the surface of the secondary component, and then it will move to one side of the midline of the two stars, which will lead to local brightness enhancement of the surface (Hilditch et al. Reference Hilditch, Collier Cameron, Hill, Bell and Harries1997). The latitude and longitude of the spot centre are about  $85.81^{\circ}$ and $100.56^{\circ}$, and the angular radius of the spot is about $22.6^{\circ}$, which follow the law of hot spot distribution on the secondary component (Hilditch et al. Reference Hilditch, Bell, Hill and Harries1998). Hot spot is one kind of vestige of mass transfer, so the area of hot spot can be regarded as an indirect measurable parameter of mass transfer. The proportion of hot spot area in the surface of the secondary component is about 3.16%. Moreover, the long-term orbital period decrease of TT Cet supports the mass transfer from the primary to the secondary and is consistent with its primary filling configuration, which is another evidence of the mass transfer between components.
Semi-detached systems with lobe filling primaries like TT Cet are particular targets lying on key evolutionary phases, which are quite rarely in observation. TT Cet maybe in the broken contact stage predicted by the thermal relaxation oscillations theory (TRO) (Lucy Reference Lucy1976; Flannery Reference Flannery1976; Robertson & Eggleton Reference Robertson and Eggleton1977; Lucy & Wilson Reference Lucy and Wilson1979). The geometric structure of such semi-detached system with the primary filling the Roche lobe and the secondary nearly filling the Roche lobe is quite instability. However, such oscillation phase is quite short compared with the whole life times of the components. During the semi-detached phase, the light curves of such systems show classical EB-type characteristic. The orbit will shrink, and the period will decrease continuously because of the Case A mass transfer from the primary component to the secondary one. The period decrease and the semi-detached configuration with lobe filling primary reveal that TT Cet has reached the broken contact stage. Meanwhile, the AML via magnetic braking could also play a key role during the evolution process [e.g., Qian (2001) and (Reference Qian2003)]. With the period decrease, the secondary star will expand to fill the Roche lobe, then TT Cet will eventually evolve to the contact stage [e.g., Liao, Qian & Liu (Reference Liao, Qian and Liu2012) and Qian & Yang (Reference Qian and Yang2005)]. It is another good observational example supporting the TRO theory.
The  $dP/dt$-P relation of SD1-type NCBs.

Parameters of SD1-type near-contact binaries

(1) = Yamasaki & Okazaki (Reference Yamasaki and Okazaki1986); (2) = Qian (Reference Qian2002b); (3) = Lipari & Sistero (Reference Lipari and Sistero1987); (4) = Siwak, Zola, & Koziel-Wierzbowska (Reference Siwak, Zola and Koziel-Wierzbowska2010); (5) = Lister (Reference Lister and Stempels2009); (6) = Hilditch et al. (Reference Hilditch, Collier Cameron, Hill, Bell and Harries1997); (7) = Zhu & Qian (Reference Zhu and Qian2006); (8) = Kang et al. (Reference Kang, Kim, Lee and Oh2001); (9) = Oh et al. (Reference Oh, Kim and Lee1997); (10) = Duerbeck & Karimie (Reference Duerbeck and Karimie1979); (11) = Hilditch & King (Reference Hilditch and King1986); (12) = Van Hamme et al. (Reference Van Hamme, Samec, Gothard, Wilson, Faulkner and Branly2001); (13) = Cai et al. (Reference Cai, Yu, Hu and Xiang2019); (14) = Qian (Reference Qian2002a); (15) = Gu et al. (Reference Gu, Chen, Choy, Leung, Chung and Poon2004); (16) = Lipari & Sistero (Reference Lipari and Sistero1986); (17) = Zhu et al. (Reference Zhu, Qian, Zola and Kreiner2009); (18) = Zhu et al. (Reference Zhu, Zejda, Mikulášek, Liška, Qian and de Villiers2012); (19) = İbanoǧlu, Çakırlı, & Dervişoǧlu (Reference İbanoǧlu, çakırıl and Dervişoǧlu2010); (20) = Turner et al. (Reference Turner, Panko, Sergienko, Lane and Majaess2008); (21) = Liu, Zhang, & Zhang (Reference Liu, Zhang and Zhang1988); (22) = Jafarzadeh (Reference Jafarzadeh2006); (23) = Milano et al. (Reference Milano, Barone, Mancuso, Russo and Vittone1989); (24) = Terrell & Nelson (Reference Terrell and Nelson2014); (25) = Austin et al. (Reference Austin, Robertson, de Souza, Tycner and Honeycutt2011); (26) = Ulaş et al. (Reference UlaŞ, Kalomeni, Keskin, Köse and Yakut2012); (27) = Li et al. (Reference Li, Hu, Guo, Jiang, Gao and Chen2014); (28) = Zhu et al. (Reference Zhu2014); (29) = Haans & Malasan (Reference Haans and Malasan2019); (30) = He & Qian (Reference He and Qian2010); (31) = Samec et al. (Reference Samec, Nyaude, Caton and Van Hamme2016); (32) = Samec et al. (Reference Samec, Kring, Flaaten, Faulkner and Van2014).
The R–P, L–P, and M–P relations of SD1-type NCBs.

5.2. Preliminary statistic results of SD1-type NCBs
We collected all ascertained SD1-type NCBs from the literatures based on the tables of Zhu et al. (Reference Zhu, Qian, Zola and Kreiner2009) and Zhu & Qian (Reference Zhu and Qian2009). These systems were tabulated in Table 5. The light curves of SD1-type NCBs show enhanced brightness around the primary maximum commonly. The periods of the samples are all less than 1 d. The periods only show decrease variation, which indicates that the mass transfer may play an important role in the structural evolution process of these systems, which has been suggested by Zhu et al. (Reference Zhu, Qian, Zola and Kreiner2009) and Zhu & Qian (Reference Zhu and Qian2009).
The correlation of  $dP/dt$-P of SD1-type NCBs is shown in Figure 10, which is similar to the corresponding correlations of the SD2-type NCBs and the Algol semi-detached systems with decreasing periods (Zhu & Qian Reference Zhu and Qian2009). The function of the linear fit is $dP/dt=0.30({\pm}0.81)-2.68({\pm}1.32)P$. The radii-period (R–P, including $R_1$–P and $R_2$–P), luminosity-period (L–P, including $L_1$–P and $L_2$–P) and mass-period (M–P, including $M_1$–P and $M_2$–P) relations are plotted in Figure 11. The radii-mass (R–M) and luminosity-mass (L–M) relations are plotted in Figure 12. The corresponding relation equations are listed as follow, in which r represents the correlation coefficient,
 \begin{eqnarray}\log R_1/{\text{R}}_\odot=0.50(3)+1.03(10)\log P(r=0.83),\end{eqnarray}
 \begin{eqnarray}\log R_2/{\text{R}}_\odot=0.29(2)+0.96(8)\log P(r=0.88),\end{eqnarray}
 \begin{eqnarray}\log L_1/{\text{L}}_\odot=1.44(17)+2.35(60)\log P(r=0.46),\end{eqnarray}
 \begin{eqnarray}\log L_2/{\text{L}}_\odot=0.34(16)+2.28(58)\log P(r=0.46),\end{eqnarray}
 \begin{eqnarray}\log M_1/{\text{M}}_\odot=0.35(5)+0.71(16)\log P(r=0.47),\end{eqnarray}
 \begin{eqnarray}\log M_2/{\text{M}}_\odot=0.003(64)+0.69(22)\log P(r=0.28),\end{eqnarray}
 \begin{eqnarray}\log R/{\text{R}}_\odot=0.14(2)+0.60(8)\log M/{\text{M}}_\odot(r=0.59),\end{eqnarray}
 \begin{eqnarray}\log L/{\text{L}}_\odot=0.33(5)+2.71(24)\log M/{\text{M}}_\odot(r=0.79).\end{eqnarray}
The R–M and L–M relations of SD1-type NCBs.

The temperature-luminosity diagram of SD1-type NCBs.

The above relationships are vary similar to that of NCBs acquired by Zhu et al. (Reference Zhu, Qian, Zola and Kreiner2009) and Zhu & Qian (Reference Zhu and Qian2009). We note that in Figure 11, there are two total absences of samples with periods around 0.35 and 0.5 d. The gap near 0.5 d may be caused by the selection effect of the samples apparently, because the binaries with period close to 12 h are difficult to observe. Such gap also appears in the relation of contact binaries (Gazeas & Niarchos Reference Gazeas and Niarchos2006). While the gap near 0.35 d is very interesting, more observation data are needed to understand this feature. The radii, luminosity, and mass of components are correlated with the period of the system, which is shown obviously in Figure 11. The correlation coefficient of the R–P relation is much larger than that of L–P and M–P relations. The coefficient of radii-mass relation and luminosity-mass relation are estimated as 0.60 and 2.71, respectively. The coefficient of R–M relation is larger than that of W UMa-type over-contact systems (0.46), but less than that of detached systems (0.724). Meanwhile, the coefficient of L–M relation is very near to that of the main sequence systems (2.76). The temperature-luminosity diagram of SD1-type NCBs including TT Cet is plotted in Figure 13. In the figure, the ZAMS and terminal-age main sequence lines are acquired by Schaller et al. (Reference Schaller, Schaerer, Meynet and Maeder1992) at  $Z=0.020$. From the figure, we can see that the primary components of SD1-type NCBs are located in the main sequence, and the secondaries have evolved from the main sequence. The results indicate that the two components of SD1-type NCBs may lay in the similar evolutionary, and the secondary component has higher degree of evolution.
Acknowledgements
We are very appreciate and feel great thankful for the hard works on the fight to COVID-19 to the Chinese people and all the people worldwide. We would like to thank the editor and the referee very much for the very valuable and useful comments that help improved this paper. This work was partly supported by the National Natural Science Foundation of China (Nos. 11922306, U1631108, and U1831109) and CAS Interdisciplinary Innovation Team. We acknowledge the support of the staff of the Xinglong 2.16-m telescope. This work was partially supported by the Open Project Program of the Key Laboratory of Optical Astronomy, National Astronomical Observatories, Chinese Academy of Sciences.
CCD photometric observations of the system were obtained with the 1-m telescope administered by YNO and the 70-cm telescope at Lijiang station, YNO. The spectra observation were obtained with the 2.16-m telescope at Xinglong station of National Astronomical Observatory.


