


1. Introduction
Surface albedo controls the radiation balance and thus the melting of snow and ice on glaciers. Because the mass balance of many of the world's glaciers is typically dominated by net shortwave radiation (e.g. Pellicciotti and others, Reference Pellicciotti2008; Oerlemans and others, Reference Oerlemans, Giesen and van den Broeke2009; Ayala and others, Reference Ayala, Pellicciotti, Macdonell, Mcphee and Burlando2017; Liang and others, Reference Liang, Cuo and Liu2018; Litt and others, Reference Litt2019; Schaefer and others, Reference Schaefer, Fonseca, Farias-Barahona and Casassa2019), long-term changes in albedo are a principal driver for mass loss (Takeuchi and others, Reference Takeuchi, Fujisawa, Kadota, Tanaka and Miyairi2015; Schmidt and others, Reference Schmidt2017; Zhang and others, Reference Zhang2017; Ryan and others, Reference Ryan2019). Glacier surface albedo has been documented to decrease at the rates of ~−0.02 to −0.03 per decade for mountain glaciers of the European Alps (Fugazza and others, Reference Fugazza2019; Naegeli and others, Reference Naegeli, Huss and Hoelzle2019), up to −0.1 per decade for the surface of the Greenland Ice Sheet (Riihelä and others, Reference Riihelä, King and Anttila2019) and up to −0.05 per decade on parts of Vatnajökull, Iceland (Gunnarsson and others, Reference Gunnarsson, Gardarsson, Pálsson, Jóhannesson and Sveinsson2020).
As glaciers lose mass and shrink, the amount of supraglacial debris can be augmented due to meltout of internally suspended rock material or avalanching due to permafrost degradation and/or pressure release (e.g. Kirkbride and Deline, Reference Kirkbride and Deline2013). The subsequent exposure of a darkened surface incites further absorption of shortwave radiation and enhances the melting of the glacier ice surface (Oerlemans and others, Reference Oerlemans, Giesen and van den Broeke2009). Further still, deposition of black carbon and mineral dust has been documented on the surface of the mountain snowpack, valley glaciers and ice sheets due to increasing aerosol emissions (Ming and others, Reference Ming, Du, Xiao and Xu2012; Rowe and others, Reference Rowe2019), dust storms (Gabbi and others, Reference Gabbi, Huss, Bauder, Cao and Schwikowski2015), locally-sourced mineral dust from bare ground (Yue and others, Reference Yue2020) and occurrence of forest fires (Klok and others, Reference Klok, Nolan and van den Broeke2005; de Magalhães Neto and others, Reference de Magalhães Neto, Evangelista, Condom, Rabatel and Ginot2019). Tracing the origins of these melt-enhancing particulates is not simple (Gabbi and others, Reference Gabbi, Huss, Bauder, Cao and Schwikowski2015), and thus understanding their influence on past and present glacier changes still remains unclear. Nevertheless, the importance of such events is becoming increasingly apparent (Goelles and others, Reference Goelles, Bøggild and Greve2015; Goelles and Bøggild, Reference Goelles and Bøggild2017; de Magalhães Neto and others, Reference de Magalhães Neto, Evangelista, Condom, Rabatel and Ginot2019).
In the semi-arid Andes of central Chile, glaciers have been shrinking at a substantial rate since at least the 1950s (Malmros and others, Reference Malmros, Mernild, Wilson, Yde and Fensholt2016; Masiokas and others, Reference Masiokas2016; Farías-Barahona and others, Reference Farias-Barahona2019, Reference Farias-Barahona2020a, Reference Farías-Barahona2020b). A key driver in this mass loss has been identified as precipitation variability (Masiokas and others, Reference Masiokas2016), and more recently by scarcity in winter precipitation (Burger and others, Reference Burger, Brock and Montecinos2018; Farías-Barahona and others, Reference Farias-Barahona2019) following unprecedented and prolonged regional drought (Garreaud and others, Reference Garreaud2017, Reference Garreaud, Boisier, Rondanelli, Montecinos, Sepúlveda and Veloso‐Aguila2019). Following a large, 12% per decade decline in regional snow cover area (Cordero and others, Reference Cordero2019) and increase in equilibrium line altitude (ELA) (Saavedra and others, Reference Saavedra, Kampf, Fassnacht and Sibold2018; Barria and others, Reference Barria, Carrasco, Casassa and Barria2019; Ayala and others, Reference Ayala2020), the snow albedo of the central Andes of Chile and Argentina has been observed to have decreased at a rate of 0.5% a−1 since 2000 using MODIS satellites (Malmros and others, Reference Malmros, Mernild, Wilson and Tagesson2018). Although there is a clear pattern emerging of this regional decline, no study has yet focused upon the change of surface albedo at the glacier scale. This is particularly important, as glaciers act as a seasonal buffer of streamflow for dry years, and their relative hydrological contribution has been increasing in recent decades (Burger and others, Reference Burger2019; Ayala and others, Reference Ayala2020).
Here, we examine the 1986–2020 record of surface albedo using the Landsat catalogue for glaciers in the central Chilean Andes, with a specific focus on glaciers located between 33 and 34°S. Our objectives are threefold: (i) identify the patterns and trends in average glacier-wide and ice albedo, (ii) explore the impact of the recent (2010–2020) ‘Mega-Drought’ on glacier albedo, and (iii) assess the potential controls of regional climate on the inter-annual variability of albedo.
2. Study site
The Andes of central Chile (31–35°S) are characterised by a seasonally dry, Mediterranean climate (Köppen class: Csb, dry-summer subtropical) (Sarricolea and others, Reference Sarricolea, Herrera-Ossandon and Meseguer-Ruiz2017), minimal vegetation and a mean annual (1986–2020) rainfall of between 150 (32.5°S) and 1000 (34.5°S) mm (data accessed from http://explorador.cr2.cl/, last access 08/05/2020). Observations have shown that ~86% of precipitation falls between May and September (Shaw and others, Reference Shaw, Gascoin, Mendoza, Pellicciotti and McPhee2020) and serious prolonged drought since 2010 has resulted in negative trends of snow cover extent, streamflow and evapotranspiration (Garreaud and others, Reference Garreaud2017, Reference Garreaud, Boisier, Rondanelli, Montecinos, Sepúlveda and Veloso‐Aguila2019). The glaciers of the central Andes are small valley types (~2600 Chilean glaciers for 32–36°S; Barcaza and others, Reference Barcaza2017) which are exhibiting increased mass loss (Braun and others, Reference Braun2019; Dussaillant and others, Reference Dussaillant2019; Farías-Barahona and others, Reference Farias-Barahona2019, Reference Farias-Barahona2020a, Reference Farías-Barahona2020b) and reduction in spring snow cover (Mernild and others, Reference Mernild2016; Garreaud and others, Reference Garreaud2017; Cordero and others, Reference Cordero2019), thus increasing the relative contribution of ice melt to seasonal streamflow (Burger and others, Reference Burger2019; Ayala and others, Reference Ayala2020). Reduction of annual precipitation and vegetation health has resulted in changes in land surface cover exposing soil to erosion, likely exacerbating the transportation of dust particles in a drier atmosphere (e.g. Shepherd and others, Reference Shepherd2016; Ameri and others, Reference Ameri, Briant and Engels2019). Between 1979 and 2015, parts of the region have experienced a mean warming trend of up to 0.47°C per decade, though this has not been consistent between coastal and mountain regions (Burger and others, Reference Burger, Brock and Montecinos2018). During the so-called ‘Mega-Drought’ (2010–2020 in this study), the region has seen increases of up to ~0.8°C in mean annual air temperature (including record temperature maxima in January 2019) and up to a 50% reduction in annual precipitation relative to the 1986–2009 period (data accessed from http://explorador.cr2.cl/, last access 08/05/2020). The 2019–2020 hydrological year (April 2019–March 2020) represented the second driest since modern records in the capital, Santiago began (Quinta Normal Station: 1950–present) and the driest since the beginning of the Landsat observation record. For this period, mean hydrological annual air temperature was up to 1.5°C greater than the 1986–2009 mean. For precipitation, the reduction was up to 90% relative to the same baseline period.
3. Data and methods
3.1. Landsat albedo derivation
We obtained the end of summer Landsat imagery (tile path 233 and rows 083 and 084) for 18 study glaciers across the defined central Chilean Andes (Table 1). Multispectral bands of Tier 1 imagery from Landsat 5 (TM), 7 (ETM+) and 8 (OLI) were downloaded using the USGS earth explorer (https://earthexplorer.usgs.gov/) for the years 1986–2020. We manually identified the optimal scene for minimal snow and cloud coverage which was between 12 March and 12 April. For each date, we applied atmospheric corrections based upon the improved dark object subtraction algorithm (Chavez, Reference Chavez1996) implemented in Matlab (Abouali, Reference Abouali2015) and calculated the broadband shortwave albedo following Liang (Reference Liang2001):

where bi represents the narrowband ground reflectance of TM/ETM+ in band i. The band numbers were adjusted accordingly for processing OLI scenes. This conversion, developed on band configurations of TM and ETM+ by Liang and others (Reference Liang2001) has been shown to be suitable for calculating broadband albedo for all Landsat generations when tested on valley glaciers of Switzerland by Naegeli and others (Reference Naegeli2017, Reference Naegeli, Huss and Hoelzle2019). Scenes from older Landsat generations (e.g. Landsat MSS) were not acquired due to the band requirements of the albedo approach applied.
A summary of the glaciers in this investigation, grouped by sub-zone
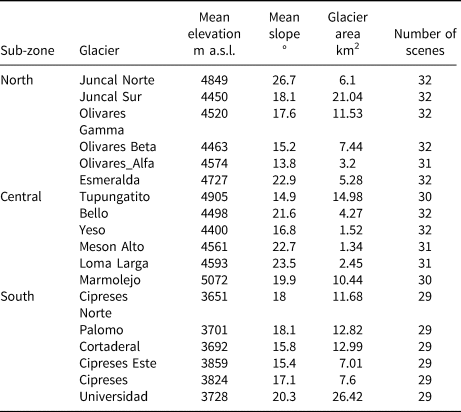
Glacier information is based upon the March 2020-delineated glacier areas.
3.2. Landsat data filter
Based upon a 30 ASTER (Advanced Spaceborne Thermal Emission and Reflection Radiometer) digital elevation model (DEM) and the solar geometry information from the Landsat metadata, we calculate the shadow coverage of all scenes for each glacier. We used the calculated maximum shadowed area on each glacier to restrict the valid pixels for all years, thus retaining a consistent set of pixels for inter-annual comparison and derivation of trends. We furthermore remove pixel values associated with slope angles >45° in the DEM that represent albedo derivation for crevasses and icefalls or an increase in uncertainty associated with anisotropy effects (Klok and others, Reference Klok, Greuell and Oerlemans2003).
We extracted the calculated albedo using the individual glacier shapefiles, delineated using 3 m resolution PlanetScope imagery (19 April 2020; PlanetTeam, 2018), geo-referenced to the 2020 Landsat OLI scene in ArcMap 10.3. As 2020 represents the last and the driest year of the analysis period, it provides a suitable condition for area delineation of each glacier because border ambiguities of the glacier accumulation zone are minimised due to the lack of snow cover. In using the last year of the analysis period for area delineation, we ignore the retreat of the glacier termini and the transition to ice-free cells (Naegeli and others, Reference Naegeli, Huss and Hoelzle2019), therefore, again, focusing on a spatially constant area (Table 1).
We mask albedo values as ‘no data’ if: (i) α < 0.05 or α > 1 (<0.1% of all data); (ii) if contained within the ‘striping’ caused by ETM+ scan line corrector failure; (iii) if exposed to band saturation (TM/ETM+) or; (iv) are obscured by cloud. Given the dominance of clear-sky conditions for the region in summer, the latter was evident only for 1990 over some glaciers in the central sub-zone. We therefore chose to exclude the 1990 scene for those specific glaciers. It is found that the inclusion of LandSat ETM+ data with the corrector error had little impact on the results. For TM and ETM+ scenes, visible band saturation was present for most glaciers within the accumulation zone and those pixels were thus excluded based upon the band quality classification layer provided by USGS. Saturation was typical for ~2–10% of the glacier areas in most cases, with the exception of north-facing, fresh snow as was common for Juncal Norte, Tupungatito and Marmolejo glaciers (Fig. 1). Because high elevation data were still typically available for the accumulation zones of those glaciers, we found that exclusion of saturated pixels did not bias our analyses to lower elevations.
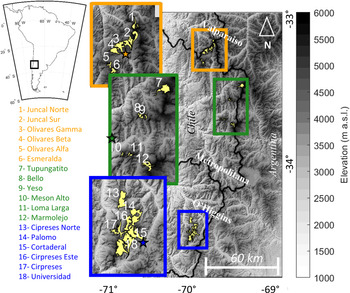
A map of the study site in central Chile with the location of the glaciers and the study sub-zones. The left-hand boxes show a zoom of the sub-zones for clarity and glacier numbers and names are provided. The background DEM is provided by ASTER GDEM and glacier outlines were digitised based upon March 2020 PlanetScope imagery. Coloured stars indicate the location of off-glacier validation sites in each sub-zone (Fig. 2).

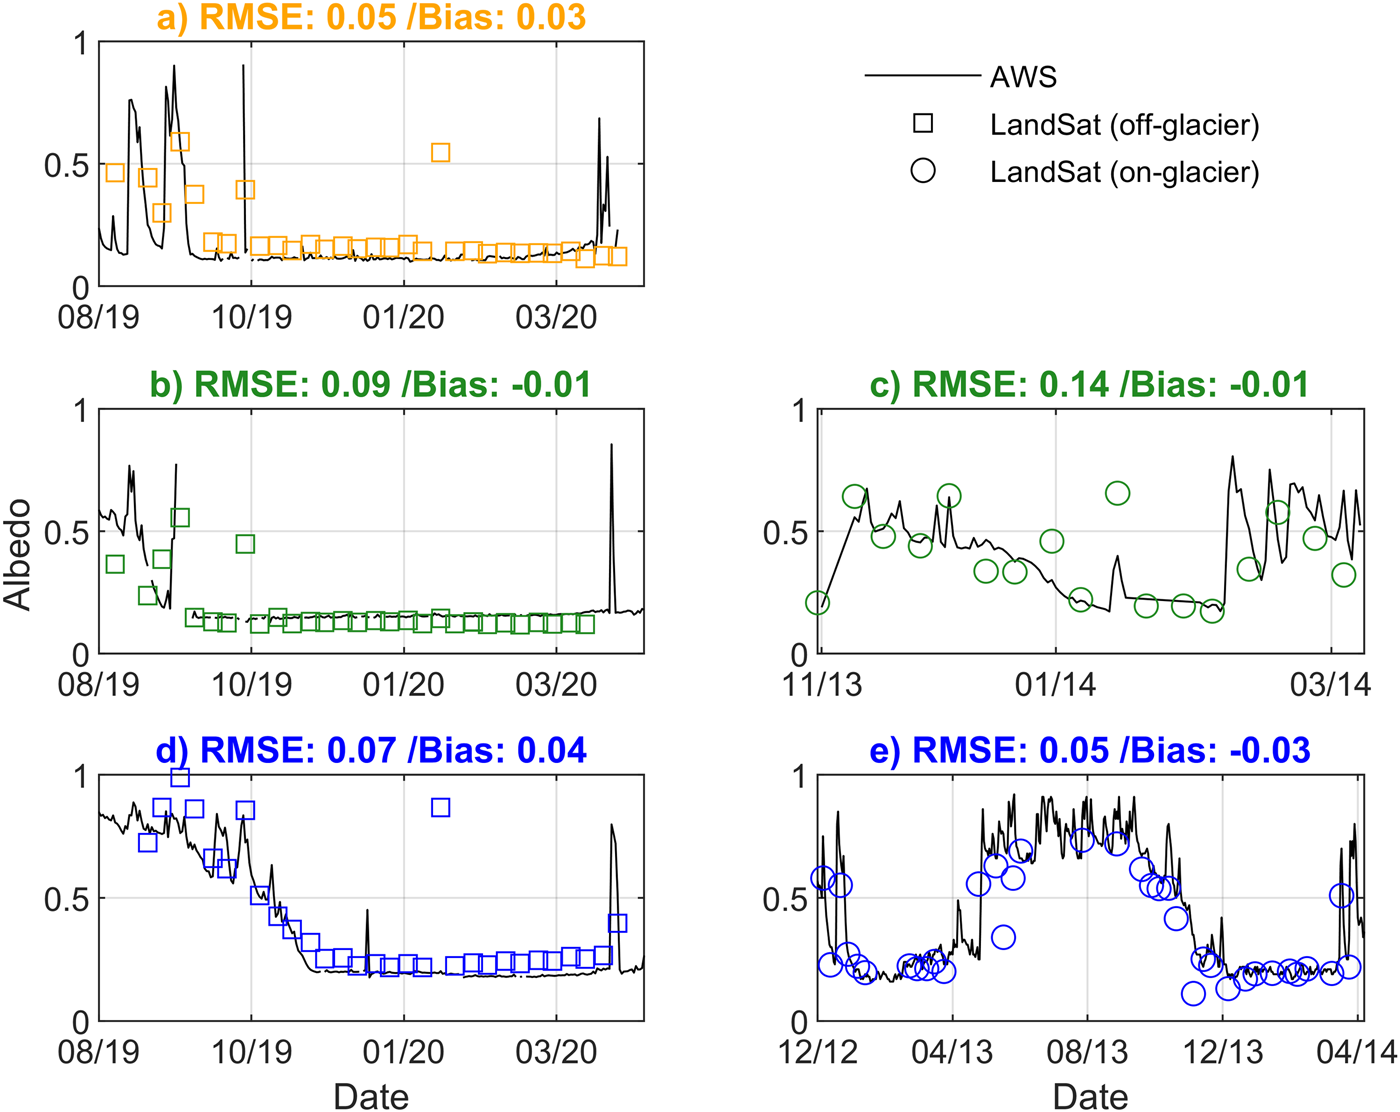
The validation of Landsat-derived broadband shortwave albedo at given off- and on-glacier locations of the three sub-zones (colours). Off-glacier data are provided by DGA AWS records for 2019–2020 at the pro-glacial zone of Olivares Gamma (a), Laguna Negra (b) and Cortaderal (d). On-glacier records are provided AWS on glaciers Bello (c) and Universidad (e) in 2013–2014 (OLI) and 2012–2013 (ETM+), respectively.
Finally, we sub-grouped analyses into north, central and south ‘sub-zones’ that coarsely separate previous areas of research focus and sub-regional climatic variations. For example, the north sub-zone represents glaciers of the Olivares basin and Juncal Norte Glacier that have received much attention in the literature (e.g. Pellicciotti and others, Reference Pellicciotti2008; Malmros and others, Reference Malmros, Mernild, Wilson, Yde and Fensholt2016; Ragettli and others, Reference Ragettli, Immerzeel and Pellicciotti2016), whereas the division of central and south sub-zones marks a noteworthy transition in precipitation regimes (González-Reyes and others, Reference González-Reyes2017).
3.3. Validation and uncertainty analysis
To validate the Landsat-derived values of albedo, we compare specific pixels at on- and off-glacier locations with albedo calculated from automatic weather stations (AWS) using the ratio of outgoing to incoming shortwave radiation at solar noon. Off-glacier AWS records were acquired from the Chilean Water Directorate (Dirección General de Aguas or ‘DGA’) for each sub-zone (stars in Fig. 1). On-glacier AWS data were obtained from specific campaigns on Bello (e.g. Ayala and others, Reference Ayala2016) and Universidad (e.g. Bravo and others, Reference Bravo, Lorlaux, Rivera and Brock2017) glaciers. For the years of on-glacier data and for the end of summer 2020 (for off-glacier data), we obtained all available Landsat images and extracted the pixel of interest using the AWS coordinates. We explored the general validation of Landsat albedo by considering the RMSE and mean bias against the AWS observations. The results of Figure 2 indicate that the albedo retrieval from Landsat works well to capture the general seasonality of albedo with RMSE values typically <0.1 and small biases, especially for off-glacier, snow-free conditions (Figs 2a, b, d). Occasional discrepancies can be seen between Landsat and the AWS which may be associated with sub-pixel variability of albedo evident from the point-scale AWS data, though only averaged from the 30 m pixel resolution of Landsat. Our analyses are subject to various uncertainties due to errors in the input data, the albedo retrieval approach and environmental factors. However, as our analyses are concerned with variability and trends, the absolute values of albedo are less important than the consistency of albedo values for theoretically ‘stable’ areas where albedo should remain constant (Fugazza and others, Reference Fugazza2019). While an uncertainty is difficult to prescribe for this type of study (Naegeli and others, Reference Naegeli, Huss and Hoelzle2019), we consider the snow-free variability as two standard deviations of all Landsat albedo values at all off-glacier locations between December 2019 and March 2020 (i.e. Figs 2a, b, d) and for each end-of-summer date (Fig. S1) as an estimate of the consistency of the approach. We calculated a variability of 0.025 and consider this as a threshold for change detection in Landsat albedo. Following Naegeli and others (Reference Naegeli, Huss and Hoelzle2019), we apply a random perturbation of ±0.025 to glacier albedo in each year and observe its influence on the temporal trends in glacier and ice albedo (see following sub-sections). We additionally note that no long-term trends in the off-glacier data exist and so we can rule out any degradation of the Landsat sensors, trends or biases over time using the above approach for different Landsat satellites (e.g. Fugazza and others, Reference Fugazza2019; Supplementary Fig. S1).
3.4. Climate and albedo variability
To explore the relationship of glacier albedo and the variability associated with climate, we extracted the mean hydrological year (April–March) air temperature (°C) and precipitation totals (mm) from AWS of the DGA (not shown). We extracted precipitation information from the most local, long-term (since 1985) observations for each sub-zone. We utilised data from Riecillos (32.92°S, 70.35°W, 1290 m a.s.l.), Embalse Yeso (33.67°S, 70.08°W, 2475 m a.s.l.) and Rengo (34.19°S, 70.75°W, 515 m a.s.l.) stations for the north, central and north sub-zones, respectively. We utilised air temperatures from Quinta Normal station (33.44°S, 70.68°W, 527 m a.s.l.) as the only complete, long-term station for temperature observations in the region. We correlate glacier-wide albedo (defined as the mean albedo of all valid cells for each glacier and year) and the meteorological variables of the preceding hydrological year (e.g. April 2019–March 2020 for the March 2020 Landsat scene) using the Pearson's correlation coefficient. Additionally, we utilised all available regional data on precipitation (with ≥90% of records available) from the CR2 platform (http://explorador.cr2.cl/) to relate changes in albedo to the occurrence of the ‘Mega-Drought’ (hereafter ‘MD’) that has affected central Chile since 2010 (Garreaud and others, Reference Garreaud, Boisier, Rondanelli, Montecinos, Sepúlveda and Veloso‐Aguila2019). We express changes in precipitation and albedo for the MD period (2010–2020) and the extreme year of 2020 relative to 1986–2009 mean conditions.
3.5. Trends in glacier albedo
For our analyses, we considered the mean annual albedo of each glacier using all valid pixels (after filtering for errors or shadowing and saturation – hereafter ‘glacier-wide albedo’ as in section 3.4) or for only pixels classified as ice (‘ice albedo’). To analyse changes in only glacier ice albedo, we identified pixels that were consistently snow-free in each year of the observation period. We extracted the near-infrared band for each glacier in each year and applied the classification based upon the approach of Otsu (Reference Otsu1979), following Rastner and others (Reference Rastner2019). The Otsu method is a clustering-based approach that obtains the optimum threshold for separating n classes when calculating their maximum inter-class variance. We split each scene for each glacier into two near-infrared classes using the Otsu thresholding that separately depict the presence of ice and snow. As with Rastner and others (Reference Rastner2019), we find that the presence of small supra-glacial debris is classified together with ice in this method. Nevertheless, manual removal of the main medial moraine debris and debris-covered tongues from the analysis limits the influence of these features when assessing changes in ice albedo. Pixels with an albedo value <0.25 were automatically classified as ice, in agreement with manual checks against PlanetScope imagery for 2016–2020. With these classifications of ice and snow, we also obtained the glacier fractional snow-covered area (fSCA) per glacier and year.
To ignore pixels consistently classified as ice within the glacier accumulation zones, we limited analyses of ice albedo to the lower portion of each glacier and identified the minimum inter-annual ELA. This inter-annual ELA was found by searching in 25 m elevation bands for the elevation where the sum of snow pixels below and ice pixels above was minimised (following Krajci and others, Reference Krajci, Holko, Perdigao and Parajka2014). Some years were characterised by early snowfalls and had a complete coverage of snow on the glacier and we therefore ignored those years for the analysis of both glacier-wide and ice albedo trends. For the remaining years, we considered all pixels below the minimum inter-annual ELA that were always classified as ice. We subsequently calculated the mean of all valid pixels (glacier-wide albedo) or all pixels below the minimum inter-annual ELA (ice albedo) for each glacier and year. We derived the decadal trend using the linear regression of all years without early snowfalls evident in the Landsat scenes. Finally, we calculated decadal trends for each individual, valid pixel (a pixel-by-pixel trend) following the same approach.
4. Results
4.1. Inter-annual variability of glacier-wide albedo
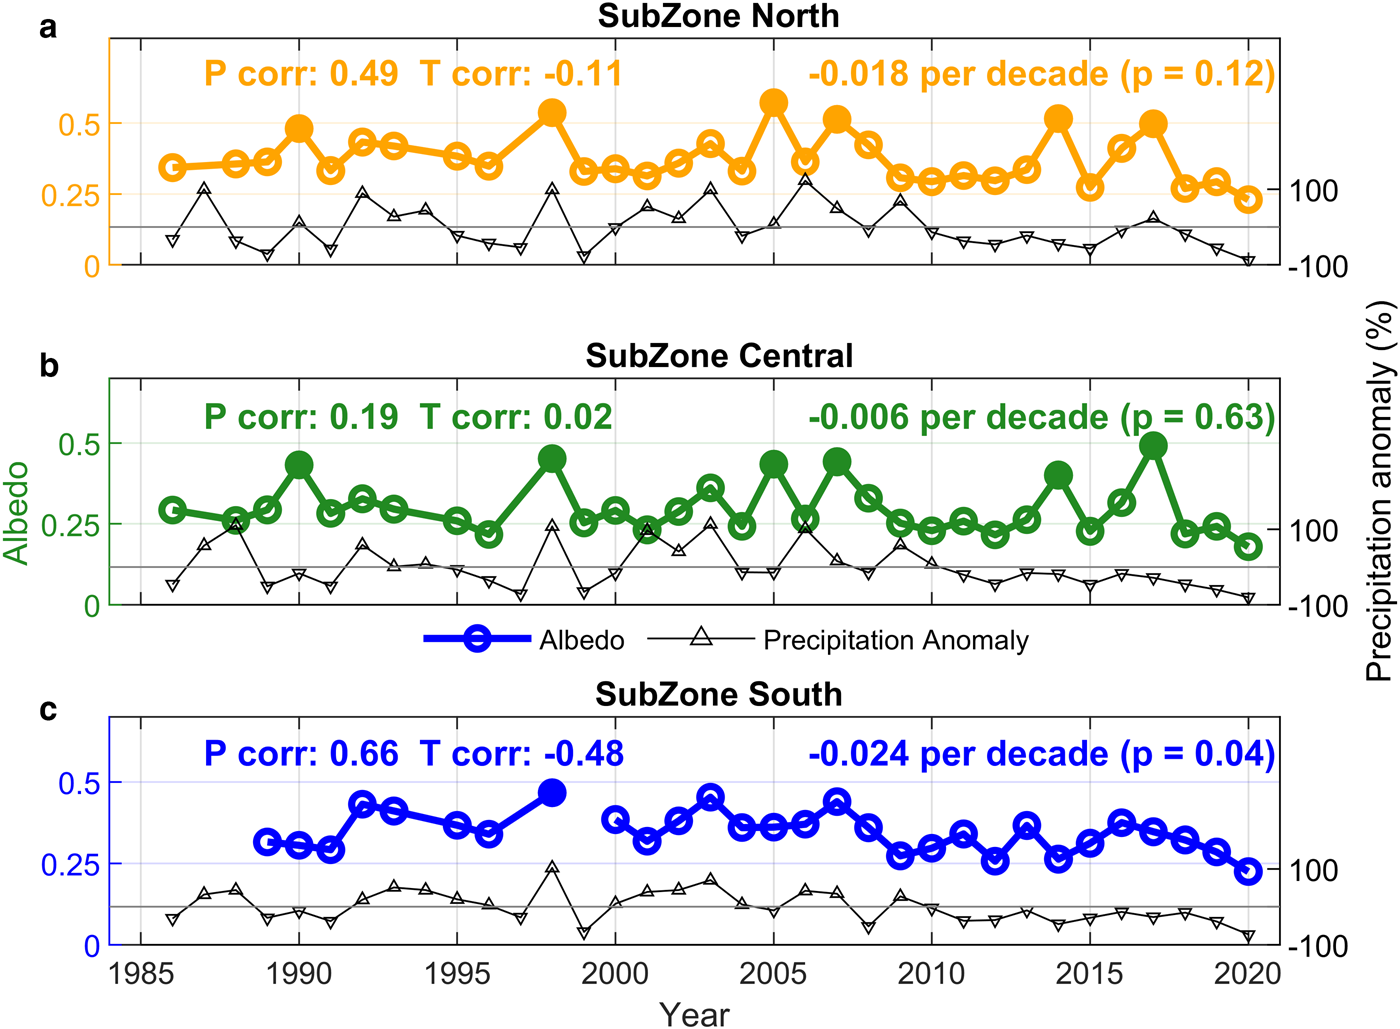
End-of-summer, glacier-wide albedo is highly variable year to year and mean values range from 0.2 to 0.6 (Fig. 3), with a strong relation to the glacier fSCA and precipitation totals from the regional AWS records of the preceding hydrological year (Table 2). For most valid pixels on all glaciers, a negative pixel-by-pixel trend is observable (Fig. S2), though is often not significant for parts of the accumulation zones due to data quality issues (such as saturation or shadowing). Mean glacier-wide albedo from the north and south sub-zones show a stronger correlation to precipitation (Table 2) and a significant negative trend (Fig. 3, Table 3, Fig. S2), whereas the central sub-zone shows no clear trend or correlation to local climate. Inter-annual variability in precipitation can explain up to 69% of the variability in glacier-wide albedo for certain glaciers in the south sub-zone. The decadal trend for the north sub-zone is significant, though albedo and precipitation, in this sub-zone especially, reveal a positive tendency for the 2000–2009 period (Fig. 3a) in line with a period of positive mass-balance years inferred from remotely sensed observations (Dussaillant and others, Reference Dussaillant2019; Farias-Barahona and others, Reference Farias-Barahona2019) and model simulations (Burger and others, Reference Burger2019; Ayala and others, Reference Ayala2020; Farias-Barahona and others, Reference Farias-Barahona2020a). The reduction of glacier-wide albedo is discernible, though extreme years, such as 2020, mark much clearer declines in albedo (Fig. 3). Glacier-wide albedo and fSCA were at a record minimum for 2020 in all sub-zones. Other drought years are visible in the meteorological data, though outside of the MD period, no other drought years (e.g. 1998–1999) show noteworthy albedo minima. Mean annual air temperatures show few significant correlations to the inter-annual variability in albedo in any sub-zone (not shown), and only mean summer (DJFM) air temperatures show significant correlations, particularly for the south sub-zone (Table 2). For individual glaciers, the fSCA dictates up to 92% of the albedo variability for the considered 1986–2020 period (Table 2). In general, the inter-annual fSCA itself (which provides a more direct indicator of glacier mass balance) is more strongly related to air temperature and precipitation in the south sub-zone (Table 2).
The end-of-summer glacier-wide albedo trends (coloured lines) averaged by sub-zone. Excluded, early snowfall years are shown by filled symbols. Total precipitation anomalies are given by the lower black line and based upon the sum of precipitation records in the preceding hydrological year at each regional AWS (see text). Anomalies are expressed as a percentage of the precipitation in a year compared to the mean of the whole 1986–2020 period and are indicated by positive (upward arrow) and negative (downward arrow) anomalies. Average correlations to precipitation totals and summer mean air temperatures (left) and trends (right) are given per sub-zone. Correlations and trends per glacier are given in Tables 2 and 3, respectively.
The correlations of glacier-wide albedo variability with mean summer air temperature, total precipitation and fractional snow-covered area (fSCA)
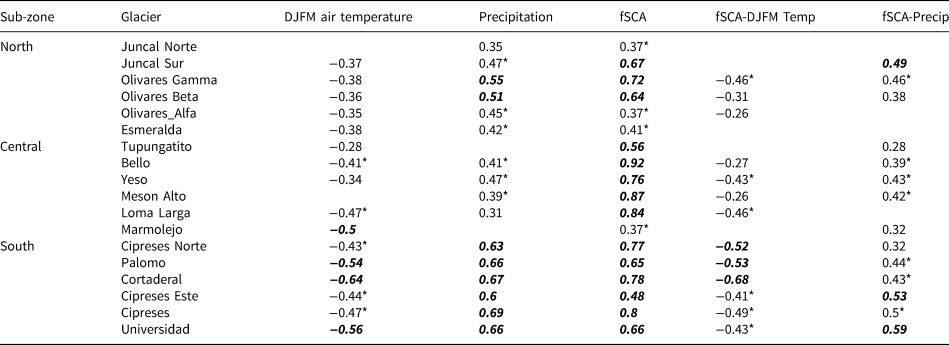
Columns to the right show the Pearson correlations between fSCA and air temperature and precipitation as an indicator of inter-annual mass balance and its controls. Bold and italic values denote significance at the 0.99 level, asterisks denote a 0.95 significance level, and other values show a 0.80 significance level. Missing values denote where there is no statistically significant trend.
The decadal trends in glacier-wide (full area extent with percentage of total glacier available after filtering) and ice albedo (including the percentage area of each glacier used for the extraction of ice albedo trends)
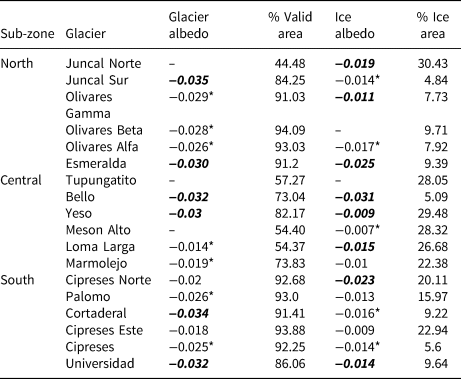
Trends are calculated from linear regression with all data without early snowfalls (see text). Bold and italic values denote significance at the 0.99 level, asterisks denote a 0.95 significance level, and other values show a 0.80 significance level. Missing values denote where there is no statistically significant trend.
4.2. Influence of drought years on glacier albedo
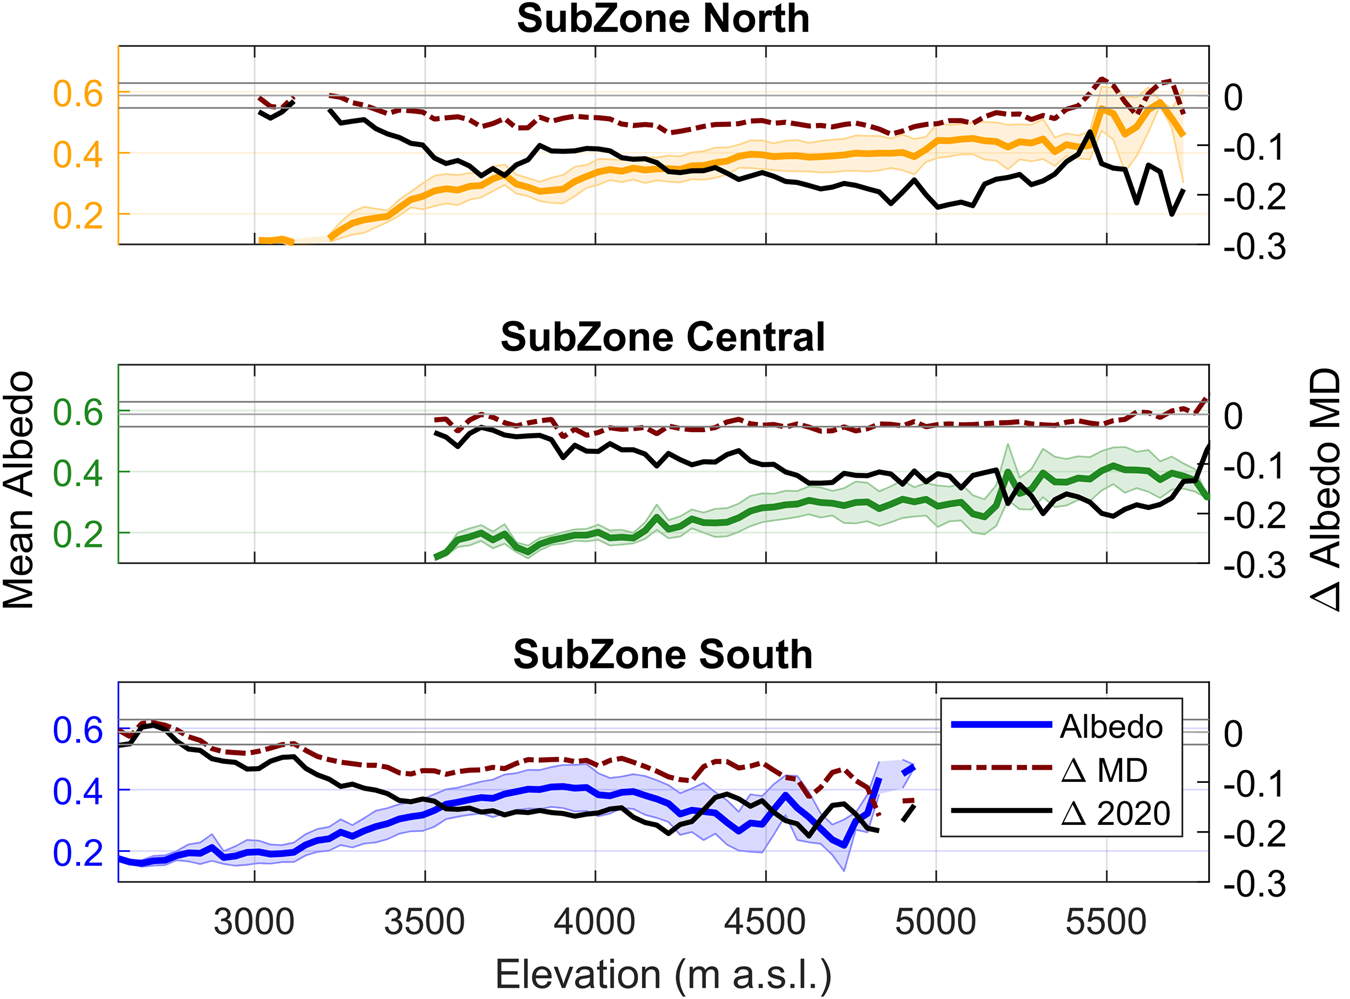
Figure 4 shows the mean albedo by 100 m elevation bands for each sub-zone and the change in mean albedo for the MD period (2010–2020) and 2020 relative to a 1986–2009 mean reference. Figure 5 shows the spatial mean in albedo for all years of analysis. The north sub-zone has a generally steeper gradient of albedo with elevation (Fig. 4), mostly influenced by high albedo on the accumulation zone of Juncal Norte (Fig. 5, Fig. S3). The MD period demonstrates a mean albedo reduction ranging from 0.01 to 0.15 depending on the elevation range and sub-zone (Fig. 4). For the central sub-zone, this difference is typically within the prescribed uncertainty threshold for change detection, though differences for the north and south sub-zones are more negative, especially for elevations between 3500 and 5000 m a.s.l. (Fig. 4). The influence of the MD on the accumulation area of the south sub-zone is more evident (Figs 4, 6). For the north sub-zone, small positive changes are seen, associated with the accumulation zone of Juncal Norte (Fig. S3), though remain typically within the uncertainty threshold. Anomalies of precipitation from distributed station data of the region (CR2) reveal no clear relationship to the differences evident in each sub-zone, though no long-term data exist within the delineated sub-zones themselves (Fig. 6). The mean (std dev.) difference of all pixels for MD is −0.05 (0.02), relative to the 1986–2009 mean.
The elevation-mean albedo for all glaciers in each sub-zone (coloured lines) and the std dev. of all years for those glaciers (shaded area). The right-hand axes show the mean differences per elevation band of the mega-drought (‘MD’ 2010–2020 – in brown) and 2020 (black) relative to 1986–2009. Grey bars denote the 0.025 uncertainty threshold for change detection.
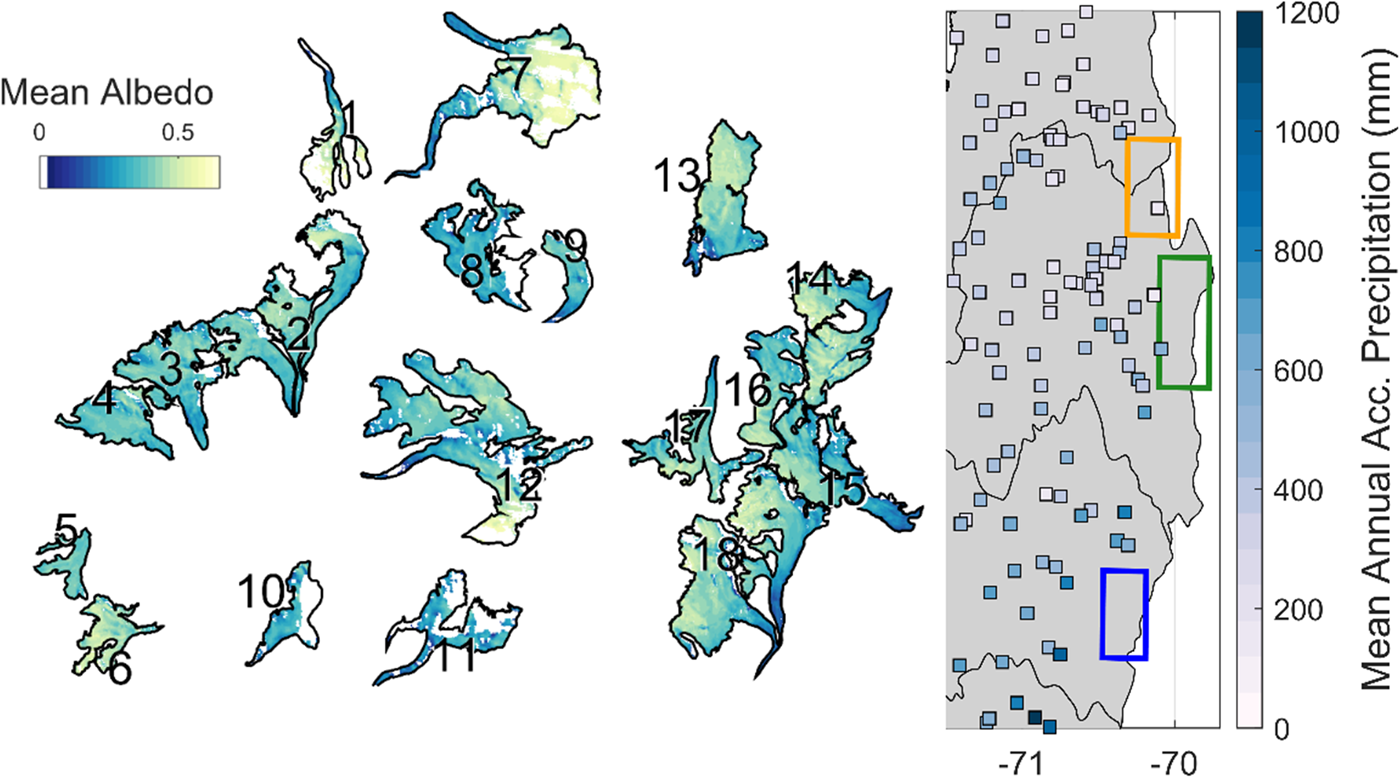
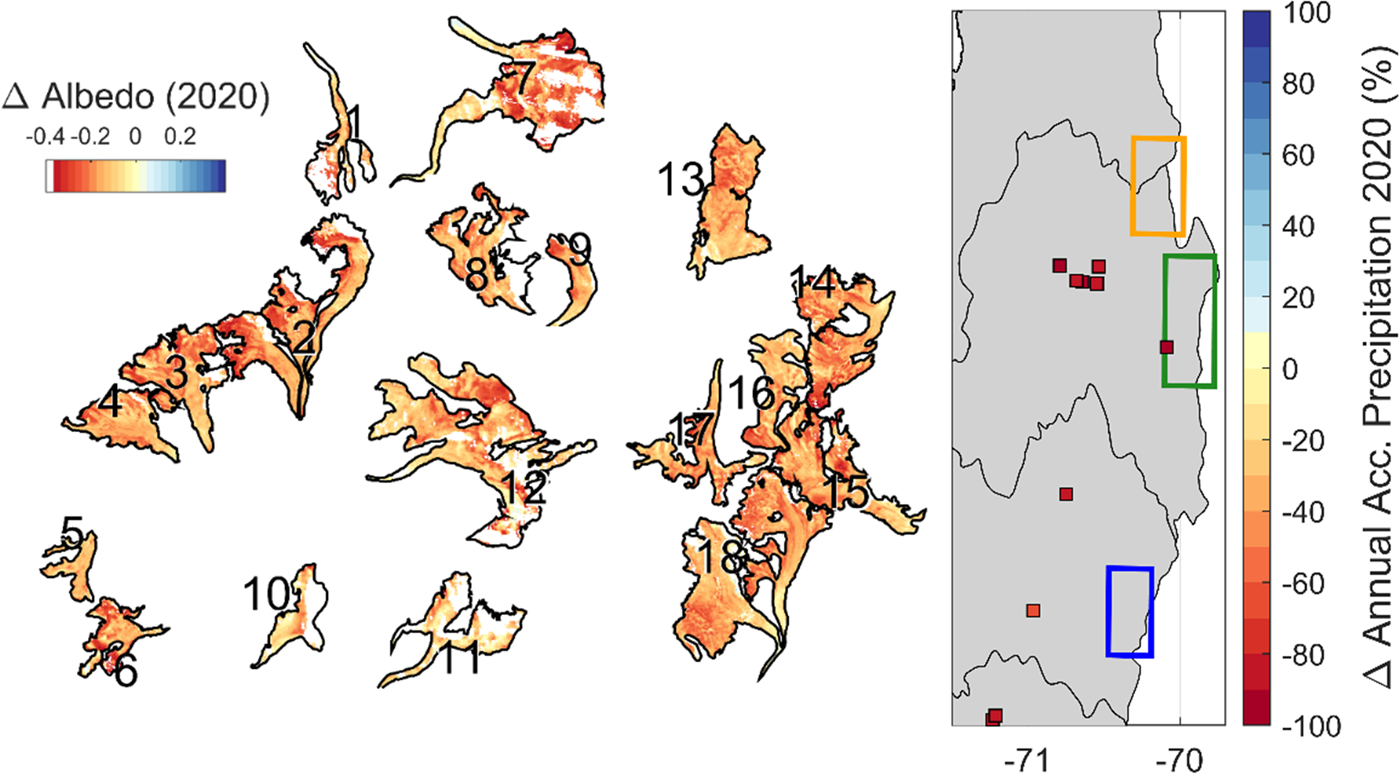
The mean pixel-wise broadband shortwave albedo for each study glacier (excluding early snowfall years). Shapefiles are digitised from the 2020 PlanetScope imagery. Areas of shadow, visible band saturation or slope >45° are excluded (white area). The right-hand panel shows the mean 1986–2020 annual accumulated precipitation (mm) derived from CR2 explorer: http://explorador.cr2.cl/. Data are shown for stations with >90% of the total records available.
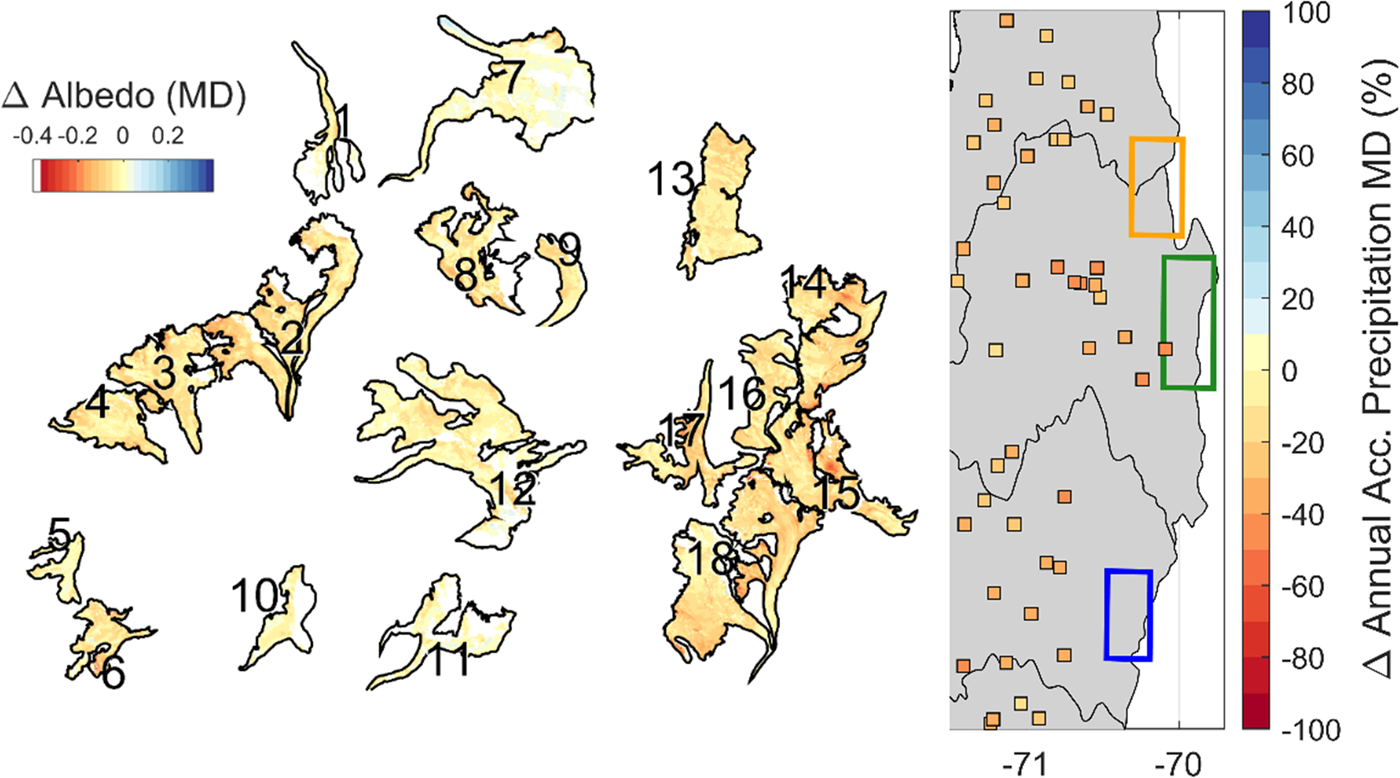
The mean pixel-wise broadband shortwave albedo differences for the mega-drought (2010–2020) relative to other years (1986–2009) for each study glacier. Shapefiles are digitised from the 2020 PlanetScope imagery. Areas of shadow, visible band saturation or slope >45° are excluded (white area). The right-hand panel shows the anomaly of 2010–2020 annual accumulated precipitation (mm) relative to that from 1986 to 2009. Data are derived from CR2 explorer: http://explorador.cr2.cl/. Data are shown for stations with >90% of the total records available.
The dramatic drought effects of the 2019–2020 hydrological year are visible in the 2020 glacier albedo for nearly all elevation bands (Figs 4, 7), though are most dominant for the glacier accumulation zones (Figs S3, S4) and elevation bands that are associated with the highest mean albedo across all years (Fig. 4). The data show a reduction of up to 90% of annual precipitation and an albedo decrease up to 0.47 for parts of the Tupungatito and Juncal Norte accumulation zones (where saturation problems are not evident), with mean differences <−0.2 in elevation bands >4500 m a.s.l. and a mean (std dev.) of all pixels of −0.14 (0.03), relative to the 1986–2009 mean (Fig. 7).
The mean pixel-wise broadband shortwave albedo differences for 2020 relative to years 1989–2009 for each study glacier. Shapefiles are digitised from the 2020 PlanetScope imagery. Areas of shadow, visible band saturation or slope >45° are excluded (white area). The right-hand panel shows the anomaly of 2019–2020 annual accumulated precipitation (mm) relative to that from 1986 to 2009. Data are derived from CR2 explorer: http://explorador.cr2.cl/. Data are shown for stations with >90% of the total records available.
4.3. Decadal trends of ice albedo
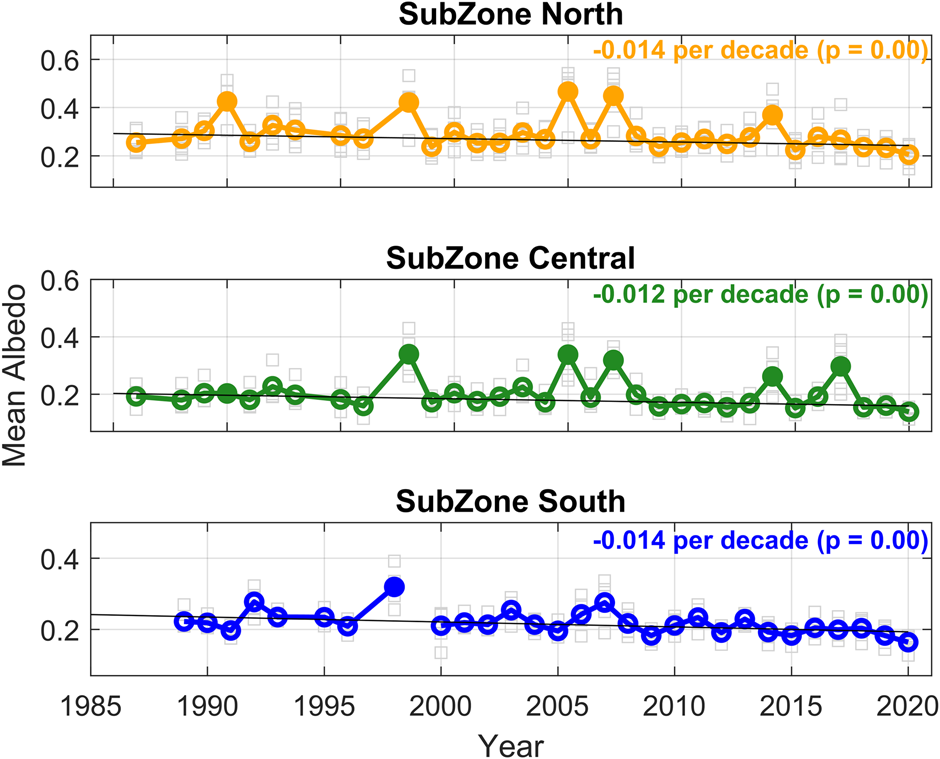
Decadal trends in ice albedo for all glaciers are given in Table 3 and shown by sub-zone in Figure 8. Significant trends are observable in the albedo at the reduced bare ice area delineations (section 3.5, Table 3). These trends are slightly stronger for the north and south sub-zones (−0.014 per decade) than for the central sub-zone (−0.012 per decade). Most glaciers show trends that are statistically significant to the 0.80 level or greater, and several glaciers show trends that are −0.02 per decade or more negative. The largest trends are seen for glaciers Esmeralda and Bello, though the latter represents only ~5% of the total glacier area. Despite the negative trends of glacier-wide albedo being greatest for the south sub-zone, trends of ‘ice darkening’ are not notably related to the sub-zones and likely controlled by localised processes. If considering only the MD period, ice albedos of certain glaciers (such as Juncal Norte, Juncal Sur or Esmeralda) have an equivalent trend of almost −0.07 per decade (not shown). This implied speed up of ice albedo reduction is not significant for many glacier sites, however. Randomly perturbing the ice pixels by the maximum derived uncertainty of ±0.025 in each year had a negligible impact on the results (<1% change in the decadal trends).
The trends in ice albedo for all glaciers (grey boxes) of each sub-zone (means shown by coloured lines). Excluded years (shown by filled symbols) are those with a clear presence of snow on the lower ablation zone or when glaciers were obscured by cloud (1990 – sub-zone Central). Trends and significance levels are provided.
5. Discussion
5.1. Relevance of albedo change for glaciers in central Chile
The decreasing glacier albedo found in this study is in line with previous studies that have explored trends in snow cover extent and albedo for the entire central Andes (Malmros and others, Reference Malmros, Mernild, Wilson and Tagesson2018), though has focused explicitly on changes of mountain glaciers that have been undergoing increased mass loss in recent decades (Dussaillant and others, Reference Dussaillant2019; Farias-Barahona and others, Reference Farias-Barahona2019, Reference Farias-Barahona2020a, Reference Farías-Barahona2020b). Because of the increasing role of glacier ice melt to buffer seasonal streamflow diminishment in the central Chilean Andes (Burger and others, Reference Burger2019; Ayala and others, Reference Ayala2020), understanding the spatio-temporal evolution of glacier albedo is very important, particularly as ablation is often dominated by shortwave radiative fluxes (Oerlemans and others, Reference Oerlemans, Giesen and van den Broeke2009; Ayala and others, Reference Ayala, Pellicciotti, Macdonell, Mcphee and Burlando2017). While the occurrence of ‘peak water’ for the parts of the central Andes remains somewhat unclear (Ayala and others, Reference Ayala2020), the role of glacier surface albedo will be a key control on the contributions of ice melt to major rivers and aquifers of the region in the coming decades. This is especially the case if both reduction of snow surface area and ice darkening continue at the rate of the past 30 years (Fig. 8, Table 3). Another interesting finding of this work is the increase in glacier surface albedo for 2000–2009 that coincides with a period of positive glacier mass-balance years observable from geodetic studies (Dussaillant and others, Reference Dussaillant2019; Farias-Barahona and others, Reference Farias-Barahona2019). While the increased snow accumulation for these anomalously wet years was likely the dominant control on the positive glacier mass balances, the relatively high albedo still seen at the end of the summer (Fig. 3) implies a significant reduction to mass loss for those years as well.
An increasing body of work has elaborated upon the effects of the so-called ‘Mega-Drought’ (MD) of central Chile since 2010 (Boisier and others, Reference Boisier, Rondanelli, Garreaud and Muñoz2016; Garreaud and others, Reference Garreaud2017, Reference Garreaud, Boisier, Rondanelli, Montecinos, Sepúlveda and Veloso‐Aguila2019; Ayala and others, Reference Ayala2020; Farias-Barahona and others, Reference Farías-Barahona2020b). We found a clearly marked decrease in the albedo of all study glaciers (mean of −0.05) when comparing the MD period to a 1986–2009 baseline mean. These reductions in albedo are evident across the entire glacier area (Fig. 4), though largely associated with a reduction in precipitation and the resultant end-of-summer snow-covered area (Fig. 6). If calculating late summer surface melt using a simple ETI model approach (Pellicciotti and others, Reference Pellicciotti2005) and published parameters of glaciers in the region (Ayala and others, Reference Ayala2016), we find that albedo differences can produce an increase of glacier-wide melt rates >10% on Juncal Sur Glacier when comparing the static mean albedo of the MD to the static 1986–2009 mean (model details provided in the Supplementary material). For the extreme year of 2020 (Fig. 7), the modelled increases in mean end-of-summer melt rates can be >20%, and up to 65% greater for areas of the Juncal Sur Glacier accumulation zone (Fig. S5). Garreaud and others (Reference Garreaud, Boisier, Rondanelli, Montecinos, Sepúlveda and Veloso‐Aguila2019) suggested that only partial recovery of the region's precipitation is expected during the coming decades which implies that a more rapid future decline of glacier surface albedo could be anticipated. However, even in the context of the MD, the frequency of very extreme events, such as for the 2019–2020 hydrological year may be difficult to predict.
5.2. Possible causes of glacier albedo change
While local factors (such as glacier aspect and local topography) likely dictate the differences in trends between glaciers within each sub-zone (Table 3, Fig. S3), there are no clear differences in the trends of individual glacier-wide albedo across the three sub-zones (Table 3). Though the climatic conditions experienced within the south sub-zone are notably wetter than in the north and central sub-zones (Fig. 5; González-Reyes and others, Reference González-Reyes2017), the relative changes in annual precipitation are similar during the MD (Fig. 6), suggesting that the reduction in precipitation at all sub-zones are largely responsible for the reduction of glacier-wide albedo (Table 3).
Our results show no clear relationship between the rate of glacier-wide albedo reduction and the rate of ice albedo reduction in each sub-zone (Table 3). The Olivares basin (that which contains five out of six glaciers in the north sub-zone) has been subject to a great deal of study in recent years and a causal link has been suggested between the role of dust particles from mining activity and dramatic mass loss of glaciers such as Olivares Alfa (Cereceda and others, Reference Cereceda2014; Malmros and others, Reference Malmros, Mernild, Wilson, Yde and Fensholt2016; Ayala and others, Reference Ayala2020; Farias-Barahona and others, Reference Farías-Barahona2020b). While the potential for dust transportation from open pit mining has been demonstrated (e.g. Flores and others, Reference Flores, Garreaud and Muñoz2014) and the close proximity of mining development (Los Bronces and Andina mines) has coincided with the drastic decline of Olivares Alfa Glacier, no conclusive evidence can be determined from the analysis of end-of-summer albedo presented here. Nonetheless, many glaciers of the Olivares basin show a strong and statistically significant negative trend in ice albedo since 1986 (Table 3) and this is only considering the conservative analysis of pixels within the glacier area delineations of 2020 that does not capture the full picture of dramatic mass loss for glaciers like Olivares Alfa (Malmros and others, Reference Malmros, Mernild, Wilson, Yde and Fensholt2016; Farias-Barahona and others, Reference Farías-Barahona2020b). A more thorough sub-seasonal analysis of Landsat scenes at multiple times during the spring-summer period may deduce a clearer cause and effect relation that is beyond the scope of this work.
Garreaud and others (Reference Garreaud2017) indicated a significant impact of the current drought on fire activity which could be a factor relating to the negative trend of ice albedo for all sub-zones (e.g. de Magalhães Neto and others, Reference de Magalhães Neto, Evangelista, Condom, Rabatel and Ginot2019). Although some severe fire years are evident (2016–2017), no notable trends in fire activity were reported for the region of study (McWethy and others, Reference Mcwethy, Veblen, Stahl, Currey and Gonza2018; Urrutia-Jalabert and others, Reference Urrutia-Jalabert, González, González-Reyes, Lara and Garreaud2018) and it is unclear if such events would produce large differences in albedo reductions for neighbouring glaciers. The strong presence of black carbon has been demonstrated within mountainous basins close to Santiago by Rowe and others (Reference Rowe2019). Their study estimated a 0.016 albedo reduction in the June snowpack associated with high black carbon concentrations. Additionally, a national report by Cereceda and others (Reference Cereceda2014) concluded that the winter-spring particulate concentrations on glaciers Bello and Olivares Alfa related well to those originating in Santiago and mining activity when coincident with the westerly/north westerly wind direction. Though indirectly suggested through the aforementioned studies, to the authors’ knowledge, no such study has directly related a reduction of glacier ice albedo in the central Andes to black carbon deposition, though this link has been established in glacier case studies in other parts of the world (Ming and others, Reference Ming, Du, Xiao and Xu2012; Goelles and Bøggild, Reference Goelles and Bøggild2017; Zhang and others, Reference Zhang2017) and is a likely contributor to the results of this study. Alternatively, some contribution of albedo reduction in this region may be attributable to the presence of algae and microbial communities in snow and cryoconite (e.g. Di Mauro and others, Reference Di Mauro2020) thereby enhancing the positive feedback of glacier melting. Again, to date, no known studies have demonstrated this within the central Andes and it is unclear to what extent such glacier-algae communities affect small mountain glaciers of the semi-arid region.
5.3. Limitations and directions for future study
In this study, we have presented an analysis of albedo changes on 18 glaciers of the central Chilean Andes. We conservatively considered glacier areas that consist of ‘valid’ pixels in each year of analysis, thus limiting the number of pixels of several glaciers based upon shadowing, visible band saturation and high slope angles (>45°) as well as supra-glacial debris cover associated with glacier termini and medial moraines. Accordingly, for glacier-wide albedo, sizeable areas of the accumulation zone are ignored on some glaciers (Table 3, Fig. 7), though we believe that sufficient areas of the accumulation zones are retained in order to make a robust assessment of the mean albedo trends. It must be noted, however, that in cases where more saturation is present in early Landsat scenes (TM/ETM+), the magnitude of the derived trends could be substantially affected. Even so, we find that reduction of glacier-wide albedo over the observation period is consistent with the magnitudes of glacier fSCA decline (not shown) which was derived from the near-infrared bands of Landsat, not affected by visible band saturation.
Equally, we limit our analysis of ice albedo to relatively small areas on certain glaciers (Table 3) and cannot compare a similar number of pixels in all such cases. Nevertheless, in the same fashion as Fugazza and others (Reference Fugazza2019), we consider a consistent area of ice in each year of analysis, thus ignoring higher elevation areas that became typically snow free for the end-of-summer Landsat scenes in later years, which would therefore influence the investigation of ice albedo trends. While we equally ignore areas of ice to debris or ice to no ice transition (Naegeli and others, Reference Naegeli, Huss and Hoelzle2019) and mask out clear moraine features, we cannot completely exclude the effect of small debris features in the analysis of ice albedo trends (Fig. 8). We consider that such features would have a negligible effect on our results, but we cannot readily prescribe an uncertainty to account for such occurrence in our trend analyses. We applied randomised uncertainty of ±0.025 to bare ice pixels in each year following Naegeli and others (Reference Naegeli, Huss and Hoelzle2019) and found <1% change in the derived trends.
While we do not focus in detail on the albedo changes at the highest elevations, we cannot exclude the possible effect of snow and ice penitents that have been noted to influence the measured albedo of some glaciers included in this study (Corripio and Purves, Reference Corripio and Purves2005). At high elevations where sublimation losses are high due to low humidity and high solar elevation, the growth of large penitents (sometimes in excess of 5 m) may likely contribute to decreased albedo associated with positive feedback of the ablation hollows (Corripio and Purves, Reference Corripio and Purves2005; Lhermitte and others, Reference Lhermitte, Abermann and Kinnard2014; Malmros and others, Reference Malmros, Mernild, Wilson and Tagesson2018). Due to the large changes in albedo occurring at high elevations (because of snow cover reduction), a better understanding of penitents may be useful to further studies of this type, especially at small mountain glacier sites in the northern Andes (Lhermitte and others, Reference Lhermitte, Abermann and Kinnard2014).
Additional limitations of our study relate to the locality of the long-term meteorological data used to correlate to changes in glacier-wide albedo of each glacier (Fig. 3, Table 2). The presence of local, long-term records of temperature and precipitation are limited, especially at high elevations (e.g. Scaff and others, Reference Scaff, Rutllant, Rahn, Gascoin and Rondanelli2017; Alvarez-Garreton and others, Reference Alvarez-Garreton2018). While we observe a clear and understandable relationship of regional precipitation and the variability in glacier-wide albedo, a more detailed assessment of local topographic and meteorological drivers would be required to explain inter zonal differences in albedo trends (Table 3) and the causes of more rapid rates of albedo decline for different parts of each glacier (pixel-by-pixel trends in Fig. S2). Further still, it would be especially beneficial to explore how the variations of local meteorology and surface albedo relate to the contrasting behaviours of glacier mass balance within the Maipo catchment (north and central sub-zones) as observed in recent studies (Ayala and others, Reference Ayala2020; Farias-Barahona and others, Reference Farias-Barahona2020a).
We applied here the method of Liang (Reference Liang2001) that was developed based upon TM/ETM+ scenes. We consider the approach suitable for our application to later Landsat generations (OLI) based upon the findings of Naegeli and others (Reference Naegeli2017) who demonstrated good results when comparing it to more comprehensive analyses of shortwave albedo from imaging spectrometer data. In our study, we do not provide any methodological development or extensive testing against other datasets in the central Andes, but rather utilise the general methodology of Liang (Reference Liang2001) and Naegeli and others (Reference Naegeli, Huss and Hoelzle2019) to explore glacier albedo in a relatively under-studied region of the world. Similarly to those authors, we present results of the narrow-to-broadband conversion (Eqn (1)) that have a missing topographic correction on the radiometry of the sensor. It can equally be considered negligible for flatter areas of the lower glacier termini in ice albedo analyses (Naegeli and others, Reference Naegeli, Huss and Hoelzle2019), and limited by the exclusion of steep terrain in our study. Performing a general validation of the methodology against in situ on- and off-glacier albedo observations in various years highlights a suitable albedo derivation and no clear directional bias (Fig. 2) or change between sensors (Fig. S1). However, dedicated studies focusing on sub-seasonal albedo changes and the role of particulate matter (de Magalhães Neto and others, Reference de Magalhães Neto, Evangelista, Condom, Rabatel and Ginot2019; Yue and others, Reference Yue2020) could benefit from further testing of this approach in the Andes.
Recent studies in the Andes have explored the large-scale, regional trends in snow cover extent, duration and albedo and typically utilised MODIS datasets due to their large spatial coverage and high temporal resolution (Mernild and others, Reference Mernild2016; Malmros and others, Reference Malmros, Mernild, Wilson and Tagesson2018; Saavedra and others, Reference Saavedra, Kampf, Fassnacht and Sibold2018; Cordero and others, Reference Cordero2019). Similar to previous studies in the European Alps (Fugazza and others, Reference Fugazza2019; Naegeli and others, Reference Naegeli, Huss and Hoelzle2019), we used Landsat data to explore more detailed changes in the albedo of debris-free glaciers of the central Chilean Andes, due to a higher pixel resolution and longer time series. While we focused upon a yearly snapshot in time that can be limited by lack of data availability in a given year (due to early snowfall, cloud or lack of available scenes), the general lack of summer cloud cover for the region makes it a suitable location for further studies of this type. Future work could expand this analysis to understand the glacier changes on the Argentine side of the Andes that have been shown to be subject to even greater losses in the snow cover extent (Malmros and others, Reference Malmros, Mernild, Wilson and Tagesson2018; Saavedra and others, Reference Saavedra, Kampf, Fassnacht and Sibold2018) and possibly analyse sub-seasonal changes in albedo that could determine causal links between atmospheric dust and ice darkening. A growing number of studies have suggested the connection between mining activity and the mass loss of glaciers in the Olivares basin (Cereceda and others, Reference Cereceda2014; Malmros and others, Reference Malmros, Mernild, Wilson, Yde and Fensholt2016; Ayala and others, Reference Ayala2020; Farias-Barahona and others, Reference Farías-Barahona2020b) and more focused analyses could be directed towards improving our understanding of this connection.
Finally, we elaborated on the importance of recent albedo changes due to the prolonged drought in central Chile (Garreaud and others, Reference Garreaud, Boisier, Rondanelli, Montecinos, Sepúlveda and Veloso‐Aguila2019) by calculating simplistic melt rates (section 5.1, Fig. S5). However, recent evidence of regional glacier mass balance (Farias-Barahona and others, Reference Farias-Barahona2020a) could be leveraged to more directly relate the spatio-temporal variability of albedo to recent mass loss and again explore the potential controls of local processes that govern the darkening of snow and ice.
6. Conclusion
We report, for the first time, the end-of-summer, glacier-wide and ice albedo of 18 mountain glaciers of the central Chilean Andes between 1986 and 2020. The main findings of our study are:
-
– There is a high interannual variability of glacier-wide albedo and significant regional trends of up to −0.024 per decade. This trend is stronger for certain glaciers (up to −0.035 per decade) though no clear inter-zonal patterns are evident.
-
– The variability of glacier-wide albedo is largely a function of the fSCA and strongly related to the precipitation of the preceding hydrological year. Winter precipitation totals can explain up to 69% of the inter-annual variance in the south sub-zone.
-
– Ice albedo shows a negative regional trend that is statistically significant at the 0.99 level, with trends up to −0.03 for certain glaciers. The negative trend is larger in the north and south sub-zones (−0.014 per decade). The decline of the north sub-zone albedo is a likely contributor to the highly negative mass balance of glaciers in the Olivares basin revealed by recent studies. The data do not allow identification of a definitive causal link between atmospheric dust or black carbon and the darkening of glacier ice in this region, though this is recommended as a subsequent research direction.
-
– Under the ‘Mega Drought’ period (2010–2020), the mean albedo (relative to 1986–2009) has fallen in nearly all cases (−0.05 average albedo reduction across all pixels), with the greatest reduction (outside the observation uncertainty) occurring at elevations between 3500 and 5000 m a.s.l.
-
– In 2020, mean differences relative 1989–2009 are up −0.2 above 5000 m a.s.l. on certain glaciers and −0.14 on average across all pixels. The 2019–2020 period represents the driest hydrological year since the beginning of the Landsat observation records with ~90% reduction of annual precipitation relative to the 1986–2009 period. Future drought years like this would pose a severe risk to the water security of the region.
Supplementary material
The supplementary material for this article can be found at https://doi.org/10.1017/jog.2020.102.
Data
Landsat TM/ETM + /OLI data are available from USGS repositories at https://earthexplorer.usgs.gov/. Glacier outlines delineated from the 2020 PlanetScope imagery and calculated albedo grids are available at the following Zenodo repository: http://doi.org/10.5281/zenodo.3937676.
Acknowledgements
D. Farias-Barahona acknowledges the support of CONICYT/ANID through the doctoral scholarships programme. J. McPhee acknowledges funding from CONICYT/ANID project AFB180004. Landsat data products were provided by the US Geological Survey Earth Resources Observation and Science Center. We recognise the provision of PlanetScope imagery under the research and education initiative. Off-glacier AWS data were provided by the Chilean Water Directorate (DGA). The 2013–2014 AWS data for Bello Glacier were accessed from the archived files of the DGA S.I.T. report number 382 ‘Modelación del balance de masa y descarga de agua en glaciares del Norte Chico y Chile Central’ provided by Á Ayala. AWS albedo data from Universidad Glacier were kindly provided by C Kinnard. We kindly acknowledge the constructive comments of Chief Editor H. Jiskoot, Scientific Editor N. Cullen and two anonymous reviewers that helped improve the quality of the manuscript.
Author contributions
This work was initiated by GU as part of an undergraduate thesis and supervised by TES, RF, JL and JM. TES revised the analysis and wrote the manuscript with support from GU. All authors were involved in discussions and edits to the manuscript.
Conflict of interest
None.


 Open access