


Introduction
Antimicrobial resistance is one of the major health issues in both human and veterinary medicine [Reference Acar and Röstel1]. Zoonotic bacteria are able to colonize and cause infections in both humans and animals. As such, they may be subject to variable selective pressures as imposed by the use of antimicrobial agents in the different hosts [Reference Schwarz2]. In each host, zoonotic bacteria usually live in a polymicrobial environment, e.g. in the intestinal tract, where they can acquire various antimicrobial resistance genes from other bacteria. When zoonotic bacteria are transferred from an animal host to a human host by either direct/indirect contact or contaminated food, they may not only acquire new resistance genes from bacteria of the human host, but also pass their own resistance genes to indigenous bacteria of the human host [Reference Schwarz2]. Due to EU Zoonoses Directive 2003/99/EC [3] European Union member states are responsible for maintaining antimicrobial resistance monitoring systems for zoonotic bacteria with Salmonella enterica being one of the key pathogens. Besides giving recommendations on appropriate choice of therapy, one objective of monitoring and surveillance programmes is to conduct research to better understand the emergence and spread of antimicrobial resistance. For this purpose, antimicrobial consumption data is collected and the association between consumption and the number of resistant bacteria is addressed [4, 5].
The link between the use of antibiotics and bacterial resistance is well-known, as the effective proliferation of resistant bacteria is enhanced when selective pressures exist [Reference Acar and Röstel1]. This association has been described in several studies; e.g. a meta-analysis showing the effect of antibiotic prescribing in primary care on bacterial resistance [Reference Costelloe6] and a cross-national database study linking resistance levels observed with consumption of antimicrobial agents in European countries [Reference Goossens7]. However, other studies have shown inconsistent results and the authors concluded that antimicrobial resistance is influenced by many factors, especially by linkages between resistance properties [Reference Alali8, Reference Dewulf9]. The knowledge about these linkages should be included in studies concerning this topic to avoid biased results.
In Salmonella, as in most other bacteria, acquired resistance to antibiotics can be due to either mutations in genes, which are relevant for physiological functions in the bacterial cell [e.g. gyrA and parC (fluoroquinolone resistance)], or resistance genes whose products specify a wide variety of resistance mechanisms [Reference Helmuth, Wray and Wray10, Reference Brenner11]. Many of the known resistance genes in Salmonella are located on mobile genetic elements, such as plasmids, transposons, gene cassettes or mobile genomic islands [Reference Brenner12–Reference Pasquali14] and are easily exchanged between bacteria living in the same habitat, even in the absence of direct selective pressure [Reference Crippen and Poole15, Reference Faure16]. The latter aspect plays an important role when resistance genes are physically linked, co-located on the same mobile genetic element, and/or are present in gene clusters. Depending on the host range of the respective mobile genetic elements, they can be transferred across strain, species and genus boundaries and thus, contribute to the dissemination of resistance properties and the development of multi-resistance [Reference Doublet17, Reference Mathew18].
To detect existing linkages between antimicrobial resistance properties, the most straightforward approach is the identification of the resistance genes in question and the confirmation of their linkage by sequence analysis. However, in Salmonella as in various other Gram-negative pathogens, this is a cumbersome process since most antimicrobial resistance properties are encoded by numerous resistance genes accounting for the same resistance phenotype [Reference Brenner11].
In this study, we describe a quantitative, non-molecular approach, which provides insight into the linkages between certain resistance properties. We investigated the question of how associations in observed resistance data could be quantified and whether the measured associations agree with the knowledge of existing microbiological cross- and co-resistances in a recent test population of a relevant zoonotic pathogen. For this, we determined the resistance profiles of Salmonella enterica subsp. enterica serovar Typhimurium isolates from sporadic salmonellosis human cases in Lower Saxony, Germany, and used these resistance profiles as an example to identify associations between resistances to the antimicrobial agents tested.
MATERIALS AND METHODS
Study data
In the context of a zoonoses network for research on enteric pathogens a case-control study on sporadic S. enterica human infections in Lower Saxony, Germany was conducted between May 2008 and January 2010 by the state health department of Lower Saxony. According to the Protection Against Infection Act, Salmonella belong to notifiable pathogens in Germany. A total of 5708 notified salmonellosis cases, which were not part of apparent local outbreaks, were identified in this period and 1802 patients agreed to participate in the case-control study. Cooperating sentinel laboratories provided 635 S. enterica isolates, which were sent to the German National Reference Centre for Salmonella at the Robert Koch-Institute, Wernigerode for determination of serotype, phage type and antimicrobial susceptibility profile.
Antibiotic susceptibility testing
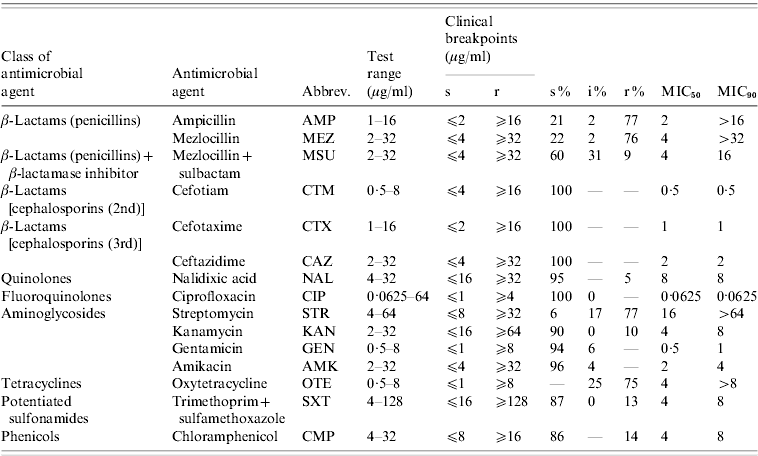
The isolates were tested for antibiotic susceptibility by broth microdilution according to document 58940-8 of the Deutsches Institut für Normung (DIN) [Reference Deutsches Institut19]. The isolates were categorized as susceptible (s), intermediate (i) or resistant (r) on the basis of their minimum inhibitory concentration (MIC) values using clinical breakpoints recommended in DIN 58940-4 [Reference Deutsches Institut19]. If DIN breakpoints were not available, breakpoints given in document M100-S20 [20] by the Clinical Laboratory and Standards Institute (CLSI) were used. This was the case for nalidixic acid and kanamycin. As no internationally accepted breakpoints exist for streptomycin we used the breakpoints accepted by the Robert Koch-Institute in their long-term Salmonella monitoring programmes. The 15 tested antimicrobial agents, the corresponding test ranges and the breakpoints are listed in Table 1. Escherichia coli ATCC® 25922 served as quality control strain. Isolates were classified as multi-resistant when they exhibited resistance to at least three antimicrobial agents of different classes/subclasses [Reference Schwarz21].
Tested antimicrobial agents, dilution ranges and clinical breakpoints used for analyses and susceptibility test results for S. Typhimurium isolates (n=321) from human cases in Lower Saxony
s, Susceptible; i, intermediate; r, resistant.
‘–’ refers to no isolates; ‘0’ refers to rounded values with small number of isolates.
Statistical analysis
For calculations with MIC values, we used the following conventions: If the lowest test concentration of an antimicrobial agent already inhibited growth of the isolate, the corresponding MIC value was recorded as being equal to this concentration. If the highest concentration of an antimicrobial agent did not inhibit growth, the corresponding MIC value was recorded as the next concentration in a twofold dilution series (although this next concentration was not included in the test panel). Correlations between the observed MIC values of two antimicrobial agents were measured using Spearman's rank correlation coefficient. Two-sided tests regarding the hypotheses of no correlation were performed using the package Hmisc [Reference Harrell22] in R, version 2.11.1 [23]. In large datasets small correlation coefficients have already been found to be statistically significant [Reference Altman24]. Due to graphical examinations of the relationships, we interpreted coefficients of ⩾0·5 to be relevant in this context. For visualization jittered scatter plots were applied by adding small random numbers to each observation before plotting [Reference Cleveland25]. This enabled the illustration of overlapping data points, which occur due to the interval-scaled character of MIC values. The observations are displayed on a log2 scale because the predefined concentration steps tested in a susceptibility test increased at twofold steps.
Regarding the categorized antimicrobial susceptibility test results, the association between observations concerning two different antimicrobial agents can be investigated via contingency tables. For graphical illustration we used four-stage shadings for representing the observed relative frequencies. High frequencies on the main diagonal in such a ‘contingency plot’ indicate possible linkages between resistance properties.
To quantify the relationship between the categorized test results, we suggest the following calculations: The ‘resistance index’ is defined as the conditional probability of an isolate being resistant against all agents of interest given the probability of an isolate being resistant against at least one of these agents. In the two-dimensional case, i.e. comparing two agents, it can be formalized by

where X and Y are two variables representing the susceptibility test results of two antimicrobial agents. The index R can be estimated by calculating the observed number of isolates, which are resistant against both agents, divided by the observed number of isolates, which are at least resistant against one agent. In a more-dimensional case, the formula can be adapted accordingly.
In addition to the resistance index, it is worth knowing how likely the simultaneous occurrence of susceptibility to the same antimicrobial agents is. The ‘susceptibility index’ can be formalized analogously in the two-dimensional case by

These indices were calculated for each possible two-dimensional, up to five-dimensional, combination of antimicrobial agents. Exact confidence intervals for R and S were computed based on binomial distribution, which holds the chosen confidence level of 95% even if the estimated proportions are near 0 or near 1 [Reference Fleiss, Levin and Paik26].
RESULTS
The most frequently detected serovars were S. Typhimurium (n=321, 50·6%) and S. Enteritidis (n=249, 39·2%). The remaining 65 isolates (10·2%) comprised 29 different serovars, of which the most frequent were S. Infantis (13 isolates) and S. Bovismorbificans (nine isolates). Of the S. Typhimurium isolates the major phage types detected were DT193 (n=140), DT120 (n=87) and DT104 (n=26).
The corresponding human host population of S. Typhimurium isolates consisted of 54·1% males and 45·9% females with 17·0% patients aged <3 years, 39·1% in the 3–14 years age group and 43·9% aged >14 years. Lower Saxony is a German state where agriculture and livestock farming have a large impact of. According to the region type classification scheme of the Federal Institute for Research on Building, Urban Affairs and Spatial Development [27], 21·8% of patients resided in conurbation areas, 59·3% in urban areas and 18·9% in rural areas.
The results of susceptibility testing of the 321 S. Typhimurium isolates are shown in Table 1. The highest percentages of resistance of >75% were detected for streptomycin, ampicillin, mezlocillin and oxytetracycline. Low percentages of resistant isolates of 5–14% were detected for nalidixic acid, mezlocillin+sulbactam, kanamycin, sulfamethoxazole/trimethoprim and chloramphenicol. All S. Typhimurium isolates proved to be susceptible to the cephalosporins: cefotiam, cefotaxime and ceftazidime, the fluoroquinolone ciprofloxacin, and the aminoglycosides: gentamicin and amikacin.
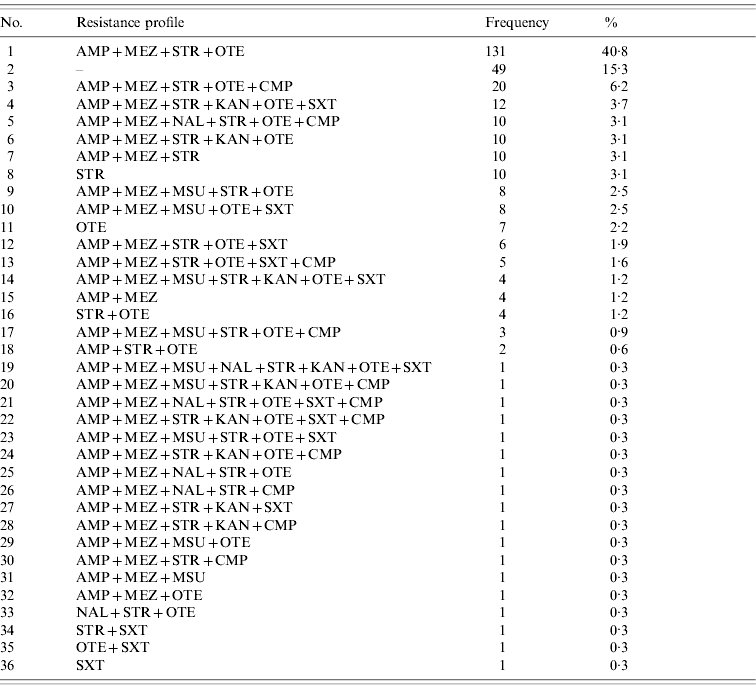
Of the 321 S. Typhimurium isolates tested, a total of 36 different resistance profiles were detected based on classification as resistant and non-resistant (=susceptible+intermediate) (Table 2). Forty-nine (15·3%) isolates were non-resistant to all antimicrobial agents tested, whereas 231 (72%) isolates were classified as multi-resistant by exhibiting resistance against members of 3–6 classes/subclasses of antimicrobial agents. Of these, the predominant profile with 131 (40·8%) isolates was characterized by resistance to penicillins+streptomycin+oxytetracycline.
Observed resistance profiles for S. Typhimurium isolates (n=321) from human cases in Lower Saxony ordered by frequency
For abbreviations, see Table 1.
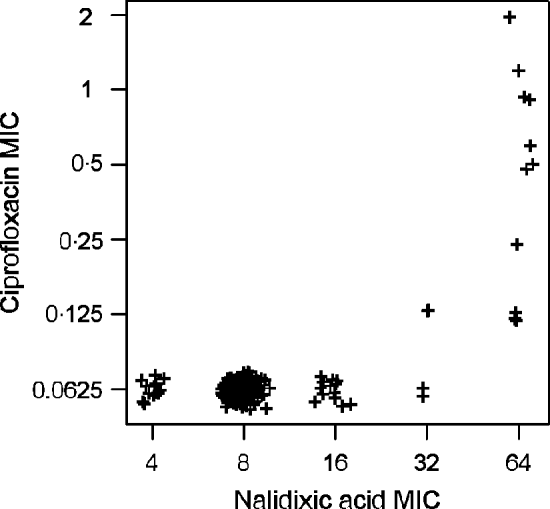
High linkages between resistance properties were calculated for any pairwise combination of ampicillin, mezlocillin, streptomycin and oxytetracycline. Spearman's rank correlation coefficients ranged between 0·56 and 0·81 (Table 3) and the two-dimensional resistance indices were between 84% and 99% (Fig. 1), with maximum values obtained for the two penicillins: ampicillin and mezlocillin. Regarding the four agents combined, the four-dimensional resistance index was calculated as 80%. The corresponding susceptibility index was calculated as 0, i.e. each isolate was classified as either resistant or intermediate to at least one of these agents. Multi-resistance to penicillins (ampicillin and mezlocillin), streptomycin, oxytetracycline and chloramphenicol occurred in 13% of S. Typhimurium isolates and the five-dimensional resistance index was estimated as 16%. Furthermore, some positive monotonic relationships were measured between any of the two penicillins and the combination of mezlocillin+sulbactam (Table 3), while the resistance index was relatively low at 11% (Fig. 1). Spearman's correlation coefficient regarding nalidixic acid and ciprofloxacin confirmed some linkages with a value of 0·59. The jittered scatter plot of MIC values showed, that if nalidixic acid's MIC was low, ciprofloxacin's MIC was also low (Fig. 2). When nalidixic acid's MIC increased to the category ‘resistant’ (⩾32 μg/ml), ciprofloxacin's MIC value of the same isolate also showed an increase, although this increase in MIC did not lead to a classification of the corresponding isolates as resistant. The calculation of the resistance index is not reasonable for this combination, due to the fact that no ciprofloxacin-resistant isolates were present in the study sample.
Associations between resistance properties for S. Typhimurium isolates (n=321) from human cases in Lower Saxony to antimicrobial agents which have any observed resistances. Lower diagonal matrix: contingency plots with frequency-based shading; upper diagonal matrix: calculated indices of resistance (R) and susceptibility (S) with corresponding 95% confidence intervals (for abbreviations, see Table 1).
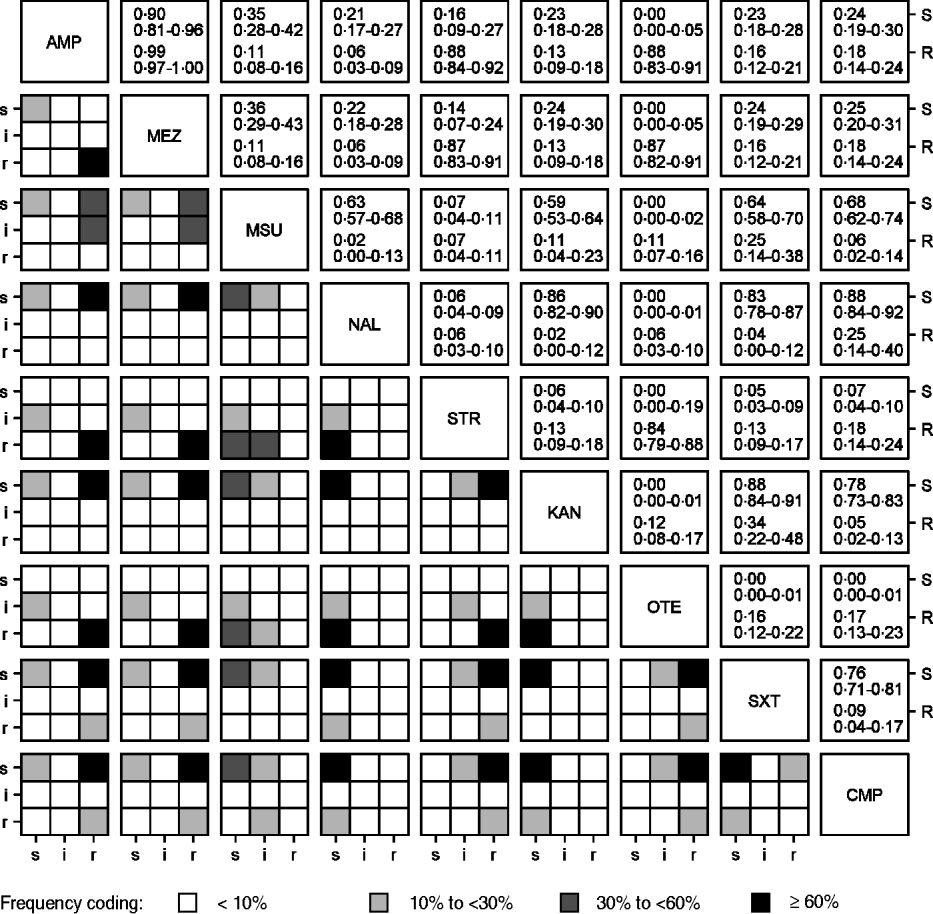
Jittered scatter plot of nalidixic acid minimum inhibitory concentration (MIC) values and ciprofloxacin MIC values for S. Typhimurium isolates (n=321) from human cases in Lower Saxony.
Correlations between MIC values for S. Typhimurium isolates (n=321) from human cases in Lower Saxony using the Spearman's rank correlation coefficient
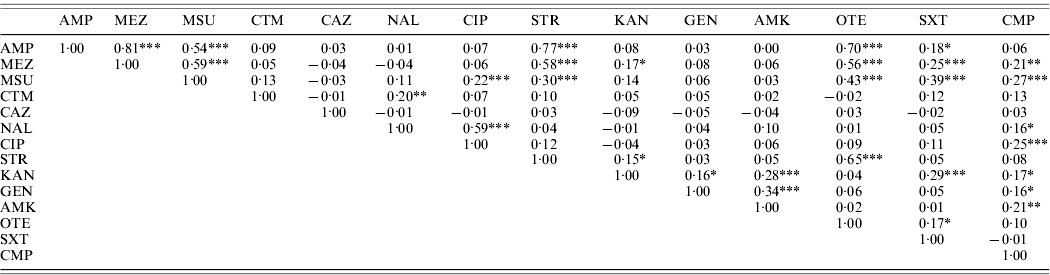
* Information on two-sided P values: * P⩽0·01, ** P⩽0·001, *** P⩽0·0001.
Antimicrobial agents for which the same MIC values have been recorded in all S. Typhimurium isolates tested are not included.
For abbreviations, see Table 1.
DISCUSSION
The objective of this study was to explore quantitative non-molecular methods in order to visualize and describe linkages between different antimicrobial resistance properties in large datasets. As an example the resistance profiles of 321 S. Typhimurium isolates collected from human sporadic salmonellosis cases were investigated.
Concerning the representativeness of this sample, the acquisition of study data can be understood as a stepwise selection process. The first step was the recruitment of notified cases for participation in the case-control study with a response of 31·6%. The second step was a restricted access to a laboratory sentinel, with a further response of 35·2%. Therefore, selection bias is possible. However, in comparing the study data with all notified S. Typhimurium salmonellosis cases in the study period (n=2488, personnel register communication, data not shown), both populations show similar distribution of gender (54·1% vs. 54·2% males). The mean age in both groups is in young adults (22·0 vs. 28·3 years). In summary we therefore did not assume a relevant selection bias for our data and regard it as a representative sample of all notified sporadic salmonellosis cases with serovar Typhimurium in the federal state of Lower Saxony, Germany.
As far as we know the presented methods for analysis of categorical resistance data have not been used in the context of describing linkages between antimicrobial resistance properties up to now. The suggested contingency plot and indices of resistance and susceptibility are intuitive, easy to interpret and flexibly applicable in comparing resistances against two or more antimicrobial agents. They can be applied, if clinical breakpoints are used to categorize the MIC values in three categories ‘susceptible’, ‘intermediate’ or ‘resistant’ or only in the two categories ‘resistant’ and ‘non-resistant’ or ‘susceptible’ and ‘non-susceptible’. They can also be applied, if epidemiological cut-off values for the categories ‘wild type’ and ‘non-wild type’ are used.
In the presented study we chose clinical breakpoints, because only these allow for prediction of therapy success. Isolates classified as ‘non-wild type’ by using epidemiological cut-off values (isolates that have an acquired or mutational resistance mechanism to the drug in question [28]) may show in some cases MIC values, which classify the isolates as susceptible when clinical breakpoints are used. This is particularly true for ciprofloxacin. In the context of clinical breakpoints intermediate isolates are considered in the definition of resistance index as non-resistant and in the definition of susceptibility index as non-susceptible. Therefore the consideration of intermediate isolates is not consistent in the calculation of both indices, but is consistent in that we do not need to further classify the intermediate isolates. Instead, we interpret the intermediate status according to its definition as a buffer zone to prevent misclassification due to measurement errors [28]. If susceptible or resistant isolates are misclassified as intermediate, this affects the stability of any statement about the susceptibility or the resistance of a population. This will cause a susceptibility or resistance index, which is unstable as well. In the two-dimensional case, the amount of intermediate isolates, and therefore the amount of possible misclassified isolates, is displayed in the contingency plots (Fig. 1).
The detection of linkages between resistance properties using these methods is only possible if resistances occur at sufficient frequencies in the isolates of a given test population. If antimicrobial agents, to which most isolates are susceptible, are in the focus of interest, it is of advantage to analyse the quantitative susceptibility test data (i.e. the MIC values), too. For this purpose, we chose the commonly used Spearman's rank correlation coefficient for non-normal data, which enables a pair-wise assessment of antimicrobial agents. In contrast to the categorical data, the MIC values account for changes below or above the breakpoints.
When testing 15 antimicrobial agents and categorizing the results as resistant and non-resistant, theoretically 215=32 768 different resistance profiles are possible. In our sample of 321 isolates only 36 profiles were found (Table 2). This observation confirmed a high level of association between resistance properties within the test population and supports the microbiological observation that resistance genes are often genetically linked and/or occur together.
By applying the suggested methods, we were able to specify these relationships more precisely. The highest associations regarding both the probability of simultaneous occurrence of resistance and susceptibility, were measured for ampicillin and mezlocillin. Susceptibility test results were identical for both agents in nearly 97% of the cases and differed only for cases where one status was intermediate. These penicillins share a similar structure and are considered as β-lactamase-sensitive. Thus, the same β-lactamase is likely to confer simultaneous resistance to ampicillin and mezlocillin and such resistance is regarded as cross-resistance [Reference Brenner11, Reference Werckenthin29]. The most frequent multi-resistances observed in the test population were those to ampicillin/mezlocillin, streptomycin and oxytetracycline. If an isolate was resistant to one of these agents, the probability of it being resistant to all four agents was calculated as 80%. Moreover, every isolate had at least one intermediate status and consequently no isolate was simultaneously susceptible to all four agents. These high multi-resistance levels could be explained by similar selective pressures, which have existed over the last decades since penicillins, tetracyclines and the aminoglycoside streptomycin were introduced into clinical use in human and veterinary medicine almost at the same time [Reference Prescott and Aarestrup30]. Nowadays, penicillins and tetracyclines represent the two classes of antimicrobial agents most frequently used in human and veterinary medicine in Germany [5, Reference Muller31]. The β-lactamase genes, tetracycline and streptomycin resistance genes commonly found in Salmonella are most frequently located on mobile genetic elements [Reference Brenner11]. Often, such genes are found to be co-located on the same plasmid. The horizontal transfer of such multi-resistance plasmids results in a simultaneous transfer of all the resistance genes located on the respective plasmid [Reference Brenner11]. Another mobile genetic element present in Salmonella is the well-studied mobile genomic island SGI1 [Reference Schwarz and Aarestrup32]. Several different SGI1 variants exist, many of which mediate resistance to penicillin, streptomycin, tetracycline, chloramphenicol/florfenicol and sulfonamides. SGI1 was initially detected in the chromosomal DNA of S. Typhimurium DT104, later it was also detected in the chromosomal DNA of other S. Typhimurium phage types and S. enterica serovars [Reference Cloeckaert and Schwarz33, Reference Boyd34]. The location of resistance genes on the chromosome rules out the possibility of losing the resistance property under conditions of low selective pressure. Therefore, it was not surprising to observe the resistance profile with multi-resistance to penicillins, streptomycin, oxytetracycline and chloramphenicol with a prevalence of 85% in the isolates with phage type DT104 (n=26), despite the fact, that chloramphenicol is only used rarely in human medicine and has been banned from use in food-producing animals in the EU since 1994. Of the isolates with other phage types, for which the presence of this mobile genomic island is less likely, the prevalence was 7% (n=295).
The observed correlations between MIC values but low calculated resistance indices for the penicillins, ampicillin and mezlocillin and the combination of mezlocillin+sulbactam (Table 3, Fig. 1) can be explained by the characteristic that β-lactamase inhibitors, such as sulbactam, are not able to inhibit all types of β-lactamases [Reference Werckenthin29]. A considerable number of the 247 ampicillin/mezlocillin-resistant isolates showed susceptibility to mezlocillin+sulbactam (48%) whereas 11% showed resistance to mezlocillin+sulbactam. This observation suggested that different types of β-lactamases are present in the S. Typhimurium isolates tested.
Concerning the observed correlation between nalidixic acid and ciprofloxacin MIC values, previous studies demonstrated that resistance to the quinolone nalidixic acid is based preferentially on single-point mutations in the quinolone resistance-determining region of the target gene gyrA [Reference Piddock35, Reference Eaves36]. For resistance to fluoroquinolones such as ciprofloxacin, additional mutations in further genes are required and clinically relevant MIC values only appear by the stepwise combination of different mutations [Reference Schwarz and Aarestrup32, Reference Hawkey37]. Therefore, ciprofloxacin-resistant isolates are commonly resistant to nalidixic acid. Non-classical phenotypes with reduced ciprofloxacin susceptibility and susceptibility or low-level resistance to nalidixic acid have been reported in rare cases [Reference Gunell38].
Usually, antibiotic therapy is not required to treat S. enterica infections. However, antibiotics are indicated when children aged up to 2 months, elderly people or immunocompromised persons are involved as well as in cases with extraintestinal symptoms. Fluoroquinolones and third-generation cephalosporins are particularly relevant for treatment. Ampicillin, the combination of trimethoprim and sulfamethoxazole and chloramphenicol are occasionally used as alternatives. Analysing the S. Typhimurium isolates with regard to this special subset of therapeutically relevant antimicrobial agents, 22% of isolates were simultaneously susceptible to all six agents. All isolates were susceptible to the cephalosporins and ciprofloxacin and only six isolates were simultaneously resistant to the remaining three agents (Table 2). In Denmark at least four cases in a 1998 outbreak were observed in which S. Typhimurium isolates were nalidixic acid-resistant and ciprofloxacin non-resistant, but the treatment with ciprofloxacin failed [Reference Molbak39]. Further studies give additional evidence, that nalidixic acid resistance should be interpreted as an indicator for possible unreliable ciprofloxacin susceptibility [Reference Ercis40, Reference Hakanen41]. Ray et al. [Reference Ray42] showed that nalidixic acid susceptibility is a good marker for fluoroquinolone susceptibility whereas nalidixic acid resistance had only a poor predictive value for ciprofloxacin resistance.
In summary, the results of this study revealed that the presented analysis tools are appropriate for assessing the resistance situation and quantifying the linkages between resistance properties as shown by using a test population of S. Typhimurium from sporadic salmonellosis cases. The results are useful for public health departments with regard to the monitoring and surveillance of antimicrobial resistance to describe the dynamics of resistance properties and their linkages over time in bacteria of animal or human populations. To clarify this, the stratified indices of susceptibility and resistance comparing the study periods May–December 2008 and May–December 2009 are displayed in Fig. 3. While the majority of susceptibility indices remained constant or decreased, two-thirds of resistance indices increased. In spite of slightly decreasing proportions of multi-resistant isolates during these periods (79·8% vs. 77·9%), the multi-resistant isolates obtained in the second period showed more resistances than those obtained in the first, which caused the observed increase of linked resistances. However, in order to investigate if these changes are part of a trend or yearly variation, larger datasets, e.g. from monitoring programmes are needed. Moreover, if new, frequently arising resistance phenotypes are identified, this is a basis for diagnostic research to conduct sequence analysis for the confirmation of the responsible resistance genes and their organization.
Comparison of calculated indices of resistance (R) and susceptibility (S) with corresponding 95% confidence intervals for S. Typhimurium isolates from human cases in Lower Saxony collected in two study periods: May–December 2008 (lower diagonal matrix, n=99) and May–December 2009 (upper diagonal matrix, n=95) (for abbreviations, see Table 1).

ACKNOWLEDGEMENTS
This study is part of the FBI Zoo Consortium financially supported by the German Federal Ministry of Education and Research (BMBF) through the German Aerospace Center (DLR), grant number 01KI07128 (FBI-Zoo).
DECLARATION OF INTEREST
None.



