

Introduction
Tidewater glaciers (TWGs) exert a major control on the short- and long-term mass balance of the Greenland ice sheet (Reference Van den BroekeVan den Broeke and others, 2009; Reference AlleyAlley and others, 2010; Reference Bevan, Luckman and MurrayBevan and others, 2012). The availability of satellite data has allowed their dynamics to be documented in detail over the past two decades (Reference Moon and JoughinMoon and Joughin, 2008; Reference Box and DeckerBox and Decker, 2011; Reference Moon, Joughin, Smith and HowatMoon and others, 2012). Prior to this, TWG dynamics are poorly constrained by observations, placing limitations on the knowledge of their response to climate change. Multi-decadal records of terminus fluctuations are available for some TWGs back to the 1930s, and limited direct observations exist before this (Reference BjørkBjørk and others, 2012). There is limited potential to extend TWG records to their Little Ice Age maxima (LIAmax) due to the sparse and often indirect nature of observations (Reference WeidickWeidick, 1959, Reference Weidick1968; Reference Briner, Stewart, Young, Philipps and LoseeBriner and others, 2010; Reference Larsen, Kjær, Olsen, Funder, Kjeldsen and Nørgaard PedersenLarsen and others, 2011). Characterization of TWG behaviour during the 18th and 19th centuries is therefore problematic. However, where this is possible it provides insights into centennial-timescale TWG behaviour, and important context for contemporary observations and potential TWG response to future climate forcing.
Predicting the response of the Greenland ice sheet (GrIS) to climate change is dependent on understanding how TWG processes and behaviour are affected by climatic forcings (Reference Van den BroekeVan den Broeke and others, 2009; Reference Rignot, Koppes and VelicognaRignot and others, 2010). Although TWG stability is thought to be controlled by a combination of atmospheric and oceanic forcings occurring at the terminus, the precise processes and their relative importance are still poorly understood (Reference Holland, Thomas, De Young, Ribergaard and LyberthHolland and others, 2008; Reference Nick, Vieli, Howat and JoughinNick and others, 2009; Reference MurrayMurray and others, 2010; Reference Rignot, Koppes and VelicognaRignot and others, 2010, 2012; Reference StraneoStraneo and others, 2010, 2012). Modelling of the GrIS is limited further by the short observation periods of dynamics available for calibration and validation, model computational requirements and resolution, and availability of detailed bed topography (Reference Vieli and NickVieli and Nick, 2011). These can be mitigated by employing spatially reduced models to evaluate glacier catchment-scale responses to different forcings (Reference ThomasThomas, 2004; Reference Nick, Vieli, Howat and JoughinNick and others, 2009, Reference Nick, Van der Veen, Vieli and Benn2010, Reference Nick2012, Reference Nick2013; Reference Joughin, Smith and HollandJoughin and others, 2010a; Reference Colgan, Pfeffer, Rajaram, Abdalati and BalogColgan and others, 2012). Application of these models where TWG records can be extended to their LIAmax allows the potential drivers of post-LIAmax GrIS retreat to be investigated.
The earliest post-LIAmax TWG retreats in Greenland are known to have occurred prior to the first continuous air temperature record at Nuuk in 1866 (Reference WeidickWeidick, 1959, Reference Weidick1968; Reference Vinther, Andersen, Jones, Briffa and CappelenVinther and others, 2006; Reference Weidick, Bennike, Citterio and Nørgaard-PedersenWeidick and others, 2012). This can preclude direct comparison of post-LIAmax TWG response to climate, including the first observed retreat of Jakobshavn Isbræ between 1851 and 1875 (Reference Weidick and BennikeWeidick and Bennike, 2007; Reference Csatho, Schenk, Van der Veen and KrabillCsatho and others, 2008). Application of catchment-scale models where climate data are lacking allows the drivers of individual TWG change to be investigated through series of model sensitivity experiments. These facilitate comparisons of modelled behaviour to observations, and can be used to identify the range of forcings and likely mechanism(s) required to explain the observed retreat.
This study investigates the post-LIAmax dynamics of Kangiata Nunaata Sermia (KNS), southwest Greenland, prior to the instrumental air temperature record. We aim to improve the record of post-LIAmax fluctuations of KNS using previously unstudied geomorphology, newly uncovered historical sources, geospatial analyses, and previously published lines of evidence (Reference WeidickWeidick, 1959; Reference Weidick, Bennike, Citterio and Nørgaard-PedersenWeidick and others, 2012). Secondly, we evaluate whether the post-LIAmax retreat is best explained by changes in surface mass balance (SMB) or forcing perturbations occurring at the terminus. This is achieved using a one-dimensional (1-D) flowband numerical model (Reference Nick, Van der Veen, Vieli and BennNick and others, 2010).
Field Site
KNS is located ~100 km from Nuuk at the head of the Kangersuneq branch of Godthåbsfjord, southwest Greenland (Fig. 1). The terminus retreated significantly during the 19th century, though uncertainty exists regarding the timing and scale of this retreat (Reference WeidickWeidick, 1959; Reference Weidick, Bennike, Citterio and Nørgaard-PedersenWeidick and others, 2012). The glacier catchment is ~31 400 km2, and has a contemporary calving flux in excess of 6 km3 a–1, making it the largest outlet glacier in western Greenland located south of Jakobshavn Isbræ (Reference Van AsVan As and others, 2014). At its LIAmax, KNS was advanced >22 km further down-fjord of its current terminus position, occupying a topographic depression on the west side of the fjord, and forming a large icedammed lake (IDL) in the forefield of Qamanarssup Sermia (QS; Reference Weidick, Bennike, Citterio and Nørgaard-PedersenWeidick and others, 2012).
Hillshaded digital elevation model (photogrammetric DEM and ASTER GDEM mosaic), showing the post-LIAmax geomorphology, and the possible terminus positions/ranges relative to the 2012 terminus position. The 2012 terminus position was mapped from a Landsat image acquired on 18 September 2012. Minimum extent for 1859 position is taken from 1946 terminus position, observed prior to disintegration of the confluence by 1948 (Reference Weidick and CitterioWeidick and Citterio, 2011). Inset is a panchromatic Landsat image of the Godthåbsfjord region acquired on 19 September 1992.

Subsurface West Greenland Current (WGC) waters periodically enter Godthåbsfjord over a shallow (80 m) sill at the entrance to the fjord, establishing a link between the ocean and the terminus (Reference Mortensen, Lennert, Bendtsen and RysgaardMortensen and others, 2011, 2013). Fjord circulation allows surface heated waters to mix downward to subsurface fjord waters, which can also interact with the terminus (Reference Mortensen, Lennert, Bendtsen and RysgaardMortensen and others, 2011). No direct measurements of submarine melt (SM) exist for KNS, although estimates of SM at vertical calving fronts of other West Greenland TWGs range from 0.7 ± 0.2 to 3.9 ± 0.8 m d–1 (Reference Rignot, Fenty, Menemenlis and XuRignot and others, 2012). Within this range, SM for KNS is probably at the lower end due to the sill at the fjord entrance limiting the ability of warm WGC waters to reach the terminus (Reference StraneoStraneo and others, 2012).
Methods for Reconstructing and Dating Glacier Terminus Positions
The LIAmax extent of KNS is clearly defined by a series of moraines and ice-scour limits (Reference Weidick and CitterioWeidick and Citterio, 2011; Reference Weidick, Bennike, Citterio and Nørgaard-PedersenWeidick and others, 2012). These limits and the geo-morphology inside were mapped in detail using high-resolution (2 m2) GeoEye satellite imagery, and ground-truthed during fieldwork conducted in 2011. Reconstructions of glacier geometry were obtained by extracting elevations of mapped moraine limits from an aerophotogrammetrically derived digital elevation model (DEM) of the KNS terminus area, based on a 1985 aerial survey conducted by the Danish Geodata Agency with associated ground control (GR96) and error of ±6 m. Where coverage from this DEM was unavailable, Advanced Spaceborne Thermal Emission and Reflection Radiometer (ASTER) global DEM (GDEM) data (http://asterweb.jpl.nasa.gov/gdem.asp) gridded to 30 m2 resolution were used (Fig. 1). Moraine elevations were extracted relative to the glacier/fjord centre line (also used as the model flowline) using the extrapolated centre-line method presented in Reference Lea, Mair and ReaLea and others, (2014). This allowed moraine elevation profiles to be directly and accurately compared to the modelled glacier elevation profiles (e.g. Fig. 9, further below).
The date and location of terminus positions were reconstructed using an array of historical sources, which are discussed in detail below. The physical plausibility of each account was tested where possible, to establish the level of confidence that could be placed in each observation. In some cases, GIS tools could be applied to constrain terminus locations with greater absolute precision than allowed by qualitative analysis alone.
Historical accounts
The earliest terminus position of KNS that can be determined is from the observations of David Crantz in 1761 (published in English in 1820). He describes observing an unnamed glacier in Baal’s Rivier (a previous name for Godthåbsfjord and Kangersuneq) that ‘ascends in steps for the space of four leagues [~22 km]’, while ‘[a] low hill … closed the vista’, and ‘large tracts of ice … branched off north and south to an unknown distance into the country’ (Reference CrantzCrantz, 1820, p. 34). Crantz’s viewpoint has been reconstructed to be from the valley separating Kangersuneq and Amitsuarssuk fjord branches (Fig. 2). This is based on his account of his approach to the observation point, describing hiking along a valley through which flowed a ‘rivulet, swelling at intervals into pools’, and with Norse ruins located adjacent to ‘a great lake of freshwater’ (Reference CrantzCrantz, 1820, p. 33). The valley identified is the only one in the region that fits Crantz’s description (Fig. 2a). KNS is also the only observable TWG from this viewpoint, with Nunatarssuk likely to be the low hill mentioned, lolcated 20km from LIAmax (Fig. 2b).
Approximate reconstructed location position of Reference CrantzCrantz, (1820) from which he observed KNS in 1761. (a) False-colour Landsat image (acquired 15 September 1987) showing location information. (b) Photograph taken from helicopter in August 2011 showing view down Kangersuneq looking towards the southeast, approximating the view of Crantz.

The next reference to KNS is from Egil Thorhallesen, who, guided by locals, visited an IDL between 1765 and 1775 previously identified as Isvand (Fig. 2; Reference WeidickWeidick, 1959; Reference Weidick, Bennike, Citterio and Nørgaard-PedersenWeidick and others, 2012). The account does not relate a direct observation of the terminus, though it is of potential relevance since the ice margin position at Isvand was dynamically linked to the terminus retreat of KNS during the 20th century (Reference Weidick and CitterioWeidick and Citterio, 2011). The wording of Thorhallesen’s account is ambiguous in that it reports that ‘the glacier has laid itself in recent time’ over Isvand (Reference ThorhallesenThorhallesen, 1776, p. 37). This makes it unclear whether he is referring to a recent advance or retreat of the ice margin from its observed position.
The diaries of Karl Ludwig Giesecke record a visit made to the terminus area of KNS in August 1808 (published in German in 1910). He describes the ice having nearly overridden the Norse ruins indicated in Figure 1 at its maximum extent, though the retreated terminus is still nearby. He makes a comparative assessment of the glacier geometry as being ‘grösser, steiler, und gefa¨hrlicher als der Nordöstliche’ (larger, steeper and more dangerous than that to the north-east [Qamanarssap Sermia]; trans. by N. Weitz) (Reference GieseckeGiesecke, 1910, p. 151), and describes an IDL occupying the QS forefield which ‘über die Felsenwand hinab am Eisblink ins Meer stürzt’ (next to the glacier flows over a rock wall into the ocean; trans. by N. Weitz) (Reference GieseckeGiesecke, 1910, p. 151).
Maps and photographic evidence
The first map of Godthåbsfjord from which it is possible to obtain a reliable estimate of the terminus position of KNS was drawn by Samuel Kleinschmidt (Reference KleinschmidtKleinschmidt, 1859). This shows KNS and AS to be confluent, with the terminus adjoining Akullerssuaq (Fig. 1). An earlier map by Heinrich Rink (Reference RinkRink, 1856) shows KNS to be in a similarly retreated position, though the absence of the valley separating Nunatarssuaq and Akullerssuaq does not allow relative terminus position in the fjord to be identified with confidence. A photograph taken by Rink during the 1850s (in Reference Weidick, Bennike, Citterio and Nørgaard-PedersenWeidick and others, 2012) shows AS and KNS to be confluent (as evidenced by the presence of a medial moraine), though the terminus itself is partially obscured by foreground topography (Fig. 3b). This prevents the identification of the exact position of the terminus from this image.
Viewshed analysis of image acquired during the 1850s. (a) Hillshaded DEM showing the area visible to an observer standing at the location indicated, and (b) the image of KNS taken in the 1850s by Rink (from Reference Weidick, Bennike, Citterio and Nørgaard-PedersenWeidick and others, 2012).

Results
Post-LIAmax geomorphology
Figure 1 shows the post-LIAmax geomorphology of KNS. All subsequent mentions of glacier terminus positions are given relative to the 2012 terminus, indicated by the fjord centre line (Fig. 1). The maximum moraine/ice-scour extent is 22.6 km, and covers an area 220 km2 greater than at present. Multiple sets of moraines exist on both flanks of the fjord within the LIAmax. These include:
-
An upper set of well-developed continuous lateral moraines/ice scour on both sides of the fjord delimiting the LIAmax. On the eastern fjord flank the moraine spans the forefield area of the land-terminating glacier Qamanarssup Sermia (QS), while the moraine on the western flank extends inland into the topographic depression opposite Akullerssuaq (Fig. 1).
-
Several other less pronounced moraines lie proximal and sub-parallel to well-developed upper moraines in the QS forefield on the eastern flank, and also within the topographic depression opposite Akullerssuaq on the western flank. Fluted moraines occupy areas within the LIAmax extent of the QS forefield and between the LIAmax and 1920 Stade moraines on the western flank. These are broadly orientated according to the slope of local topography (Fig. 1).
-
A lower set of moraines/ice scour extends to ~10 km along both sides of the fjord. On the eastern flank this wraps around Akullerssuaq, and on the less steep western flank several inset sub-parallel moraines are present. The outer limit of these has previously been related to the culmination of the 1920 Stade readvance (Reference Weidick and CitterioWeidick and Citterio, 2011).
Trimline elevations show that glacier surface elevation from ~ 20 km to the LIAmax extent did not exceed 100 m a.s.l., with an average surface gradient of 1.6° (Fig. 4). The glacier surface significantly steepens upstream between 20 and 18 km to 4.2°, before surface elevation appears to decrease where the QS forefield adjoins Kangersuneq between 14 and 18 km (Fig. 4). The ice surface steepens to 3.6° as the fjord narrows between 12 and 14 km, before levelling out between 10 and 12 km opposite Akullerssuaq as the ice extends into the topographic depression (Figs 1 and 4). The ice surface rises by ~200 m between 2 and 10 km (1.4˚ surface slope), with the gradient doubling to 2.8° between 1 and 2 km, reaching an elevation of ~ 600 m a.s.l. This final elevation step change occurs immediately upstream of the confluence with AS (Fig. 4).
LIA and 1920 Stade trimline elevations acquired from the DEM. Locations of significant changes in topography and the confluence of KNS with AS are labelled. LIAmax geometry is estimated by averaging the western and eastern trimline elevations over 1 km ranges.

Reconstructing timing of terminus fluctuations: LIAmax–1859
The account of Crantz describing KNS extending from Nunatarssuk for ~20 km corresponds almost exactly with the LIAmax extent of the glacier (Figs 2 and 3). His description of the glacier profile as ‘ascending in steps’ (1820, p. 34) also fits with the reconstructed LIAmax geometry of KNS, with at least three changes in surface gradient identified (Fig. 4). It is proposed that Crantz observed KNS at or very near its LIAmax extent in 1761.
Reference MercerGiesecke’s, (1910) description of an IDL draining directly over land into the fjord provides excellent constraint on the terminus position in 1808. For this drainage to occur, the eastern margin of KNS must be sufficiently retreated from LIAmax to allow the IDL to drain into the fjord over land, rather than subglacially or as an ice-marginal channel. To establish the terminus configurations where it is physically possible to maintain an IDL in the QS forefield, which also drains into the fjord over land, an analysis of possible lake drainage pathways was conducted using the ArcHydro addon to ArcMap v.10 software. Using the DEM shown in Figure 1, dams were inserted along the LIAmax moraines spanning the QS forefield, allowing the IDL and its drainage paths to be reconstructed. Four possible land drainage paths could maintain the IDL, located within a terminus range of ±550 m (Fig. 1). However, since the majority of this range is within a section of the fjord that begins to widen, from a glaciological perspective the narrower section of the fjord represents a more likely location for the terminus (Reference MercerMercer, 1961). The 1808 terminus location on the western flank is less certain, though a likely range of terminus configurations is indicated in Figure 1.
The smaller, less continuous inset moraines subparallel to the LIAmax suggest glacier thinning from the LIAmax. The steep fjord valley side topography that extends between 17 and 22 km provides low preservation potential for moraines, meaning that the style of retreat from 1761 to 1808 cannot be reconstructed with confidence.
Map evidence places the terminus of KNS as adjoining Akullerssuaq in 1859 (Reference KleinschmidtKleinschmidt, 1859). Viewshed analysis applied to the photograph taken by Rink in the 1850s (Reference RinkRink, 1856) allows the maximum possible extent of the terminus to be reconstructed (Fig. 3). From this, the headland that partially obscures the terminus in this photograph corresponds to the 1920 Stade moraine limit. The terminus was therefore located inside this limit by 1859 (Fig. 1).
In the topographic depression opposite Akullerssuaq (Fig. 1), the geomorphology preserves no evidence for stabilization of the lateral ice margin between the LIAmax/LIAmax-proximal and 1920 Stade lateral moraines. This is despite the shallow slope of this area providing excellent potential to preserve moraines. The presence of fluted moraines in this area suggests that reworking has not been significant, making the destruction of lateral moraines highly unlikely. The ice margin is therefore interpreted to have thinned rapidly, in a single phase, bringing it inside the 1920 Stade moraine extent.
In summary, KNS had achieved its LIAmax by 1761, and subsequently retreated rapidly in either one or two phases. In the single-phase scenario, Reference GieseckeGiesecke, (1910) observed the terminus part way through the retreat in 1808. Lack of evidence for stabilization of the lateral ice margin indicates retreat to its 1859 position would have occurred rapidly (i.e. in years rather than decades). The two-phase scenario would have KNS retreating and temporarily stabilizing at or near its 1808 extent between 1761 and 1808, forming the inset lateral moraines adjacent to those of the LIAmax, before retreating rapidly to its 1859 position sometime between 1808 and 1859.
Model Experiments
The aim of the model experiments is to determine the likely drivers of the reconstructed terminus retreat. Three sets of experiments were run, aiming to test (1) the sensitivity and response timescales of KNS to a range of step changes in SMB, (2) sensitivity to direct forcing of the terminus, including incremental increases in crevasse water depth (CWD), and submarine melt rates (SM), and (3) the response timescales following step changes in terminus forcing. Parameter sensitivity was tested over significant ranges of values to allow full characterization and evaluation of model behaviour. For each model run, the glacier was tuned to approximate the reconstructed LIAmax geometry (e.g. Figs 2 and (further below) 9), using the process described in Appendix B.
Model description and input
KNS is modelled using a 1-D depth-integrated flowband model (Reference Nick, Van der Veen, Vieli and BennNick and others, 2010), utilizing a crevasse-depth calving criterion, where calving occurs once the combined basal and surface crevasses penetrate the full ice thickness (Reference Benn, Hulton and MottramBenn and others, 2007; Reference Nick, Van der Veen, Vieli and BennNick and others, 2010). The CWD variable within this criterion has previously been used to drive models, linking it to air temperature or runoff data (Reference Cook, Zwinger, Rutt, O’Neel and MurrayCook and others, 2012, 2013; Reference NickNick and others, 2013), while submarine melting (SM) can be applied as negative mass balance downstream of the grounding line (Reference NickNick and others, 2013). Experiments are run using a moving grid, with an along-flow grid size of ~250 m. The model has previously been applied successfully to several different TWGs in Greenland (Reference Nick, Vieli, Howat and JoughinNick and others, 2009, Reference Nick2012, 2013; Reference Vieli and NickVieli and Nick, 2011). A description of the force-balance equations and calving criterion are provided in Appendix A, and the parameter values used are presented in Table 1.
List of parameters and constants used to run the model

Basal topography for the lower 40 km of the catchment is derived using a mass continuity approach following the methodology of Reference Morlighem, Rignot, Seroussi, Larour, Ben Dhia and AubryMorlighem and others, (2011), utilizing CReSIS (Center for Remote Sensing of Ice Sheets, University of Kansas, USA) flight lines for validation (Reference GogineniGogineni and others, 2001). For the upper catchment, bed topography is obtained from Reference Bamber, Layberry and GogineniBamber and others, (2001). Point measurements of fjord bathymetry were used for bed topography in Kangersuneq, where KNS terminates (Fig. 4; Reference Weidick, Bennike, Citterio and Nørgaard-PedersenWeidick and others, 2012). Model sensitivity to bed topography uncertainty is evaluated by experiments outlined in Appendix C. SMB ablation values are taken from the average 1958– 2007 Regional Atmospheric Climate Model (RACMO) output for the catchment of KNS (Reference EttemaEttema and others, 2009). The overall SMB results in contemporary balance calving flux of ~8.2 km3 a–1, well in excess of the direct contemporary estimates of ~6 km3 a–1 (Reference Van AsVan As and others, 2014). SMB values in the accumulation zone are therefore reduced, so as to maintain the contemporary ice-sheet elevation over centennial-timescale model runs.
This represents a conservative approach to the definition of accumulation SMB values during the LIA, since values have been suggested to be ~10–40% lower over the catchment of KNS during this period (Reference BoxBox and others, 2013). The definition of catchment boundaries in the ice-sheet interior, which can affect apparent calving fluxes in the long term, is also known to represent a potentially significant uncertainty when defining the accumulation zone of an ice-sheet glacier (Reference Bevan, Luckman and MurrayVan As and others, 2012, 2014). However, high-resolution SMB modelling of the Nuuk region for 1960–present also indicates that most of the interannual variability in the net balance of KNS’s catchment is derived from changes in ablation, where the catchment is likely to be comparatively well defined (Reference Van AsVan As and others, 2014). Therefore most of the SMB-driven mass change over the period of interest is likely to have been driven by variability in the ablation zone rather than by changes in accumulation.
Ice contributed by Akullerssup Sermia (AS), the glacier adjacent to KNS, is accounted for in the model as extra SMB across their 5 km confluence (between 3 and 8 km). The flux is distributed along this confluence proportional to the contemporary across-terminus velocity profile of AS (Reference Joughin, Smith and HollandJoughin and others, 2010b). An approximation of the present-day flux of AS is derived by taking a physically based estimate of the flux of KNS of ~6 km3 a–1 (Reference Van AsVan As and others, 2014), and scaling this value using the widths and terminus velocities of both glaciers. This provides a contemporary AS flux estimate of ~1 km3 a–1. In the model the volume of ice contributed by AS per time-step is therefore taken to be one-sixth of the modelled flux of KNS immediately upstream of their confluence.
Modelled terminus positions were compared directly to mapped terminus positions using the curvilinear box method (CBM) of tracking terminus change (Reference Lea, Mair and ReaLea and others, 2014). This allows direct comparison of mapped results to model results since both the CBM and the model track terminus position in relation to the fjord centre line.
Sensitivity to surface mass balance
All SMB experiments were run keeping terminus forcing (CWD and SM) constant (Fig. 5). These experiments test terminus sensitivity to step changes in ablation zone SMB up to 200% of the 1958–2007 RACMO average values. Sensitivity to step changes in accumulation was not investigated, due to the likelihood of accumulation having increased over the glacier catchment following the LIA (Box and others, 2012). Separate model runs were conducted for 10% increments of initial SMB ablation values ranging between 110% and 200%. Sensitivity was evaluated by comparing the model time required for the terminus to retreat, to the known time needed, indicated by the glacier reconstruction.
Results showing (a) observed terminus retreat, and (b) modelled retreat showing impact of multiplying ablation rates by a prescribed scale factor. Model was spun up to be vulnerable to retreat near its LIA maximum, with CWD = 175 m and no SM applied.

Sensitivity to forcing at the terminus
Glacier sensitivity to terminus forcing is investigated through application of both incremental and step changes in forcing. The sensitivities of LIAmax KNS to incremental changes in both CWD and SM were evaluated separately to characterize how, or if, they responded differently to small, steady increases in these two forcings. Two sets of model runs with incremental forcing were conducted. The first increased CWD by 1 m every fifth year of the model run, while SM was held constant, testing terminus sensitivity to CWD for fixed values of SM. The second increased SM from initial predefined values (0–1.5 km3 a–1, at 0.1 km3 a–1 intervals) by 0.025 km3 a–1 every fifth year, while CWD was held constant. By doing this we evaluate terminus sensitivity to small successive increases in SM from given initial SM scenarios at the LIAmax, and constant CWD values.
Glacier sensitivity to different magnitudes of step change in CWD was evaluated by applying these for different constant SM values in each model run. SM values used were determined from the results of the incremental forcing experiments, using only values where modelled retreat behaviour was comparable to the pattern of retreat observed. Experiments were also conducted in which different magnitudes of step change in SM were applied. Similar to the SMB experiments, sensitivity was evaluated by comparing the model time required for the terminus to retreat following the step change, to the known timescale of glacier retreat.
Model Results
The modelled evolution of the terminus position is shown with respect to time (Figs 5, 7 and 8) and forcing applied (Fig. 6). The locations of modelled stable terminus positions driven by SM and CWD forcings are replicated between experiments (Fig. 6). The majority of model runs also simulate some degree of stabilization at a topographic narrowing in the fjord at ~12.5 km from the 2012 terminus position, where there is no observational or geomorpho-logical evidence of terminus stabilization (Fig. 6). This potential pinning point is thought to be real, rather than an artefact of bed topography uncertainty (Appendix C). Each modelled stable terminus position possesses different relative resilience to increasing levels of forcing before retreating to the next stable location. Of the pinning points identified, the 12.5 km position is generally the least resilient to changes in forcing.
Results showing (a) observed terminus retreat, (b) modelled retreat holding SM constant and increasing CWD by 1 m every fifth modelled year, and (c) modelled retreat holding CWD constant, after spinning up to an initial SM at LIAmax, and increasing SM by 0.025 km3 a–1 every fifth modelled year. Narrow dashed curves in (b) and (c) indicate position of the grounding line.

Model results showing (a) observed terminus retreat and (b) terminus position following a step change in SM following a 50 year spin-up period where SM = 0 km3 a–1, following the results of the incremental sensitivity tests. CWD is held constant throughout (175 m). Dashed lines indicate position of the grounding line. Application of the step change in each case occurs at 0 years (bold dashed line).

Model results showing (a) observed terminus retreat, and (b, c) terminus positions following a 10% (b) and 20% (c) step change in CWD after a 50 year spin-up period. Narrow dashed curves in (b) and (c) indicate position of the grounding line. Application of the step change in each case occurs at 0 years (bold dashed line).

SMB forcing
The modelled glacier displays very little sensitivity to changes in ice thickness driven by changes in ablation (Fig. 5). Even an extreme SMB forcing (ablation = 200% of 1958–2007 RACMO average) produces a retreat <1 km from the LIAmax over 300 model years. It is therefore unlikely that SMB-driven changes in ice thickness caused the retreat from LIAmax to the 1808 position.
Incremental terminus forcing
Model results of incremental forcing demonstrate that CWD and SM can potentially initiate rapid terminus retreat over small parameter spaces (Fig. 6). However, the sensitivity of the modelled glacier to the absolute values of SM or CWD is dependent on the initial conditions of the model run. Model runs with higher SM rates enhance the sensitivity of the modelled glacier to changes in CWD, with the 12.5 km pinning point becoming less well represented as SM increases (Fig. 6b). Although this pinning point is barely apparent where SM > 0.8 km3 a–1 (demonstrating behaviour in agreement with the glacier reconstruction presented), these represent SM rates at the upper end, or greater than anything previously observed in Greenland (Reference Rignot, Fenty, Menemenlis and XuRignot and others, 2012; Reference Enderlin and HowatEnderlin and Howat, 2013). These runs also generate instabilities within the model, with the grounding line demonstrating significant oscillatory behaviour (>1 km) over timescales of <1 year (Fig. 6b).
Only one model run, spun up to the LIAmax with SM = 0 km3 a–1, retreated significantly in response to increasing SM (Fig. 6c). Remaining model runs formed floating ice tongues, as high SM rates drove grounding line retreat, while there was sufficient lateral drag for the terminus to remain stable. If increasing SM did drive retreat from LIAmax to the 1920 Stade position, it would have required SM to have dramatically increased, from 0 km3 a–1 to ~0.6 km3 a–1. However, this run also includes the terminus stabilizing at the 12.5 km pinning point, not represented in the glacier reconstruction. Once SM > 0.78 km3 a–1 the model run begins to display comparable grounding line variability to that observed in other runs where initial SM rates were >0 km3 a–1 (Fig. 6c).
Step changes in terminus forcing
Following results from incremental increases in SM (Fig. 6c), step changes in SM of different magnitudes were applied only where the model was spun up with an initial SM rate of 0 km3 a–1 at the LIAmax (Fig. 7). The results from these runs demonstrate that an increase in SM to 0.3 km3 a–1 could cause a retreat to the 1859 terminus position, though it would take >200 years to do so. To drive a retreat from the LIAmax to the 1859 position within the time frame observed (<98 years), requires a step-change increase of at least 0.5 km3 a–1. However, given the lack of geomorphological evidence for a stable margin at 12.5 km, an increase of >0.6 km3 a–1 would probably be required, based on the modelled time needed for the terminus to retreat through the 12.5 km pinning point (Fig. 7).
Step changes in CWD of 10% (Fig. 8a) and 20% (Fig. 8b) were also applied for constant SM ranging from 0.1 to 1 km3 a–1. As with results from incremental changes in CWD (Fig. 6b), these show that terminus sensitivity to changes in CWD increases with higher values of SM (Fig. 8). However, results also demonstrate that moderate step changes in CWD are capable of producing a retreat to the 1859 position for moderate values of SM. For example, where SM > 0.3 km3 a–1, a 20% increase in CWD can drive a retreat from LIAmax to the 1859 position in 31 years.
Implications of Model Results
Model results demonstrate that the LIAmax to 1859 retreat of KNS is unlikely to have been driven by changes in SM or SMB. Where changes in SM can produce a retreat pattern comparable to that observed (Figs 6c and 7), the SM rates required to achieve this are at the upper end, or greater than anything previously observed in Greenland (Reference Rignot, Fenty, Menemenlis and XuRignot and others, 2012; Reference Enderlin and HowatEnderlin and Howat, 2013). The step changes in SM required to reproduce observed retreat that skip the 12.5 km pinning point are also of such a scale (increasing from 0 to ~0.8 km3 a–1), that they are equivalent to the SM regime at KNS changing from experiencing one of the lowest, to one of the highest SM rates currently observed in Greenland. For this to occur would necessitate a dramatic change in fjord hydrography. Such a change is thought to be not only unlikely, but also unrealistic, given observations of the contemporary fjord hydrography (Reference Mortensen, Lennert, Bendtsen and RysgaardMortensen and others, 2011, 2013), and the likelihood of KNS experiencing low SM rates compared to the rest of Greenland (Reference StraneoStraneo and others, 2012).
In comparison, results from experiments with step changes in forcing demonstrate that moderate changes in CWD are capable of replicating the observed pattern of retreat, within a realistic time frame (Fig. 8). Crucially, these are observed where the model is run with comparatively low SM rates (>0.3 km3 a–1). These SM values fall well within the range of SM rates that have been observed for vertical calving fronts elsewhere in Greenland (equivalent to between (0.15 ± 0.05) and (0.8 ± 0.15) km3 a–1 for KNS; Appendix A).
The changes in CWD required to drive this retreat are also consistent with variability from high-resolution SMB modelling of KNS for the period 1960–2011 (Reference Van AsVan As and others, 2014). For this period, significant interannual variability in runoff is shown to exist, with values of 3.12±2.40 Gt a–1 (2σ, representing interannual variability of ±77%). Longer-term averages of modelled runoff values also display significant variability. For example, modelled runoff for the period 1991–2010 (3.47 Gt a–1) is 31% higher than for the period 1971–90 (2.65 Gt a–1; Reference Van AsVan As and others, 2014). The magnitude of this increase in runoff could feasibly be scaled to changes in CWD even greater than the maximum 20% step change investigated here (Fig. 8). Given the existence of this scale of multi-decadal variability, it is therefore realistic to suggest that runoff-driven changes to CWD were potentially the primary driver of KNS’s retreat from its LIAmax to the 1859 position.
It has also been established that the 12.5 km pinning point identified in multiple model runs is likely to be real, and not the result of uncertainty in fjord topography (Appendix C). The lack of evidence for terminus stabilization at this location from either observations or geomorphology therefore suggests that the terminus of KNS was able to bypass this pinning point in response to the magnitude of forcing it experienced as it retreated. Unfortunately, at present there is a significant lack of summer temperature observations, or proxy data with sufficiently high temporal resolution/accuracy for the period relating to this study. Therefore it is not possible to attribute the observed terminus retreat to any specific known climate change in Greenland.
Conclusions
KNS is shown to have retreated by at least 12 km in one or two phases from its LIAmax to 1859. Utilizing historical sources, we place KNS at its LIAmax in 1761; it had retreated ~5 km from this position by 1808. This is earlier than any other known post-LIAmax glacier retreat in Greenland. Map and early photographic evidence provide a range of possible terminus positions for 1859 within the 1920 Stade moraine limit. Geomorphology indicates rapid retreat of at least 7 km to the 1859 terminus following a retreat from LIAmax to the 1808 terminus position (two-phase retreat scenario). However, it is possible KNS retreated in a single phase to the 1859 position, and the terminus was observed in 1808 during this retreat. This provides evidence for at least one and potentially two significant post-LIAmax retreats of a major Greenlandic TWG occurring in the early 19th and potentially late 18th centuries. The timing of this predates the post-LIAmax retreat of Jakobshavn Isbræ by at least 43 years, though possibly up to 113 years (Reference Csatho, Schenk, Van der Veen and KrabillCsatho and others, 2008). This highlights the asynchroneity of TWG terminus responses from their LIAmax, and the similarity to asynchronous behaviour of 21st-century TWG dynamics (Reference McFadden, Howat, Joughin, Smith and AhnMcFadden and others, 2011; Reference Moon, Joughin, Smith and HowatMoon and others, 2012). This contrasting behaviour also demonstrates the risk of using dated maximum terminus positions from individual TWGs as indicators of a regional LIA maximum.
Modelling results suggest that terminus stability is largely insensitive to SMB-driven ice thickness changes, while SM is likely to have had a minor or modulating effect on the overall terminus retreat over centennial timescales. By contrast, the modelled glacier is very sensitive to changes in CWD, that are capable of driving a retreat of KNS from its LIAmax to its 1859 configuration. The changes in CWD required to drive the retreat are also within the range of multi-decadal variability of more recent surface runoff values derived from high-resolution SMB modelling (Reference Van AsVan As and others, 2014). This highlights runoff-driven changes to CWD as a likely potential driver of terminus retreat between the LIAmax and 1859.
Given the need to establish the centennial-timescale controls on TWG variability (and hence ice-sheet response, and likely sea-level change), high-resolution, high-quality, quantitative proxy records of climate forcing are needed to allow adequate evaluation of centennial records of glacier fluctuations, such as presented here. These include reconstructions of local summer air temperature variability (e.g. Reference D’Andrea, Huang, Fritz and AndersonD’Andrea and others, 2011), runoff (e.g. Reference Kamenos, Hoey, Nienow, Fallick and ClaverieKamenos and others, 2012) and fjord hydrography (e.g. Reference LloydLloyd and others, 2011). The latter is potentially significant for glaciers such as KNS that drain into fjords with a shallow fjord mouth sill (Reference Mortensen, Lennert, Bendtsen and RysgaardMortensen and others, 2011, 2013; Reference StraneoStraneo and others, 2012). Such proxy records, alongside instrumental records and longer-term reconstructions of glacier behaviour back to their Little Ice Age maxima (and where possible beyond), would provide significant improvements to our understanding of TWG response over the next 100–200 years.
Acknowledgements
We thank two anonymous reviewers for comments that helped to improve the manuscript. Nora Weitz (University of Maine, USA) is thanked for assistance with translating passages of German, and Christian Koch Madsen (National Museum of Denmark, Copenhagen) for help with tracking down images of KNS. RACMO2.1 data were provided by Jan van Angelen and Michiel van den Broeke of the Institute for Marine and Atmospheric Research Utrecht (IMAU), The Netherlands. This research was financially supported by J.L.’s PhD funding, UK Natural Environment Research Council (NERC) grant No. NE/I528742/1. Support for F.M.N. was provided by the Conoco-Phillips/Lundin Northern Area Program CRIOS (Calving Rates and Impact on Sea Level) project.
Appendix A: Model Description
The model used in this study is designed to simulate the behaviour of tidewater outlet glaciers, and is explained in full detail in Reference NickNick and others, (2010). It employs a simple, physically based, nonlinear effective pressure sliding law, where the depth-integrated driving stress is balanced by longitudinal stress gradients, basal and lateral drag (Reference Van der Veen and WhillansVan der Veen and Whillans, 1996; Reference FowlerFowler, 2010). These are represented by the first, second and third terms respectively on the right-hand side of Eqn (A1), with the driving stress represented by the left-hand term:

where ρ i is density of ice, ρ p is density of the proglacial water body, g is gravitational acceleration, x is the along-flow distance, H is ice thickness, D is depth of ice below the surface of the proglacial water body, A s is bed roughness parameter, A is temperature-dependent rate factor (4.5 × 10⁻¹⁷ Pa–3 a–1, corresponding to ice at –58C (Cuffey and Paterson, 2010)), W is glacier width, ν is effective viscosity (dependent on the strain rate) and m is friction exponent. This sliding law allows the modelled glacier to replicate the velocity profiles that are often observed approaching marine termini, and thus provides a good representation of realistic sliding (Reference Nick, Van der Veen, Vieli and BennNick and others, 2010, 2013; Reference Vieli and NickVieli and Nick, 2011; Reference JamiesonJamieson and others, 2012). Constant and parameter values used in the model are outlined in Table 1.
Variations in basal and lateral friction due to meltwater supply can also potentially be modelled using the friction parameters µ and λ (Reference Nick, Van der Veen, Vieli and BennNick and others, 2010, 2012, 2013). However, both are given a constant value of 1 in all model runs shown, since this has primarily been suggested to be most significant over sub-annual, rather than multi-annual to decadal, timescales (Howat and others, 2010; Reference Nick, Van der Veen, Vieli and BennNick and others, 2010, 2012, 2013; Reference Vieli and NickVieli and Nick, 2011).
The model employs a full-depth calving criterion, calculating the penetration depth of both surface and basal crevasses within a field of closely spaced crevasses (Reference NyeNye, 1957; Reference Benn, Hulton and MottramBenn and others, 2007). Calving occurs when the surface and basal crevasses combined penetrate the full ice thickness (Reference Nick, Van der Veen, Vieli and BennNick and others, 2010). Where water ponds in crevasses there is the potential for it to force deeper penetration compared to a dry crevasse, according to
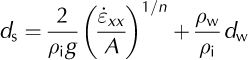
where d s is depth of surface crevasse, ε xx is longitudinal stretching rate, n is Glen’s flow law exponent and d w is crevasse water depth. For a given flow regime, greater values of d w can therefore instigate higher calving rates that in turn drive retreat.
Basal crevasse heights are also included in calculations of cumulative crevasse penetration, according to
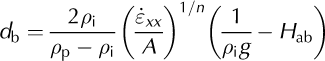
where H ab is height above buoyancy of a given ice thickness, calculated as
This full-depth calving criterion is employed given that instances of full-depth calving behaviour were observed at KNS during fieldwork conducted in August 2011.
SM is applied uniformly across the entire width of the grounding line. Volumetric rates of SM (e.g. km3 a–1) are also prescribed within the model rather than linear melt rates per time-step (e.g. m d–1). This is because application of the latter to a 1-D model will result in SM volume being partially dependent on the glacier width. Volumetric rates provide internal consistency between model runs for each time-step and location in the modelled fjord. Constant SM values ranged from 0 to 1.5 km3 a–1 (0.1 km3 a–1 intervals). The latter is equivalent to SM rates of 0 to ~5.25 m d–1 with increments of ~0.36 m d–1. This covers the range of values up to 150% of those that have so far been observed for termini in western Greenland (Reference Rignot, Fenty, Menemenlis and XuRignot and others, 2012; Reference Enderlin, Howat and VieliEnderlin and Howat, 2013).
To allow direct comparison, previously published daily linear SM rate values (m d–1) were multiplied by 365.25 to scale them up to units of m a–1, before being converted to volumetric values. The conversion to volumetric melt rates was achieved by multiplying the annual linear SM values by KNS’s contemporary glacier width (~5 km) and fjord depth at the terminus (~225 m). As an approximation, these SM volume values were then halved, to reflect that the majority of SM occurs during summer only, driven by subglacial runoff (Reference Sciascia, Straneo, Cenedese and HeimbachSciascia and others, 2013). These equate to volumetric SM range estimates for KNS of between (0.15±0.05) and (0.8±0.15) km3 a–1 (Reference Rignot, Fenty, Menemenlis and XuRignot and others, 2012; Reference Enderlin, Howat and VieliEnderlin and Howat, 2013). Within this range, the SM value for KNS has been suggested to be low compared to other Greenlandic glaciers, since fjord bathymetry is thought to limit the influence of ocean waters on fjord water temperature (Reference Mortensen, Lennert, Bendtsen and RysgaardMortensen and others, 2011, 2013; Reference StraneoStraneo and others, 2012).
Appendix B: Model Tuning
A variety of basal sliding scenarios are explored during tuning by varying the basal roughness parameter A s. For simplicity, the catchment is split into two different zones where A s is set to two different values. These comprise a rougher upstream and smoother downstream zone. Five different transition positions between these two zones are modelled to establish how this may affect model behaviour (especially potential effects on modelled elevation profiles). The boundary positions investigated between these zones were positioned 5–55 km from the 2012 terminus position at 10 km intervals. On interferometric synthetic aperture radar (InSAR) velocity maps the latter position marks the approximate location of where rapid ice flow begins (Reference Joughin, Smith, Howat, Scambos and MoonJoughin and others, 2010b), providing an intuitive upstream limit to the transition between the higher and lower basal roughness values. Thirty different basal sliding scenarios were evaluated, with the feasibility of each evaluated through comparison to glacier elevation profiles reconstructed from the geomorphology (e.g. Fig. 9).
Surface elevation profile evolution of the modelled glacier superimposed on the reconstructed elevation profiles for LIAmax (red), 1920 Stade (orange) and 1985 (yellow). Each modelled profile shown represents 1 m increments in CWD every fifth model year.

By applying uniform basal roughness values we aim to avoid circular reasoning that would arise by tuning basal roughness values to predispose KNS to stabilizing/retreat at sections where pinning points/retreats have occurred. This allows robust interrogation of model results, making as few assumptions as possible regarding basal roughness. The sensitivity of each modelled glacier to retreat under specific basal roughness scenarios was tested by increasing d w incrementally. For each scenario the post-spin-up value of d w was increased by 1 m every 5 model years until the terminus retreated beyond the 2012 terminus position, or d w exceeded 250 m. The latter condition is applied since sections of the fjord are <250 m in depth, meaning that in these regions the terminus is fully grounded and its position will be defined almost solely as a function of d w. Where this occurs and the fjord continues to shallow this could potentially force the creation of unrealistic freeboard heights at modelled termini.
Figure 9 is an example output of the sensitivity tests, showing the profile evolution of the basal roughness configuration used in this study.
Appendix C: Bed Sensitivity
Previously published work has established that model results of tidewater glaciers can be sensitive to uncertainties in fjord bathymetry (Reference Enderlin, Howat and VieliEnderlin and others, 2013). To evaluate whether the uncertainty in fjord bathymetry significantly affects modelled terminus behaviour, sensitivity tests were conducted. This involved randomly varying bed elevation where fjord topography is unknown over blocks of three gridcells (~750 m), across a vertical range of ±50 m, before then being smoothed over the same distance to avoid step changes in topography. Three sets of experiments were run, (1) varying the bed downstream of the 1920 Stade maximum, holding the downstream section of the fjord constant, (2) varying the bed upstream of the 1920 Stade maximum, holding the upstream section of the fjord constant, and (3) varying the bed downstream of the 2012 terminus position. This evaluates the impact of bed uncertainty, and potentially the section of the fjord where this is important. Each experiment was run for 50 different bed configurations.
Results demonstrate that unknown sections of fjord topography do not significantly affect the large-scale retreat behaviour of KNS (e.g. Fig. 10). Pinning points identified by the model are therefore suggested to be real, rather than artefacts of fjord topography uncertainty.
Example of terminus sensitivity to random changes in unknown sections of fjord bathymetry along the entire length of the fjord. Results are shown for the retreat pattern of the modelled glacier in response to 1 m increments of CWD every fifth model year, for 50 different bed configurations.


