


Significant outcomes
-
• Robust genetic correlation: We confirmed a significant global genetic correlation between AITD and MDD. Furthermore, local genetic correlation analyses identified specific chromosomal regions harbouring shared genetic influences, strengthening the evidence for a biological link.
-
• Discovery of novel risk variants: Through MTAG analysis, we identified 112 novel SNPs associated with the conjoint AITD-MDD phenotype. These variants might reveal new genetic architecture underlying their comorbidity.
-
• Evidence for causal direction: MR analyses provided evidence supporting a putative causal effect of MDD (exposure) on increasing the risk of AITD (outcome). This suggests MDD may be a risk factor for subsequent AITD development.
-
• Identification of shared functional genes: Using SMR method, we pinpointed two plausible functional genes whose expression levels are associated with the shared genetic risk for AITD and MDD comorbidity. These genes represent novel biological targets for understanding the mechanistic link between these disorders.
Limitations
-
• Undifferentiated AITD phenotype: The GWAS summary data for AITD combined Graves’ Disease (GD) and Hashimoto’s Thyroiditis (HT), which may have distinct genetic architectures and potentially different comorbidity patterns with MDD. The lack of large-scale, European-ancestry GWAS summary data specifically for GD and HT limited our ability to investigate subtype-specific genetic relationships with MDD. Future GWAS focusing on individual AITD subtypes are needed to clarify their comorbidity with MDD.
-
• Potential MTAG assumption violations: The MTAG assumes equal SNP heritability for each trait and perfect genetic covariance. Violations of these assumptions could introduce bias into the results. However, the large sample sizes and absence of sample overlap in the source GWAS likely minimised this risk. The consistency of our findings across two independent MDD GWAS datasets provides additional support for the robustness of the novel SNP associations identified.
-
• Causal inference caveats (Mendelian randomisation): While sensitivity analyses were employed, the MR results suggesting a causal effect of MDD on AITD risk could still be influenced by residual horizontal pleiotropy (e.g. SNPs affecting both traits via pathways like inflammation) or unmeasured environmental or genetic confounders correlated with the instrumental variables (IVs). The MR analysis specifically tested MDD as exposure and AITD as outcome. The reverse direction or more complex bidirectional relationships were not fully explored here. The IVs were derived exclusively from European-ancestry cohorts. Consequently, the causal estimate may not generalise to other populations due to differences in linkage disequilibrium (LD) patterns, allele frequencies, or causal pathways. Larger, more diverse datasets are required to confirm the causal relationship.
-
• Unmodelled environmental factors: This study focused on genetic contributions. Important environmental factors (e.g. stress, diet, medications) known to influence both AITD and MDD were not explicitly modelled due to data constraints. Current GWAS summary statistics lack harmonised environmental exposure data, and the dynamic nature of these factors complicates integration. Future research should integrate genetic risk scores with longitudinal environmental data to elucidate gene-environment interactions.
-
• Limited population diversity: The analysis was restricted to individuals of European ancestry. Observed genetic correlations and causal estimates may not extrapolate to other ancestral groups due to differences in allele frequencies, LD structure, and environmental exposures. Validation in ancestrally diverse cohorts is essential for broader generalisability.
Background
Autoimmune thyroid disease (AITD), which mainly comprises Graves’ disease (GD) and Hashimoto thyroiditis (HT), has become a common public health problem in most parts of the world. The aetiology of AITD is multifactorial, involving genetic and environmental factors (Vargas-Uricoechea, Reference Vargas-Uricoechea2023). In twin studies, a high concordance rate for GD in monozygotic twins was reported, in the range of 50% to 70%, compared with 3% to 25% in dizygotic twins. A study of autoimmune hypothyroidism likewise showed a 55% concordance in monozygotic twins. Familial clustering of AITD has been consistently reported (Frommer et al., Reference Frommer, Konig, Chatzidou, Chionos, Langericht and Kahaly2023). These pieces of evidence suggest the existence of a genetic predisposition to AITD (Boguslawska et al., Reference Boguslawska, Godlewska, Gajda and Piekielko-Witkowska2022; Vargas-Uricoechea, Reference Vargas-Uricoechea2023). And classical linkage and association studies have successfully identified several susceptible genes for AITD (Liu et al., Reference Liu, Miao, Liu, Lu, Feng and Zhang2023; Grixti et al., Reference Grixti, Lane and Pearce2024).
Depression, also known as major depressive disorder (MDD), is a clinically defined mood disorder that can cause persistent feelings of sadness and loss of interest. It affects an individual’s emotions, thoughts, and behaviour, and may lead to various emotional and physical problems. A population survey conducted in ten countries found significant differences in the prevalence of MDD among different racial groups, ranging from 3.0% in Japan to 16.9% in the United States (Kessler and Bromet, Reference Kessler and Bromet2013). As early as 1996, the World Health Organization pointed out that MDD would become the second leading cause of disability worldwide in the coming decades, thus encouraging further research into the causes of MDD. The social and economic costs associated with depression are increasing, while appropriate and early treatment can help reduce such costs. Similar to AITD, genetic factors play an important role in the onset of MDD (Kendall et al., Reference Kendall, Van Assche, Andlauer, Choi, Luykx, Schulte and Lu2021).
Comorbidity refers to the simultaneous presence of two or more chronic diseases in the same individual, that cannot be attributed to random chance (Harrison et al., Reference Harrison, Fortin, Van Den Akker, Mair, Calderon-Larranaga, Boland, Wallace, Jani and Smith2021). With population ageing and increasing prevalence of chronic illnesses, the diagnosis and treatment of comorbidity have become an increasingly serious global public health challenge. Compared to a single disease, comorbidity often significantly reduces patients’ quality of life, increases mortality rates, and raises economic expenditures. Understanding the mechanisms of comorbidity can aid in early diagnosis, treatment, and management of diseases, thereby helping to reduce overall disease costs. It is generally believed that comorbidity is the result of multiple factors, including genetics, environment, and lifestyle, working in combination (Johnston et al., Reference Johnston, Crilly, Black, Prescott and Mercer2019). The mechanisms underlying its occurrence are highly complex. While the importance of lifestyle and environmental factors cannot be ignored, mounting evidence suggests that genetic factors play a more pronounced role in the development of comorbidity (Postolache et al., Reference Postolache, Del Bosque-Plata, Jabbour, Vergare, Wu and Gragnoli2019; Dong et al., Reference Dong, Feng, Sun, Chen and Zhao2021).
There is ample epidemiological evidence to support the comorbidity between AITD and MDD (Bergink et al., Reference Bergink, Pop, Nielsen, Agerbo, Munk-Olsen and Liu2018; Bode et al., Reference Bode, Ivens, Bschor, Schwarzer, Henssler and Baethge2021; Soheili-Nezhad et al., Reference Soheili-Nezhad, Sprooten, Tendolkar and Medici2023). Abnormal thyroid function can significantly impact mental health, including emotional and cognitive functioning. Both hyperthyroidism and hypothyroidism can lead to mood disorders such as depression, while depression can also cause varying degrees of thyroid dysfunction (Juceviciute et al., Reference Juceviciute, Zilaitiene, Aniuliene and Vanagiene2019). Notably, depression is also found in hyperthyroidism, particularly in the early phase of GD, when compared to both the general population and patients with other chronic thyroid diseases (Johansson B et al., Reference Johansson, Holmberg, Skau, Malmgren and Filipsson Nystrom2023; Holmberg M et al., Reference Holmberg, Malmgren, Berglund, Johansson and Nystrom2024). The positivity rate of thyroid autoantibodies in the general population is approximately 5–10%, while it can reach up to 20% in patients with depression (Kotkowska and Strzelecki, Reference Kotkowska and Strzelecki2022). A meta-analysis of 22 independent studies comprising a total of 43,382 individuals found that AITD patients have a significant risk of MDD, with an OR value of 3.31 (95% CI 2.00–5.48) (Siegmann et al., Reference Siegmann, Muller, Luecke, Philipsen, Kornhuber and Gromer2018). A large epidemiological study conducted in Denmark showed that the incidence of various autoimmune diseases, including AITD, was significantly higher in patients with mental disorders (Andersson et al., Reference Andersson, Gustafsson, Okkels, Taha, Cole, Munk-Jorgensen and Goodwin2015).
While epidemiological studies indicate bidirectional associations between thyroid dysfunction and mood disorders, we hypothesise that genetic liability to MDD may causally increase the risk of AITD. This hypothesis is grounded in two observations: (1) depressive symptoms often precede thyroid autoimmunity in longitudinal studies (Andersson et al., Reference Andersson, Gustafsson, Okkels, Taha, Cole, Munk-Jorgensen and Goodwin2015), and (2) shared immune-neuroendocrine pathways (e.g. interleukin-6 (IL-6), Hypothalamic-Pituitary-Adrenal (HPA) axis dysregulation) may mediate this relationship. We aim to test this directional causality using genetic instruments robust to reverse causation. Large-scale case-control genome-wide association studies (GWASs) for AITD and MDD have identified hundreds of variants conferring risk for each disease, including some shared risk loci (Wray et al., Reference Wray, Ripke, Mattheisen, Trzaskowski, Byrne, Abdellaoui, Adams, Agerbo, Air, Andlauer, Bacanu, Baekvad-Hansen, Beekman, Bigdeli, Binder, Blackwood, Bryois, Buttenschon, Bybjerg-Grauholm, Cai, Castelao, Christensen, Clarke, Coleman, Colodro-Conde, Couvy-Duchesne, Craddock, Crawford, Crowley, Dashti, Davies, Deary, Degenhardt, Derks, Direk, Dolan, Dunn, Eley, Eriksson, Escott-Price, Kiadeh, Finucane, Forstner, Frank, Gaspar, Gill, Giusti-Rodriguez, Goes, Gordon, Grove, Hall, Hannon, Hansen, Hansen, Herms, Hickie, Hoffmann, Homuth, Horn, Hottenga, Hougaard, Hu, Hyde, Ising, Jansen, Jin, Jorgenson, Knowles, Kohane, Kraft, Kretzschmar, Krogh, Kutalik, Lane, Li, Li, Lind, Liu, Lu, Macintyre, Mackinnon, Maier, Maier, Marchini, Mbarek, Mcgrath, Mcguffin, Medland, Mehta, Middeldorp, Mihailov, Milaneschi, Milani, Mill, Mondimore, Montgomery, Mostafavi, Mullins, Nauck, Ng, Nivard, Nyholt, O’reilly, Oskarsson, Owen, Painter, Pedersen, Pedersen, Peterson, Pettersson, Peyrot, Pistis, Posthuma, Purcell, Quiroz, Qvist, Rice, Riley, Rivera, Saeed Mirza, Saxena, Schoevers, Schulte, Shen, Shi, Shyn, Sigurdsson, Sinnamon, Smit, Smith, Stefansson, Steinberg, Stockmeier, Streit, Strohmaier, Tansey, Teismann, Teumer, Thompson, Thomson, Thorgeirsson, Tian, Traylor, Treutlein, Trubetskoy, Uitterlinden, Umbricht, Van Der Auwera, Van Hemert, Viktorin, Visscher, Wang, Webb, Weinsheimer, Wellmann, Willemsen, Witt, Wu, Xi, Yang, Zhang, Eqtlgen, Arolt, Baune, Berger, Boomsma, Cichon, Dannlowski, De Geus, Depaulo, Domenici, Domschke, Esko, Grabe, Hamilton, Hayward, Heath, Hinds, Kendler, Kloiber, Lewis, Li, Lucae, Madden, Magnusson, Martin, Mcintosh, Metspalu, Mors, Mortensen, Levinson, Breen, Borglum and Sullivan2018, Howard DM et al., Reference Howard, Adams, Clarke, Hafferty, Gibson, Shirali, Coleman, Hagenaars, Ward, Wigmore, Alloza, Shen, Barbu, Xu, Whalley, Marioni, Porteous, Davies, Deary, Hemani, Berger, Teismann, Rawal, Arolt, Baune, Dannlowski, Domschke, Tian, Hinds, Andme Research, Trzaskowski, Byrne, Ripke, Smith, Sullivan, Wray, Breen, Lewis and McIntosh2019, Saevarsdottir et al., Reference Saevarsdottir, Olafsdottir, Ivarsdottir, Halldorsson, Gunnarsdottir, Sigurdsson, Johannesson, Sigurdsson, Juliusdottir, Lund, Arnthorsson, Styrmisdottir, Gudmundsson, Grondal, Steinsson, Alfredsson, Askling, Benediktsson, Bjarnason, Geirsson, Gudbjornsson, Gudjonsson, Hjaltason, Hreidarsson, Klareskog, Kockum, Kristjansdottir, Love, Ludviksson, Olsson, Onundarson, Orvar, Padyukov, Sigurgeirsson, Tragante, Bjarnadottir, Rafnar, Masson, Sulem, Gudbjartsson, Melsted, Thorleifsson, Norddahl, Thorsteinsdottir, Jonsdottir and Stefansson2020). These findings suggest that AITD may have partially shared genetic risk with MDD, but while genetic correlation indicates shared biological pathways, it does not intrinsically demonstrate causation. The magnitude of the genetic overlap remains unclear, as does the critical question of whether any genetic overlap reflects pleiotropic effects or causal relationships requiring specific analytical approaches to disentangle. Specifically, we hypothesise that the observed genetic overlap may reflect a unidirectional causal relationship, where MDD predisposes individuals to AITD development through shared biological pathways. Addressing these questions could help to gain a deeper understanding of the biological mechanisms underlying the comorbidity of AITD and MDD. A further investigation of this association has importance for public health, physicians, and patients. In this study, we employed large-scale GWAS summary data and novel genetic statistical methods to assess the genetic correlation and potential causality between AITD and MDD disorders. We performed cross-trait GWAS meta-analyses to identify genetic risk variants not previously associated with the individual traits. We integrated GWAS summary data with tissue types specific gene expression data to determine if SNP heritability for AITD is enriched in the same as opposed to distinct tissues types, and we conducted summary-data-based Mendelian randomisation (MR) to identify putative functional genes shared between diseases.
Methods and materials
GWAS datasets
The AITD GWAS summary data was obtained from Saevarsdottir, S study, which containing 30,234 cases and 725,172 controls from Iceland and the UK Biobank (Saevarsdottir et al., Reference Saevarsdottir, Olafsdottir, Ivarsdottir, Halldorsson, Gunnarsdottir, Sigurdsson, Johannesson, Sigurdsson, Juliusdottir, Lund, Arnthorsson, Styrmisdottir, Gudmundsson, Grondal, Steinsson, Alfredsson, Askling, Benediktsson, Bjarnason, Geirsson, Gudbjornsson, Gudjonsson, Hjaltason, Hreidarsson, Klareskog, Kockum, Kristjansdottir, Love, Ludviksson, Olsson, Onundarson, Orvar, Padyukov, Sigurgeirsson, Tragante, Bjarnadottir, Rafnar, Masson, Sulem, Gudbjartsson, Melsted, Thorleifsson, Norddahl, Thorsteinsdottir, Jonsdottir and Stefansson2020). The authors identified a low-frequency (1.36%) intronic variant in FLT3 (rs76428106-C) with the largest effect on risk of AITD (odds ratio (OR) = 1.46, P = 2.37 × 10⁻²⁴).
We chose two independent MDD GWAS datasets for our analysis. The Wray, N.R study (hereinafter we called MDD1), which enrolled 29 samples of European ancestry (135,458 MDD subjects and 344,901 controls) (Wray et al., Reference Wray, Ripke, Mattheisen, Trzaskowski, Byrne, Abdellaoui, Adams, Agerbo, Air, Andlauer, Bacanu, Baekvad-Hansen, Beekman, Bigdeli, Binder, Blackwood, Bryois, Buttenschon, Bybjerg-Grauholm, Cai, Castelao, Christensen, Clarke, Coleman, Colodro-Conde, Couvy-Duchesne, Craddock, Crawford, Crowley, Dashti, Davies, Deary, Degenhardt, Derks, Direk, Dolan, Dunn, Eley, Eriksson, Escott-Price, Kiadeh, Finucane, Forstner, Frank, Gaspar, Gill, Giusti-Rodriguez, Goes, Gordon, Grove, Hall, Hannon, Hansen, Hansen, Herms, Hickie, Hoffmann, Homuth, Horn, Hottenga, Hougaard, Hu, Hyde, Ising, Jansen, Jin, Jorgenson, Knowles, Kohane, Kraft, Kretzschmar, Krogh, Kutalik, Lane, Li, Li, Lind, Liu, Lu, Macintyre, Mackinnon, Maier, Maier, Marchini, Mbarek, Mcgrath, Mcguffin, Medland, Mehta, Middeldorp, Mihailov, Milaneschi, Milani, Mill, Mondimore, Montgomery, Mostafavi, Mullins, Nauck, Ng, Nivard, Nyholt, O’reilly, Oskarsson, Owen, Painter, Pedersen, Pedersen, Peterson, Pettersson, Peyrot, Pistis, Posthuma, Purcell, Quiroz, Qvist, Rice, Riley, Rivera, Saeed Mirza, Saxena, Schoevers, Schulte, Shen, Shi, Shyn, Sigurdsson, Sinnamon, Smit, Smith, Stefansson, Steinberg, Stockmeier, Streit, Strohmaier, Tansey, Teismann, Teumer, Thompson, Thomson, Thorgeirsson, Tian, Traylor, Treutlein, Trubetskoy, Uitterlinden, Umbricht, Van Der Auwera, Van Hemert, Viktorin, Visscher, Wang, Webb, Weinsheimer, Wellmann, Willemsen, Witt, Wu, Xi, Yang, Zhang, Eqtlgen, Arolt, Baune, Berger, Boomsma, Cichon, Dannlowski, De Geus, Depaulo, Domenici, Domschke, Esko, Grabe, Hamilton, Hayward, Heath, Hinds, Kendler, Kloiber, Lewis, Li, Lucae, Madden, Magnusson, Martin, Mcintosh, Metspalu, Mors, Mortensen, Levinson, Breen, Borglum and Sullivan2018). In this study, the authors identified 44 independent and significant loci for MDD. Another MDD GWAS from Howard, D.M study (hereinafter we called MDD2), which containing 246,363 MDD subjects and 561,190 controls (Howard DM et al., Reference Howard, Adams, Clarke, Hafferty, Gibson, Shirali, Coleman, Hagenaars, Ward, Wigmore, Alloza, Shen, Barbu, Xu, Whalley, Marioni, Porteous, Davies, Deary, Hemani, Berger, Teismann, Rawal, Arolt, Baune, Dannlowski, Domschke, Tian, Hinds, Andme Research, Trzaskowski, Byrne, Ripke, Smith, Sullivan, Wray, Breen, Lewis and McIntosh2019). In this study, the authors identified 102 independent susceptible loci for MDD.
The AITD GWAS summary data primarily included individuals of European ancestry from Iceland and the UK Biobank. Similarly, both MDD1 and MDD2 datasets were derived from European-ancestry cohorts. While Icelanders present a genetically homogeneous subset of European population, the UK Biobank and other cohorts encompass broader European genetic diversity. To minimise population stratification, all analyses used LD scores and reference panels from 1000 Genomes European subset (hg19). However, we acknowledge that subtle differences in genetic architecture (e.g. allele frequency, LD patterns) between Icelandic and other European populations may exist.
We conducted post-hoc power calculations to assess the reliability of our sample size for detecting genetic correlation. Using the GCTA-GREML power calculator (Visscher et al., Reference Visscher, Hemani, Vinkhuyzen, Chen, Lee, Wray, Goddard and Yang2014), with the observed SNP heritability (h2 = 18.4%for AITD, 3.1–4.4 for MDD) and sample sizes (AITD: 755,406; MDD1: 480,359; MDD2 807,553), the statistical power to detect a genetic correlation (r g) of 0.1 at α=0.05 exceeded 99% for all trait pairs (Visscher et al., Reference Visscher, Wray, Zhang, Sklar, Mccarthy, Brown and Yang2017). This suggests our datasets were adequately powered to identify the observed correlations (rg = 0.07–0.14).
Genomic locations were based on NCBI build 37/UCSC hg 19 data. After standard genotyping and quality control procedures, SNPs were imputed using the full 1000 Genomes Project European ancestry reference panel. Then, SNPs with minor allele frequency (MAF) < 0.01, poor imputation quality < 0.30 and not in Hardy–Weinberg equilibrium were excluded for further analysis. The contributing studies have obtained ethical approval from their respective institutional review boards. As this study is secondary research that utilises publicly available data, no additional ethical approval or informed consent is necessary.
Linkage disequilibrium scoreRegression
To estimate the heritability of each trait and the genetic correlation between the traits (AITD and MDD), we employed various methods based on linkage disequilibrium score regression (LDSC). LDSC is a widely-used tool for assessing the contribution of genomic regions to the heritability of complex traits, as well as quantifying the genetic correlation between different traits (BK Bulik-Sullivan et al., Reference Bulik-Sullivan, Finucane, Anttila, Gusev, Day, Loh, Reprogen, Duncan, Perry, Patterson, Robinson, Daly, Price and Neale2015a, BK Bulik-Sullivan et al., Reference Bulik-Sullivan, Loh, Finucane, Ripke, Yang, Patterson, Daly, Price and Neale2015b).
The LDSC method employs regression analysis and LD scores to assess the contribution of each SNP to the overall heritability estimate (BK Bulik-Sullivan et al., Reference Bulik-Sullivan, Loh, Finucane, Ripke, Yang, Patterson, Daly, Price and Neale2015b). It analyzes LD patterns across the genome to determine the proportion of phenotypic variance explained by common genetic variants for a specific trait. LDSC can also calculate the genetic correlation between two traits, revealing the extent to which shared genetic variants influence both traits. By using LDSC, we can gain valuable insights into individual trait heritability and investigate the genetic relationship between traits. The method considers both causal SNP effects and the effects of confounding SNPs influenced by LD with other SNPs in the genome. It estimates the contribution of each SNP to the confounding effect by utilising information on the LD structure of the genome. The heritability estimate obtained through LDSC represents the proportion of phenotypic variation attributed to genetic factors, considering the cumulative effects of all SNPs. By performing bivariate analysis with LD scores as weights, LDSC estimates the covariance between SNP effects on the two traits and calculates the genetic correlation as the ratio of covariance to the product of the square roots of the heritability estimates for each trait (BK Bulik-Sullivan et al., Reference Bulik-Sullivan, Finucane, Anttila, Gusev, Day, Loh, Reprogen, Duncan, Perry, Patterson, Robinson, Daly, Price and Neale2015a). This provides insights into the shared genetic architecture influencing both traits.
In summary, the LDSC method provides a powerful tool for estimating the heritability of complex traits and the genetic correlation between traits, taking into account the confounding effects due to LD between the causal SNPs and other SNPs in the genome. In our study, the LDSC method was used to perform both univariate SNP heritability estimation for each trait and bivariate correlation analysis to determine the correlation between the two traits. The LDSC method was implemented using the 1000 Genomes European reference data, based on the hg19 genome build.
Estimation of local genetic correlations using ρ-HESS
While LDSC is a valuable tool for estimating overall genetic correlations between traits, it may not capture the local genetic correlations between different genomic regions. To overcome this limitation, we can utilise a complementary method called ρ-HESS (Heritability Estimation from Summary Statistics)(Shi et al., Reference Shi, Mancuso, Spendlove and Pasaniuc2017).
The ρ-HESS method is used to estimate the local genetic covariance between genomic regions, providing a comprehensive understanding of the genetic relationship between traits. It utilises a hierarchical Bayesian model and GWAS summary statistics to estimate local SNP heritability and local cross-trait genetic covariance. This method calculates the correlation between traits attributed to shared genetic variance within a specific genomic region. By incorporating ρ-HESS into our analysis, we can gain detailed insights into the genetic architecture of traits and identify genomic regions that contribute to their shared or distinct heritability. This method allows us to evaluate the local genetic correlations between traits at a more granular level, focusing on specific SNPs within genomic regions.
In our study, we analysed a total of 1699 regions, each approximately LD independent with an average size of nearly 1.5 Mb. The ρ-HESS analysis was performed using the 1000 Genomes European reference data, based on the hg19 genome build. The local SNP heritability for each trait and the genetic covariance between the traits were estimated, and local genetic correlations were then calculated based on these estimates.
Tissues types specific enrichment of AITD and MDD
The identification of trait-specific tissue types is crucial for enhancing our understanding of disease aetiology and the underlying genetic basis. In this study, we chose stratified LD score regression (s-LDSC) to identify the tissues type specific pattern for AITD and MDD (Finucane HK et al., Reference Finucane, Bulik-Sullivan, Gusev, Trynka, Reshef, Loh, Anttila, Xu, Zang, Farh, Ripke, Day, Reprogen, Consortium, Purcell, Stahl, Lindstrom, Perry, Okada, Raychaudhuri, Daly, Patterson, Neale and Price2015, Finucane HK et al., Reference Finucane, Reshef, Anttila, Slowikowski, Gusev, Byrnes, Gazal, Loh, Lareau, Shoresh, Genovese, Saunders, Macosko, Pollack, Brainstorm, Perry, Buenrostro, Bernstein, Raychaudhuri, Mccarroll, Neale and Price2018).
In order to validation the enrichment results to identify new enrichments for AITD and MDD, two kinds of annotation, gene expression-based data and chromatin-based data, were used for our cell type group analysis. Briefly, the first dataset used two gene expression datasets – one from the Genotype–Tissue Expression (GTEx) project and another that we call the ‘Franke lab’ dataset. Then we classified the 205 tissues or cell types gene expression data in these datasets into 8major categories for visualisation. And in the chromatin-based analysis, 489 tissue-specific chromatin-based annotations from six epigenetic marks (DNase I hypersensitivity (DHS) and five activating histone marks (H3K27ac, H3K4me3, H3K4me1, H3K9ac and H3K36me3) were also grouped into 8 categories.
To assess the significance of each SNP heritability enrichment estimate, we utilised the p-value of the regression coefficient Z-score, which was adjusted for the baseline model and all genes in the analysis. In the case of pairwise traits and a specific set of tissue types, the enrichment correlation was determined by calculating the correlation between the regression coefficients associated with each tissue type. To account for multiple testing, we applied the Benjamini-Hochberg false discovery rate (FDR) calculation, considering tissues type independently across the two diseases.
Multi-trait analysis of GWAS
We aimed to identify the genetic risk loci associated with the joint phenotypes of AITD and MDD. To achieve this, we performed a cross-trait meta-analysis of GWAS using the Multi-Trait Analysis of GWAS (MTAG) approach (P Turley et al., Reference Turley, Walters, Maghzian, Okbay, Lee, Fontana, Nguyen-Viet, Wedow, Zacher, Furlotte, Andme Research, Magnusson, Oskarsson, Johannesson, Visscher, Laibson, Cesarini, Neale and Benjamin2018). The MTAG method was chosen as the analysis approach because it can account for potential sample overlap between GWAS. This approach provides a more comprehensive analysis compared to standard inverse-variance weighted meta-analyses, which rely solely on trait-specific effect sizes. In our analysis, we used the MTAG options that assume equal heritability for each SNP across the two traits and a perfect genetic covariance between them.
To assess the assumption that shared SNP effect sizes across two traits have equal variances and covariances, we calculated the upper bound for the FDR, known as ‘maxFDR’. We defined independent genome-wide significant SNPs, referred to as ‘lead SNPs’, using a linkage disequilibrium (LD) clumping method with a threshold of r2 < 0.01 within 5,000-kb windows. This was based on the UK Biobank European reference, which had been imputed by the Haplotype Reference Consortium (HRC). The LD clumping step allowed us to identify a set of non-redundant, independent SNPs that were genome-wide significant in the cross-trait meta-analysis. In our analysis, we prioritised the independent SNPs that showed genome-wide significance in the cross-trait meta-analysis (i.e. AITD-MDD), but were not previously identified as significant in the individual single-trait GWAS. These SNPs are of particular interest as they may be shared risk factors for both AITD and MDD.
While MTAG enhances power by leveraging genetic correlations, its cor assumptions require careful considerations: (1) Equal SNP heritability across traits: Our observed SNP heritability differed substantially between AITD (h2 = 18.8%) and MDD (h2 = 3.1–4.0%). Simulations suggest such disparities may inflated standard errors but minimally bias effect estimates when genetic correlations are moderated (rg < 0.5). (2) Perfect genetic covariance: We calculated the empirical genetic covariance (row = 0.82–0.89) using bivariate LDSC, which approximates but does not fully meet the MTAG assumption of row = 1. Sensitivity analyses relaxing this assumption showed consistent lead SNP identification.
Mendelian randomisation analyses
The MR approach is a robust method that utilises genetic variants as instrumental variables (IVs) to evaluate the causal relationship between potential exposure and certain disease (Lawlor et al., Reference Lawlor, Harbord, Sterne, Timpson and Davey Smith2008). MR analysis relies on three core assumptions: (1) IVs strongly associate with exposure, (2) IVs are independent of confounders, and (3) IVs affect outcome solely through the exposure pathway, with no horizontal pleiotropy. The genetic variants, usually in the forms of SNPs, are randomly assigned during gamete formation and are less likely to be affected by confounding factors. Consequently, MR studies employing this approach are similar to randomised controlled trials, and are able to produce stable and persuasive causal effects between exposures and outcomes (Zheng et al., Reference Zheng, Baird, Borges, Bowden, Hemani, Haycock, Evans and Smith2017; Zoccali, Reference Zoccali2017). Our MR analysis and sensitivity analysis were performed using R platform with the assistance of the TwoSampleMR package(Hemani et al., Reference Hemani, Zheng, Elsworth, Wade, Haberland, Baird, Laurin, Burgess, Bowden, Langdon, Tan, Yarmolinsky, Shihab, Timpson, Evans, Relton, Martin, Davey Smith, Gaunt and Haycock2018). To ensure robustness of our findings, we utilised multiple MR methods (MR-Egger, weighted median, inverse variance weighting (IVW), simple mode and weighted mode) with different assumptions regarding the extent and nature of horizontal pleiotropy. Horizontal pleiotropy refers to variants that have effects on both outcome and exposure through a pathway other than a causal effect.
While we selected instruments (112 SNPs) with genome-wide significance (p < 5 × 10⁻8) and clumped for independence (r2 < 0.01), residual pleiotropy or LD with confounding variants could violate these assumptions. Various sensitivity analyses were conducted to detect and correct for pleiotropic effects (Burgess et al., Reference Burgess, Bowden, Fall, Ingelsson and Thompson2017). These analyses primarily involved investigating horizontal pleiotropy and performing leave-one-out analysis. By examining the impact of these factors, we aimed to ensure the reliability and validity of our findings. To evaluate potential directional pleiotropy of genetic variants, we conducted MR-Egger regression. The slope of the MR-Egger regression provides causal estimates that are corrected for pleiotropy, while the magnitude of the intercept can indicate the extent of pleiotropy. If the intercept deviates significantly from zero, it suggests the presence of directional pleiotropy. Furthermore, we utilised the MR-PRESSO method to identify and correct for horizontal pleiotropic outliers. This method involves regressing the IV-outcome and IV-exposure associations to perform a global test of heterogeneity. Subsequently, it compares the observed distance of each SNP from the regression with the expected distance under the null hypothesis of no pleiotropy. By doing so, we were able to detect and address potential sources of horizontal pleiotropy in our analysis. Finally, we conducted a leave-one-out analysis to determine if any single SNP had a significant horizontal pleiotropic effect that could bias the MR estimate. This analysis involved sequentially excluding one SNP at a time and re-estimating the effect. If the removal of a particular SNP resulted in a substantial change in the estimate, it suggests that the SNP may have a horizontal pleiotropic effect. By performing this analysis, we were able to identify and address potential sources of bias in our MR results. While we implemented multiple sensitivity analyses to evaluated these assumptions, complete validation remains methodologically unattainable (Burgess et al., Reference Burgess, Bowden, Fall, Ingelsson and Thompson2017).
Summary-data-based mendelian randomisation
In order to study whether there are common risk genes underlie AITD and MDD, we used SMR (summary-data-based MR) to identify putative functional genes underlying statistical associations for AITD and MDD GWAS loci, as well as additional loci identified in cross-trait meta-analyses of AITD-MDD.
SMR is a method that conducts a MR-equivalent analysis using summary statistics from GWASs and expression quantitative trait loci (eQTL) studies (Zhu et al., Reference Zhu, Zhang, Hu, Bakshi, Robinson, Powell, Montgomery, Goddard, Wray, Visscher and Yang2016). It aims to determine whether there is an association between gene expression (considered as the exposure) and a specific phenotype or outcome, using genome-wide significant single nucleotide polymorphisms (SNPs) as IVs. A significant SMR association could be attributed to three potential explanations: causal effect, pleiotropy, or linkage. In the case of a causal effect, it suggests that the genetic variant influences disease risk by modulating gene expression levels. Pleiotropy refers to the scenario where the causal variant has effects on both gene expression and disease risk independently. Linkage indicates that distinct causal variants exist for both gene expression and the disease under investigation. To differentiate between causality/pleiotropy and linkage, SMR incorporates the HEIDI-outlier test. This test helps identify and exclude potential outliers resulting from genetic variants being in LD with the causal variant. However, it is important to note that currently available methods cannot definitively distinguish between causality and pleiotropy.
In our analysis, the eQTLGen summary dataset, a meta-analysis of 14,115 samples of whole blood,was chosen for SMR analysis. We utilised UK Biobank European reference to evaluate LD pattern, and only focused on expression probes with eQTL p ≤ 5 × 10⁻⁸. For MTAG-based cross-trait phenotypes (e.g. AITD-MDD), SMR analyses were restricted to genetic variants of particular interest that defined above. SMR associations due to causality or pleiotropy were declared significant if they surpassed Bonferroni correction for the total number of eQTLs analysed (N = 19,250, p < 2.60 × 10 − 6) and also passed the HEIDI-outlier test (p > 0.05, minimum > 10 SNPs).
Results
Genetic correlations between AITD and MDD
We first applied linkage disequilibrium score regression (LDSC) to estimate the liability scale SNP heritability for AITD and MDD. Consistent with the literature, the liability scale SNP heritability (without constrained intercept) was 18.80% (SE 0.0158) for AITD,3.10% (SE 0.0019) for MDD1, and 4.04% (SE 0.0016) for MDD2,respectively.
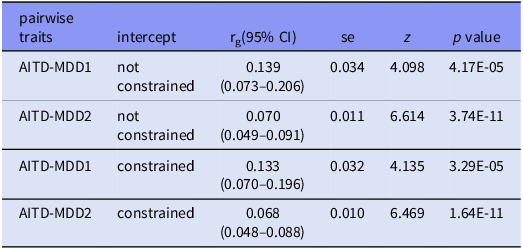
We then used bivariate LDSC to estimate genetic correlations between pairwise traits. The genetic correlation rg(without constrained intercept) between AITD and MDD1 was 0.1394,(p = 4.17x10⁻⁵)(Table 1). The intercept of genetic covariance between AITD and MDD1 was estimated at around 0.0023, which is less than one standard error away from zero (SE 0.0064), indicating no sample overlap between AITD and MDD1. And the rg (without constrained intercept) between AITD and MDD2 was 0.0701 (p = 3.74x10⁻¹¹)(Table 1). These estimates displayed slightly reduced strength when the LDSC intercept was constrained under the assumption of no population stratification. However, they remained statistically significant even after applying the Bonferroni correction.
Summary of pairwise genetic correlation estimated using LDSC without and with constrained intercept

rg, genetic correlation; se, standard error; CI, confidence intervals. 95% CIs were derived as rg±1.96×SE.
The narrow confidence intervals for genetic correlations and (e.g. AITD-MDD1 rg 95%CI: 0.073 – 0.206) and high statistical power (> 99%) suggest robust detection of shared genetic architecture. However, the lower bound of the CI for AITD-MDD2 (0.049) approaches the minimal detectable effect (rg = 0.05) under our study design, indicating that weaker correlations might require larger samples (BK Bulik-Sullivan et al., Reference Bulik-Sullivan, Finucane, Anttila, Gusev, Day, Loh, Reprogen, Duncan, Perry, Patterson, Robinson, Daly, Price and Neale2015a).
Partitioned SNP heritability enrichment for AITD and MDD
In order to study whether the SNP heritability or AITD and MDD was enriched to the similar tissue type, we applied stratified LDSC (s-LDSC) to assess partitioned SNP heritability enrichment for AITD and MDD through multiple gene expression and chromatin-based annotation datasets.
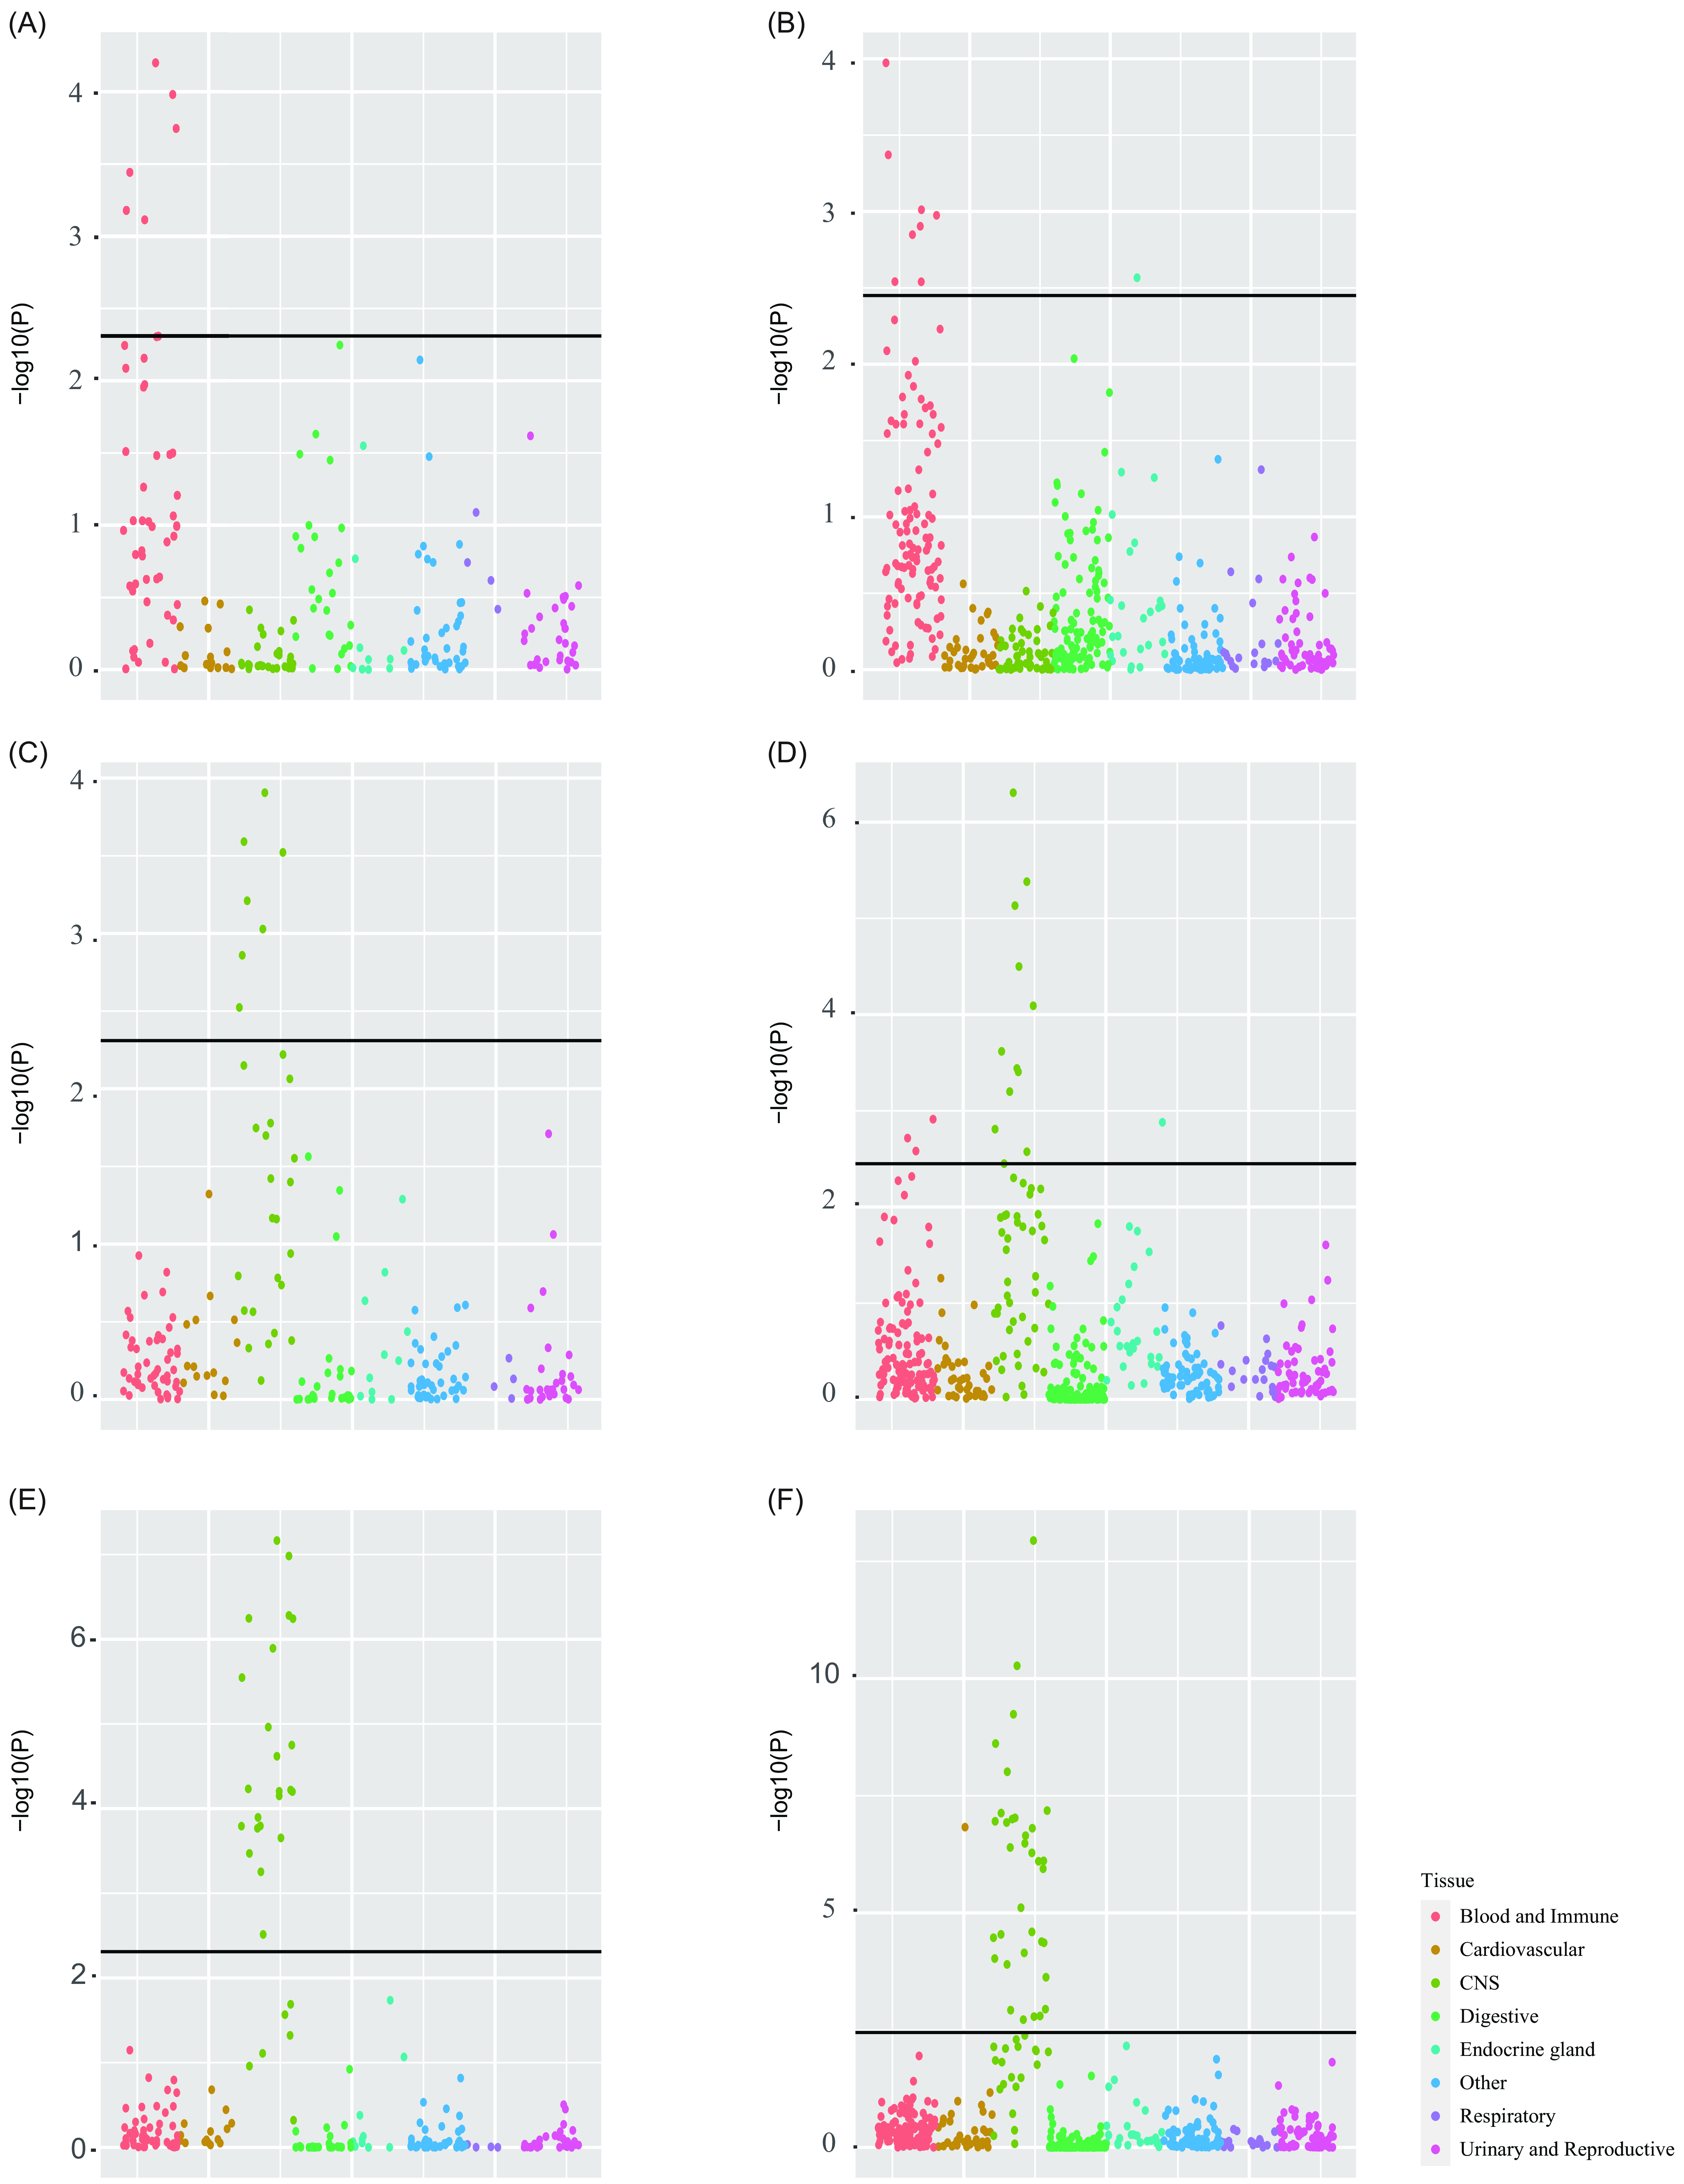
In the multiple gene expression annotation dataset, we identified Bonferroni- corrected significant SNP heritability enrichment for AITD in the blood or immune category, after adjusting for the baseline model and the set of all genes. While the SNP heritability for MDD1 was dominantly enriched in the CNS category. Similar enrichment results were also observed in the chromatin-based analysis for AITD and MDD1 (Fig 1, supplementary table 1). Furthermore,the SNP heritability enrichment for MDD2 was also identified in the CNS category in both multiple gene expression and chromatin-based datasets. These enrichment results might suggest that, the genetic correlation between AITD and MDD is not primarily driven by any specific tissue.
The tissue type LDSC analysis of AITD and MDD. (A) Multiple gene expression tissue type LDSC for AITD. (B) Chromatin-based tissue type LDSC for AITD. (C) Multiple gene expression tissue type LDSC for MDD1. (D) Chromatin-based tissue type LDSC for MDD1. (E) Multiple gene expression tissue type LDSC for MDD2. (F) Chromatin-based tissue type LDSC for MDD2. X-axis: eight major tissue categories (e.g. blood and immune, cardiovascular, central nerve system, digestive, endocrine gland, other, respiratory and urinary and reproductive). Y-axis: –log10(p) for heritability enrichment. Horizontal solid line: FDR < 5% threshold. Each circle represents a tissue type estimated through either the multiple gene expression or chromatin-based annotation dataset. The circles above the cutoff line means FDR < 5% at –log10 (p) =2.31(multiple gene expression) and 2.45 (chromatin-based).

Local genetic correlation estimation via ρ-HESS
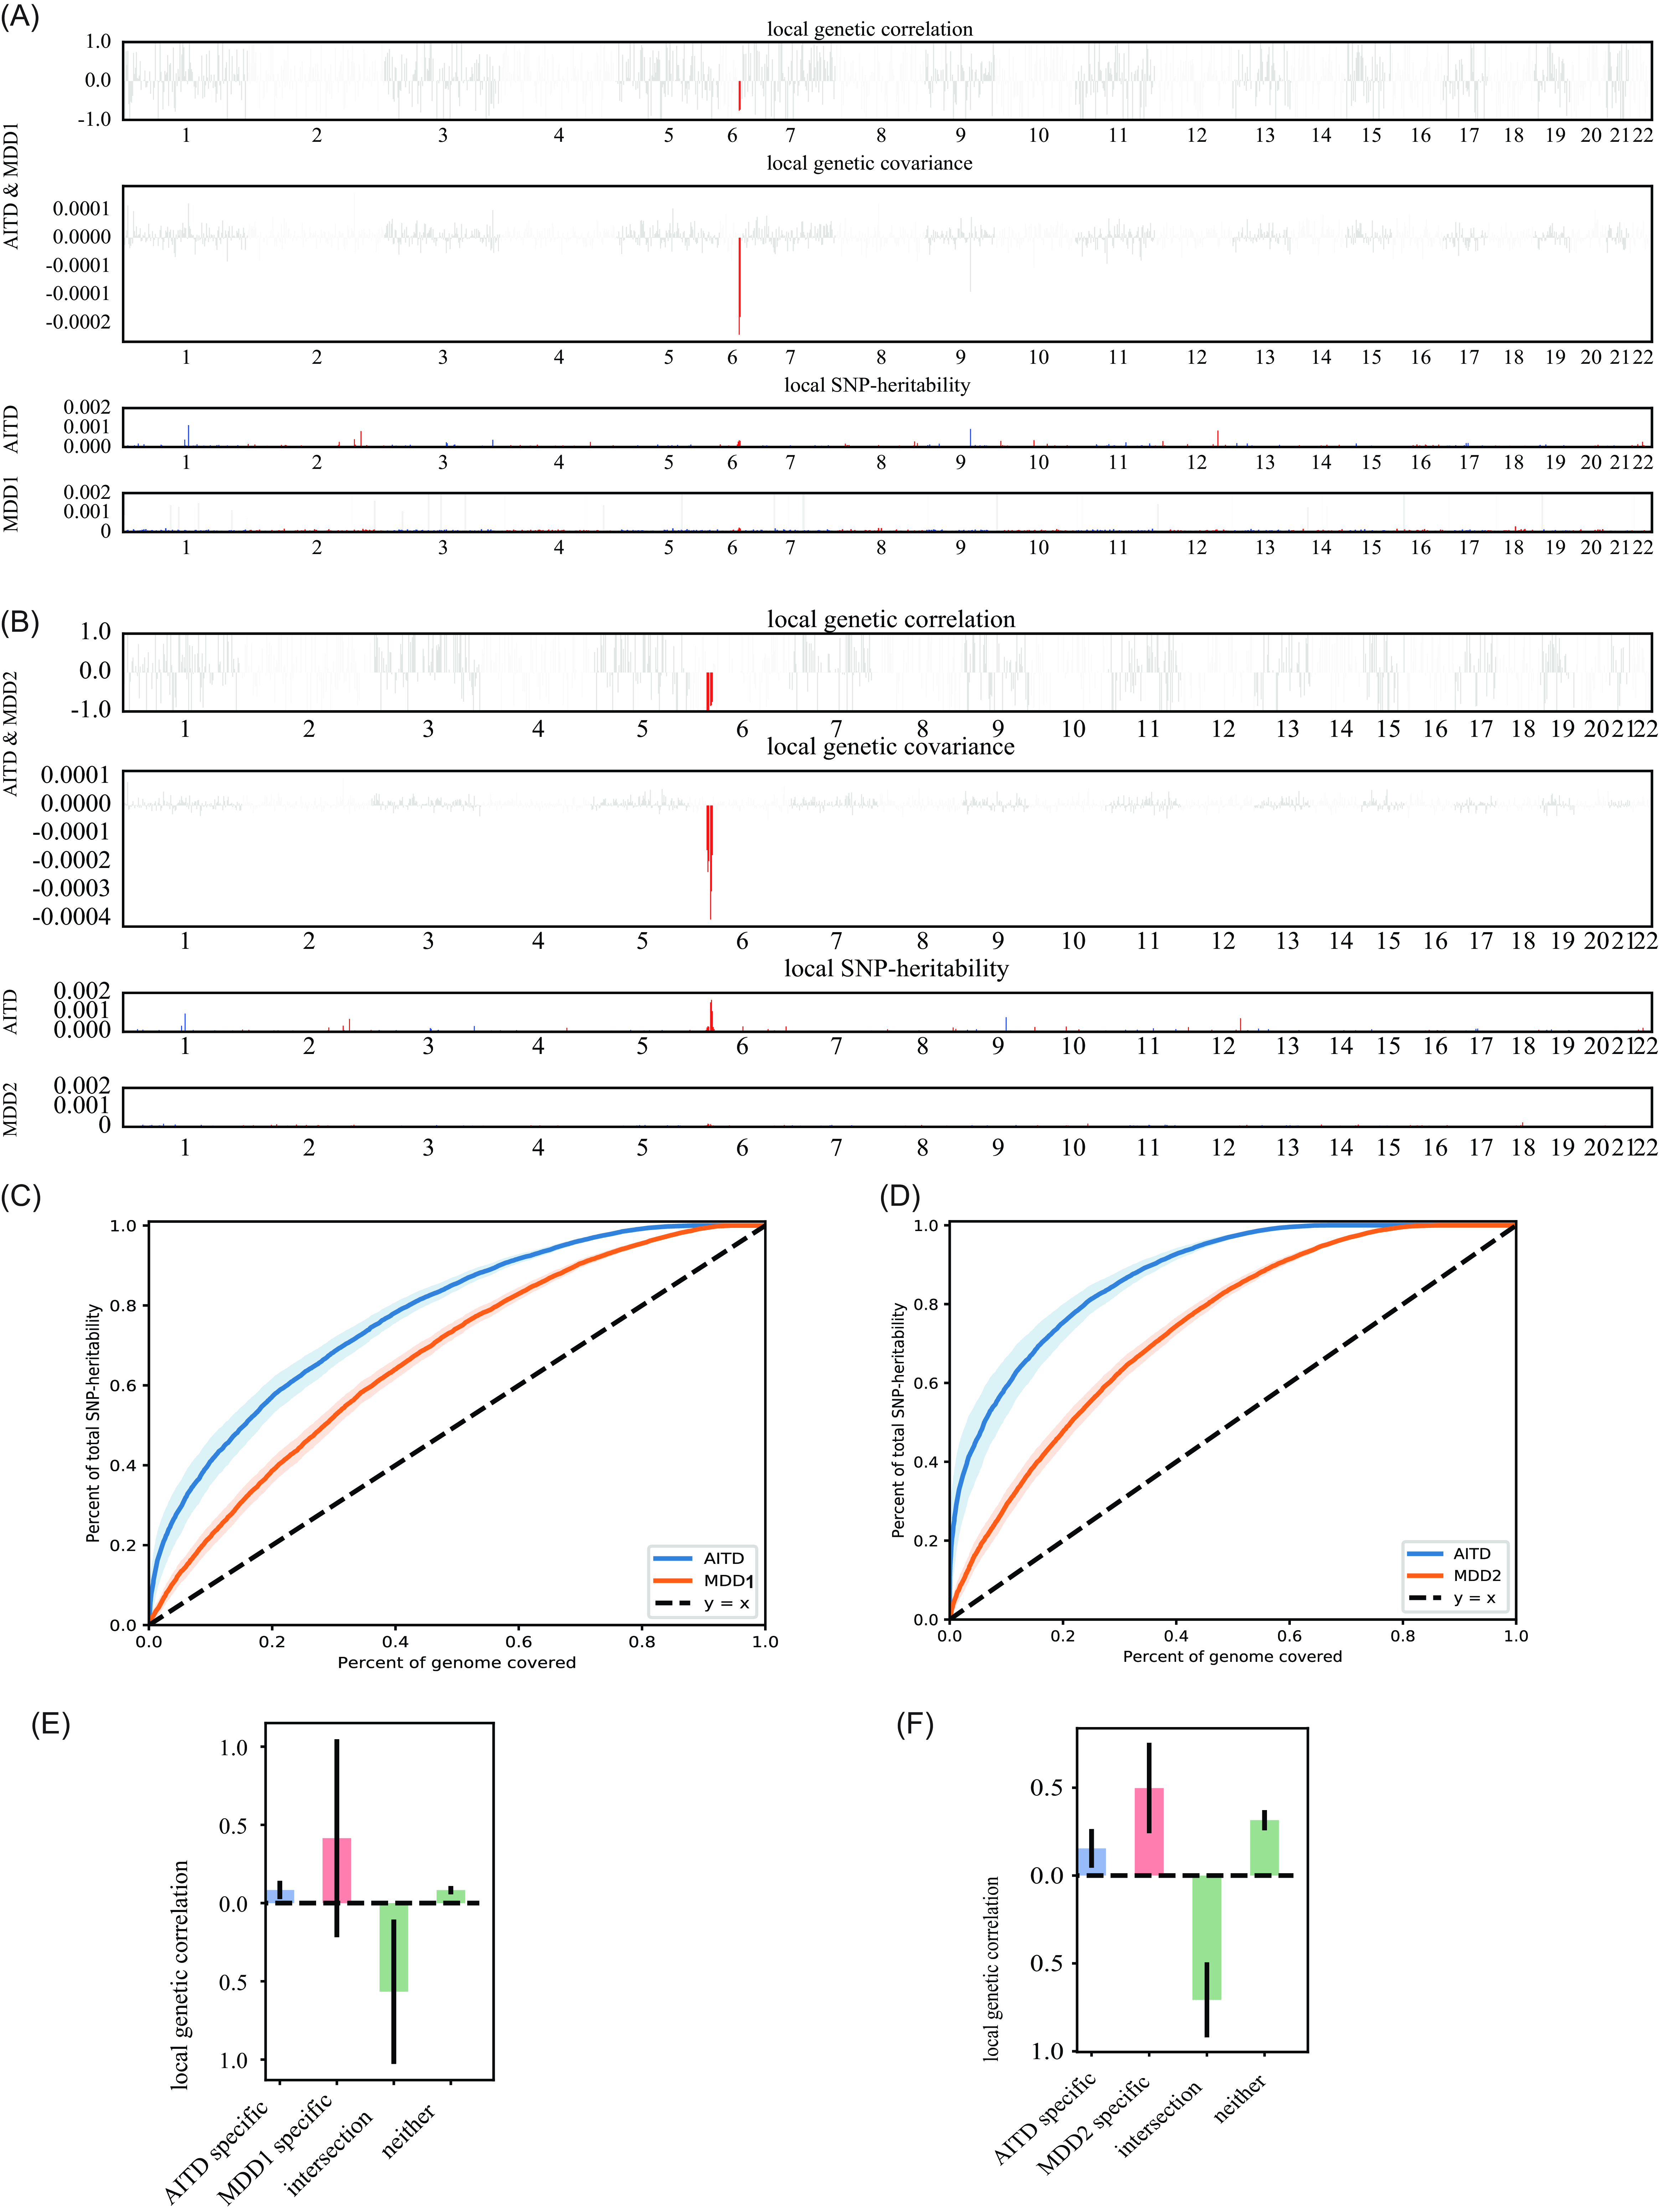
We then applied the Heritability Estimation from Summary Statistics method (ρ-HESS) to study the local genetic correlations across the genome between AITD and MDD. As expected,the local genetic correlations in disease-specific loci (AITD-specific and MDD-specific loci) were largely consistent with the genome-wide rg estimates from bivariate LDSC. The local heritability, local genetic correlation, contrasting degrees of polygenicity and putative causality between AITD and MDD traits was showed in Fig. 2.
The ρ-HESS visualisation plots for AITD and MDD local genetic correlation. A, B. The local heritability of AITD and MDD as well as their genetic covariances and genetic correlations from approximately LD-independent genomic regions estimated by ρ-HESS. X-axis: chromosome numbers (1–22); Y-axis: local genetic correlation (local rg), local genetic covariance and local SNP heritability. For the plots of ‘local genetic correlation’ and ‘local genetic covariance’, the blue or red bars represent the genomic regions on odds or even chromosome showing nominal significant (p-value < 0.05) local genetic correlation/covariance between AITD and MDD. For plots of ‘local SNP-heritability’, the blue or red bars represent the genomic regions on odds or even chromosome. A. AITD and MDD1; B. AITD and MDD2. C, D. The contrast polygenicity plot between AITD and MDD. The X-axis represents the percent of genome covered, while the Y-axis represents percent of total SNP heritability for AITD and MDD. C. AITD and MDD1; D. AITD and MDD2. E, F. The average local genetic correlation between AITD and MDD in four regional types (i.e. ‘AITD-specific’, ‘MDD-specific’, ‘intersection’ and ‘neither’) harbouring risk SNPs with GWAS P-value < 5 × 10⁻⁸. X-axis: four region types (AITD-specific, MDD-specific, intersection, neither); Y-axis: average local genetic correlation. Error bars represent the 95% confidence intervals (CIs) of the estimates. E. AITD and MDD1; F. AITD and MDD2.. LD, linkage disequilibrium; ρ-HESS, heritability estimation from summary statistics; SNP, single nucleotide polymorphism; GWAS, genome-wide association study. *The average local r g were not calculated for regional types occupying<10 regions.

Accounting for multiple testing, there was genome-wide significant local genetic correlation between AITD and MDD1 at two regions (Fig. 2(A), 2(B), supplementary table 2). One locus of 26,791,233–28,017,819 in chromosome 6 showed the most significant local genetic correlation for AITD and MDD (p = 1.09x10⁻⁸). While another adjacent locus of chr 6: 28,017,819–28,917,608also reached significant correlation(p = 9.21x10⁻⁸). The loci 25,684,587–26,791,233 in the same chromosome showed borderline significance (p = 3.16x−5), however, this significance did not survive the Bonferroni correction (Table 2). While for AITD and MDD2, six genomic loci in chromosome 6 showed Bonferroni corrected significant local genetic correlation, which containing the above two regions identified in AITD and MDD1 (Table 2). These results highlighted the local chromosomal 6 regions might confer putative genetic architecture for AITD and MDD genetic correlations.
Local genetic correlation between AITD and MDD through ρ-HESS method
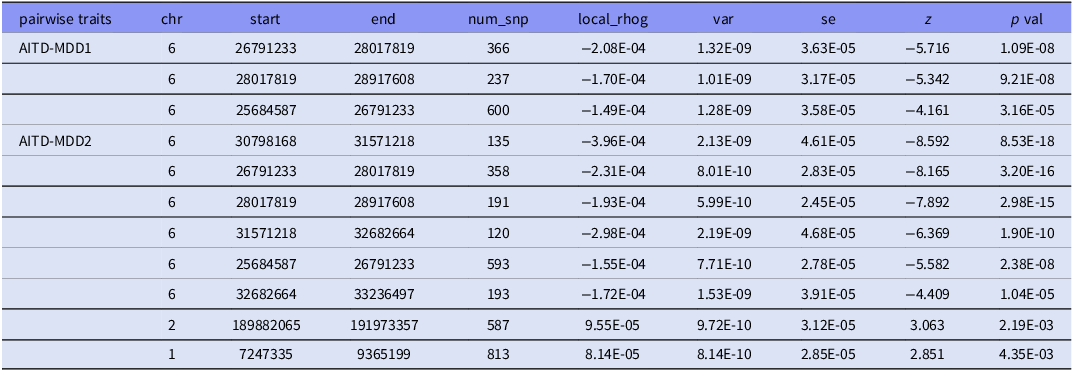
chr, chromosome; num_snp, number of SNPs in the locus; rhog, local genetic covariance estimates; var, variance estimates; se, standard error. * represent the p values passed the Bonferroni correction cut off 0.05/1699 = 2.94E-05.
Overall, the local genetic correlation is highly consistent with the putative causal relationships inferred by correlating the top signals at these trait-specific loci (Shi et al., Reference Shi, Mancuso, Spendlove and Pasaniuc2017). Therefore, we inferred the putative causality between AITD and MDD through assessed the local genetic correlation at ascertained trait-specific GWAS regions. The correlation at MDD-specific regions is significantly greater than AITD-specific regions (rg local MDD1 0.41 (0.32) vs rg local AITD 0.083(0.03)) (Fig. 2(E) and 2(F)), indicating that loci that increase MDD tend to consistently increase AITD, whereas loci that increase AITD do not consistently affect MDD, consistent with the putative model that MDD causally increases AITD.
Although the overall genetic correlation between AITD and MDD was relatively modest compared to more closely correlated phenotypes, these findings suggest potential shared genetic aetiologies or pathophysiology, particularly at certain chromosomal loci. Therefore, these results warrant further investigation into the potential mechanisms through cross-trait analysis and expression-trait analysis.
Multi-trait analysis of GWAS for AITD and MDD
Based on evidence for significant overall and local genetic correlations between AITD and MDD,we then performed MTAG analysis to identify risk SNPs underlying the joint phenotypes AITD-MDD. To ensure a fair comparison between the MTAG and GWAS results, we conducted all analyses using a shared set of SNPs. In the MTAG analysis, our primary focus revolved around the following two sets of SNPs. The first set consists of the SNPs that exhibited genome-wide significance in both AITD and MDD MTAG outcomes, as well as GWAS results. To simplify matters, we referred to them as lead SNPs. The second set contains those SNPs that were significant in their respective MTAG outcomes but fell short of significance in the GWAS analysis. For ease of reference, we referred to them as pilot SNPs.
Four SNPs in close LD (rs853685, rs853681, rs853679, rs853676) in the ZSCAN31 gene (28292470 – 28324048) were identified as lead SNPs in our cross-trait study. These four lead SNPs were found to be associated with AITD, MDD1, MDD2 GWAS respectively, also with AITD-MDD joint phenotype in dual direction (Table 3). Therefore, these lead SNPs or the adjacent SNPs in LD might participate in the development of AITD and MDD comorbidity.
Lead SNPs identified through MTAG analysis for AITD and MDD
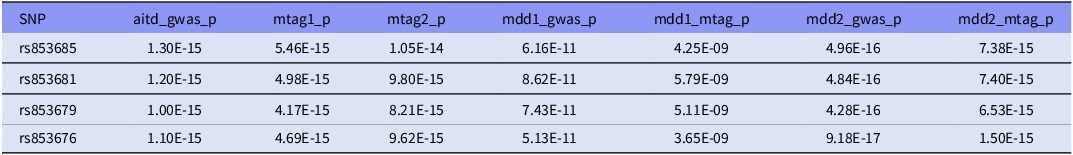
These lead SNPs were significantly in their GWAS summary data and MTAG results.
When focusing on the pilot SNPs for AITD and MDD, we identified 166 SNPs in AITD-MDD1 MTAG analysis, and 133 SNPs in AITD-MDD2 MTAG analysis, respectively. And there are 112 SNPs that are shared between these two groups of pilot SNPs (supplementary table 3). While in the MDD-AITD analysis, only 4 and 33 pilot SNPs were identified respectively (supplementary table 4). It is crucial to highlight that none of these pilot SNPs were discovered to be shared. These finding further supported that, MDD may confer genetic susceptibility for AITD, while the reverse is not necessarily true.
To evaluate the impact of violated MTAG assumption, we re-ran analyses using trait-specific heritability estimates and empirically derived genetic covariances. Of the 112 original SNPs, 104 (92.9%) remained significant (p < 5x10⁻⁸), with effect size correlations > 0.95 between standard and adjusted models. This indicates robustness to moderate deviations from MTAG ideal assumptions.
Mendelian randomisation
Based on the genetic correlation results and MTAG analysis, we then performed two-sample MR analysis to decipher the causal relationship between MDD (exposure) and AITD (outcome). The 112 pilot SNPs identified in the MTAG analysis were chosen as instrument variables (IVs). After clumping with r2 threshold of 0.01 and 1,000 kb window, 41 independent IVs were remained for final MR analysis.
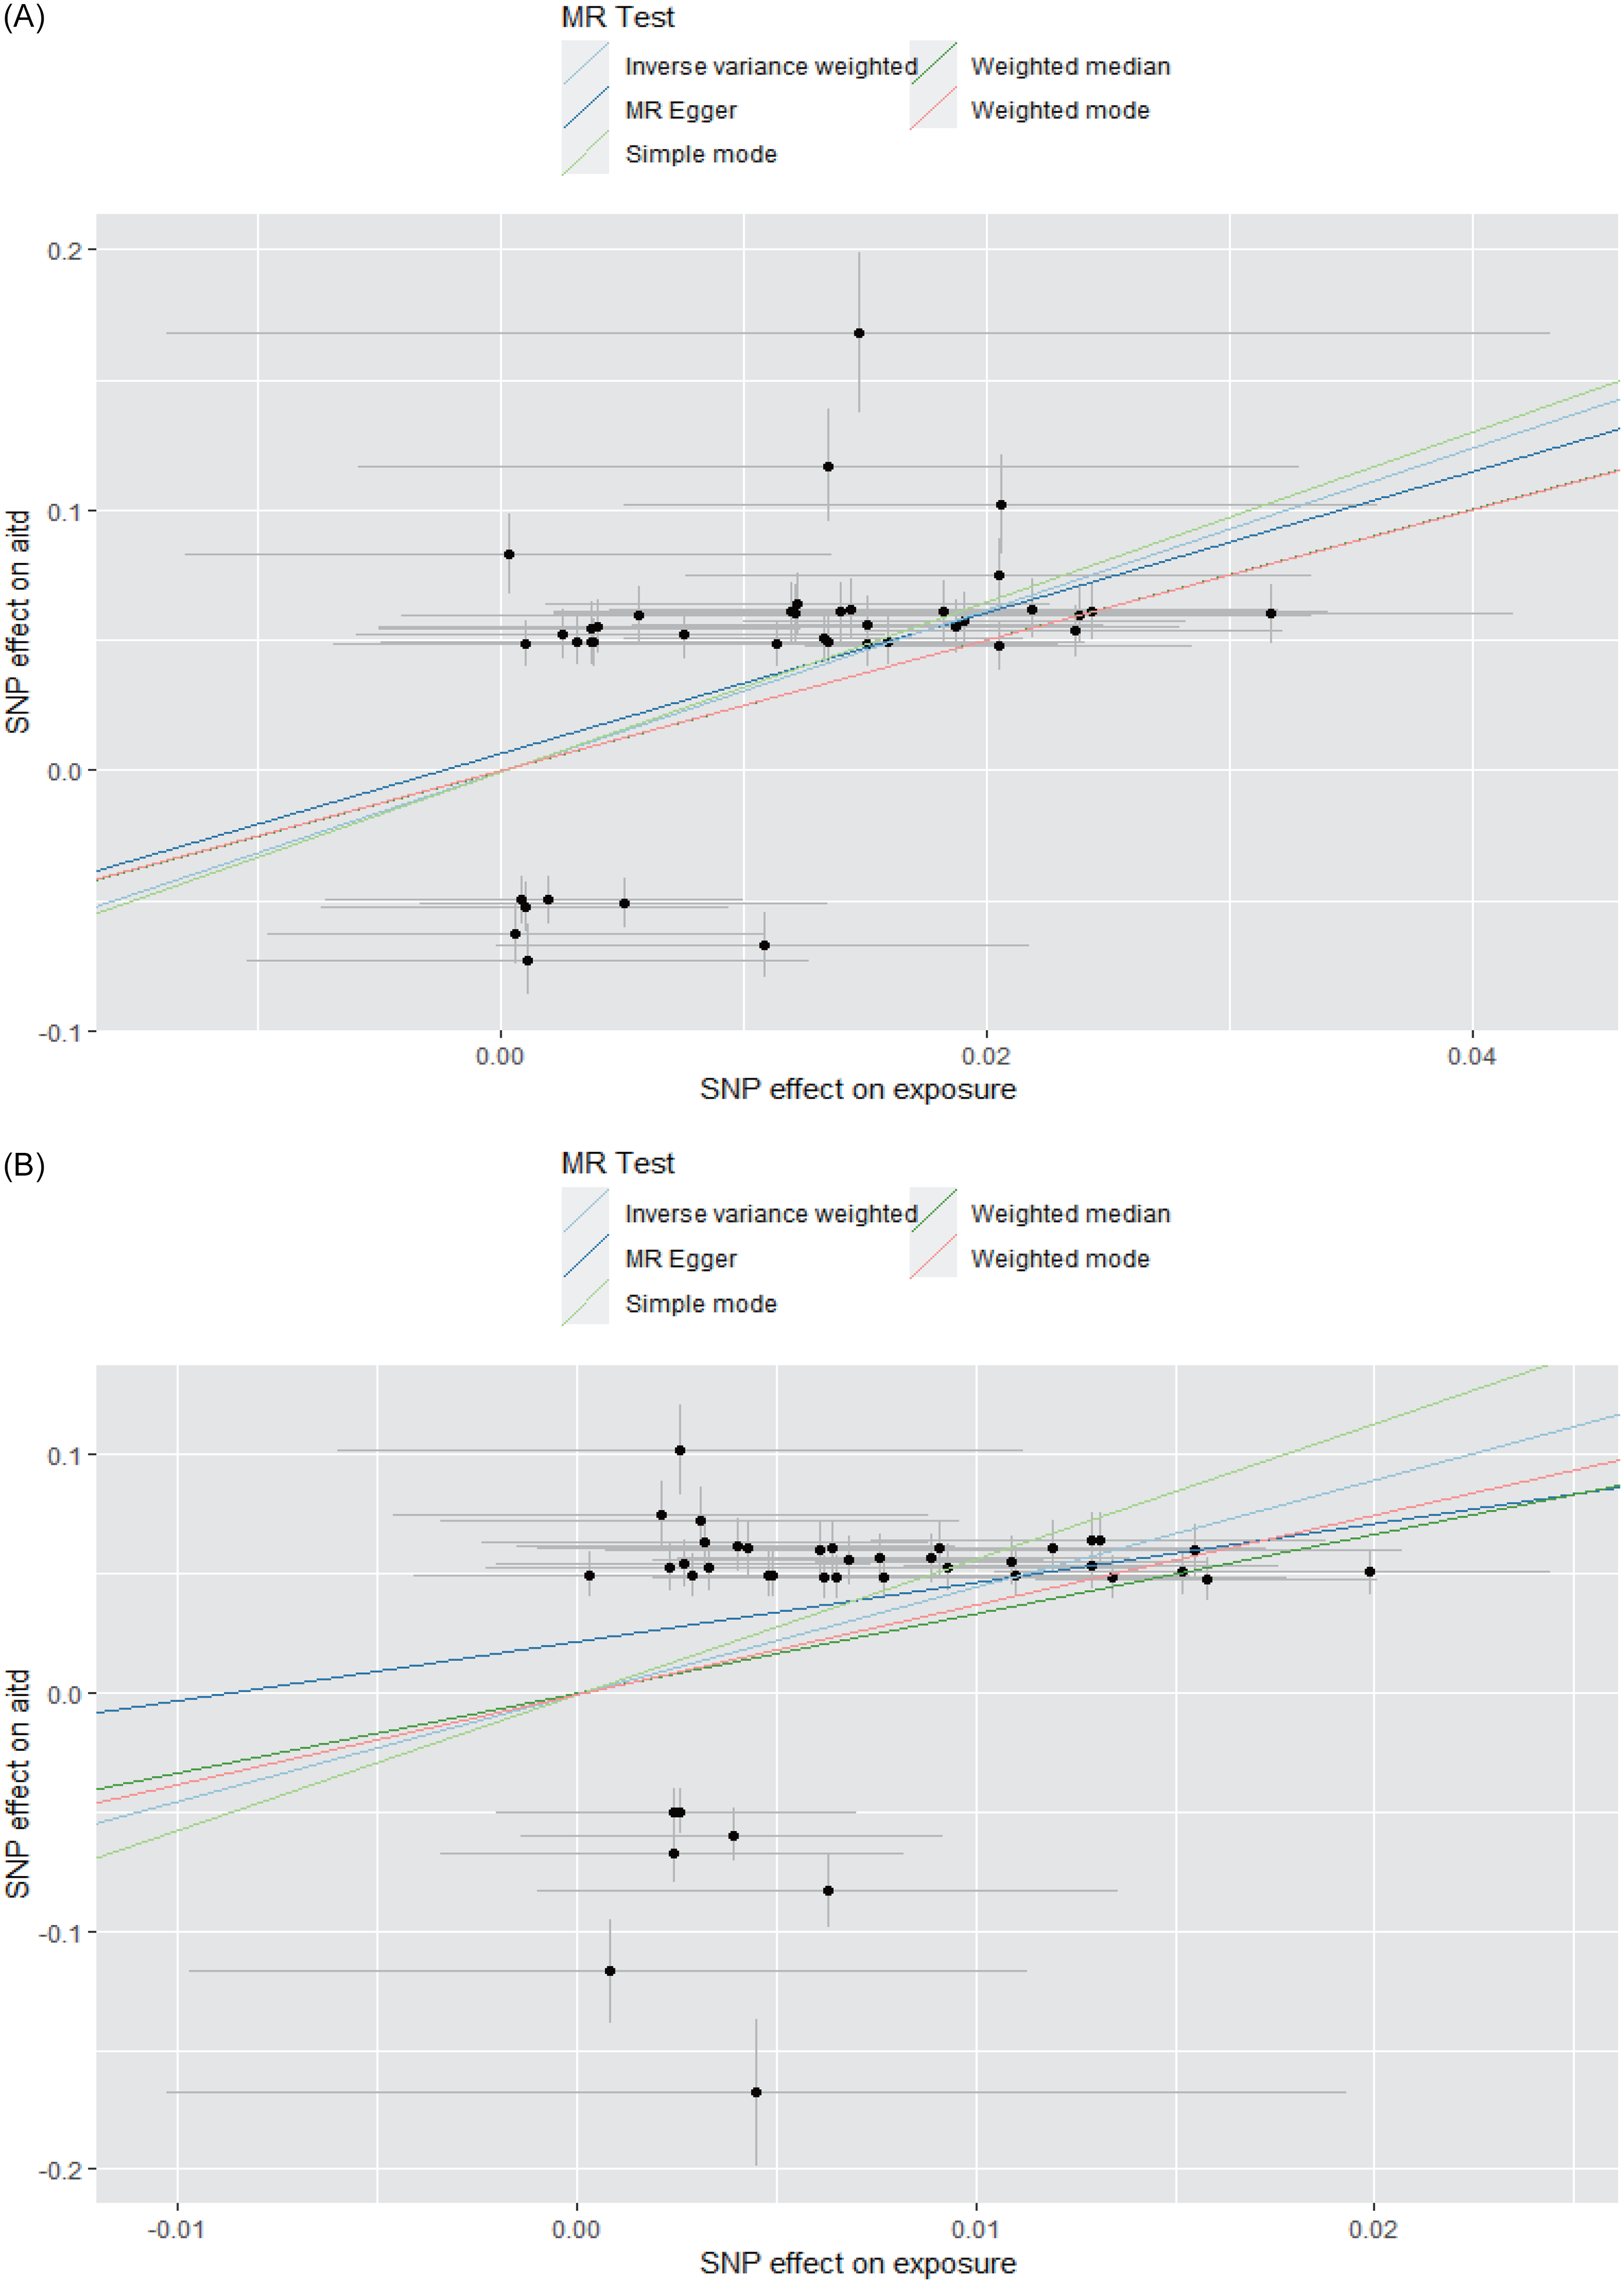
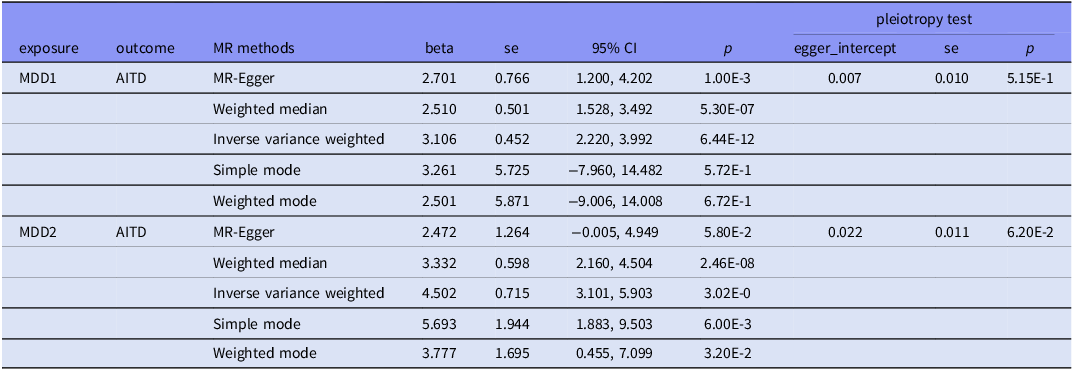
In the MDD1-AITD MR analysis, most of the five MR methods showed statistical significance, with positive beta estimates (Table 4, Fig. 3). Among these estimates, the IVW method had an estimated beta effect of 3.106 (SE = 0.452, p = 6.44x10⁻¹²), indicating a significant association between MDD1 and AITD. These results showed that, alterations in the MDD variables are likely to have a causal influence on the risk of developing the AITD variables. We then conducted sensitivity analyses to assess the robustness of the MR findings. MR-Egger regression revealed no significant intercept (egger intercept = 0.007,SE = 0.010, p = 0.515), suggesting minimal directional pleiotropy. Notably, the weighted median and simple mode methods, which are less sensitive to pleiotropy, yielded consistent effects (β = 2.51 – 3.33, p < 1 × 10⁻⁶), further mitigating concerns of pleiotropic bias. Additionally, leave-one-out analysis was conducted to study the influence of each instrumental variable on the causal estimate. The removal of any individual SNP did not substantially alter the overall results, indicating that the causal effect was not driven by a single genetic variant. Moreover, we obtained more significant results in the MDD2-AITD MR analysis (Table 4, Fig. 3).
The MR results for MDD and AITD. A. MDD1 and AITD; B. MDD2 and AITD. The lines with different colours represent associated MR methods. X-axis: SNP effect on exposure; Y-axis: SNP effect on AITD; error bars indicate standard errors (SE). The 95% confidence interval (CI) for each SNP can be calculated as β ± 1.96×SE.

Mendelian randomisation results for plausible causal relationships between MDD and AITD

CI, Confidential interval. se, standard errors. All p-values are presented in scientific notation with two significant figures to ensure uniform formatting precision.
Overall, the results of the MR analysis provide robust evidence for a causal relationship between MDD and AITD. These findings suggest that interventions targeting MDD may have potential to modify the risk or incidence of the AITD.
SMR
Finally, we conducted SMR analysis to identify putative functional genes underlying MDD and AITD, by jointly analyzing GWAS summary data of AITD, MDD, and eQTL summary data from eQTLGen (whole blood) dataset.
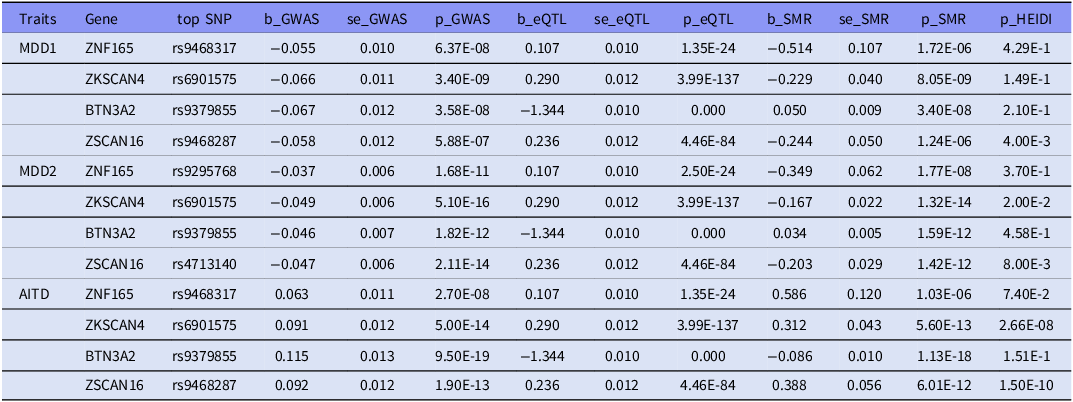
We identified 249 genome-wide significant associations (pSMR < 2.60x10⁻⁶), of which 10 probes in MDD1, 22 in MDD2 and 217 in AITD GWAS dataset (supplementary table 5). Among the 10 probes identified in MDD1 dataset, 9 probes were also found in AITD dataset. And 12 of the 22 probes identified in MDD2 dataset were also detected in AITD dataset. Finally, four probes representing 4 unique genes (ZNF165, ZKSCAN4, BTN3A2, ZSCAN16) were both identified in MDD1-AITD and MDD2-AITD association. And two genes (ZNF165, BTN3A2) survived the HEIDI-outlier test (p > 0.05, minimum > 10 SNPs) (Table 5). These results showed that ZNF165, BTN3A2 genes might serve as putative functional genes for MDD and AITD comorbidity.
Plausible functional genes for MDD and AITD comorbidity identified by SMR analysis
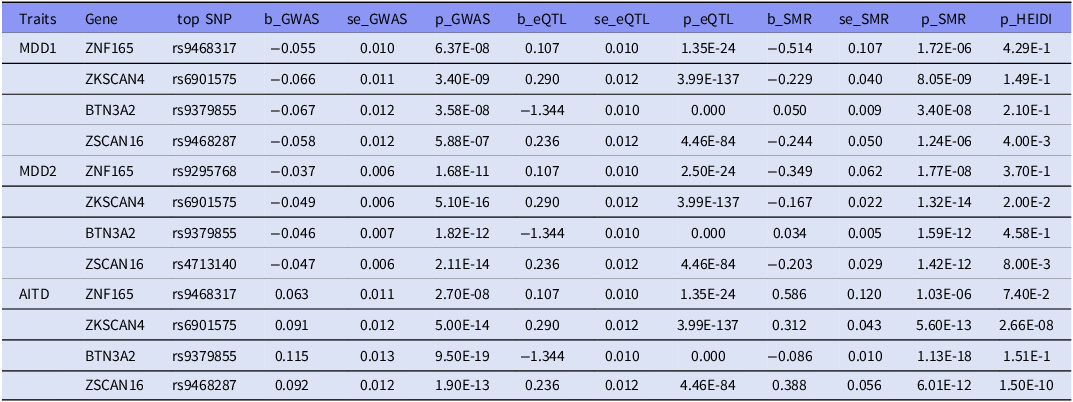
SMR, summary-data-based mendelian randomisation; HEIDI, heterogeneity in dependent instruments; eQTL, expression quantitative trait loci; GWAS, genome-wide association study; se, standard error. All p-values are presented in scientific notation with two significant figures to ensure uniform formatting precision.
ZNF165 Encodes a zinc finger protein implicated in transcriptional regulation and chromatin remodelling. Zinc finger proteins are critical for immune cell differentiation (e.g. T-cell development) and neuronal plasticity. Notably, ZNF165 is highly expressed in both lymphoid tissues and prefrontal cortex, suggesting a dual role in immune and neuropsychiatric pathways (Squassina et al., Reference Squassina, Meloni, Chillotti and Pisanu2019; Rakhra and Rakhra, Reference Rakhra and Rakhra2021). Dysregulation of ZNF165 may disrupt glucocorticoid receptor signalling, a pathway central to both HPA axis dysfunction in MDD and immune tolerance in AITD.
BTN3A2, a member of butyrophilin family, regulates γδT-cell activation and cytokine production (Kabelitz, Reference Kabelitz2024). In autoimmune diseases, such as rheumatoid arthritis (RA), butyrophilin modulates Th17/Treg balance, a mechanism also implicated in AITD (Rhodes et al., Reference Rhodes, Reith and Trowsdale2016). In MDD, elevated Th17 cytokines correlate with depressive severity, suggesting that BTN3A2 may link immune dysregulation to neuroinflammation (Ghosh et al., Reference Ghosh, Mitra, Kumar, Goyal and Sharma2022).
Discussions
In this study, we performed genetic correlation study between two common diseases, AITD and MDD, through large-scale GWAS summary data and several kinds of novel genetic statistical methods. And we definitely provided insights into the shared genetic architecture and potential causal effect underlying AITD and MDD.
While our study focuses on genetic architecture, environmental factors such as chronic stress, dietary patterns (e.g. iodine intake), and pharmacological exposures (e.g. antidepressants, thyroid medications) may interact with genetic susceptibility to shape AITD-MDD comorbidity. Potential mechanisms may include epigenetic regulation, immune-neuroendocrine crosstalk, and pharmacogenomic interactions. Environmental stressors (e.g. psychological trauma) may modulate DNA methylation or histone modifications at loci such as ZNF165 or BTN3A2, altering gene expression and disease risk. Chronic stress activates the HPA axis, elevating proinflammatory cytokines (e.g. IL-6, TNF-α), which exacerbate both thyroid autoimmunity and depression symptoms in genetically predisposed individuals. Drugs targeting MDD (SSRIs) or AITD (methimazole) may exhibit efficacy or toxicity modulated by genetic variants, highlighting the need for personalised approaches.
Comorbidity refers to the presence of two or more chronic conditions or diseases in an individual at the same time. These conditions can coexist independently or can influence each other, affecting the course and prognosis of each condition (Harrison et al., Reference Harrison, Fortin, Van Den Akker, Mair, Calderon-Larranaga, Boland, Wallace, Jani and Smith2021). Comorbidity is a common phenomenon, especially in the context of chronic diseases such as diabetes, heart disease, and mental health disorders. Genetic studies of comorbidity are important for several reasons (Rubio-Perez et al., Reference Rubio-Perez, Guney, Aguilar, Pinero, Garcia-Garcia, Iadarola, Sanz, Fernandez-Fuentes, Furlong and Oliva2017; Willcutt, Reference Willcutt2019). First, they can help us understand the underlying genetic mechanisms that contribute to the co-occurrence of certain diseases. By identifying genetic factors that predispose individuals to multiple conditions, researchers can gain insights into the shared biological pathways and potential treatment targets for these conditions. Second, genetic studies can provide valuable information for personalised medicine and risk assessment. Understanding the genetic basis of comorbidity can help to identify individuals who are at higher risk of developing multiple conditions, allowing for early intervention and targeted preventive strategies. Furthermore, genetic studies of comorbidity can shed light on the complex interactions between genetic and environmental factors in the development of multiple diseases. This holistic understanding is crucial for developing more effective treatment approaches and improving patient outcomes. In summary, genetic studies of comorbidity play a vital role in advancing our understanding of the complex interplay between genetics and disease, ultimately paving the way for more targeted and personalised approaches to healthcare.
LDSC is a method that estimates the genetic correlation between traits or diseases using summary statistics from GWAS summary data (BK Bulik-Sullivan et al., Reference Bulik-Sullivan, Finucane, Anttila, Gusev, Day, Loh, Reprogen, Duncan, Perry, Patterson, Robinson, Daly, Price and Neale2015a). It leverages the LD information in the human genome to estimate the heritability and genetic correlation between different traits. LDSC calculates LD scores for each genomic position by estimating the pairwise correlation between nearby genetic variants. By comparing the LD scores across multiple traits, it determines the genetic correlation between them. ρ-HESS is a method designed to estimate the heritability and genetic correlation at a local level (Shi et al., Reference Shi, Mancuso, Spendlove and Pasaniuc2017). It uses summary statistics from GWAS and functional annotations to quantify the genetic contribution of specific genomic regions to a trait or disease. ρ-HESS identifies the regions that show significant enrichment of heritability and estimates the genetic correlation between these regions. Both LDSC and ρ-HESS provide valuable insights into the genetic architecture of complex traits and diseases. They allow researchers to understand the shared genetic basis between different traits or diseases, which can help unravel the underlying biological mechanisms and potentially guide future therapeutic interventions.
Three potential biases arising from MTAG assumptions merit discussion. The first one is heritability mismatch. The sixfold difference in SNP heritability between AITD and MDD could theoretically attenuate power for MDD-driven association. However, our sensitivity analyses retained > 90% of significant SNPs, aligning with simulations showing MTAG’s resilience to heritability heterogeneity (Verbanck et al., Reference Verbanck, Chen, Neale and Do2018). The second bias is the imperfect genetic covariance. While our empirical genetic covariance deviated from unity, the high concordance between MTAG and sensitivity models suggests minimal impact on variant prioritisation. And the third one is directional consistency. MTAG assumes concordant effect directions across traits. Of the 112 SNPs, 109 (97.3) showed consistent directions in individual GWAS, mitigating bias from antagonistic pleiotropy.
In this study, we performed bivariate LDSC and ρ-HESS analysis between AITD and MDD. We identified a significantly genetic correlation between AITD and MDD in global and local genome regions. This correlation suggests that there may be shared genetic risk factors between the two conditions, which could help to explain why they often co-occur in clinical populations. This discovery has potential implications for both the diagnosis and treatment of these conditions, as it may lead to the development of novel therapeutic strategies that target shared genetic pathways. Moreover, the identification of this correlation highlights the importance of taking a multidisciplinary approach to understanding complex diseases. By combining data from different fields, such as genetics and psychiatry, researchers can gain a more comprehensive understanding of the factors that contribute to disease susceptibility and progression. This knowledge can ultimately lead to better diagnostic tools and more effective treatments for patients suffering from these conditions. The finding that regional rg estimates closely match global rg estimates from LDSC, aligns with the notion that numerous genetic variants across the genome have pleiotropic effects on these traits. Our genetic correlation estimates (rg = 0.139 for AITD-MDD1, rg = 0.070 for AITD-MDD2) were derived from European-ancestry cohorts. While these results suggest shared genetic architecture within European population, their generalisability to non-European populations remains untested. For instance, allele frequencies at key loci (e.g. FLT3 rs76428106) or LD patterns in chromosome 6 regions may differ in African or Asian population, potentially altering genetic correlation estimates. Notably, a recent trans-ancestry GWAS of MDD reported modest heterogeneity in SNP heritability between Europeans and East Asians (Major Depressive Disorder Working Group of the Psychiatric Genomics Consortium, 2025), underscoring the need for replication in diverse cohorts.
MTAG is a statistical method used in genetics research to perform meta-analysis of multiple traits. It was developed to address the challenges of analysing large-scale GWASs, which often involve hundreds or thousands of traits (P Turley et al., Reference Turley, Walters, Maghzian, Okbay, Lee, Fontana, Nguyen-Viet, Wedow, Zacher, Furlotte, Andme Research, Magnusson, Oskarsson, Johannesson, Visscher, Laibson, Cesarini, Neale and Benjamin2018). MTAG works by combining summary statistics from individual GWAS for each trait, and then performing a joint analysis to estimate the genetic correlations between traits. This approach allows the identification of genetic loci that are associated with multiple traits, even if they do not reach genome-wide significance in any single GWAS. One advantage of MTAG is that it can increase statistical power and improve the accuracy of genetic correlation estimates, compared to traditional methods that analyse each trait separately. By leveraging information across multiple traits, MTAG can identify subtle genetic effects that may be missed in individual GWAS analyses. MTAG has been applied to a wide range of complex traits and diseases, including psychiatric disorders, cardiovascular disease, and inflammatory bowel disease. It has provided new insights into the genetic architecture of these conditions and identified novel genetic loci that are shared between different traits. In this study, we identified 112 pilot SNPs shared between AITD and MDD through cross-trait MTAG analysis, which have not been reported previously. Notably, all these SNPs showed the consistent direction of effect between the cross-trait GWAS meta-analyses and the component single trait GWAS’s (Table S3). Moreover, the SNPs that is shared by both AITD and MDD individual GWAS summary also demonstrated consistent effects in both cross-trait meta-analyses, indicating that these SNPs may play a role in regulating shared pathways between AITD and MDD.
MR analysis is a powerful tool to infer causal relationships between traits. By leveraging genetic variations as IVs, MR analysis can overcome confounding factors that may bias observational studies (Lawlor et al., Reference Lawlor, Harbord, Sterne, Timpson and Davey Smith2008; Hemani et al., Reference Hemani, Zheng, Elsworth, Wade, Haberland, Baird, Laurin, Burgess, Bowden, Langdon, Tan, Yarmolinsky, Shihab, Timpson, Evans, Relton, Martin, Davey Smith, Gaunt and Haycock2018). This method has the potential to inform public health policies and clinical decision-making by identifying interventions that could reduce the exposure and prevent associated outcomes. Compared with traditional statistical methods used in the association studies, MR reduces confounding and reverse causation and is becoming increasingly popular in the exploration of aetiological mechanisms. While our sensitivity analyses minimised pleiotropic bias, residual confounding or bidirectional pathways cannot be fully excluded. For example, subclinical thyroid dysfunction might exacerbate depressive symptoms, creating a feedback loop. Thus, the observed MDD on AITD causality should be interpreted as one plausible component of a potentially bidirectional relationship, necessitating further mechanistic and longitudinal validation. And the SMR analysis performs a MR equivalent analysis to identify putative functional genes underlying statistical associations, as well as additional loci identified in cross-trait meta-analyses (Zhu et al., Reference Zhu, Zhang, Hu, Bakshi, Robinson, Powell, Montgomery, Goddard, Wray, Visscher and Yang2016). It can address the question of whether shared risk genes contribute to both traits by using summary statistics from GWAS and eQTL data. In our analysis, we discovered a significant causal relationship between MDD and AITD. Sensitivity analysis further indicated that this causal relationship is unlikely to be driven by pleiotropy. The SMR method effectively identified two genes that underlie both AITD and MDD. Notably, these probes are all located on chromosome 6, which aligns with the findings from the ρ-HESS analysis, providing consistent results.
Our understanding of the biological functions of the two putative genes ZNF165 and BTN3A2 remains limited. A multi-trait association analysis has investigated the potential involvement of the ZNF165 gene in the development of MDD (Tirozzi et al., Reference Tirozzi, Quiccione, Cerletti, Donati, De Gaetano, Iacoviello and Gialluisi2023). A recent study on MDD has identified BTN3A2 as the top candidate gene exhibiting pleiotropic association with MDD in multiple brain regions after correcting for multiple testing (Yang et al., Reference Yang, Liu, Zhao, Feng, Lu, Yang, Xu, Zhou, Jing and Yang2021). In addition, another study has demonstrated that the BTN3A2 is one of the six diagnostic markers associated with RA when combined with MDD. Furthermore, the expression level of BTN3A2 has been found to be associated with the composition of the majority of immune cells in MDD (Zhou et al., Reference Zhou, Sun, Tang, Yuan, Wang and Zhang2023). The dual association of ZNF165 and BTN3A2 with AITD and MDD may reflect shared immunomodulatory and neuroendocrine pathways. We propose two mechanistic hypotheses linking ZNF165 and BTN3A2 to AITD-MDD comorbidity. One hypothesis is shared immune-neuroendocrine crosstalk. ZNF165 may modulated NF-κB driven thyroid peroxidase autoantibody production while concurrently disrupting glucocorticoid receptor signalling in the hippocampus, a depression-relevant pathway (Rakhra and Rakhra, Reference Rakhra and Rakhra2021). The other hypothesis might be cytokine-mediated comorbidity. BTN3A2-associated γδT-cell activation could perpetuate thyroid autoimmunity via IL-17 secretion, while IL-17 penetration of the blood-brain barrier may induce microglial activation and monoamine dysfunction observed in MDD (Rhodes et al., Reference Rhodes, Reith and Trowsdale2016). While we propose mechanistic links for ZNF165 and BTN3A2, direct experimental evidence connecting these genes to AITD-MDD comorbidity remains sparse. Current hypotheses are derived from expression pattern and analogous roles in isolated autoimmune or psychiatric conditions. Future studies must empirically test these pathways in disease-relevant tissues and preclinical models. Future directions will prioritise multi-omics integration, including epigenome-wide association studies (EWAS) to map environmental effects on AITD-MDD risk loci, MR analyses incorporating environmental proxies as mediators to explore indirect pathways, and pharmacogenomic studies to evaluate how genetic variants modulate responses to antidepressants or anti thyroid drugs in comorbid populations.
Our study had several limitations. First, the AITD GWAS summary data we used in our study did not differentiate GD and HT, which may have different genetic basis and potentially different comorbidities with MDD. Unfortunately, there are no available large-scale GWAS summary data of European population for GD and HT. Future independent GWAS studies in GD and HT might provide more information about comorbidity with MDD. Second, our MTAG results may be biased due to violations of the MTAG assumptions of equal SNP heritability for each trait and perfect genetic covariance between traits. However, it is likely that these impacts were negligible given the large sample size and absence of sample overlap in our GWAS summary. Furthermore, our analysis of two independent MDD GWAS datasets yielded similar results. Third, while MR analyses suggested a causal effect of MDD on AITD, several limitations warrant caution. Unmeasured environmental or genetic confounders could bias estimated if correlated with IVs. Despite sensitivity analyses, undetected pleiotropic pathways (e.g. SNPs influencing both MDD and AITD via inflammation) may persist. IVs were derived from European-ancestry cohorts, limiting generalisability to other populations where LD patterns or causal pathway may differ. Therefore, further investigations using larger and more powerful datasets will be necessary to establish whether MDD has a causal relationship with AITD. Fourth, while genetic factors are central to our analysis, environmental contributors (e.g. stress, diet, drug use) were not explicitly modelled due to data constraint. Current GWAS summary statistics lack harmonised environmental exposure metrics, and the dynamic nature of environmental factors complicates integration with genetic data. Future studies should combine genetic risk scores with longitudinal environmental exposure data to dissect gene-environment interactions. Finally, our analysis was restricted to European-ancestry populations. Genetic correlations observed here may not fully generalise to other populations due to difference in allele frequencies, LD structure, or environmental exposures. Future studies should validate these findings in ancestrally diverse cohorts.
In summary, our study revealed significantly stronger genetic correlation between AITD and MDD, and provided conclusive causal effect of MDD in AITD direction. We identified 112 SNPs shared between AITD and MDD, none of which was genome-wide significant in the single-trait GWAS, and two candidate genes in chromosome 6 significantly implicated in susceptibility to cross-trait AITD-MDD. These findings progress our understanding of shared genetic mechanisms underlying AITD and MDD, and potentially provide points of intervention that may allow the development of new therapies for these two common disorders.
Conclusions
AITD and MDD are genetically correlated in global and local chromosomal regions. This genetic correlation supports a putative causal relationship, though environmental mediators (e.g. stress, diet) may further modulate this pathway, warranting integrative analyses in future studies.
Supplementary material
The supplementary material for this article can be found at https://doi.org/10.1017/neu.2025.10033.
Availability of data and Materials
The open source bioinformatic tools used in this study can be obtained from the following websites. LDSC: ρhttps://github.com/bulik/ldsc;ρ-HESS: https://huwenboshi.github.io/hess/; PLINK: https://www.cog-genomics.org/plink/1.9;MTAG:https://github.com/JonJala/mtag;TwoSampleMR:https://mrcieu.github.io/TwoSampleMR/;SMR:https://yanglab.westlake.edu.cn/software/smr/#Overview. The analytic codes are available from the corresponding author upon reasonable request.
Acknowledgements
The authors sincerely appreciated the contributing GWAS studies for AITD and MDD.
Financial support
Yangzhou health commission 2024-4-35.
Competing interests
None.
Ethics approval and consent to participate
Our study exclusively relied on publicly available data and software tools, without involving any collection of personal information from human subjects. As a result, the nature of our research did not meet the criteria that would typically require review by an institutional review board or ethics committee.


 Open access