

Until 1980, little was known about Preclassic pottery (1000 b.c.–a.d. 250) in the Northern Maya Lowlands. Although Preclassic sherds had been recovered and identified from several sites, the first truly systematic analysis of Preclassic material was undertaken by Andrews V at Komchen, in the northwest part of the Yucatan Peninsula (Andrews IV Reference Andrews IV1980; Andrews V Reference Andrews V1988, Reference Andrews V, Clancy and Harrison1990). Andrews V provided a type-variety analysis of Preclassic pottery whose history we now know runs from the early Middle Preclassic Ek phase (900–700 b.c.), through the Early Nabanche (700–250 b.c.) and Late Nabanche phases (250 b.c.–a.d. 250). This analysis formed the basis for all subsequent typological studies in the region.
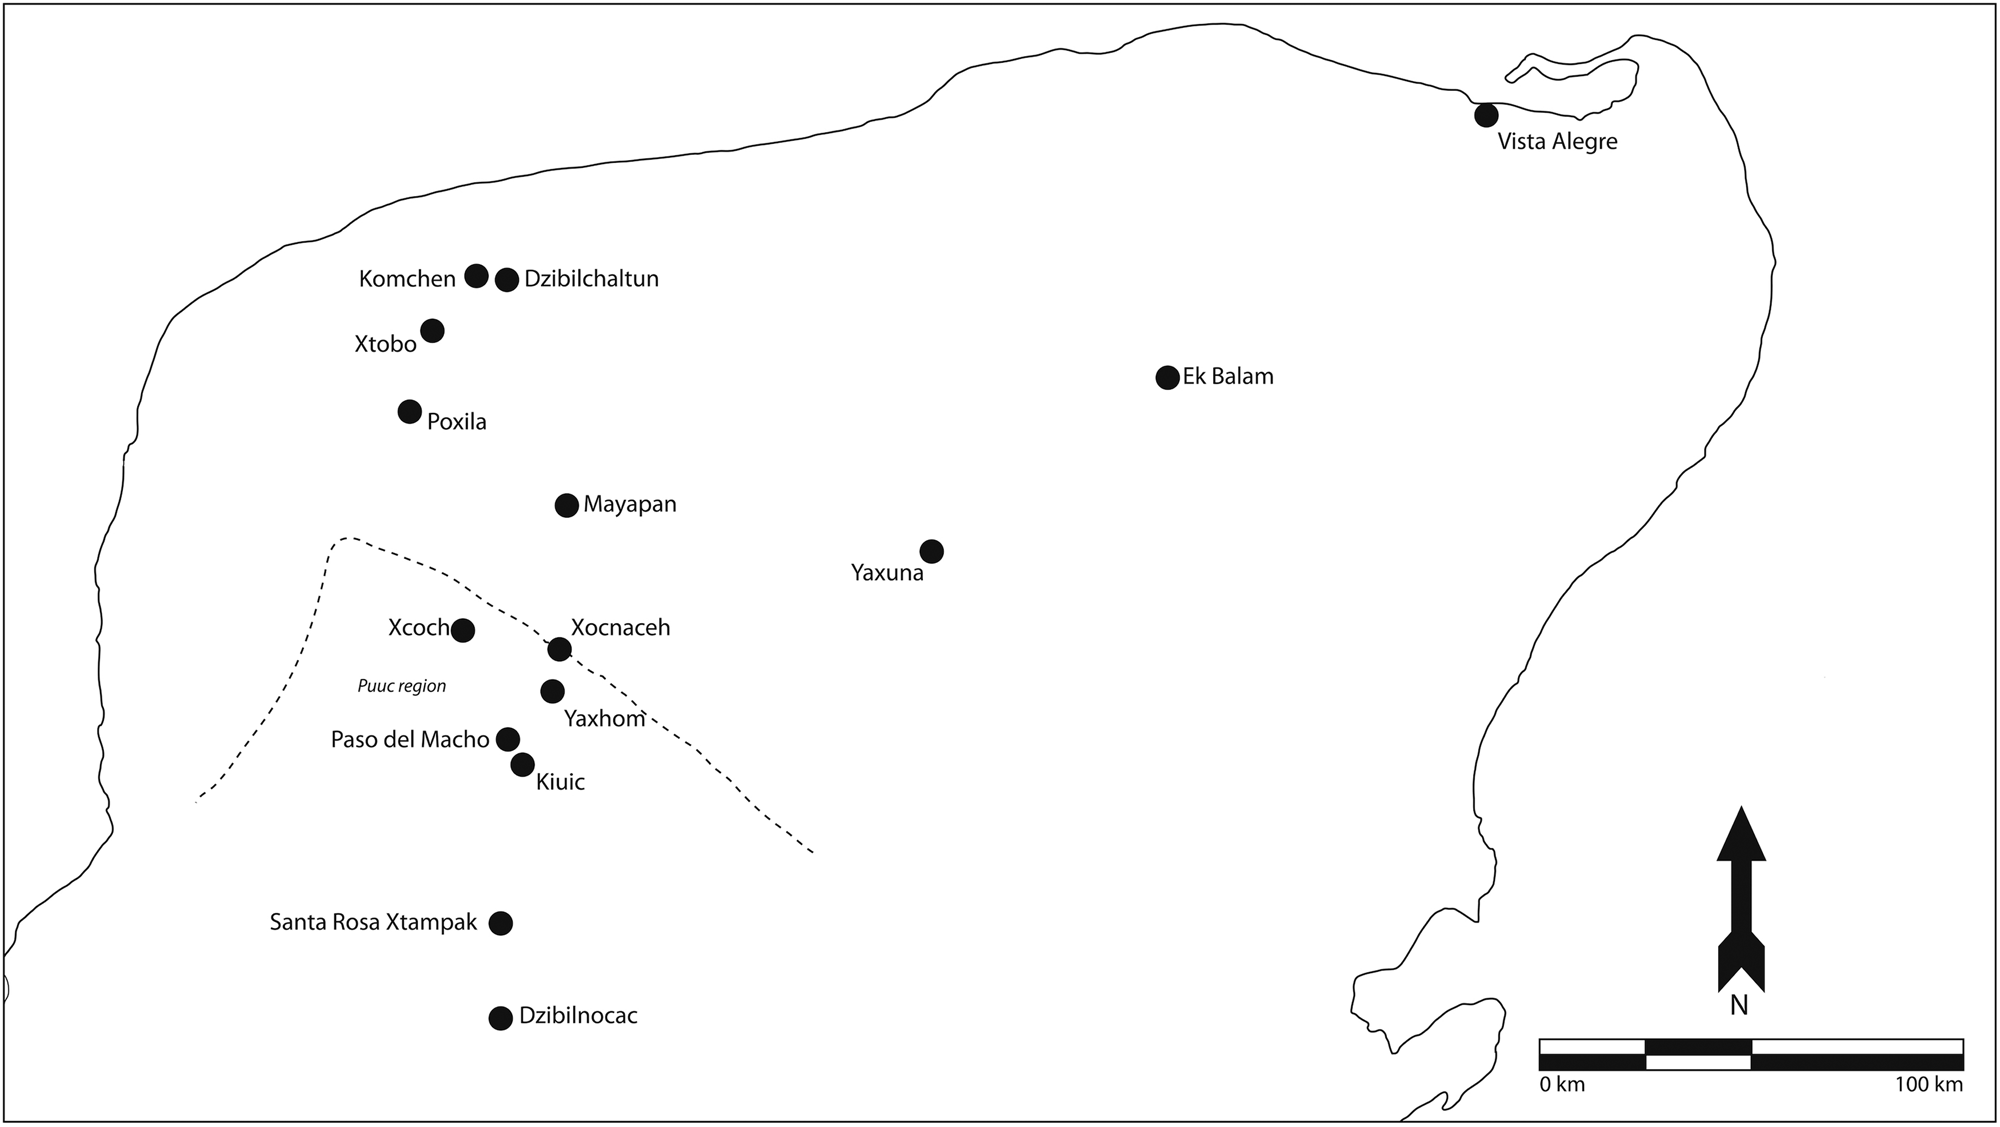
It has recently been shown that Middle Preclassic and Late Preclassic occupations are found throughout the Yucatan Peninsula, in some cases associated with massive platforms at sites such as Xocnaceh, Poxila, Yaxhom, and Xcoch (Figure 1; Ceballos Gallareta and Robles Castellanos Reference Ceballos Gallareta and Castellanos2012; Gallareta Negrón Reference Gallareta Negrón, Brown and Bey2018; Ringle Reference Ringle, Negrón, Ringle and Bey2018; Robles Castellanos and Ceballos Gallareta Reference Robles Castellanos, Gallareta, Brown and Bey2018; Smyth et al. Reference Smyth, Zapata, Dunning, Weaver and Stanton2013). Dense occupations and multi-tier settlement hierarchies have been identified in the northwest portion of the peninsula associated with a wide range of site types, many with ballcourts (Anderson Reference Anderson2011; Andrews and Robles Castellanos Reference Andrews and Castellanos2004; Anderson et al. Reference Anderson, Robles Castellanos, Andrews, Brown and Bey III2018).
Map of the Northern Maya Lowlands with the location of the Middle Preclassic sites discussed in the text. Map by Parker.
Early Middle Preclassic (900–700 b.c.) occupations, based on ceramics, have also been identified recently at Komchen, Kiuic, Yaxhom, Xcoch, Tzubil, Xocnaceh, the Yalahau region, and several other sites in the area between Komchen and the Puuc region (Andrews V et al. Reference Andrews V, Bey, Gunn, Brown and Bey2018; Boucher and Palomo Reference Boucher and Palomo2005; Kohut et al. Reference Kohut, Bey, Andrews V, Negrón and edited by Debra2022; Parker Reference Parker, Negrón, Ringle and Bey2019; Rissolo et al. Reference Rissolo, Ochoa Rodríguez, Ball, Shaw and Mathews2005; Smyth et al. Reference Smyth, Zapata, Dunning, Weaver and Stanton2013). We have therefore reached a stage where ceramic complexes, utilizing the type-variety method, have been used to date and identify Preclassic occupations and the evolution of social complexity across the Northern Maya Lowlands at dates contemporary with those in the Southern Lowlands (see Inomata et al. Reference Inomata, Triadan, MacLellan, Burham, Aoyoma, Palomo, Yonenobu, Pinzón and Nasu2017 for a summary of recent Lowland Maya Preclassic chronologies). Except for Bond-Freeman's (Reference Bond-Freeman2007) decorative analysis of the use of step-frets on Incised Bichromes such as Huachinango Bichrome Incised, there has been no study of Preclassic ceramics beyond the type-variety level in the Northern Maya Lowlands.
This work represents one of the first efforts to extend our understanding of Northern Maya Lowland Preclassic pottery beyond the scope of type-variety through an analysis of the chemical composition of 204 Preclassic sherds from four sites in the Northern Maya Lowlands. This study was undertaken specifically to characterize systems of pottery production and exchange both temporally and spatially. Specifically, we sought to discern if pottery production was conducted locally or whether it was produced more centrally and then exchanged. By selecting a pottery sample that spans from the early Middle Preclassic (ca. 900 b.c.) through the end of the Late Preclassic (ca. a.d. 250), any changes within systems of pottery production and exchange can also be noted. Another issue that archaeologists face in the Northern Maya Lowlands is the typological ambiguities spanning the Middle and Late Preclassic. For example, distinguishing Middle and Late Preclassic redwares has proven difficult. Compositional studies may surmount some of these ambiguities.
CLARIFYING PROBLEMS OF CERAMIC PRODUCTION, DISTRIBUTION, TYPOLOGY, AND CHRONOLOGY THROUGH LA-ICP-MS
With firm typological foundations having only recently been established in the Northern Lowlands, there remains a host of questions and problems regarding several aspects of pottery technology during this time. Several of these questions can be addressed through ceramic characterization studies of the trace elements present in pottery pastes.
Technological
The first set of questions deals primarily with the technological aspects of pottery production and exchange. There is a high degree of similarity in style, decoration, and form between pottery from the Northern Lowlands and in the Central and Southern Lowlands during the Middle Preclassic period, especially within the Mamom horizon (Andrews V Reference Andrews V1988, Reference Andrews V, Clancy and Harrison1990). Understanding the mechanisms of how such a ubiquitous ceramic style spread is a worthy question, but is beyond the capabilities of chemical characterization studies that aim to consider the full spectrum of prestige, serving, and utilitarian wares. With regard to the organization of ceramic technology in the Northern Lowlands, compositional analysis can shed light on questions concerning the production and distribution of Preclassic pottery. Controversy on the nature of early production and distribution in this region has broadly centered on whether Mamom ceramic technology was imported from the Southern Lowlands (as summarized originally by Andrews V Reference Andrews V, Clancy and Harrison1990) or whether pottery traditions developed indigenously in this region (Ceballos Gallareta and Robles Castellanos Reference Ceballos Gallareta and Castellanos2012; Rissolo et al. Reference Rissolo, Ochoa Rodríguez, Ball, Shaw and Mathews2005; Stanton and Ardren Reference Stanton and Ardren2005).
Ceramic production likely did occur locally, but even in that case, what was the nature of pottery exchange networks in the north during this period? Visual analysis of pastes and fabrics have been undertaken in the Northern Lowlands, but most of the analysis of Preclassic pottery has continued to focus on surface features, especially slip colors and characteristics (Andrews V Reference Andrews V1988, Reference Andrews V, Clancy and Harrison1990; Ceballos Gallareta and Robles Castellanos Reference Ceballos Gallareta and Castellanos2012; Kohut et al. Reference Kohut, Bey, Andrews V, Negrón and edited by Debra2022; Stanton and Ardren Reference Stanton and Ardren2005). Variability in potting technology through the differential selection of clays and tempers can be identified through chemical characterization studies. Does exchange during this time include actual ceramic vessels, the knowledge of how to produce uniform styles of ceramics, or the movement of people across the landscape? While the uniformity in Preclassic slip colors and surface features across space suggests the existence of supra-regional styles, pottery technology may have been variable across regions.
Typology and Chronology
The second set of questions involves issues associated with typological and chronological classifications. Archaeologists focusing on the Preclassic in the Northern Lowlands have been faced with many problems in typological classification. This may be partially due to the smaller number of Preclassic materials that have been recovered from excavations and a lack of contexts with quality radiocarbon dates. However, simply identifying sherd types can often be difficult, especially for non-ceramic specialists. For example, Anderson (Reference Anderson2010) was only able to assign around half of his sherds to a type, due primarily to the erosion of sherds caused by the highly acidic soil, rainfall, and shallow stratigraphy in the northern plains. A larger corpus of sherds and greater familiarity with the ceramic material has even led our project to extensively reclassify pottery recovered in the early 2000s from Xocnaceh and Paso del Macho.
Identifying the transition between phases has also been difficult. For example, the Joventud Red type of the Early Nabanche phase eventually morphs into the Sierra Red type of the Late Nabanche. Yet identifying the boundaries between these two types has proven difficult for archaeologists (Andrews V Reference Andrews V1989:12–13). Could the use of ceramic characterization succeed in clarifying the often-ambiguous assignment of some types?
Chemical characterization may also be utilized to judge the utility of ceramic groups, which consist of type-varieties classified according to their similarity in a variety of characteristics. The most problematic of the ceramic groups during the Preclassic is the Dzudzuquil group. Both Anderson (Reference Anderson2010:332) and Stanton and Ardren (Reference Stanton and Ardren2005:223) have noted that Dzudzuquil is often used as a “catch-all” group for sherds that do not clearly fit into another group and can broadly be grouped based on tan and cream slip features. Chemical characterization may reveal the degree of capriciousness in the lumping of ceramic types within a group such as Dzudzuquil.
The early Middle Preclassic Ek (900–700 b.c.) was initially wedged between the Early Nabanche and Late Nabanche phases, but was reassigned based on detailed stratigraphic sequences at Kiuic in the Puuc region (Andrews V et al. Reference Andrews V, Bey, Gunn, Brown and Bey2018). Andrews V (Reference Andrews V1988) originally had conceived the Ek phase as being an “invasive” sequence at Komchen from Puuc populations to the south. Based on appearance, Ek phase pottery is clearly ancestral to the Early Nabanche material and would suggest that there were no major demographic disruptions from the south, especially during the Middle Preclassic. Chemical characterization may aid in addressing any discrepancy between the Ek phase sequence at Komchen and the earliest sequence at Kiuic and either further support or refute the reassignment of Ek as one of the earliest ceramic complexes in the Northern Lowlands.
Assigning typological classifications for Preclassic pottery is also complicated by the production process in which pottery vessels were fired in open air kilns. Stanton and Ardren (Reference Stanton and Ardren2005:221) have noted that a lack of control over temperature leads to inconsistent outcomes with regard to the final slip color. For example, waxy wares of the Chunhinta, Dzudzuquil, and Joventud groups in many cases feature a variety of slip colors due to a lack of control of the firing process, indicating that distinguishing archaeological cultural areas, delineating migrations of ethnic groups, or making any conclusive statement regarding stylistic features may be impossible given the technological peculiarities of production at this time. Intentionality in style becomes problematic, yet refocusing on formal modes or manufacture of ceramics may ameliorate such issues. The chemical characterization study of ceramic pastes is also a means of determining how pottery is moving across the landscape.
PRECLASSIC POTTERY OF THE NORTHERN MAYA LOWLANDS
Brainerd (Reference Brainerd1958:52–53) conducted the first systematic study of Preclassic pottery in Northern Yucatan, based on collections primarily retained from Dzibilnocac, Santa Rosa Xtampak, the Cenote of Mani, and Yaxuna. Preclassic ceramics were divided based on wares, with Brainerd distinguishing broadly between burnished/slipped monochrome wares and an unslipped ware. These distinctions were largely recapitulated in Smith's (Reference Smith1971) study of the ceramics of Mayapan and several Puuc sites, and included the first classifications based on the type-variety system.
Excavations undertaken by the Middle American Research Institute of Tulane University in the 1960s at Dzibilchaltun led to the curation of the first substantial collection of Preclassic pottery from a site in the Northern Maya Lowlands. Combined with the materials obtained from a research program at Komchen undertaken in the 1980s, Andrews V (Reference Andrews V and Andrews V1986, Reference Andrews V1988, Reference Andrews V, Clancy and Harrison1990) created four ceramic complexes that spanned from the Middle to the Late Preclassic. The first complex, the Early Nabanche (700–450 b.c.), bears strong similarities to the Mamom ceramic complex found throughout the Maya Lowlands during this time. The Early Nabanche consists of three slipped groups of waxy-ware pottery: the black Chunhinta, the red Joventud, and the cream-to-buff Dzudzuquil (Andrews V Reference Andrews V1988). An unslipped ware consisting of the Achiotes ceramic group comprises another segment of this complex.
Following the Early Nabanche, Andrews V (Reference Andrews V1988) postulated the existence of a short-lived Ek complex (450–350 b.c.). The most diagnostic pottery types for the Ek complex are Almeja Burnished Grey and Kin Orange-Red, though the complex also includes an earlier iteration of the Achiotes Unslipped type. Andrews initially posited that Ek complex sherds were indicative of an intrusive population from the south, most likely from around the northern edges of the Puuc region. The placement of this complex in the Middle Preclassic sequence has been re-evaluated as an antecedent of the Early Nabanche, considering new excavation data from Kiuic and a reconsideration of the radiocarbon and stratigraphic data from Komchen, which will be discussed further below (Andrews V et al. Reference Andrews V, Bey, Gunn, Brown and Bey2018). The Late Nabanche (350–150 b.c.) phase maintains many of the stylistic and technological features of the Early Nabanche. The primary difference is the inclusion of two new ceramic groups: Sierra (characterized by a glossy red slip) and Tamanche (defined by a mottled slip with a matte finish).
Andrews V (Reference Andrews V, Clancy and Harrison1990) incorporated the Early Nabanche complex into the broader Mamom ceramic complex, based on stylistic and technological similarities between the pottery of Northern Yucatan and Mamom pottery from the Pasion region of Guatemala. Due to these similarities, he postulated that the first pottery complexes in Yucatan resulted from migration of farmers from the Pasion northward, through the Usumacinta corridor and along the western edge of Yucatan. In such a model, the first pottery complexes did not move northward through the Peten, Rio Bec, and Chenes regions, nor did pottery traditions develop indigenously. At the time, however, Andrews V's work established that the Maya founded their pottery traditions, rather than adopting those of the Mixe-Zoquean people in the Isthmian area (Andrews V Reference Andrews V, Clancy and Harrison1990:16).
Modifying Andrews V's model through their study of Preclassic ceramics recovered from cave sites in the Yalahau region of northeastern Yucatan, Rissolo and colleagues (Reference Rissolo, Ochoa Rodríguez, Ball, Shaw and Mathews2005) assert that, based on distinctions between surface treatment, manufacture techniques, and form/mode, the initial colonization of northeast Yucatan occurred around 700 b.c. This was followed by an eastward expansion in the northeast area of the peninsula by 600 b.c. Following this eastward migration, ceramic modes indicate that a second migration occurred from northern Belize into both western and eastern Yucatan. This aligns with Andrews V's explanation for migrations, but differs in that the second wave of migrants encountered already settled landscapes. However, it is worth noting that the ceramic assemblage analyzed in the Yalahau region included Kin Orange-Red sherds, suggesting the region was settled by the Ek phase, perhaps as early as 900 b.c. Overall, Rissolo and colleagues (Reference Rissolo, Ochoa Rodríguez, Ball, Shaw and Mathews2005) conclude that the similarities across the Mamom sphere are largely superficial, and that a sufficient degree of modal variation between regions indicates locally based production units, a conclusion also reached by Stanton and Ardren (Reference Stanton and Ardren2005). In their analysis of Middle Preclassic material from Yaxuna, they stress that while local populations maintained connections to Southern Lowland groups, they were most likely not migrants. Instead, pottery production appears to have developed indigenously, but local potters were willing to incorporate a diverse array of pottery-making techniques from other areas, such as Tabasco and the Southern Lowlands (Stanton and Ardren Reference Stanton and Ardren2005:225).
Undertaking a reanalysis of material from across northwestern Yucatan, Ceballos Gallareta and Robles Castellanos (Reference Ceballos Gallareta and Castellanos2012) contend that the Ek phase identified at Komchen by Andrews V is neither antecedent to nor divisive of the Early and Late Nabanche complexes (see also Robles Castellanos and Ceballos Gallareta Reference Robles Castellanos, Gallareta, Brown and Bey2018). Instead, the Ek complex should be considered a sub-complex of ceramics found only at Komchen, and therefore does not constitute a regional or supra-regional complex. For example, Almeja Burnished Grey (a diagnostic type of the Ek complex) is not found at many sites in central or eastern Yucatan, while even Kin Orange types are typically found intermixed with Early Nabanche materials (Ceballos Gallareta and Robles Castellanos Reference Ceballos Gallareta and Castellanos2012:412). Based on a re-evaluation of radiocarbon dates associated with Early Nabanche materials, the earliest pottery complexes in Yucatan are said to date to 1000 b.c. rather than 900–800 b.c. Robles Castellanos and Ceballos Gallareta (Reference Gallareta Negrón, Brown and Bey2018:234) argue that the regional variations of early Middle Preclassic pottery eventually coalesced into the “waxy” wares that characterize the late Middle Preclassic. Based on both our ICP-MS analysis and the work of Andrews V and colleagues (Reference Andrews V, Bey, Gunn, Brown and Bey2018), we argue that these regional variants dating to the early Middle Preclassic constitute a more uniform supra-regional tradition that is typically produced locally and characterized by post-slip fine-line incision in geometric patterns that are similar across the Northern Lowlands. These early Middle Preclassic ceramic types are distinct from, yet ancestral to, Early Nabanche ceramics with regard to form and surface treatment.
A recent Bayesian analysis of radiocarbon dates and their associated ceramic groups by Inomata and colleagues (Reference Inomata, Triadan, MacLellan, Burham, Aoyoma, Palomo, Yonenobu, Pinzón and Nasu2017) places the earliest ceramics of Komchen as cotemporaneous with Real 2 phase and possibly the Real 1 phase at Ceibal. In addition, the recovery of Ek materials in the lowest layers at the sites of Kiuic, Paso del Macho, Yaxhom, and Xocnaceh stratigraphically reinforces the placement of Ek as the earliest ceramic complex in the Northern Lowlands.
DATA
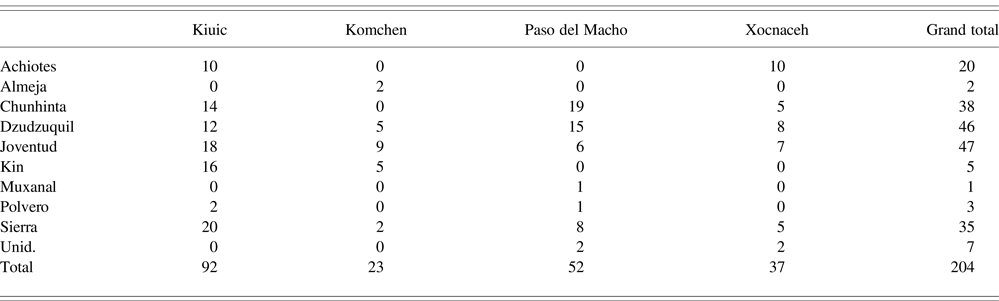
A 204-sherd sample was drawn from four sites in the northwest part of the peninsula (Table 1). Samples were selected from Komchen (n = 23), an important Middle and Late Preclassic settlement located near the coast in the northwest part of the peninsula, and 37 sherds were selected from Xocnaceh, one of the largest Middle Preclassic sites found to date in the Northern Maya Lowlands, located on the eastern edge of the Puuc region. The largest sample came from Kiuic (n = 92), located in the southern Bolonchen region of the Puuc Hills. Though never a major center, Kiuic has an uninterrupted occupation from the Middle Preclassic (ca. 900 b.c.) until the Terminal Classic, with abandonment occurring between a.d. 950 and 1000. Finally, samples were selected from Paso del Macho (n = 52), a small Middle Preclassic village 8 km to the north of Kiuic, featuring a single plaza with eight platforms, including a ballcourt. Middle and Late Preclassic types with a wide geographic span are represented in the data set (Table 1).
Listing of ceramic groups with provenance from analyzed sample. Unid: unidentified sherds.
Pottery is a multi-component technology, featuring materials from several different geologic sources, which poses problems for identifying points of origin (Neff Reference Neff1993). This issue can be avoided by making comparisons between the elemental compositions of objects from different sites (Malainey Reference Malainey2010:170; Sempowski et al. Reference Sempowski, Nohe, Hancock, Moreau, Kwok, Aufreiter, Karklins, Baart, Garrad and Kenyon2001).
Each sherd underwent laser ablation inductively coupled plasma mass spectrometry (LA-ICP-MS) analysis in the W.M. Keck Center for Instrumental and Biochemical Comparative Archaeology Lab. LA-ICP-MS is now one of the most widely utilized analytical chemistry techniques in archaeology. It can be used to detect trace elements in archaeological samples with limits as small as parts per billion. During the analysis, samples of artifacts are raised to a temperature of 10,000 °C, leading to the ionization of the atoms in the sample. The positive ions are focused using a lens system and then selected by mass-to-charge ratio using a mass filter (Pollard et al. Reference Pollard, Batt, Stern and Young2007:197). The impact of the ions is then recorded by a sensor and the elemental signature is ascertained.
Neutron activation analysis (NAA) is another commonly adopted technique in compositional analysis. It differs from LA-ICP-MS in several regards, most notably in what types of elements can be tested and in that NAA requires a nuclear reactor for analysis. NAA is slightly more accurate (4.7 percent) than LA-ICP-MS, but not to such an extent that could lead to major errors in provenance studies (James et al. Reference James, Dahlin and Carlson2005).
Each sample was ground using a mortar and pestle into a fine powder, placed into a 15 mL polypropylene test tube, and covered to prevent contamination. All plastics used were acid-washed for 12 hours in a metal-free 8 percent nitric acid bath. To prepare a liquid sample, about 0.1 g of a powdered sample was digested in 6 mL of hydrofluoric acid and 3 mL nitric acid, using a Milestone ETHOS E2 microwave, first for 15 minutes, then for 30 minutes, at a constant 180 °C temperature, using 1200 W power settings. Once the microwave cycle was complete, 25 mL of 3 percent boric acid solution was added to each sample to complexify the hydrofluoric acid. The chambers were resealed and heated again, using the same settings as before. Each liquid sample was then diluted to approximately 50 mL, using a 1 percent nitric acid solution. Finally, to produce the final sample for analysis, an aliquot of approximately 0.2 g derived from the larger portion was diluted to a final mass of approximately 10.0 g, and the dilution factor recorded.
To control for accuracy, a vessel containing only the acid solution was also analyzed for each round of analysis, allowing background correction. In addition, a soil sample that had been previously characterized by ICP-MS was included as a secondary standard. The National Institute of Standards and Technology standard 1643e was analyzed prior to sample analysis to ensure accuracy. Calibration curves were created at 10, 50, 100, 200, and 500 ppb, with Inorganic Ventures standard 71A. The internal standard was 5 ppb Inorganic Ventures standard 71D. After obtaining results for 25 trace elements for each sherd, elemental outliers were removed and the results from both analyses were averaged.
All information from the analysis, along with several nominal variables, including archaeological provenance (where the sherd was found), ceramic group, ceramic type, and ceramic variety, were recorded for each sherd in a database. In many instances, sherd types and/or variety designations were unidentifiable. These are limitations imposed by the lack of study on Preclassic ceramics in the Northern Lowlands, as well as the high degree of erosion due to the shallow soils of the region.
The elemental variables in the data set are considered numeric interval data. Unlike attribute or assemblage data, compositional data operates on a fine scale, at parts per million. Because each element can differ in its magnitude so drastically from other elements in a sample, standardization of the data occurred prior to each statistical test. All statistical tests performed for this paper were run on JMP8 software, a variant of SAS that is specifically engineered for the visual analysis of patterning.
ANALYSIS
Compositional studies have utilized a variety of techniques for the statistical analysis of chemical data. The two tests most often utilized are principal components analyses and canonical discriminant function analyses (e.g., Backes et al. Reference Backes, Cheetham and Neff2012; Neff et al. Reference Neff, Blomster, Glascock, Bishop, James Blackman, Coe, Cowgill, Diehl, Houston, Joyce, Lipo, Stark and Winter2006). For this analysis, we utilize three different statistical tests: Q-mode Ward's method hierarchical cluster analysis, principal factor analysis, and canonical discriminant function analysis. The cluster analysis was utilized as an exploratory technique to view the interrelatedness of each sherd to every other sherd. However, this cluster analysis must be compared to other tests to establish the legitimacy and significance of its results. Canonical discriminant function analysis fulfilled this purpose while also assessing the degree of association between sherds from different areas. Finally, we utilize principal factor analysis to determine which of the 25 trace elements is contributing the most variance to the sample. Bivariate scatterplots of standardized compositional data for different elements can then be produced to detect patterning of clay composition by site. In this case, principal factor analysis would be used to discover which elements distinguish sherds from one location to another.
Q-Mode Ward's Method Hierarchical Cluster Analysis
Hierarchical cluster analysis is a statistical method that groups cases based on their statistical similarity. These cluster analyses are assessed via the inspection of dendrograms, which are visualizations of bundles of similarities between cases. Squared Euclidean distance numbers are calculated between cases, and they are then agglomerated utilizing a systematic grouping method. In this case, we chose Ward's method of agglomeration because of its usefulness with large multi-variate datasets and because it decreases within-group variance by minimizing the increase in total within-cluster sum of squared error (Szekely and Rizzo Reference Szekely and Rizzo2005:152). Three Ward's method cluster analyses were created for the entire data set. All analyses utilized the chemical elements as their variables.
Analysis of Site Provenance
One cluster analysis was labeled with site provenance (Appendix Figure 1). Clusters formed well along these dimensions, especially for the sites of Xocnaceh and Komchen. There was a significant amount of overlap and clustering between sherds from Paso del Macho, Kiuic and, to a lesser extent, Xocnaceh. Three sherds from Komchen clustered with a large body of Kiuic sherds, possibly indicative of trade between these two sites. Likewise, a Komchen sherd clustered with several Xocnaceh sherds. Sherds from Kiuic, Paso del Macho, and Xocnaceh clustered together intermittently, although smaller clusters were typically formed by single sites.
Analysis of Ceramic Groups
Another cluster analysis that examined ceramic groups was undertaken (Appendix Figure 2). Very few patterns of association between ceramic groups were discerned. Achiotes group sherds from several sites clustered much better than other groups, indicative that production of these sherds may have been drawn from a different clay source or utilized different tempers than sherds from other groups. Chunhinta and Dzudzuquil sherds from the site of Paso del Macho also clustered very well, although this may be a result of increased sample size or the use of similar pastes but differential surface treatment. If pottery production occurred locally, then regional clay variability would more than account for why groups would not link across space.
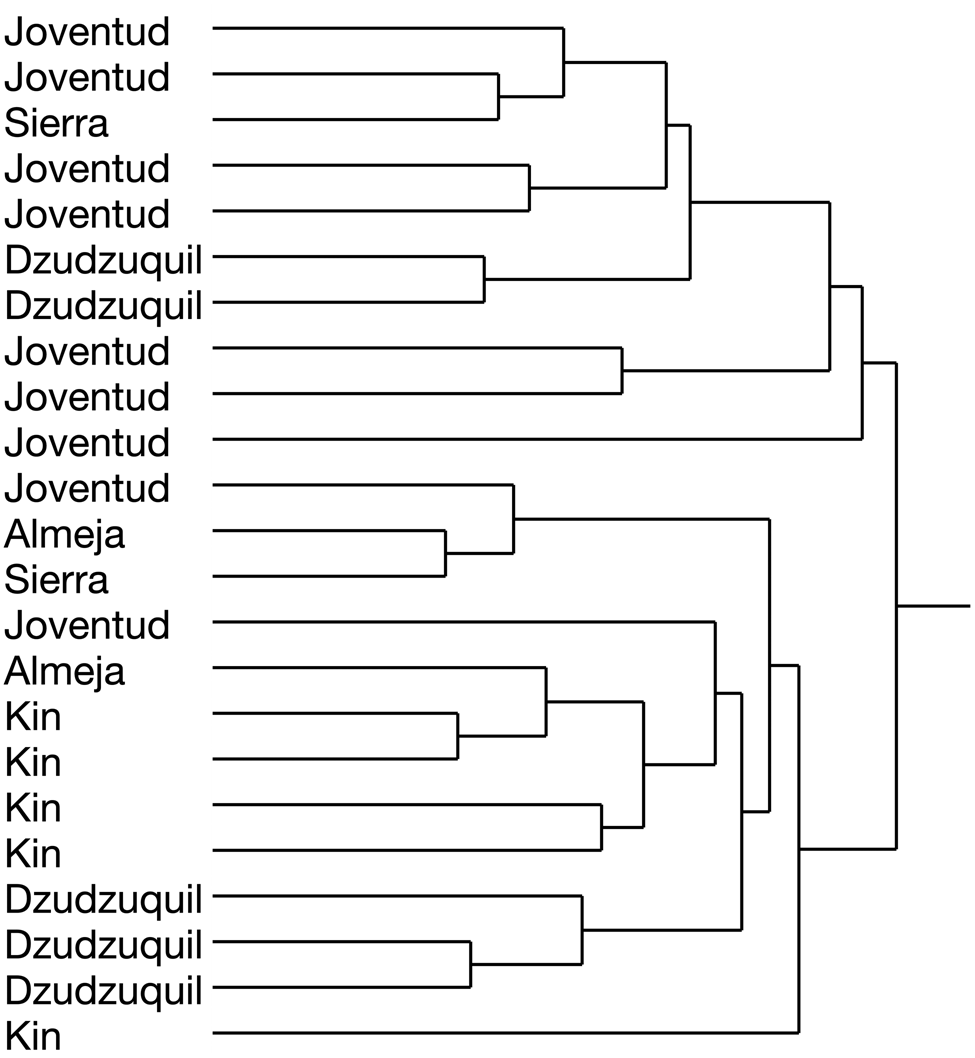
Analysis of Ceramic Types
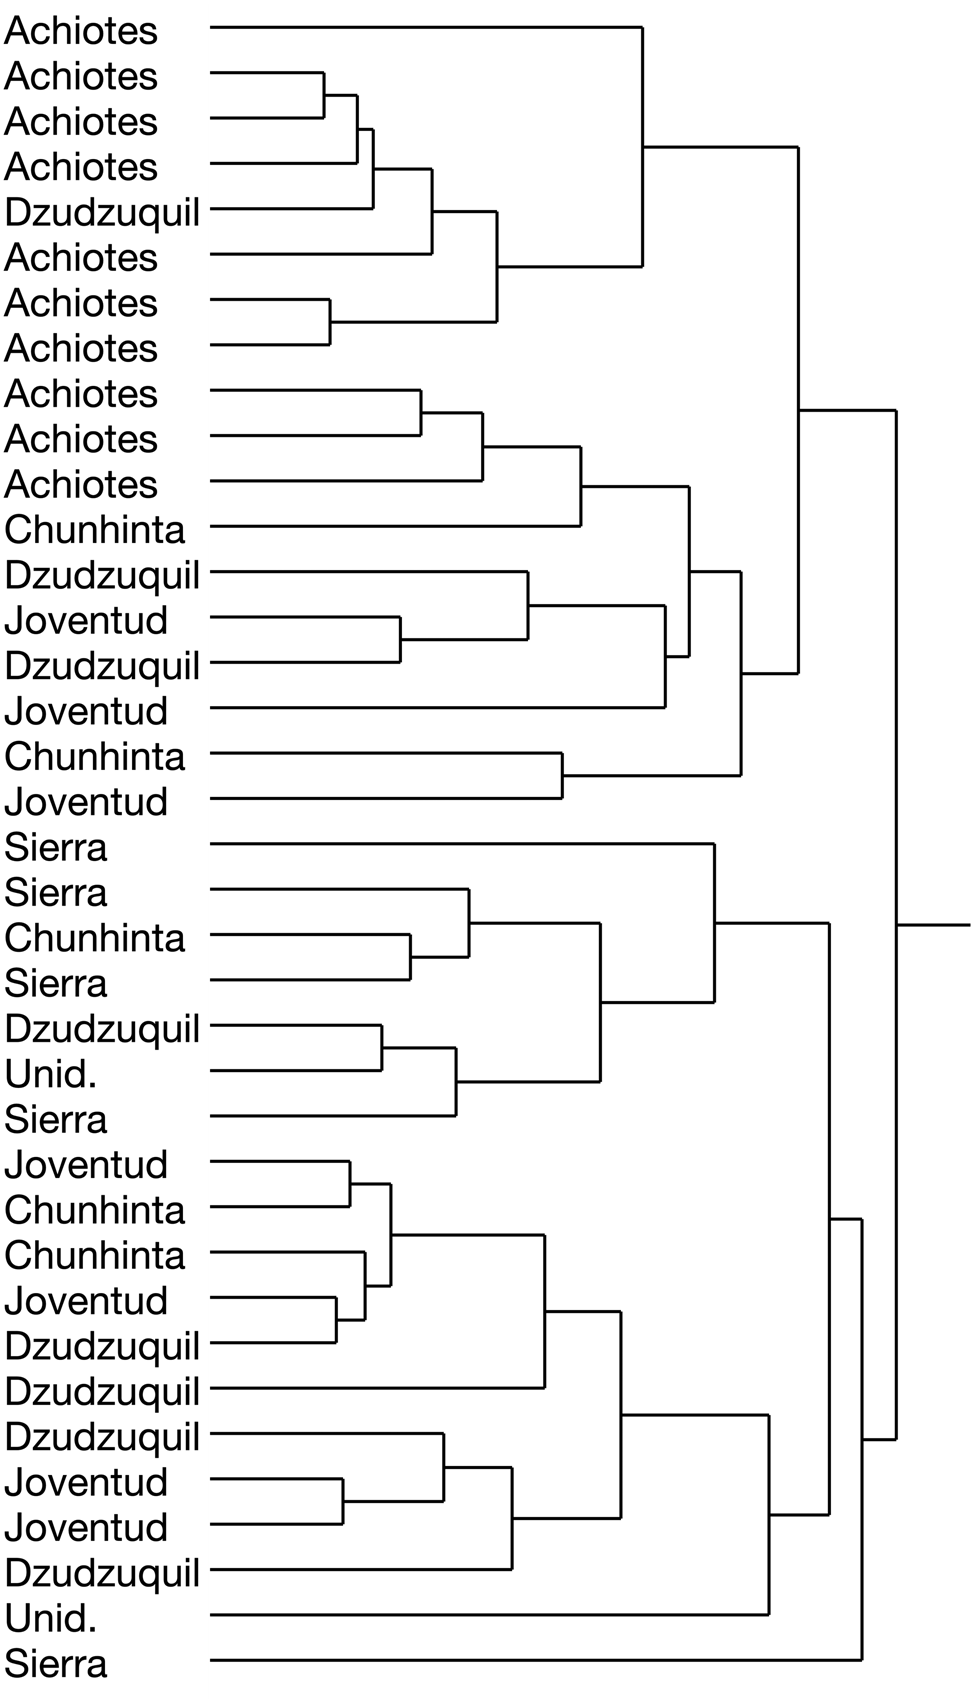
Are any patterns revealed for clusters at the site level regarding ceramic types? The most noticeable patterning is that sherds from the Achiotes group always cluster together at the site level (e.g., Figure 2), although they do not cluster across sites (Appendix Figure 2). At Komchen (Figure 3), Kin Orange-Red sherds cluster tightly and are clustered with Almeja Burnished Gray sherds. Both Kin and Almeja are Ek phase sherds, suggesting that clay extraction areas differed between the Ek and Early Nabanche phases. Examination of the Komchen ceramic group dendrogram indicates a clear break in Middle Preclassic Nabanche and Ek complexes, indicative of changes in clay composition through time. At Xocnaceh (Figure 2), Achiotes sherds once again clustered very tightly regardless of whether they were Ek or Early Nabanche complex sherds, indicating an overlap in clay extraction between these two phases.
Dendrogram with pottery type labelled from Ward's method hierarchical cluster analysis of pottery sherds from Xocnaceh. Unid: unidentified sherds. Image by the authors.
Dendrogram with pottery type labelled from Ward's method hierarchical cluster analysis of pottery sherds from Komchen. Unid: unidentified sherds. Image by the authors.
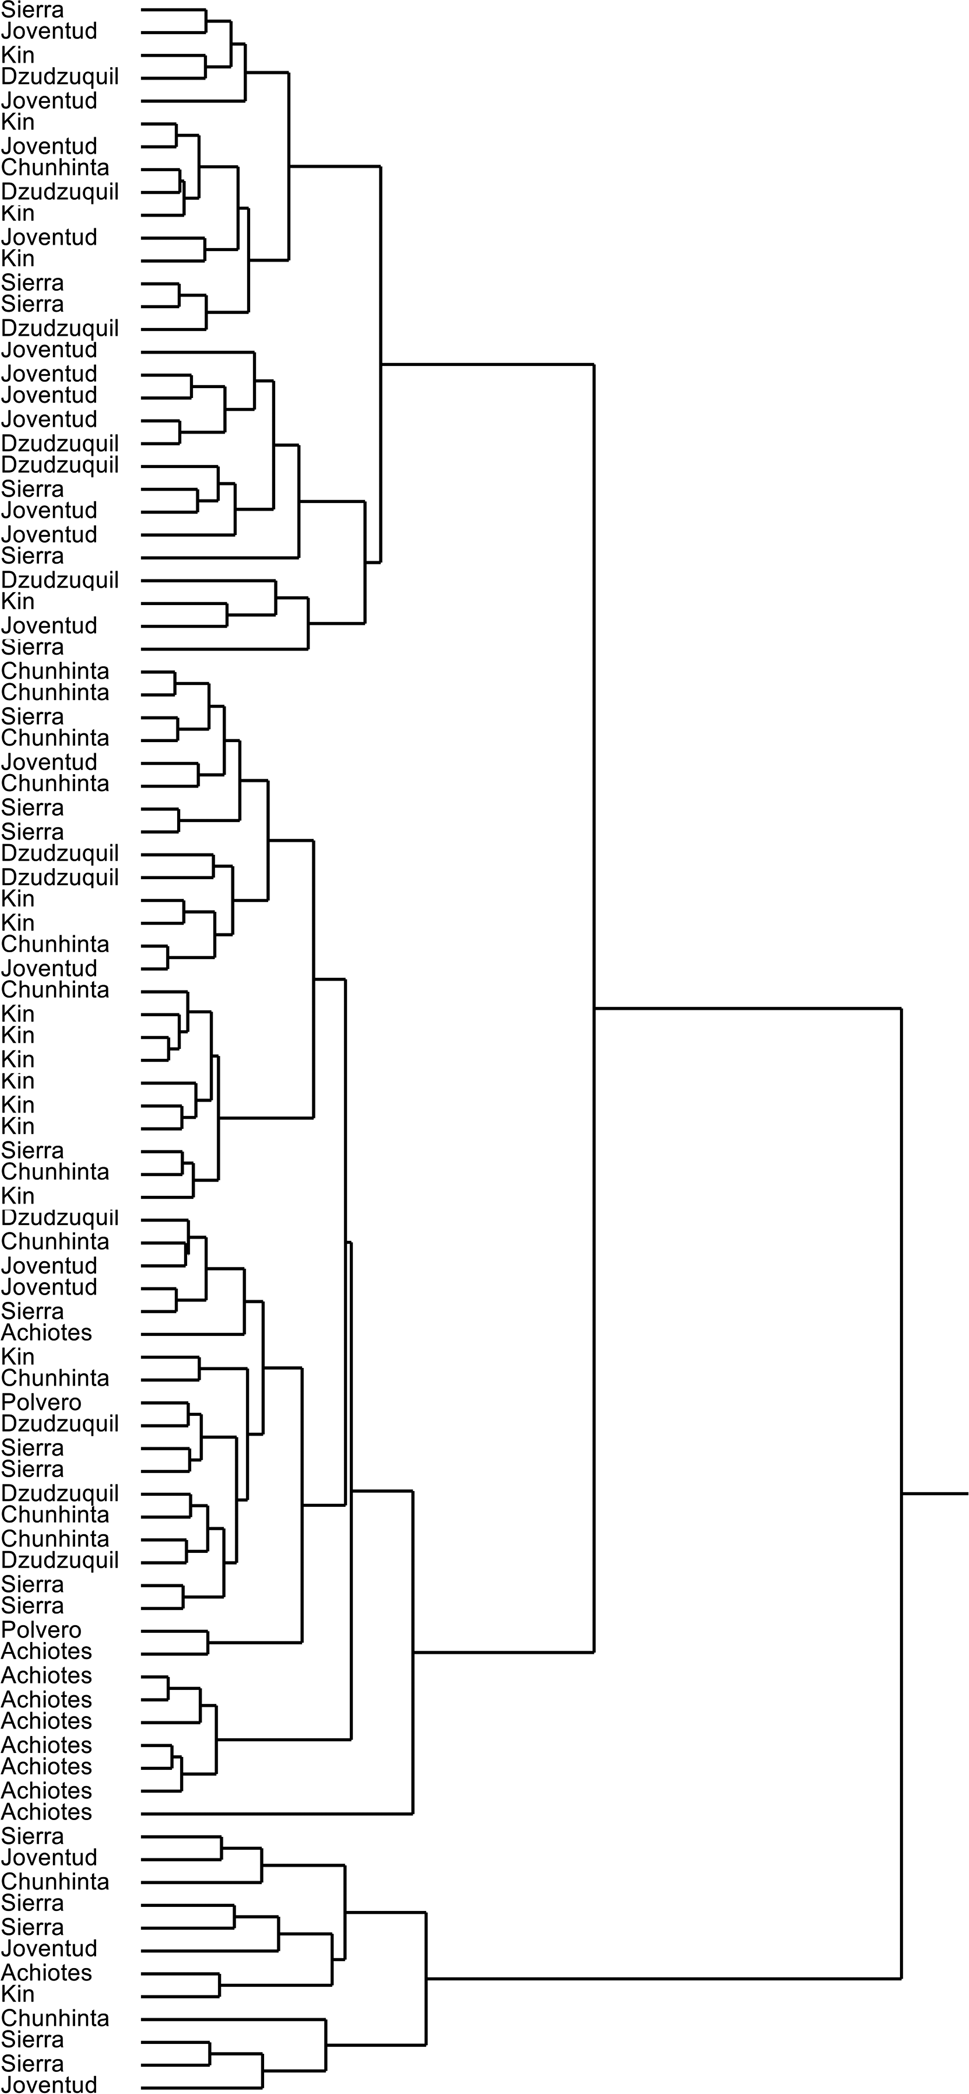
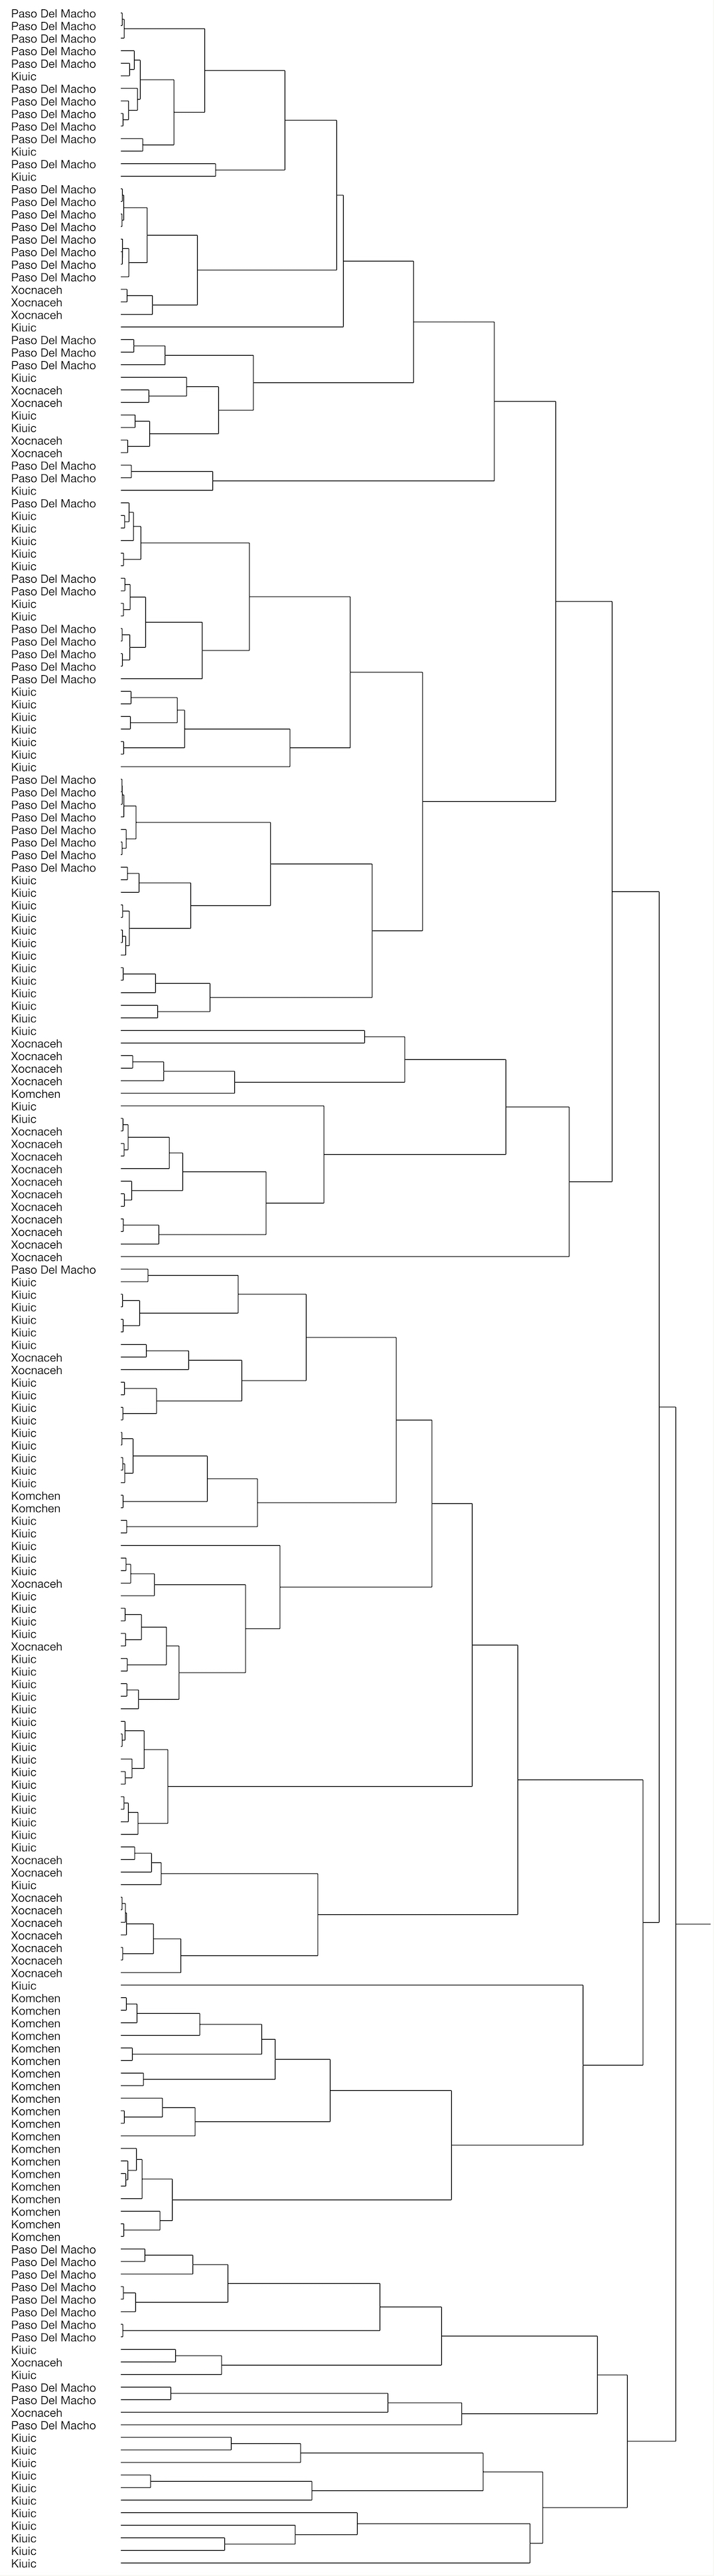
Due to their larger sample sizes, the dendrograms for Paso del Macho and Kiuic do reveal some patterning with regard to ceramic types (Figures 4 and 5). Dzudzuquil and Chunhinta sherds typically form the majorities of several clusters, whereas Joventud and Sierra comprise most others. Joventud and Sierra are both red wares, whereas Dzudzuquil is cream-to-buff wares, and Chunhinta is black wares. Although red wares do cluster with black and cream, they seem to cluster with each other much more frequently, especially among sherds found at Kiuic. The clustering of cream and black wares indicates that clay extraction sources for both were overlapping, but that firing processes resulted in variability.
Dendrogram with pottery type labelled from Ward's method hierarchical cluster analysis of pottery sherds from Paso del Macho. Unid: unidentified sherds. Image by the authors.

Dendrogram with pottery type labelled from Ward's method hierarchical cluster analysis of pottery sherds from Kiuic. Unid: unidentified sherds. Image by the authors.
Chronological Distinctions
The most important aspect of the Kiuic site cluster analysis is that Ek phase sherds from the Kin group form a discrete cluster among the larger body of sherds found at the site (Figure 5). Given that this clustering is apparent in the analyses both within the Kiuic sample and among the larger sample, two conclusions may be drawn. First, the earliest pottery found at Kiuic was manufactured locally, as indicated by the continued association of Ek sherds within the larger body of the Kiuic sample. Second, the production of Ek phase sherds appears to have involved the procurement of clay sources that were not widely utilized during the Early and Late Nabanche phases. Regardless, the first widely recognized pottery style in northwest Yucatan is similar in form, slip color, and incision pattern from as far north as Komchen to as far south as Kiuic (Andrews V et al. Reference Andrews V, Bey, Gunn, Brown and Bey2018:82). Yet despite the pervasiveness of this style across space, the chemical characterization study indicates that production of Kin Orange-Red and Almeja Burnished Gray was still occurring locally.
Discriminant Function Analysis
Discriminant function analysis can be utilized to ascertain the role of different variables in separating cases into categories. This method is used to predict dependent variables like sites, clay extraction source, or pottery group, all based on a set of observed independent variables, which in this case are standardized quantities of traced elements from the ICP-MS analysis. For this study, canonical discriminant function analyses were utilized to ascertain production origins and relate them to their archaeological provenances. Of the 204-sherd sample, only 17 sherds (8.33 percent) were identified as non-local from the four selected sites (Table 2).
Discriminant function analysis results by pottery group.
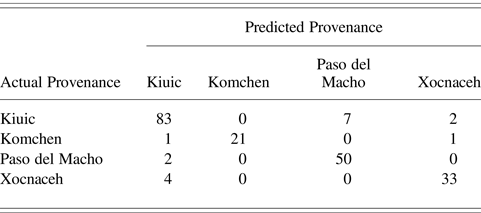
Discriminant Function Analysis for Determining Site Provenance
For Kiuic, 83 sherds found at the site were predicted to have been produced there. The analysis grouped seven of the Kiuic sherds as being non-local and most like the sample from Paso del Macho, and two were grouped with sherds from Xocnaceh. These are unsurprising results, as these three sites are geographically proximate and may have engaged in limited exchange. In addition, Kiuic and Paso del Macho may possess overlapping clay sources due to their relative proximity, which could account for some of the overlap.
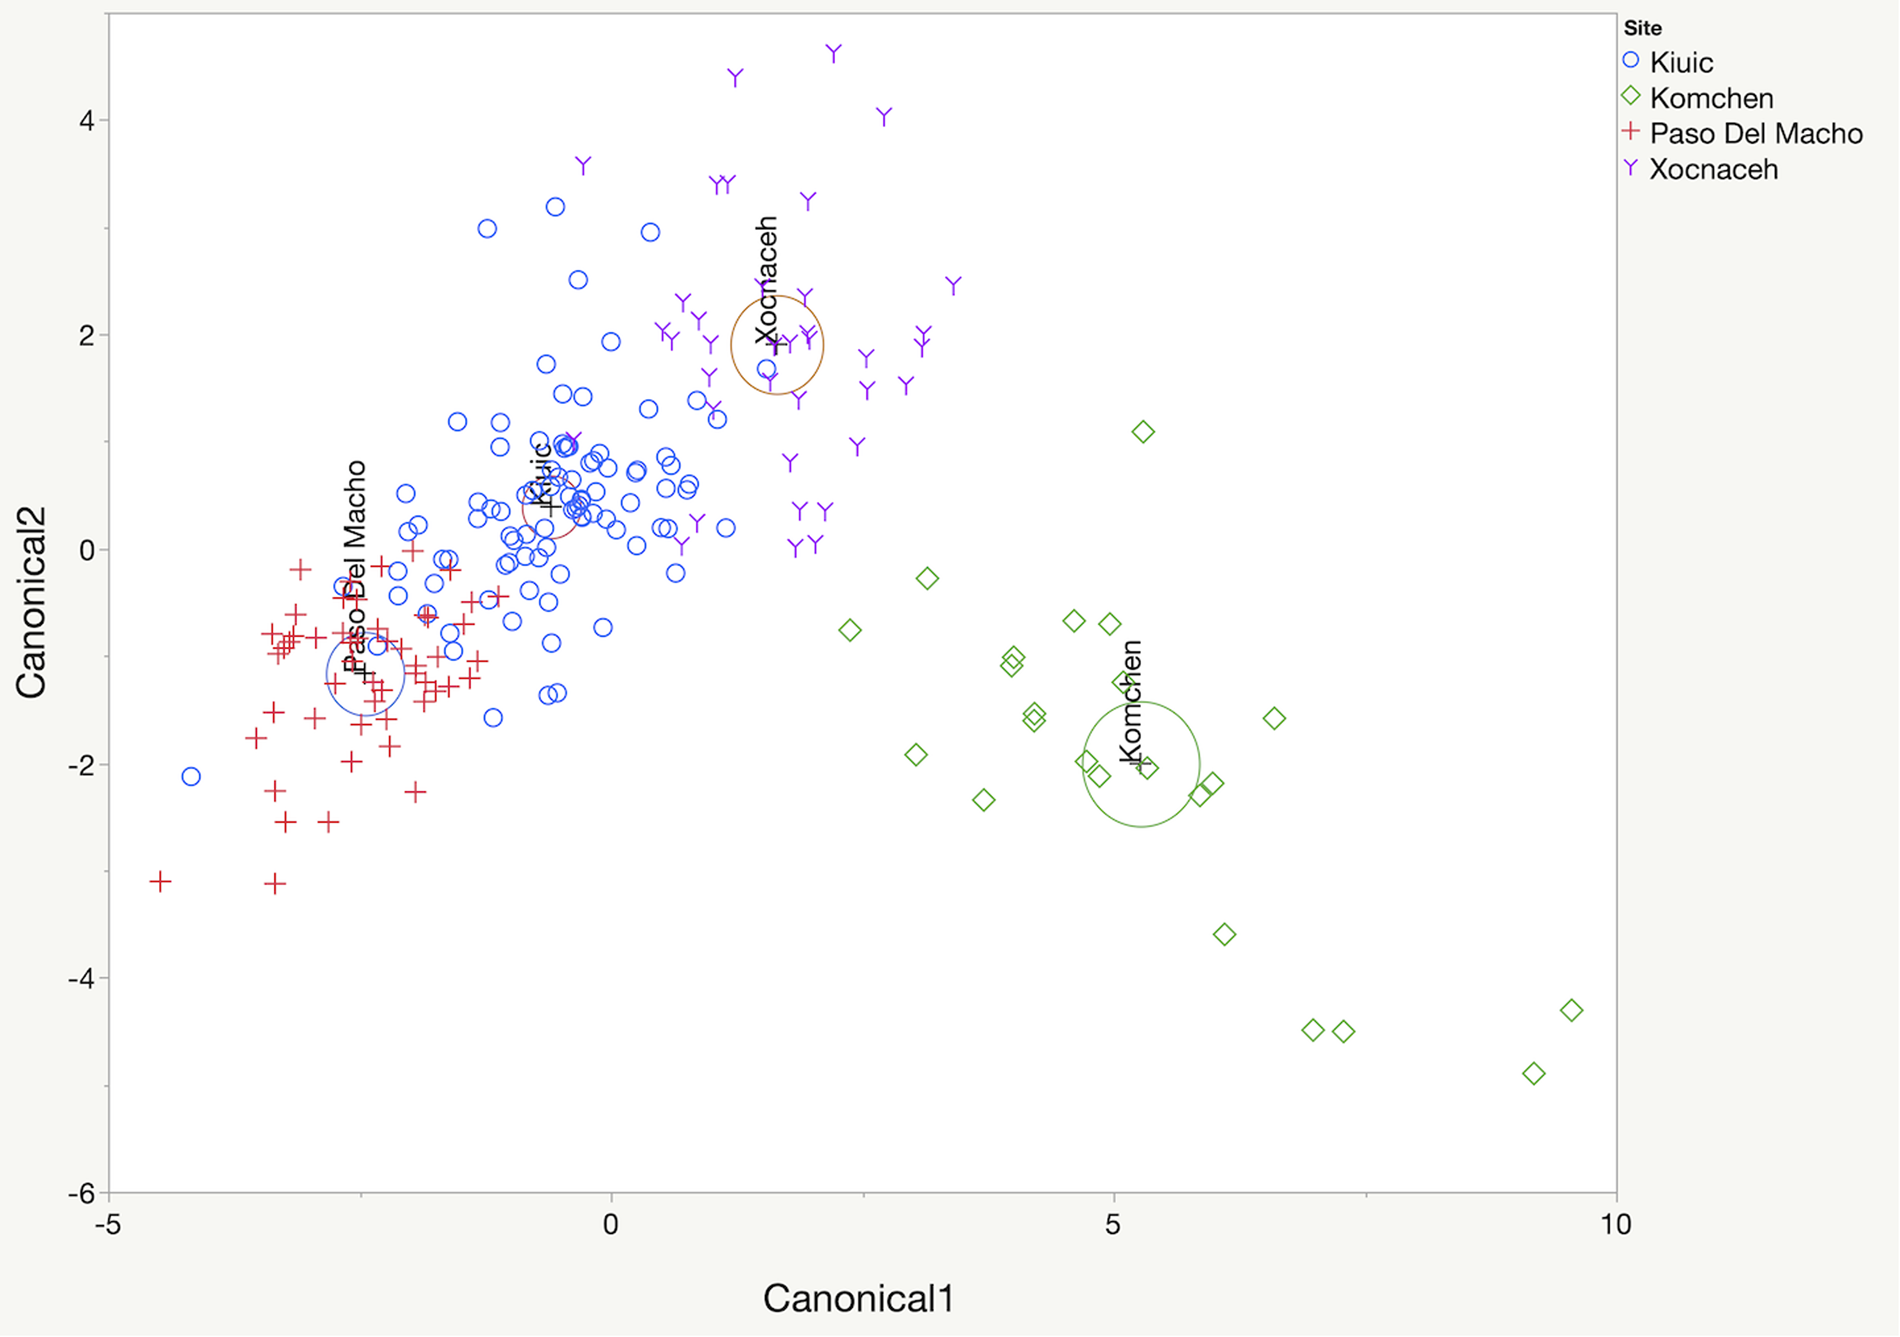
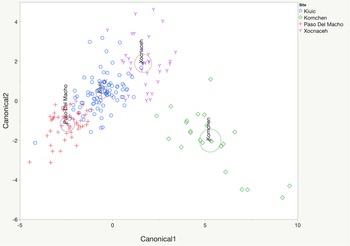
Of the 23 Komchen sherds, 21 were identified as local. One sherd found at Komchen was grouped with the sample from Xocnaceh, while another was lumped with Kiuic sherds (Figure 6). Exchange between Komchen and Kiuic is supported by the clustering of three sherds recovered from Komchen, with the bulk of the sherds recovered from Kiuic. Based on the discriminant function analysis, 50 of the 52 Paso del Macho sherds were grouped together, while the remaining two were grouped with the sample from Kiuic (Table 2). Finally, the discriminant function analysis indicated that 34 of the 37 sherds found at Xocnaceh were of local origin. The remaining four were identified as non-local sherds grouped with the Kiuic sample.
Canonical plots of discriminant function analysis of site prediction. Image by the authors.
Overall, the conclusions gleaned from the discriminant analysis function support the Ward's method cluster analysis. Kiuic and Paso del Macho sherds overlap the most in the cluster dendrogram. Xocnaceh sherds typically form their own clusters, but are interspersed with Kiuic sherds. Overall, the discriminant function analysis of site provenance suggests that only limited exchange was occurring between settlements, though sherds identified as non-local may certainly be from other nearby Preclassic sites that were not included in the analyzed sample, but share some overlapping clay extraction zones.
Discriminant Function Analysis for Ceramic Group Membership
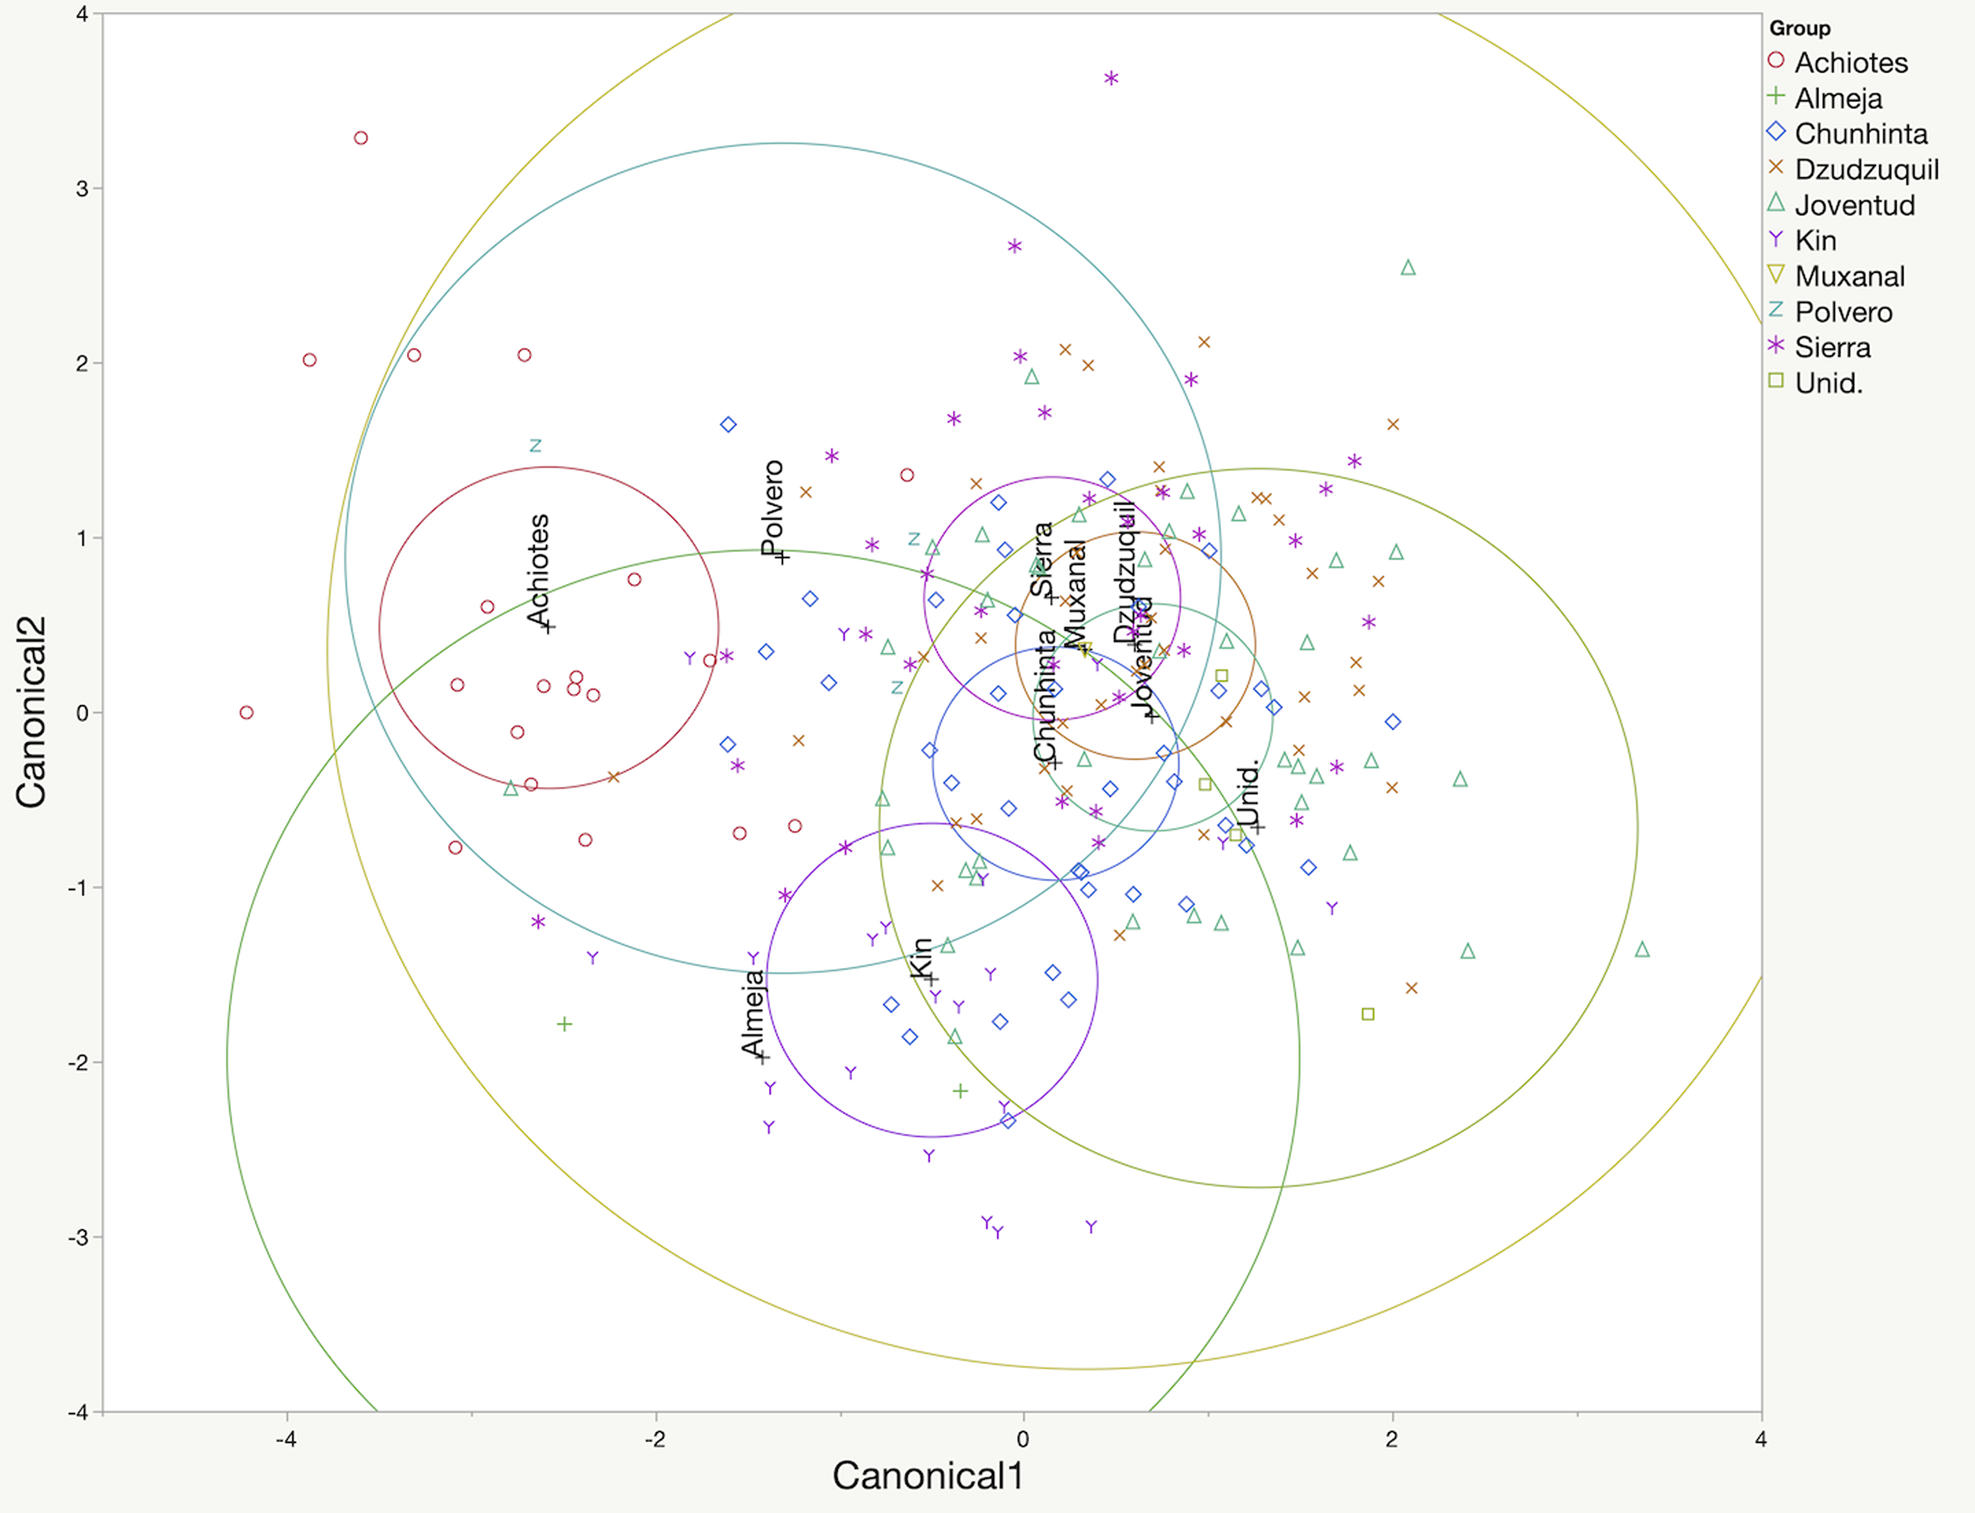
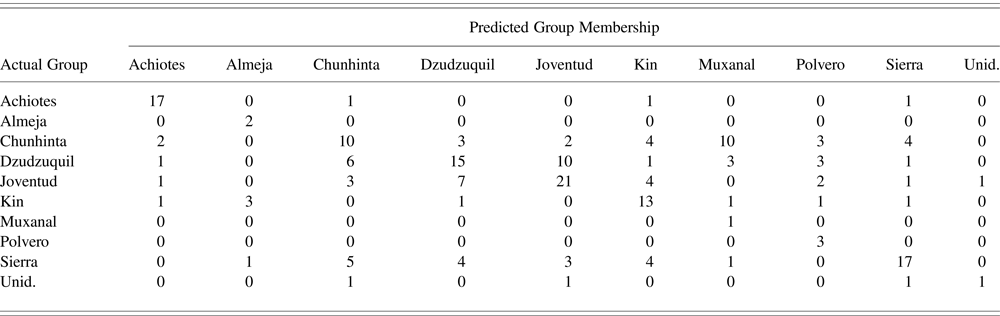
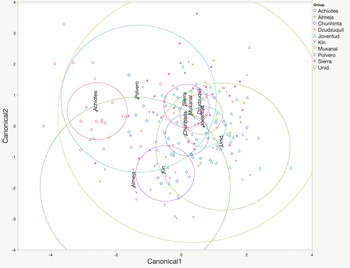
A discriminant function analysis for ceramic group membership was also conducted to assess the validity of typological distinctions based on surface treatment made by ceramicists (Table 3). The results were considerably more muddled than determination of site provenance. Of the 204 sherds, 100 (49.02 percent) were determined to have a different group membership than that assigned by the ceramicist. Visual examination of the scatterplot for Canonical Scores 1 and 2 indicates that discrimination between groups based on sherd composition is problematic (Figure 7). However, some ceramic groups were lumped together more often than others. Of the 20 Achiotes group sherds, 17 (85 percent) were clustered, supporting the results of the cluster analyses that the composition of these sherds is very different from others, likely due to the different paste composition utilized for this coarse utilitarian ware. The classifications for every other ceramic group matched a ceramicist's classification only around 50 percent of the time, suggesting that groups such as Dzudzuquil, Joventud, and Chunhinta likely only differed in surface treatment as opposed to paste composition.
Canonical plots of discriminant function analysis of pottery group prediction. Unid: unidentified sherds. Image by the authors.
Actual versus predicted classifications of pottery group based on the discriminant function analysis. Unid: unidentified sherds.
Chronologically, sherds that were identified as belonging to the earlier Ek phase (900–700 b.c.) were typically lumped together by the discriminant function analysis. For example, 9 of the 11 Ek phase sherds from Kiuic were assigned to the same group, mirroring the results from the cluster analysis.
Principal Component Analysis
Principal component analysis is a statistical technique utilized to group a possible set of correlated variables into a linearly aligned, but uncorrelated grouping of variables. Each of these groupings is considered a principal component, with the first component encapsulating the most variability. This test is typically used as an exploratory form of analysis that can lower the number of dimensions of variability to a level that is more amenable to discovering those variables that account for the most change. Eigenvalues were computed utilizing a correlation matrix. Twenty-five principal components were originally extracted. A scree plot of eigenvalues versus number of components was utilized to assess the contributed variance for the total sample. Based on the scree plot, two components were extracted for rotation. Analysis of rotated factor loadings and of a factor-loading plot leads to several conclusions (Table 4).
Factor loadings for a principal factor analysis of geochemical composition.
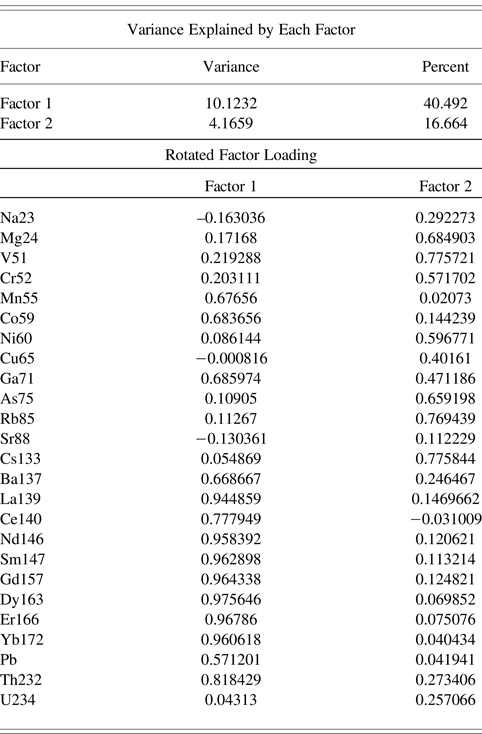
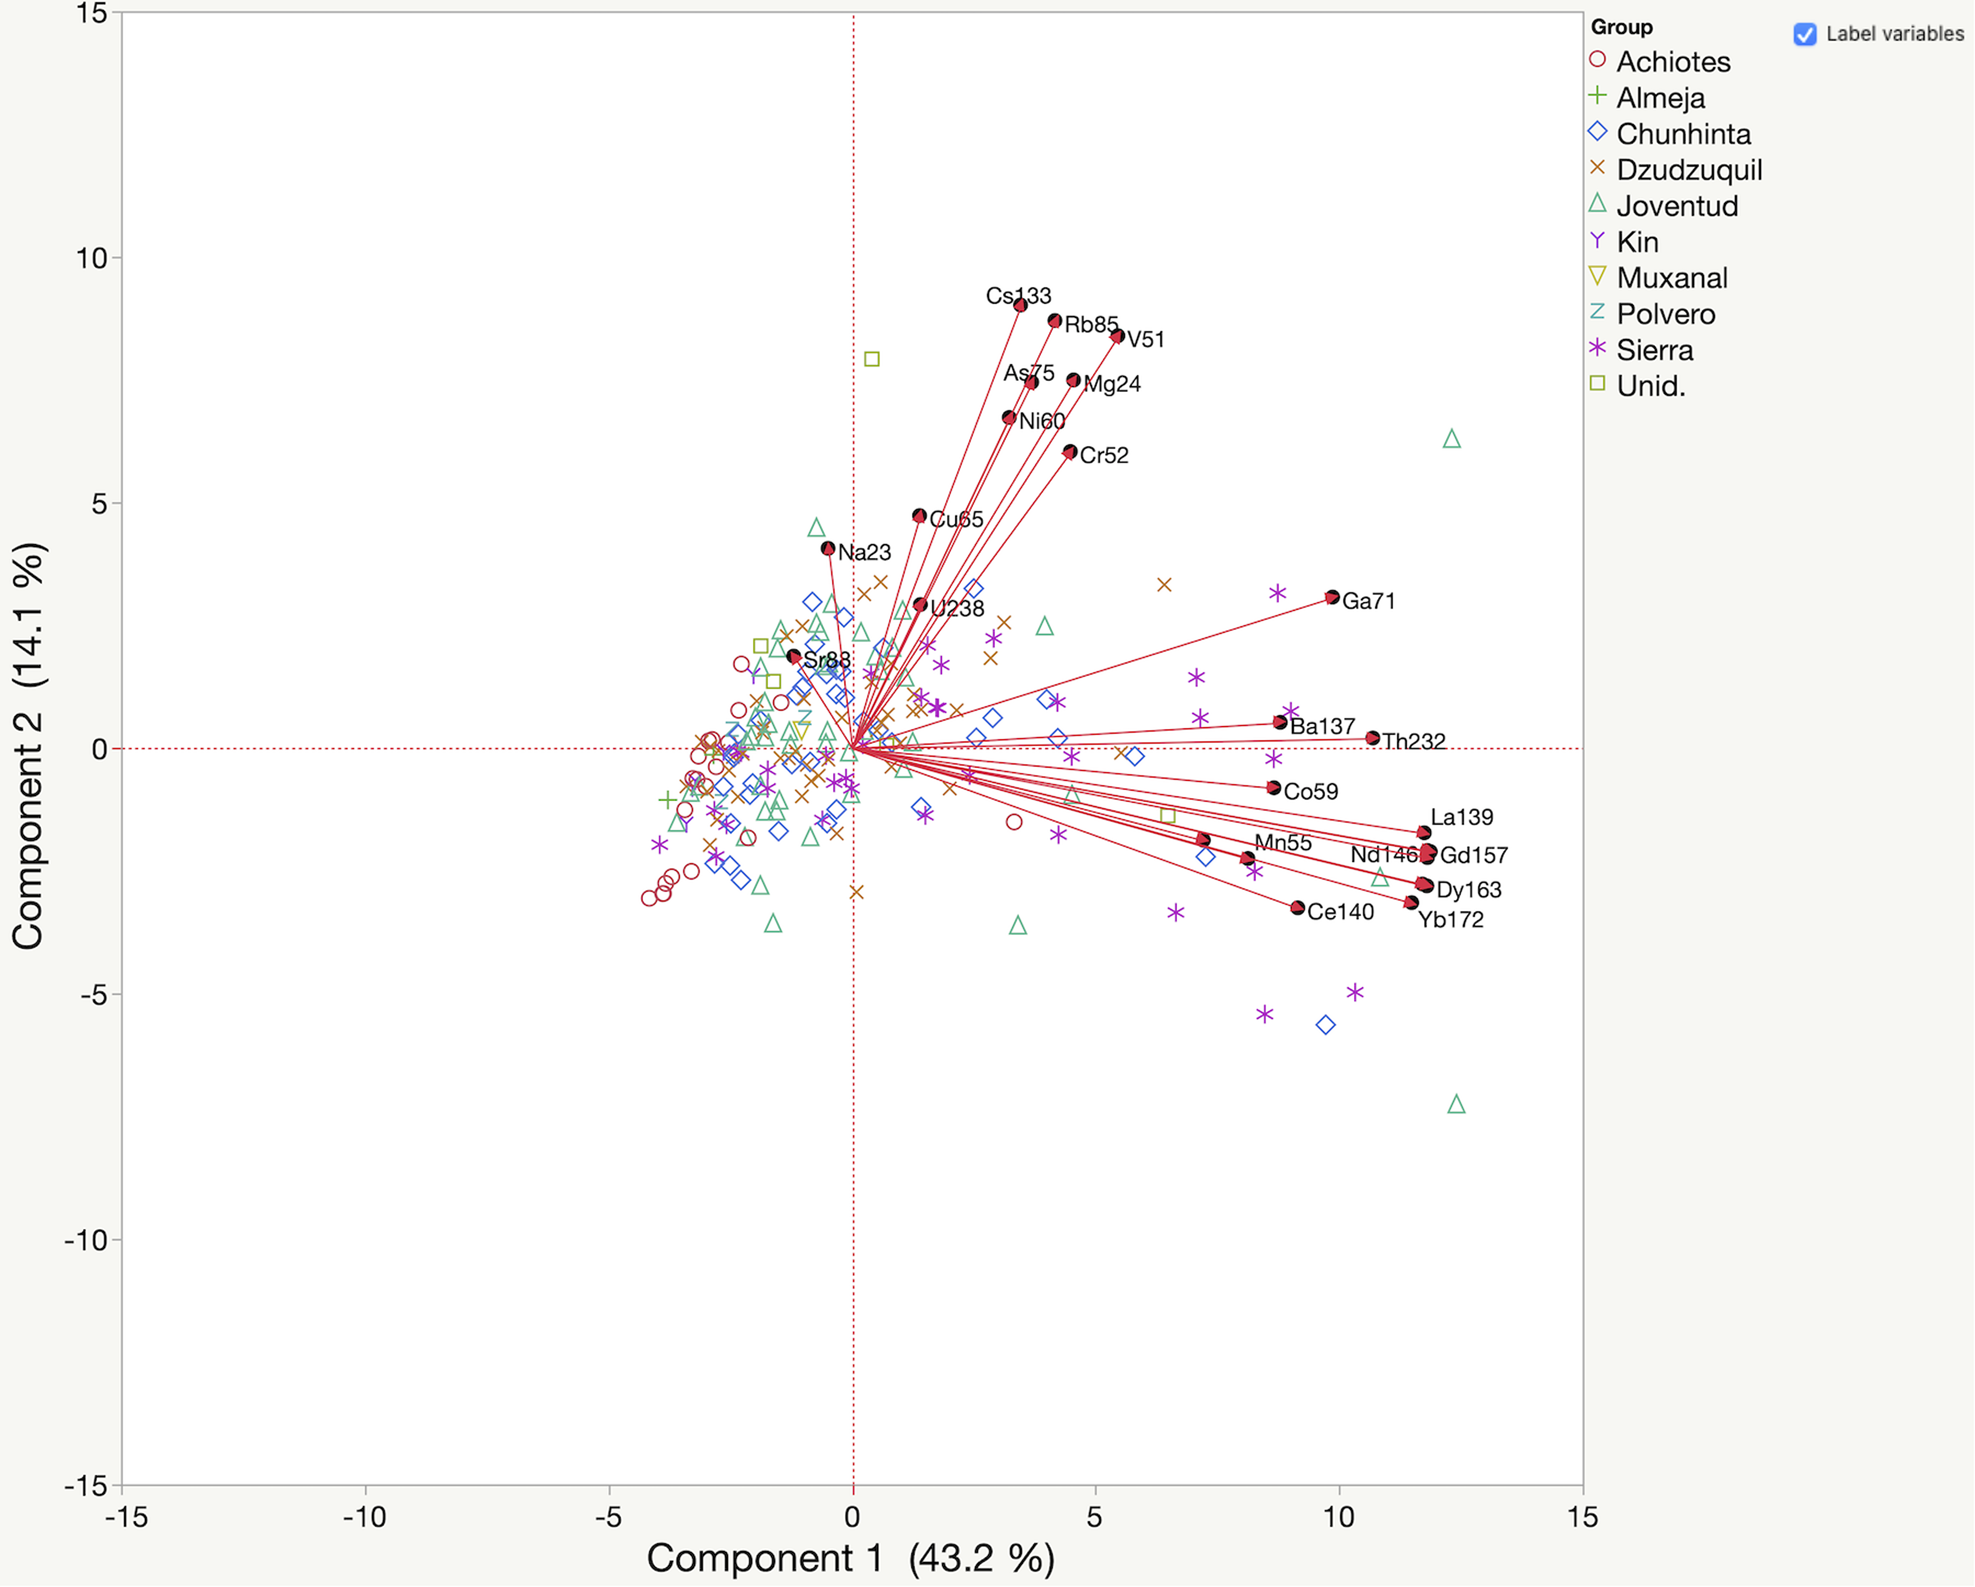
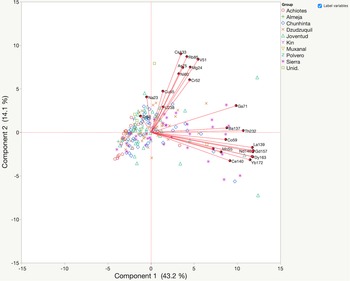
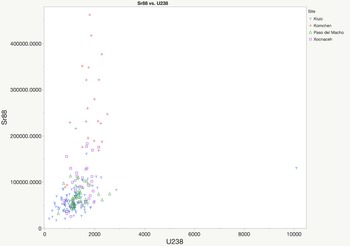
First, several elements contribute more variability to the sample than others do. Factor 1 had especially high factor loadings for La, Nd, Sm, Gd, Dy, Er, and Yb, while Factor 2 had higher scores for Rb, Cs, and V. However, examinations of bivariate plots for many of these elements did not lead to many conclusions. In many cases, outliers appear to have contributed substantially to variability. A biplot of the first two factor scores overlaid with the factor loadings lends clarification (Figure 8). Both Sr and Na have exceptionally low factor scores. However, they also maintain a fair amount of distance from the factor loadings when placed on a scatterplot. On a bivariate scatterplot of Sr and Na, it becomes apparent that Sr is a stronger discriminator for sherds from Komchen, whereas Na separates several of the Kiuic sherds, indicative of either differing tempering strategies at the two sites or different areas of clay extraction (Figure 9). Likewise, neither Cu nor U have high factor loadings, but their positions on the factor-loading plot separates them from the higher loadings (Table 4). These elements distinguish Kiuic and Komchen sherds from the other two sites. Why are these variables with low factor loadings on the first two components separating sherds by site? An examination of the factor loadings for all 25 principal components provides several answers.
Bivariate plot of component scores with factor loadings by chemical element. Unid: unidentified sherds. Image by the authors.
Bivariate plot by site of Sr and Na concentrations. Image by the authors.

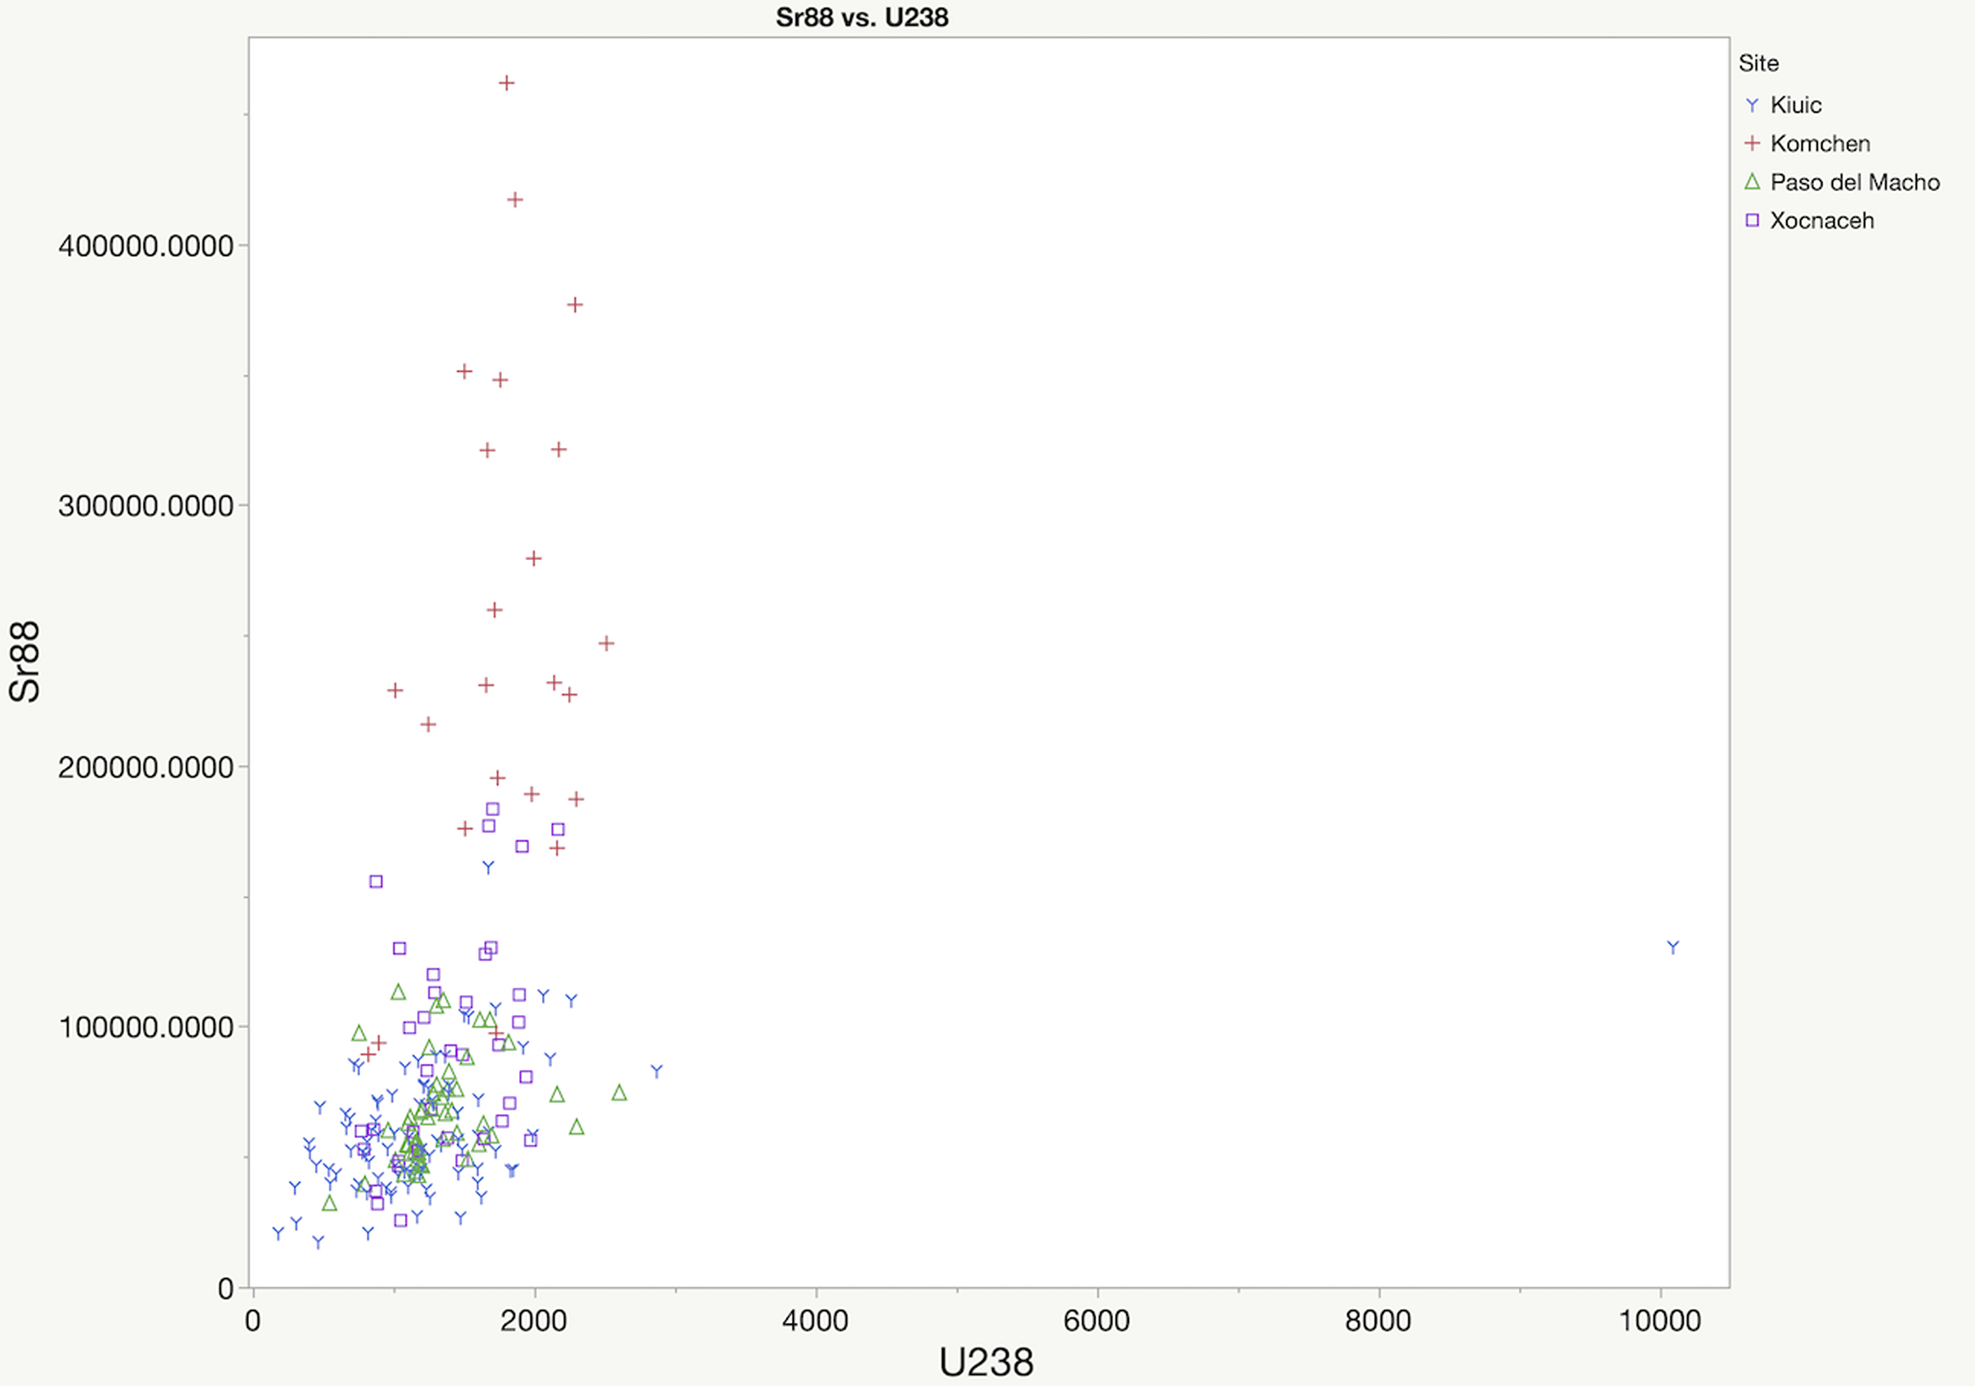
The third principal component has high factor loadings for Ur and Sr. A bivariate scatterplot of these two elements indicates that they are good distinguishers for sherds from Komchen (Figure 10). The fourth principal component has high factor loadings for Sr, U, and Na. Once again, these elements distinguish the sherds by site quite well. Even plotting variables from different principal components produces satisfactory results. Cu from component seven and Pb from component nine distinguish Xocnaceh sherds from the larger body of sherds and separate several Kiuic sherds from the larger body.
Bivariate plot by site of Sr and U concentrations. Image by the authors.
If the scree test indicated that almost all variability could be found in the first two factors, then why did factors that contributed little variability to total variance culminate as the best discriminators for sherds by site? For attribute data, most of the significant variance will likely appear in the first few factors. Compositional data is different, however. Minor differences in Sr or Cu contribute little overall variance within a given sample, but may be the best discriminators in the entire sample due to their contributions to a particular group within the sample. Later principal components were contributing variance to sherds from Komchen and Xocnaceh, though this may result from an overall smaller sample size from these two sites. Overall, principal component analysis failed to distinguish sherds based on their archaeological provenance and production origin. Instead, it revealed how small variations in trace elements greatly distinguish some sherds at the site level.
INTERPRETATION
Results from all three tests indicate that all four of the examined settlements were producing their own pottery, but that a limited degree of trade was ongoing. Though the sample size cannot fully reflect an increasingly well-documented Middle Preclassic settlement system, it does lend some insight into both temporal and spatial trends of pottery production and exchange. Even the two most proximate sites, Kiuic and Paso del Macho, appear to have engaged in only a limited rate of exchange, and even those exchanges may be attributable to overlapping areas of clay extraction. It has been observed that potters will walk upwards of 15 km to extract preferable sources of clay for their pottery (Arnold Reference Arnold1988). The tight clustering of Komchen sherds in both the cluster and discriminant function analyses also suggests limited rates of exchange.
Temporally, Ek phase (900–700 b.c.) sherds at both Kiuic and Komchen form distinct clusters; however, because Ek phase sherds do not form the same cluster across sites, pottery appears to have been produced locally. In the large cluster that includes much of the Kiuic sample, there is a distinct sub-cluster that contains almost all the Ek complex sherds from Kiuic. The pattern that appeared in the Komchen data is even clearer. The Kiuic pottery, both early Middle Preclassic and late Middle/Late Preclassic, is being produced locally, but there is enough variation in the pastes that the early Middle Preclassic sherds can be distinguished from the later material. This indicates that the earliest known pottery yet identified in the Northern Maya Lowlands (temporally coeval with Cunil and Middle Xe in the Southern Lowlands, 900–700 b.c.) was being produced locally.
Though the paste compositions were different between the Ek and Early Nabanche phases, the fact that pottery from both periods still clusters with sherds from the same sites indicates continuity of local production. Furthermore, rather than subsuming Ek phase sherds within a sub-complex at Komchen, as Ceballos Gallareta and Robles Castellanos (Reference Ceballos Gallareta and Castellanos2012) have suggested, the chemical characterization study instead indicates that the Ek complex is a technologically discrete entity and constitutes a different mode of pottery production than the Nabanche complex. In contrast, Late Nabanche (350 b.c.–a.d. 250) pottery, such as Sierra Red, tends to cluster with Early Nabanche pottery, indicative of technological continuity over a large span of time.
Sherds from the unslipped Achiotes group always seem to form their own clusters, suggesting that there were preferred types of clay for this ceramic group. Alternatively, the use of coarser and denser material may account for the variation and grouping. Most likely, a combination of trade, chemical similarity, and overlapping clay extraction areas explains overlap at sites such as Kiuic and Paso del Macho. The same phenomena likely accounts for the overlap of Xocnaceh with Paso del Macho and Kiuic. Xocnaceh is located somewhat farther away (25 km), yet close enough to maintain constant ties of exchange with the Preclassic Puuc sites.
Examination of several clusters indicates that though the cluster may be composed of several types, the paste of the associated sherds is visually the same. It seems likely a Preclassic pottery production unit was organized first by paste. Unslipped jars from the Achiotes group constituted one production unit, and finer pastes from the Joventud, Dzudzuquil, and Chunhinta groups comprised the other. The Achiotes sherds from Kiuic (11 percent) and Xocnaceh (27 percent) do tend to cluster together as an overall group across sites, and paste is visually distinct from those found in the other ceramic groups because of the consistently large calcite temper. The difference in temper and paste may reflect functional or production differences between unslipped pottery and the slipped wares. For the slipped pottery groups such as Dzudzuquil and Joventud, manufacturers produced a range of pottery types where the only difference was in surface finish and treatment. The same appears to have been true for Ek phase pottery, with both Almeja Burnished Gray and Kin Orange-Red often grouping together. As such, pottery, conceived as production output by a potter, crosscuts archaeological typology, and through the examination of the ceramics at the chemical level, we can begin to define other units that are meaningful to understanding Preclassic pottery economics.
It is worth mentioning that the chemical analysis of Preclassic pottery provides further evidence legitimizing the difficulty that archaeologists have differentiating between Joventud Red (associated with the Middle Preclassic) and Sierra Red (associated with the Late Preclassic).The ICP-MS analysis produced cases in at least nine clusters where Joventud Red and Sierra Red sherds were closely connected by the Ward's cluster analysis. Although it is possible that these paired sherds were made from the same paste hundreds of years apart, it is more likely that one of the sherds has been typologically misidentified.
Regarding the catch-all Dzudzuquil group, few sherds seem to cluster from any of the sites. This may reflect that the distinctions made by ceramicists may not be based in any sort of emic reality. Indeed, it may also reflect excessive splitting by archaeologists. For the discriminate function analysis, only 15 out 44 Dzudzuquil sherds (27 percent) were predicted correctly, with the bulk of the remainder being lumped into the Chunhinta (n = 6) and Joventud (n = 10) groups. In Anderson's (Reference Anderson2010) ceramic analysis of pottery from Xtobo, slip colorings that were not clearly part of either Joventud (red), Chunhinta (black), or Dzudzuquil (tan) were classified as Paso Caballo Variegated. Again, this may highlight the needless splitting of ceramics in the type-variety system. Overall, it indicates that the classification of ceramics and the study of their visual change in time may be problematic for assessing chronology; instead, a technological approach, focusing on vessel morphology and production characteristics, may prove more beneficial.
In conclusion, the use of ICP-MS to study Preclassic Maya pottery has significant potential. The use of discriminant function and cluster analysis allows for the discernment of clues about the nature of early pottery economics in the region. Pottery production was at the site or local level by the late Middle Preclassic period (700–350 b.c.), and the earliest evidence for pottery production in the Northern Maya Lowlands (900–700 b.c.), at the sites of Komchen and Kiuic, indicates that these first complexes, although compositionally distinct, were clearly associated with local pottery producers of the region—that is, they are also locally produced and not the result of migrants bringing pottery from elsewhere. If there were migrants coming from the Southern Lowlands during the early Middle Preclassic, either the populations did not carry pots with them from their own production origins, or they produced their own pottery from extant clay sources previously utilized by already existing populations from the Northern Lowlands.
Integration of these Ek with Nabanche sherds indicates that there were both continuities and discontinuities in production. Compositional analysis of paste may be unsuited to disentangling the question of migration, as local raw materials are more likely to be used. An analysis of technology rather than style and composition may shed light on whether the emergence of the Ek complex results from migration, diffusion, emulation, or local innovation. At the time, it can only be stated that pots were not being imported from the south.
Finally, it is likely that even at this early time in the Northern Lowlands, limited ceramic exchange was occurring, though no clear pattern as regards type or scale is discernible. Most notable is that though pottery in northwest Yucatan and in the Puuc region is quite similar in surface treatment during the Preclassic, it was still being produced locally. While pottery may not have been exchanged, the pottery manufacturers appear to have been in contact to a sufficient degree to produce a ubiquitous style of ceramics for the period.
RESUMEN
Evidencias de ocupaciones complejas y generalizadas durante el preclásico medio (1000–350 a.C.) han sido identificadas en todo el norte de las tierras bajas mayas, asociadas con los complejos cerámicos Mamom y pre-Mamom. Más allá de la información tipológica basada en el examen visual de la pasta y el engobe, los arqueólogos saben poco sobre la tecnología o la economía de la producción e intercambio de la cerámica de este período. En este estudio, analizamos la composición de fragmentos de vasijas cerámicas del preclásico medio provenientes de cuatro sitios del noroeste de Yucatán, usando el método de espectrometría de masas por plasma inductivamente acoplado mediante ablación láser (LA-ICP-MS, por sus siglas en inglés), para determinar la variación química que existe entre y dentro de las diferentes áreas de producción de cerámica. El análisis indica que la producción se realizó localmente en el preclásico medio tardío (600–350 a.C.) y que la cerámica más antigua elaborada en las tierras bajas mayas del norte en los sitios de Komchen y Kiuic estaba ligada compositivamente a fases posteriores de producción. Esto significa que los primeros complejos cerámicos de las tierras bajas del norte se produjeron localmente y no fueron introducidos de otros lugares por inmigrantes. El estudio revela que es posible identificar el origen de la cerámica del preclásico medio por su signatura química y que la variación en su composición existió a nivel de sitio a lo largo del tiempo.
SUPPLEMENTARY ONLINE MATERIAL
The supplementary material for this article can be found at https://doi.org/10.1017/S0956536121000286


 Open access