

1 Introduction
Many countries around the world have been reducing the level of state provision of resources for retirement, moving towards a system that relies on an increased degree of individual or private provision. The UK has been at the leading edge of these changes, particularly for pensions. As private saving has become increasingly important, the savings and insurance landscape has also become more complex in terms of the range and type of financial products available. In response to these trends and more general concerns that left to their own devices individuals may not save enough to fund their future retirement and health-care needs, a literature has been developed in the recent years that looks at levels of financial literacy and relates this to the nature of savings and portfolio choices that are being taken. Lusardi and Mitchell (Reference Lusardi and Mitchell2014) provide a comprehensive summary of the current state of this literature both in terms of theoretical underpinnings and empirical evidence. Broadly speaking, the conclusions of this literature are that the financial literacy and knowledge is on average rather low and very heterogeneously distributed across the population and that, particularly in a system with substantial private provision, policymakers should worry about the ability of individuals to take well-informed financial decisions that help them smooth their resources over their lifetimes and navigate more short-term economic fluctuations, such as the recent financial crisis.
In this paper, we contribute to this literature by providing evidence on older adults’ decisions regarding how they start to withdraw funds from their defined contribution (DC) pensions. In the UK, the ‘default’ choice has been for a long time to buy an annuity from the provider with whom the pension was accumulated, though individuals do have the right to purchase an annuity from any provider, or to draw an income without purchasing an annuity. We examine the role of financial literacy (and specifically, of numeracy and cognitive function) in determining whether individuals make a choice other than the ‘path of least resistance’ and, indeed, whether or not they choose to annuitize at all, while controlling carefully for other factors that may affect individuals’ desire to purchase an annuity.
We find that the financial literacy (broadly defined) is an important factor governing individuals’ choice over whether to shop around for an annuity as opposed to taking an annuity from their original pension fund provider. If one takes holdings of relatively sophisticated financial products as an indicator of financial knowledge, then we find independent roles for each of financial knowledge and numeracy, which are two of the key dimensions of financial literacy that have been identified in the recent literature. These effects are evident even controlling for individuals’ education, health and employment status, other aspects of cognitive functioning (such as memory and executive functioning), the level of wealth and importance of the DC fund in the portfolio, individuals’ own survival expectations and mortality risk factors, and their parents’ survival.
In contrast, we find that few factors are systematically related to choosing income drawdown rather than annuitization. The factors that are found to be significantly (positively) related to choose income drawdown are: being in full-time work immediately prior to starting to withdraw income, having children, and having at least one other form of annuity income (such as a defined benefit (DB) pension or another DC pension annuity).
Our contribution in this paper is twofold. First, as noted by Lusardi and Mitchell (Reference Lusardi and Mitchell2014), relatively little is known to date about the relationship between financial literacy and the management of resources by older individuals as opposed to their younger or working age counterparts. The explicit focus on older individuals matters because cognitive function, a key dimension of financial literacy as defined by the existing literature, is a characteristic of people that changes with age (Salthouse, Reference Salthouse2009). Greater understanding of the ability of older individuals to make complex financial decisions is important for many contexts, including the use of pensions and the uptake of insurance products relating to health or long-term care. The second contribution is our specific analysis of how individuals choose to access funds held in a DC pension, which is an extremely important and understudied element in determining the effects of DC pensions. It is both a one-time decision, with generally little scope for learning from experience, and it can have substantial implications for the financial resources available the individual for the remainder of their life. Improved knowledge of how individuals make these decisions is crucial for policy makers concerned with ensuring individuals to get the highest welfare from their private resources.
This work builds on the (intersecting) strands of the literature that explore the importance of defaults and framing effects in retirement decisions, and the apparent ‘annuity puzzle’ that fewer individuals voluntarily purchase annuities than standard economic theory would predict. The latter has been a subject of debate among economists since the seminal contribution of Yaari (Reference Yaari1965), but due to a paucity of good data has only more recently been empirically investigated (Brown, Reference Brown2001; Inkmann et al., Reference Inkmann, Lopes and Michaelides2011; Chalmers and Reuter, Reference Chalmers and Reuter2012; Previtero, Reference Previtero2014). While many explanations have been proposed, including actuarial unfairness of annuities, desirability of liquid wealth, and bequest motives, more recently a growing number of studies have pointed to behavioural reasons for a lack of voluntary annuity demand. For example: Bütler and Teppa (Reference Bütler and Teppa2007) highlight the importance of the default option in determining whether Swiss pension funds are annuitized; Brown et al. (Reference Brown, Kling, Mullainathan and Wrobel2008) use an experiment to illustrate the effects of framing on annuitization decisions; Benartzi et al. (Reference Benartzi, Previtero and Thaler2011) posit that the more common choice of annuitization in DB schemes than DC schemes is an indication that it is the complexity of the decision and framing effects that discourage annuity demand; and Brown (Reference Brown2007) reviews a number of behavioural biases that may affect the annuitization decision.
In the UK context, the annuitization choice is somewhat different from that typically considered in the above studies since there is an element of compulsion. Individuals are not able to withdraw their DC pension funds as a lump sum without incurring punitive tax charges, and must instead either purchase an annuity or start to draw an income from their pension (within specified bounds) by age 75.Footnote 1 (This is somewhat more similar to the choice in Swedish occupational pensions between an annuity or withdrawing the fund over a fixed number of years, studied by Hagen (Reference Hagen2014), in the only other paper we know of looking, albeit for different reasons, at annuitization versus income drawdown choices). While not strictly speaking a default option, the easiest choice in the UK, which we term the ‘path of least resistance’, is to buy an annuity from one's pension fund provider rather than taking the more active decision to purchase an annuity from elsewhere or to enter into some kind of income drawdown arrangement. This is different from in the USA where the ‘path of least resistance’ could be considered to be withdrawing the fund as lump sum. As a consequence, our paper also relates to the broader literature around defaults and framing effects in retirement saving, much of which is summarised in Benartzi and Thaler (Reference Benartzi and Thaler2007). Of particular relevance is Agnew and Szykman (Reference Agnew, Szykman, Mitchell and Lusardi2011), who conduct an experiment in order to create an environment in which annuitization is ‘the path of least resistance’ and find that this path then holds the most attraction to those who are the least financially literate. The present paper can be thought of as an empirical investigation of a similar question.
In the analysis that follows, we use data from the English Longitudinal Study of Ageing (ELSA) over the period 2002–12 to look at a large sample of individuals as they reach the point at which they can cash in their DC pensions. We document the importance of DC pension wealth in their portfolios, analyze the nature of the annuity decisions that are taken and look at the relationship of these decisions to other characteristics of the portfolio as well as to individual and household characteristics. Since much of the variation in annuity demand may be driven by variation in the accumulation phase (i.e., the decision to contribute to DC pensions in the first place, as opposed to the decision to annuitize any resulting DC funds), we take care in our analysis to look separately at the importance of DC pension wealth in portfolios and then examine annuity behaviours, conditional on having contributed to DC pensions in the past and on the value of the accrued DC funds.
We do not directly construct an optimal measure of behaviour by which to assess individual decisions (though a dynamic lifecycle model along the lines of Horneff et al. (Reference Horneff, Kaschützke, Maurer and Rogalla2014) could in principle be used to illustrate the welfare implications of different choices of how to draw on DC pension wealth). However, there is evidence that individuals would mostly be better off by buying an annuity on the open market rather than an annuity from their pension fund provider (i.e., they would be better off by deviating from the path of least resistance). The Financial Conduct Authority (2014) showed that over half of annuities purchased in 2012 were purchased from the original pension provider and calculated that 80% of those individuals who purchased an annuity from their original pension provider could have got a better deal by shopping around. They estimated that the average gain in annual income from buying on the open market was 6.7% for those purchasing standard annuities and 8.3% for those who would qualify for an ‘enhanced’ annuity on the grounds of poor health or lifestyle factors. This suggests that there are potentially significant gains to DC pension holders from the ability to navigate the open market successfully.
The finding that financial literacy is an important factor in determining individuals’ deviation from the path of least resistance, in an environment where such deviation would be beneficial for most individuals, suggests there may be an important role for policymakers in trying to ensure that individuals get the most out of their private resources. Furthermore, such a role is likely to be of increasing importance for a number of reasons.
First, the increasing prevalence of DC pensions in many countries – particularly in the UK where recent policy reforms mean that soon most employees will automatically be enrolled into a workplace (predominantly DC) pension unless they actively choose to opt out – means that more individuals will have to make complex decisions on retirement about how to access their DC pension wealth. One might also reasonably hypothesize that these ‘new’ pension savers are on average of lower financial literacy than those currently retiring with DC pension funds, and therefore the problem of individuals simply taking the ‘path of least resistance’ may be exacerbated.
Second, the international trend to encourage longer working lives in response to increasing longevity means that many of the complex financial decisions associated with accessing retirement resources are being made later in life. To the extent that cognitive decline is not also postponed to a similar extent, such decisions could be increasingly made at a time when individuals have lower ability to navigate them easily.
Finally, in contrast to the proposed direction of travel in many countries, mandatory annuitization rules in the UK are to be removed from 2015 onwards. Part of the impetus for this change was a concern among politicians that annuity rates were poor (and had declined sharply over recent years) and that pension providers were making excessive profits from customers who did not shop around for the best deals. In a television programme broadcast in November 2013, pensions minister Steve Webb said: ‘Companies have clearly traded on the fact that consumers don't shop around… I think they are making what I suppose an economist would call excess profits… taking advantage of people staying put… I think successive governments have failed to ensure that consumers get good value for money in the annuity market and that's something we've got to change.’Footnote 2 While greater choice would typically be expected to be welfare enhancing, and the previous literature has suggested that mandatory full annuitization involves a welfare loss (Horneff et al. Reference Horneff, Kaschützke, Maurer and Rogalla2014), the present paper does suggest that a ‘standard’ rational-agent life-cycle model with perfectly informed consumers is unlikely to be able to fully explain choice behaviour. The importance of individuals having the financial literacy to successfully navigate these complex financial decisions late in life should therefore not be underestimated.
The paper is structured as follows. In Section 2 we provide some institutional background on the UK pension system and related issues surrounding annuitization restrictions and rules. Section 3 gives a brief overview of the data we use for our study, and the way in which key concepts are measured, before moving on to provide some key descriptive statistics. Section 4 provides the main analysis of annuitization decisions. Finally, Section 5 concludes.
2 Institutional context and background
Private pension saving has played an important role in the UK for many years and legislative changes in the late 1980s and rising costs of DB pensions over the last three decades mean that, within the private pension sector, membership of DC pensions has grown substantially. Around 45% of those born between 1948 and 1952 now have some DC pension wealth, compared to only around 25% of those born between 1923 and 1927. There are a number of different types of DC scheme in the UK, from trust-based schemes operated by individual employers or industry groups to individual personal pensions. Membership of DC pensions is likely to grow further as a result of reforms beginning in October 2012, which require all employers to automatically enrol qualifying employees in a pension scheme with a minimum level of employer contribution.
In contrast to many other countries, it has traditionally been a requirement in the UK that those who have accumulated savings in a DC pension fund use a large proportion of their fund to secure an income stream.Footnote 3 This can only be done after a certain age (age 50 until April 2010, age 55 since then), and until recently had to be done before age 75. Only those with total pension wealth of less than a certain threshold (£18,000 in 2012–13) could withdraw their entire pension fund as a lump sum without facing punitive tax charges.
There are two broad methods through which individuals could convert their pension fund into an income stream. The first is through purchasing an annuity. This can be purchased either from the company with whom the pension was accumulated, or from any other provider. The annuity rate available depends on many factors, including an individuals’ age, place of residence, sex (at least until 2012 when an EU directive mandated that annuity prices had to be gender-neutral), and current yields on long-dated gilts (since annuities are often backed by UK government bonds). There are also ‘impaired-life’ annuities, which are available to individuals who suffer from a range of health conditions (e.g., cancer or serious heart conditions), and ‘enhanced annuities’ which are available to those with certain lifestyle conditions (e.g., smokers and obese individuals), that pay a higher rate on the basis that the individual has a lower-than-average life expectancy.
The second method of withdrawal is through ‘income drawdown’. The details of income drawdown are somewhat complex. Prior to 2011, income drawdown allowed individuals aged under 75 to draw an income from their pension fund of up to 120% of the amount that an individual of the same sex and age would get from a single-life annuity. Individuals aged 75 and over who had still not purchased an annuity were required to draw an annual income from their fund between 55%t and 90% of the amount that an individual aged 75 of the same sex would get from a single-life annuity.
The framing of annuity offers to DC pension holders is important and may have had a significant effect on individuals’ behaviour during the period we study. There are at least two important strong nudges people receive with respect to withdrawing money from DC pensions in the UK.
First, individuals receive a strong nudge to start drawing their pension at a particular age. When individuals first start saving into a DC pension, they are asked to say at what age they plan to retire. When they approach this age, their pension provider automatically sends them a letter prompting them to think about how to convert their pension fund into an income stream.
Second, by far the easiest choice about how to withdraw money from the pension has for a long time been to take an annuity with the provider with whom the pension was accumulated. Since 1978, DC pension holders have had the right to purchase an annuity from any provider (known as the ‘open market option’), not just the one with whom they accumulated their pension. However, until 2002 pension providers were under no obligation to inform customers of this fact in their communications. Furthermore, until recently it was a common practice for pension providers to send customers a form (as they were approaching their planned retirement date) which they simply had to sign and send back to accept their annuity offer. Under such circumstances taking an annuity from the pension fund provider was the ‘path of least resistance’ by a considerable margin.
There was a widespread concern that this encouraged customers to lock themselves into unfavourable annuity products, with the Financial Conduct Authority (2014) finding that the vast majority of customers who purchased an annuity from their original provider could have got a better deal by buying on the open market. This concern led the Association of British Insurers (ABI) to draw up a compulsory code of conduct for its members in 2012. This required them to highlight more prominently the range of products available to customers and the potential value of shopping around for alternative products (ABI, 2012). Although this code of conduct did not formally come into force until 1 March 2013, after the period of the data used in our analysis, many pension providers had in fact already been moving in this direction and use of the open market option grew steadily through the 2000s (ABI, 2014).
The direction of reform in the UK over the past decade, in contrast to many other countries, has been to gradually remove the compulsion for individuals to convert their pension fund into an income stream. In 2011, the rules for income drawdown were simplified. Individuals can now flexibly draw an income from their pension fund up to 100% of the amount that someone of the same sex and age would get from a single-life annuity, and there is no compulsion to be drawing an income once the individual is aged above age 75.Footnote 4 Furthermore, if individuals can prove they have a secure income for life of at least £20,000 per year then they can withdraw unlimited amounts from their pension whenever they choose after age 55.Footnote 5 In March 2014, the government announced that from April 2015 all individuals would be able to withdraw unlimited amounts from their pension whenever they choose, regardless of whether they have other secured income. This effectively ends the compulsion for those who have accumulated pension funds to secure an income stream, and allows anyone to access their pension fund as and when they like, so long as they are aged over 55. In March 2015 the government went a step further, and has pledged to remove the tax penalty on individuals who want to sell an existing annuity. However, it remains to be seen to what extent a market for ‘buying back’ annuities develops.
3 Data and descriptive statistics
3.1 The ELSA
We use data from the ELSA to examine the behaviour and characteristics of people who have chosen to enter the decumulation phase of a DC pension.
ELSA is a biennial longitudinal data set, broadly representative of the household population of England aged 50 and over. It began in 2002–03 with a sample of around 12,000 individuals, and there are now five subsequent ‘waves’ of data also available (collected in 2004–05, 2006–07, 2008–09, 2010–11, and 2012–13). The ELSA survey collects a large quantity of information on demographics, labour market circumstances, subjective and objective measures of health and cognitive function, and detailed information on the components of financial, housing and pension wealth held by individuals and households.
These rich data allow us to examine a number of important factors that are likely to affect how DC pension holders engage with decisions about when and how to draw money out of their pensions. In particular, we focus on individuals’ age, sex, household composition, education, labour market activity, health, when their parents died (if they have), measures of bequest motives, their own survival expectations, their household wealth, and measures of their numeracy and cognition. Below we provide some additional explanation of the variables that are expected to have a key role in explaining whether or not individuals deviate from the ‘path of least resistance’ and whether or not they annuitize their fund or use income drawdown.
3.1.1 Financial literacy
A key characteristic that might be expected to be associated with annuity choices in the institutional framework described above is financial literacy, since for the majority of individuals a better annuity rate could be achieved through shopping around and purchasing an annuity from a different provider. (It is less clear a priori whether we would expect financial literacy to be associated with purchasing an annuity, rather than taking income drawdown.) We utilise a number of variables that aim to capture different dimensions of financial literacy, including numeracy, cognition and executive function, as well as a more direct measure of financial literacy.
In terms of numeracy, ELSA respondents were asked (in waves 1 and 4) a set of up to five questions (out of a set of six) to test their numerical skills, with the questions requiring successively more complex calculations. The six possible questions are:
-
1. If you buy a drink for 85 pence and pay with a £1 coin, how much change should you get?
-
2. In a sale, a shop is selling all items at half price. Before the sale, a sofa costs £300. How much will it cost in the sale?
-
3. If the chance of getting a disease is 10%, how many people out of 1,000 would be expected to get the disease?
-
4. A second-hand car dealer is selling a car for £6,000. This is two-thirds of what it cost new. How much did the car cost new?
-
5. If all the five people have the winning numbers in the lottery and the prize is £2 million, how much will each of them get?
-
6. Let us say you have £200 in a savings account. The account earns 10% interest per year. How much will you have in the account at the end of 2 years?
Respondents are initially asked questions 2–4. If all the answers given are incorrect then the respondent is asked question 1, otherwise the respondent is asked question 5. If any of questions 3–5 are answered correctly then the respondent is asked question 6. These questions were first developed for the first wave ELSA questionnaire in 2002, and were subsequently adopted by similar international ageing studies and have since become key elements of more recently developed measures of financial literacy.
In this paper, we divide respondents into three groups based on their numerical ability. The groups we use are similar to those used by Banks and Oldfield (Reference Banks and Oldfield2007). The highest ability group contains those who were able to answer correctly all questions 2–5 (regardless of whether they answered question 6 correctly).Footnote 6 The lowest ability group contains those who answered at least three of questions 2–5 incorrectly. As well as presenting the other descriptive statistics of our sample, Table 1 shows that in the entire ELSA sample aged between 50 and 74, 46% of individuals fall into the highest numeracy group, while only 10% are in the lowest group. The group with some DC pension wealth have slightly higher numeracy on average (51% in the highest group and 6% in the lowest group).
Characteristics of those with DC pensions and those who start drawing an income in the next 2 years

Notes: Sample is person-wave observations based on pooling waves 1–6 of ELSA.
Source: Authors’ calculations using waves 1–6 (2002–03 to 2012–13) of the ELSA.
Figure 1 shows the distribution of numerical ability among different cohorts of individuals at two points in time. This shows that overall that numerical ability appears to be quite stable across the 6-year period.
Numerical ability in 2002–03 and 2008–09 by cohort.

The measures of cognition that we use in this paper are measures of retrospective memory and executive function. The retrospective memory tasks in ELSA comprise two parts. First, respondents are read a list of ten words and asked immediately to repeat back as many as they can remember. Then they are asked to repeat as many words as possible again about 10 min later, after they have answered a number of other questions. In this paper, we sum together the number of words remembered immediately and after a delay – giving a potential maximum score of 20. Figure 2 shows how word recall changes over time for different cohorts. This shows that, on average, memory starts to deteriorate from around age 70 onwards. In the analysis that follows, we group respondents into four approximately equally sized groups – those who remembered not more than 8 words, 9–10 words, 11–13 words, and 14 or more words.
Immediate and delayed word recall by cohort and age.

Our measure of executive function is an index based on respondents’ performance on two separate tests – one that requires them to name as many animals as possible in a minute, and another that requires them to cross out as many Ps and Ws as possible on a typed page of random letters arranged in orderly rows and columns in 1 min. The index takes values from 0 to 20, with those who perform better on the tests scoring more highly. These tests are described in more detail in Steel et al. (Reference Steel, Huppert, McWilliams, Melzer, Marmot, Banks, Blundell, Lessof and Nazroo2004). While somewhat crude, in comparison with studies containing detailed assessments of cognitive abilities, these tests are generally thought to capture the key variation in important dimensions of cognition in older individuals and as a consequence are the measures that have been chosen for inclusion in most of the major general purpose multi-disciplinary ageing surveys around the world, where the time available for detailed disciplinary assessments is limited.
Finally, we also include – as a more direct measure of financial literacy – a dummy for whether or not individuals hold other complex financial products: that is, whether the individual holds risky or sophisticated assets in their portfolio, such as stocks, shares, bonds, or various tax advantaged savings vehicles. When levels of wealth are also controlled for (to avoid obvious endogeneity concerns) this is arguably a more direct measure of financial literacy than the measures of numeracy, cognition and executive function described above. There is often a concern in the literature examining the relationship between financial decision-making and financial literacy about the direction of causation between the two: that is, whether holding complex financial assets and interacting with these markets itself improves financial literacy, rather than just those who are more financially literate being more likely to make ‘better’ decisions in these markets. However, this is much less of a concern for the present analysis, since annuity purchases are (for the vast majority of DC pension holders who purchase only one annuity in their lifetime) a one-time choice – so we are less concerned here that individuals’ financial ability is a direct consequence of having interacted with the annuity market before. We are primarily interested in withdrawal behaviour conditional on contemporaneous financial literacy, and are somewhat agnostic about how that financial literacy has previously been accumulated.
3.1.2 Household wealth
Controlling for household wealth is important in order to avoid attributing to financial literacy, numeracy or cognition any effects that are really only a reflection of wealth levels. We include controls for log household non-housing wealth and log household housing wealth. We also include a measure of the proportion of household wealth held in the DC fund, which gives an indication of the relative importance of the withdrawal decision for each individual.
Housing wealth is defined as the value of the household's primary residence net of any mortgage debts secured on it. Total household non-housing wealth is defined as the sum of financial wealth, property wealth (excluding primary residence), physical wealth, and private pension wealth, net of secured and unsecured debts. The first three of these are reported (in considerably more disaggregated form) by ELSA respondents at the benefit unit level (i.e., for single individuals or both members of a couple together, as appropriate). Private pension wealth is calculated as the present discounted sum of projected future pension income. Future private pension income is estimated based on individuals’ responses to detailed questions about their private pension membership and accrual to date. More detail on these calculations can be found in Crawford (Reference Crawford2012).
3.1.3 Characteristics potentially associated with the decision to take drawdown
Without a dynamic lifecycle model, we cannot assess for each individual whether purchasing an annuity or taking income drawdown would represent an optimal decision. However, there are some characteristics that simple economic intuition would suggest would be associated with annuitizing rather than entering drawdown (or vice versa) all else equal. For example, we might expect those who have a strong bequest motive to be more likely to enter drawdown (all else equal) since on death any remaining pension fund could be bequeathed. We therefore construct dummy variables for whether or not the individual has any children, and whether or not they or their partner have a life insurance policy, as indications of a bequest motive.
Those whose parents survived for a relatively long time after the respondent's current age might be expected to be more likely to live for a relatively long time themselves, and therefore benefit from the longevity insurance provided by an annuity. (Hagen (Reference Hagen2014) found parental longevity to be associated with the decision to take an annuity rather than a 5-year payout in Swedish occupational pensions.) To explore this we construct dummy variables for whether a respondent's father, mother or both parents survived to an age of at least 10 years older than the current age of the respondent at the time they were observed in the survey wave in question.
We also control for individuals’ own self-reported expectations of survival. Again we would expect those who expect to live for longer to value longevity insurance more highly. ELSA respondents are asked what they think the chances are that they will survive to some future age. Those aged 65 and under are asked about survival to age 75, those aged 66–69 are asked about age 80, and those aged 70–74 are asked about age 85. In our analysis we control for whether individuals have low, medium, or high expectations of survival compared with other people of their sex in the same 5-year age band (i.e. aged 50–54, 55–59, and so on), with the low group being defined as the bottom quartile, and the high group as the top quartile, of this distribution.
Finally, we also construct a dummy variable for whether the respondent has any other private pension income, which could indicate that the respondent already has some longevity insurance.
3.2 DC pension holdings
For the analysis in this paper, we focus on the sample of DC pensions that are observed in at least one wave of ELSA in the accumulation phase and then in a subsequent wave in the decumulation phase (in other words, an income has started to be drawn from that pension). A significant minority of those in or approaching retirement in England holds some wealth in a DC pension, and the prevalence of such pensions is higher among later cohorts. Around 45% of men and women born between 1948 and 1952 have some money held in DC pensions, compared with around 25% of men and women born between 1923 and 1927. DC pensions are more prevalent among men than women and among those with middling levels of education, compared with those with high or low education. DC pensions are also more prevalent among those who expect to live for a relatively long time (compared with other people of the same age) and among those who are objectively likely to have longer than average life expectancy – for example, non-smokers and those who do not have a history of heart disease or lung disease (see Table 2).
Probit model for DC pension holding

Notes: Sample size = 55,807 person-wave observations on 15,646 distinct individuals. Standard errors are clustered at the individual level. *indicates statistical significance at the 10% level, **at the 5% level and ***at the 1% level.
Source: Authors’ calculations using waves 1–6 (2002–03 to 2012–13) of the ELSA.
As described in the previous section, individuals can start drawing money from their DC pensions at any point from age 55 onwards (or age 50 onwards prior to 2010). Figure 3 shows that the proportion of people with ‘unannuitized’ DC pension wealth declines sharply from around age 60 onwards, as individuals move into the decumulation phase. We define ‘unannuitized’ here as DC pension accounts from which the individual has not yet started drawing an income (either by purchasing an annuity or through income drawdown). The sample of pension accounts that we focus on in the next section is those that move from the accumulation phase to the decumulation phase during the ELSA panel. As Figure 3 shows, this predominantly happens between the late 50s and 60s.
Prevalence of DC pensions not yet in the decumulation phase by cohort and age.

The value of funds held in DC pensions varies a lot. Figure 4 describes the distribution of unannuitized DC pension wealth observed in ELSA. For this analysis, and other similar types of analysis presented later, the unit of observation is the individual in each wave of the survey with some individuals being included multiple times if they respond to multiple waves of the survey. On average men hold more money in DC pensions than women do – on average men with unannuitized DC pensions have around £80,000 held in this form compared with around £40,000 among women. However, there is considerable variation among men and women in how much wealth is held in DC pension accounts.
Value of unannuitized DC pensions by sex and age.

Across all those with some unannuitized DC pension funds, these funds comprise nearly 10% of that person's total household wealth (see Table 3). This is not an insignificant fraction of wealth and suggests that – on average at least – individuals who are making decisions about when and how to draw their funds out have a significant amount riding on the decision. In our analysis in the next section, we control for the level of household wealth and the importance of DC pensions within this, as these may be important factors in determining how engaged individuals are in the decision about how to withdraw income from their account.
Importance of unannuitized DC pension funds within household wealth, by sex and age

Notes: Sample is pooled individual observations from ELSA waves 1–5. We exclude those individuals whose total household private non-housing wealth is negative. Sample size is 7,601 person-wave observations on 3,303 distinct individuals.
Source: Authors’ calculations using waves 1–6 (2002–03 to 2012–13) of the ELSA.
3.3 Choices made about decumulation
The results presented in the next section focus on those pensions that are observed to move into the decumulation phase during the ELSA panel, that is our analysis is at the pension level although it utilizes information on the characteristics of the respondent who holds that pension. All respondents who report having a DC pension account in one wave of the survey are asked in the next wave whether they are or could still save into that account. If they say no, they are asked what has happened to this pension account. We define as ‘moving into decumulation’ those pension accounts from which the respondent says they are now ‘receiving an income’. There are 878 DC pensions that are observed making this transition across the six pooled waves of ELSA over the period 2002–12, and these pensions are held by 758 different individuals. Since some respondents appear multiple times in the observed choices all analyses use standard errors that are clustered at the individual level.
In the first wave in which the DC pension is observed in the decumulation phase the ELSA respondent is asked the following:
Have you taken your pension as:
-
(1) Annuity with pension company who originally provided the scheme,
-
(2) Annuity with a different pension provider,
-
(3) Income drawdown?
We can therefore identify through which of the main routes an individual chose to enter the decumulation phase of a DC pension. Of the 878 funds that are observed moving into the decumulation phase, 19% are used to purchase an annuity from an external provider, 8% start to be decumulated through income drawdown, 61% are used to purchase an annuity from the original pension provider (what we term the ‘path of least resistance’), and for the remaining 11% the respondent reported not knowing how they had started drawing money out.
In the analysis that follows we define as ‘buying externally’ those who reported that they had bought from a different provider and we define as ‘income drawdown’ those who gave this answer. We exclude from our analysis those who report not knowing how they took their income. We could, alternatively, have included those who did not know how they took their annuity as a separate (fourth) outcome, or assumed those who did not know bought an annuity from their original pension provider (on the basis that they would have remembered had they done something else). We test the sensitivity of our results to each of these alternative approaches, and our main results are both qualitatively and quantitatively unaffected by how we classify those who ‘do not know’. Furthermore, when we included ‘do not know’ as a separate outcome, we found no statistically significant predictors of this outcome compared with ‘buying from the original provider’. We therefore report here only results that exclude those who ‘do not know’ how they took their income.Footnote 7
Two important caveats to our classifications are worth bearing in mind. First, our classification may understate the true level of engagement in the annuitization decision, since some of those who actively ‘shopped around’ for annuity and drawdown products may have done so and then still have decided to purchase an annuity from their original provider. Second, not all pension funds in the UK provide annuities. Those that do not are likely to offer an annuity from a ‘tied provider’ to their fund holders. In such case, individuals may report (correctly) that their annuity is from a different provider, even if they did not actively shop around. This may lead us to overstate financial engagement.
4 Results
In this section, we model annuitization choices at the pension/account level using the sample of all DC pension accounts we observe moving into the decumulation phase over the six waves of ELSA covering the period 2002–2012. Even with over 55,000 person-wave observations in our initial data this only yields a sample of 878 accounts, held by 758 respondents (and only 789 observations on pensions held by 679 distinct individuals once we exclude those who report not knowing how they took their pension income). This low incidence is not so much a consequence of a thin annuity market since, as argued above, there is a strong element of mandatory annuitization in the UK system. Instead it most likely reflects the fact that that there is considerable flexibility in the timing of when annuitization choices are made and we do not observe any cohorts over the full age range of 50–75, nor even many cohorts covering even a substantial fraction of that range. In addition, the fact that small balances in DC funds can be withdrawn as a lump sum will mean that not all those with DC pension funds will have to annuitize (and indeed this may be particularly relevant for older cohorts for whom DC pensions were only common rather late in their working lives). Consequently, it needs to be remembered that by studying the decision to annuitize per se, our analysis looks at the nature of choices being made, conditional on the age (and time) in which the decisions were being taken, by those who are annuitizing.
In Tables 4–6 we provide some simple descriptive analysis of our data, showing how annuitization choices break down between annuitizing with the original pension provider (the ‘path of least resistance’), annuitizing with an external provider on the open market, choosing to take income drawdown, or not knowing. Table 4 presents time trends and shows no clear trend in the probability of using income drawdown and a small but increasing use of external providers over the sample period, which is in keeping with industry statistics (Financial Conduct Authority, 2014).
Annuitization choices over time

Note: Sample is all pensions that are observed to move from the accumulation phase to the decumulation phase during the first six waves of ELSA. Sample size is 878 observations on individual pensions, held by 758 distinct individuals.
Source: Authors’ calculations using waves 1–6 (2002–03 to 2012–13) of the ELSA.
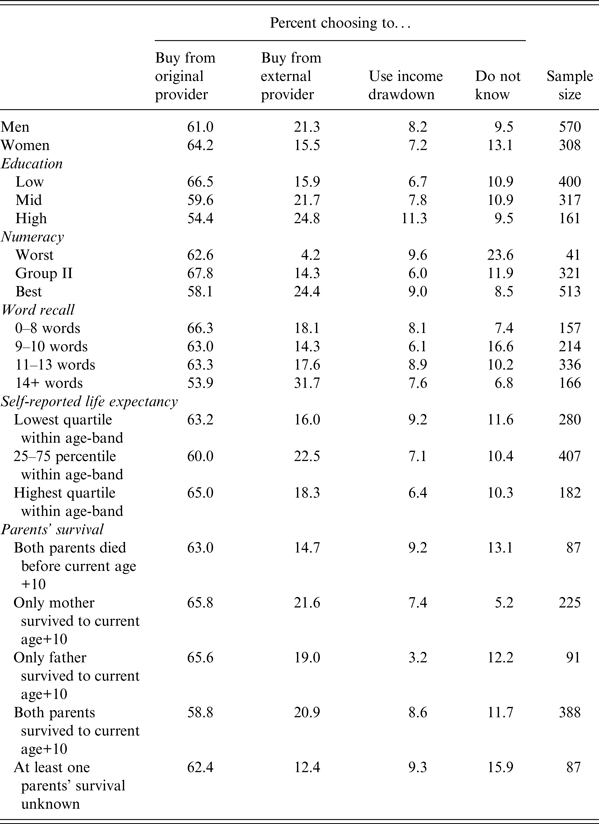
Table 5 looks at patterns by individual characteristics, such as age, sex, cognition, and subjective longevity expectations. While the broad prevalences of each choice are similar, there are clear differences between groups, with men, high education and high cognitive ability individuals all more likely to use external providers, and those with high education also more likely to use income drawdown. While it is not clear, a priori, whether those with higher subjective life-expectancy should be more likely to use an open-market annuity provider the differences in income drawdown are in keeping with expectations, in the sense that those with the lowest subjective life-expectancy are the most likely to use income drawdown instead of annuitization of either form.

In Table 6, we describe patterns in annuitization choices by various measures of economic status and once again some clear patterns emerge. Specifically, the use of external providers is the most common among those with higher total wealth and those who are annuitizing larger fund balances, and there is a higher rate of income drawdown among those in the very top wealth categories. Finally, this table also breaks down choices according to whether the individual was in work in the baseline period (i.e., in the final period in which the pension was observed in the accumulation phase). While there are no systematic differences in use of external providers, it does seem that full time employees are more likely to choose to use income drawdown.

While such descriptive statistics provide, to our knowledge, the first information relating to systematic variation in the types of annuitization choices being taken by retirees in England many sets of the key characteristics such as education, cognition, employment, and wealth are correlated so any further interpretation or analysis of these differences would not be sensible. In order to understand the role of these factors in a multivariate framework, and to begin to understand the role of numeracy in annuitization choices, we therefore estimate a series of multinomial probit models adding clusters of factors sequentially.
In principle, one might think of modelling this as a two-step sequential decision process rather than a single choice between three alternative outcomes. However, it is not clear to us a priori what the natural ordering of the decision process is. One could postulate that individuals first ‘decide’ whether or not to take the ‘path of least resistance’ (i.e., buying an annuity from their original provider), and then (if they do not) deciding whether to buy externally or take income drawdown. Equally plausibly, however, one could argue that individuals first decide whether they want to take an annuity or do income drawdown, and then (if they prefer an annuity) decide whether to buy externally or from their original provider. Rather than impose either of these restrictions we choose to model the outcomes using a single multinomial probit, which allows more flexibly for correlation between all the potential outcomes.Footnote 8
Table 7 presents the estimated marginal effects for each of two choices, annuitizing with an external provider and income drawdown, each assessed relative to the baseline choice of annuitizing with the same pension provider. The regression includes simple controls for time, age, sex and marital status, education, employment, and household wealth. It also controls for factors that can be hypothesised as affecting preferences over annuitization versus drawdown: subjective life-expectancy; factors pertaining to individual mortality; whether the person has any children and whether they or their partner hold life insurance (which may capture bequest motives); and whether or not the individual has other annuitized income streams (which may capture individuals’ desire for additional longevity insurance). Also included are our measures of numeracy, cognition, executive functioning, and experience of other complex financial products.
Multinomial probit model of annuitization choices. Marginal effects, relative to choosing to purchase an annuity from original pension provider

Legend: *indicates a coefficient that is significantly different to zero with p < 0.1; **denotes p < 0.05; ***denotes p < 0.01.
Notes: Sample is all pensions that are observed to move from the accumulation phase to the decumulation phase during the first six waves of ELSA. Sample size is 789 observations on individual pensions, held by 679 distinct individuals. Standard errors are clustered at the individual level.
Source: Authors’ calculations using waves 1–6 (2002–03 to 2012–13) of the ELSA.
Some of the key patterns identified in Tables 4–6 are preserved in this multivariate framework, namely the higher likelihood of using an external provider in more recent yearsFootnote 9 and among those with a greater fraction of wealth held in DC pensions, and a higher likelihood of using income drawdown among those who are working full-time. The education correlation identified in Table 6 is largely attenuated by the inclusion of controls for wealth and portfolio characteristics. There are no statistically significant patterns by age which is perhaps not surprising since age may be a driving factor in when a DC fund is drawn on (which we are not modelling) but not whether to annuitize or whether to shop around. The exception is for the oldest age groups who are approaching the age limit (age 75) where they would have to start to take an income and who might then be more expected to take income drawdown given that they have reached that age without using their DC fund to purchase an annuity: looking at Table 7, the oldest age groups are indeed more likely to pursue this option, though the marginal effect is only statistically significant at the 10% level.
The role of health and life-expectancy related factors are as would be expected from theory. Health conditions in general have a positive association with using an external provider, although the coefficients are only significant for cancer. This would be in keeping with individuals who have severe and identifiable health conditions being able to obtain an ‘enhanced annuity’ offering a better deal than that available by default from their pension provider, as described in Section 2 above. In addition, and again as expected, there is a systematically positive association between those with the lowest subjective life-expectancies and the likelihood of choosing income drawdown, controlling for other factors.
The marginal effects of indicators capturing bequest motives and desire for longevity insurance are rather more difficult to interpret. We find that having children and having life insurance are negatively (and, in the case of the relationship between children and income drawdown, statistically significantly) associated with buying externally and taking income drawdown. While we have little intuition on the relationship between bequest motives and shopping around (particularly given we are controlling for the size of the fund) this association between bequest motives and income drawdown is perhaps contrary to the predictions of theory, which would suggest that those with a stronger bequest motive should be less likely to annuitize. We also find that those who have other sources of annuitized income are statistically significantly less likely to take income drawdown, again contrary to theoretical predictions, although this could perhaps be explained by other annuitized income capturing unobserved heterogeneity.
Even after controlling for all the other measures, we find that there remains a statistically significant positive relationship between indicators of numeracy and whether someone buys externally. Higher numeracy levels are a strong predictor of choosing an external provider whereas other aspects of cognitive function – memory and executive functioning – are insignificant. We also find that experience of other complex financial products is statistically significantly and positively associated with buying externally. These factors are not, however, significantly associated with using income drawdown after controlling for the other regressors.
5 Conclusions
This paper provides the first systematic description of the importance of DC pension wealth in the portfolios of those currently retiring in England and the degree to which this covaries with a diverse set of individual and household characteristics including financial literacy, numeracy, and cognitive function. Similarly, it is the first study to provide a detailed descriptive breakdown and analysis of the types of annuitization choices that are being made by retirees holding this type of wealth – previous studies have either been based on aggregate data or utilized information from annuity providers with relatively few detailed covariates. We have been able to analyze annuitization choices in a multivariate framework in order to consider the potential role of numeracy, other dimensions of cognitive function and other portfolio characteristics in driving the particular choices of financial product taken out when annuitizing this DC pension wealth, while controlling for potentially confounding factors, such as age, education, wealth, employment, and various health indicators.
Our main results provide new and powerful evidence that financial literacy (broadly defined) and numeracy in particular are key factors governing whether individuals choose to shop around and purchase an annuity on the open market rather than take the ‘path of least resistance’ option of an annuity from their pension provider – a choice that would, on average, lead to annual incomes being around 7% higher. Indeed, if one takes prior holdings of relatively sophisticated financial products as an (extreme) indicator of knowledge of financial products, we find independent roles for two key dimensions of financial literacy (financial knowledge and numeracy) that have been identified in the recent literature. These effects are evident even controlling for individuals education, health and employment status, other aspects of cognitive functioning, such as memory and executive functioning, and the level of wealth and importance of the DC fund in the portfolio.
We also study the choice of whether to use income drawdown instead of purchasing an annuity product. Use of income drawdown has been shown to be surprisingly low given the flexibility that they offer and, in contrast to the purchase of annuities on the open market, there are very few factors that are systematically associated with taking out such an option. The key role for full-time employment indicates that those choosing to cash in their pension while in work are most likely to use income drawdown products, perhaps suggesting a model where income drawdown is used as an income supplement while working, with these people then converting their drawdown product into an annuity later on.
As with any primarily descriptive analysis one must be careful of drawing strong causal inferences. There is always the possibility that financial literacy and numeracy levels have been developed and retained into older ages as a result of past savings and portfolio choices. However, our analysis is looking within the set of individuals holding DC pensions, and conditioning on the amount of wealth held in the total portfolio (as well as the importance in the portfolio of DC pensions and other complex financial products), so one might expect some of these concerns to be less immediate than in broader studies in different contexts. It is also the case that, for most people, annuitization is a one-time choice, rather than a purchase that people repeat many times and thus learn from. Therefore, we might be less concerned in this context (than is often the case in other studies focusing on the role financial literacy) that measured financial literacy reflects the direct results of learning from previous interactions with the same market.
Even if one remains concerned about the role of endogenous accumulation of numeracy and financial literacy at older ages in driving these associations, it is still the case that, from a policy perspective, the current cohort of retirees in England is arriving at retirement with a level and distribution of numeracy and financial literacy that leaves them unable, or unwilling, to take advantage of the full distribution of annuitization choices available within the private pension system. This in turn might suggest a role for policymakers in either providing information or regulating the provision of information by annuity and pension providers. Indeed, there has been a suggestion that concerns regarding individuals’ willingness to exercise open market options, and the ensuing profitability of the annuity providers, have been one of the factors driving the recent move away from mandatory annuitization in the UK.
There is still much more to be learnt in this area, both about annuitization choices and about financial choices and decision making in older ages more generally. With a longer time-series of data it will be possible to study individuals’ choices of whether and when to cash in their DC pensions and how this is driven by similar factors to those studied here. Similarly, there are other financial products, particularly those relating to health and social care costs that are increasingly likely to be relevant to future cohorts of older adults, where similar issues will undoubtedly be relevant. The English data that we use here offer a particular set of possibilities for further research given the institutional framework and the importance of individual provision in the UK system. Among these are the possibility of studying the evolution of the patterns observed here as successive cohorts of retirees arrive at retirement with increasingly large fractions of their portfolio in DC funds, as the characteristics of ‘typical’ DC fund holders changes, as average retirement ages rise, and as the mandatory annuitization requirements in the UK system are removed. In addition, however, comparative work across different countries, and particularly those with harmonised data on cognitive function, portfolios and financial variables, should offer important avenues for future research.


 Open access