

1. INTRODUCTION
Glaciers are widely considered among the best climate indicators and referred to as a ‘natural thermometer’ for the Earth's climate (Vaughan and others, Reference Vaughan and Stocker2013). They adjust to climatic changes by changing their extent to adjust to a multi-year mass-balance trend. The sources of these changes include temperature variations and/or changes in precipitation, radiation or geothermal heat. The latter is particularly important for glaciers located on active volcanoes, as volcanic eruptions can cause destruction of ice, influence basal sliding, the surface albedo due to ejected pyroclastic material and even cause glacier advances (Rivera and others, Reference Rivera, Brown, Carrión and Zenteno2012). Furthermore, glaciers on active volcanoes can cause hazards such as lahars, jökulhlaups, slope instabilities and volcanic collapses, all exposing the local population to high risk (Lescinsky and Fink, Reference Lescinsky and Fink2000; Huggel and others, Reference Huggel, Ceballos, Pulgarín, Ramírez and Thouret2007b; Capra and others, Reference Capra, Bernal, Carrasco-Núñez and Roverato2013; Delgado Granados and others, Reference Delgado Granados, Haeberli and Whiteman2015; Barr and others, Reference Barr, Lynch, Mullan, De Siena and Spagnolo2018). Accordingly, permanent monitoring of the glaciers on volcanoes is essential to better understand the interaction between glaciers and volcanoes and protect the population from such hazards. Additionally, studies have suggested that glacier mass changes and the associated load variation can have an influence on volcanic activity and eruption rates. After the last deglaciation (12 000–7000 BP), eruption rates were globally two to six times higher than background levels and ~30 times higher in Iceland (Jull and McKenzie, Reference Jull and McKenzie1996; Maclennan and others, Reference Maclennan, Jull, McKenzie, Slater and Grönvold2002; Huybers and Langmuir, Reference Huybers and Langmuir2009). However, it is not well understood how today's smaller magnitude but much faster rate of climate change along with the recent glacier shrinkage will influence the volcanic activity, eruptive cycle, explosivity and what the response time of the volcanic activity would be. This is mostly due to the lack of data about how glacier mass changes affect the volcanic activity and eruption style (Tuffen, Reference Tuffen2010), but also due to a still limited number of glacier change studies on volcanoes. For example, Delgado Granados and others (Reference Delgado Granados, Julio, Huggel, Ortega del Valle and Alatorre2007) analysed glacier shrinkage in connection to the volcanic activity on Popocatépetl (Mexico), Huggel and others (Reference Huggel, Ceballos, Pulgarín, Ramírez and Thouret2007b) focused on volcano–ice interaction and associated hazards on Colombian volcanoes, whereas Veettil and others (Reference Veettil, Bremer, de Souza, Maier and Simões2015) reported on glacier changes on the Peruvian volcano Coropuna, and Rivera and Bown (Reference Rivera and Bown2013) quantified glacier changes on active volcanoes in southern Chile.
In this study, we present for the first time a continental-scale overview of glacier changes on active volcanoes in Latin America between 1986, 1999 and 2015 (dates depend on volcano). For this purpose, multispectral satellite scenes from various satellites (Landsat 4/5, 7, 8 and Sentinel-2) are used to generate glacier outlines and calculate related area changes through time. Glacier changes on volcanoes that experienced an eruption during the study period were analysed separately from glaciers on dormant volcanoes. The large sample of studied glaciers allowed us performing a statistical analysis and detection of trends in the interaction between glaciers and volcanoes. An analysis of past volcanic activity, climatic variability and a possible future evolution provide further insights. All glacier outlines will be made available in the GLIMS glacier database.
2. STUDY REGION
The study region is defined as the glacier-covered active volcanoes of Latin America from Mexico to the southern tip of South America but excluding the two Patagonian Icefields (Fig. 1). Active volcanoes are all volcanoes that showed some form of activity during the Holocene, which begins 11 700 BP as defined by the International Commission on Stratigraphy (Cohen and others, Reference Cohen, Finney, Gibbard and Fan2013). Some volcanoes, where evidence of activity is unclear but that might have shown Holocene activity, were also included. One of these is Tronador in Chile/Argentina (Fig. S26), which is considered active for Argentina and not active for Chile (Servicio National de Geología y Minería, 2015; Caselli, Reference Caselli2018).
Overview of the location of the 59 analysed glacier-covered volcanoes within their corresponding region and subregion. Black triangles indicate glacier-free volcanoes.
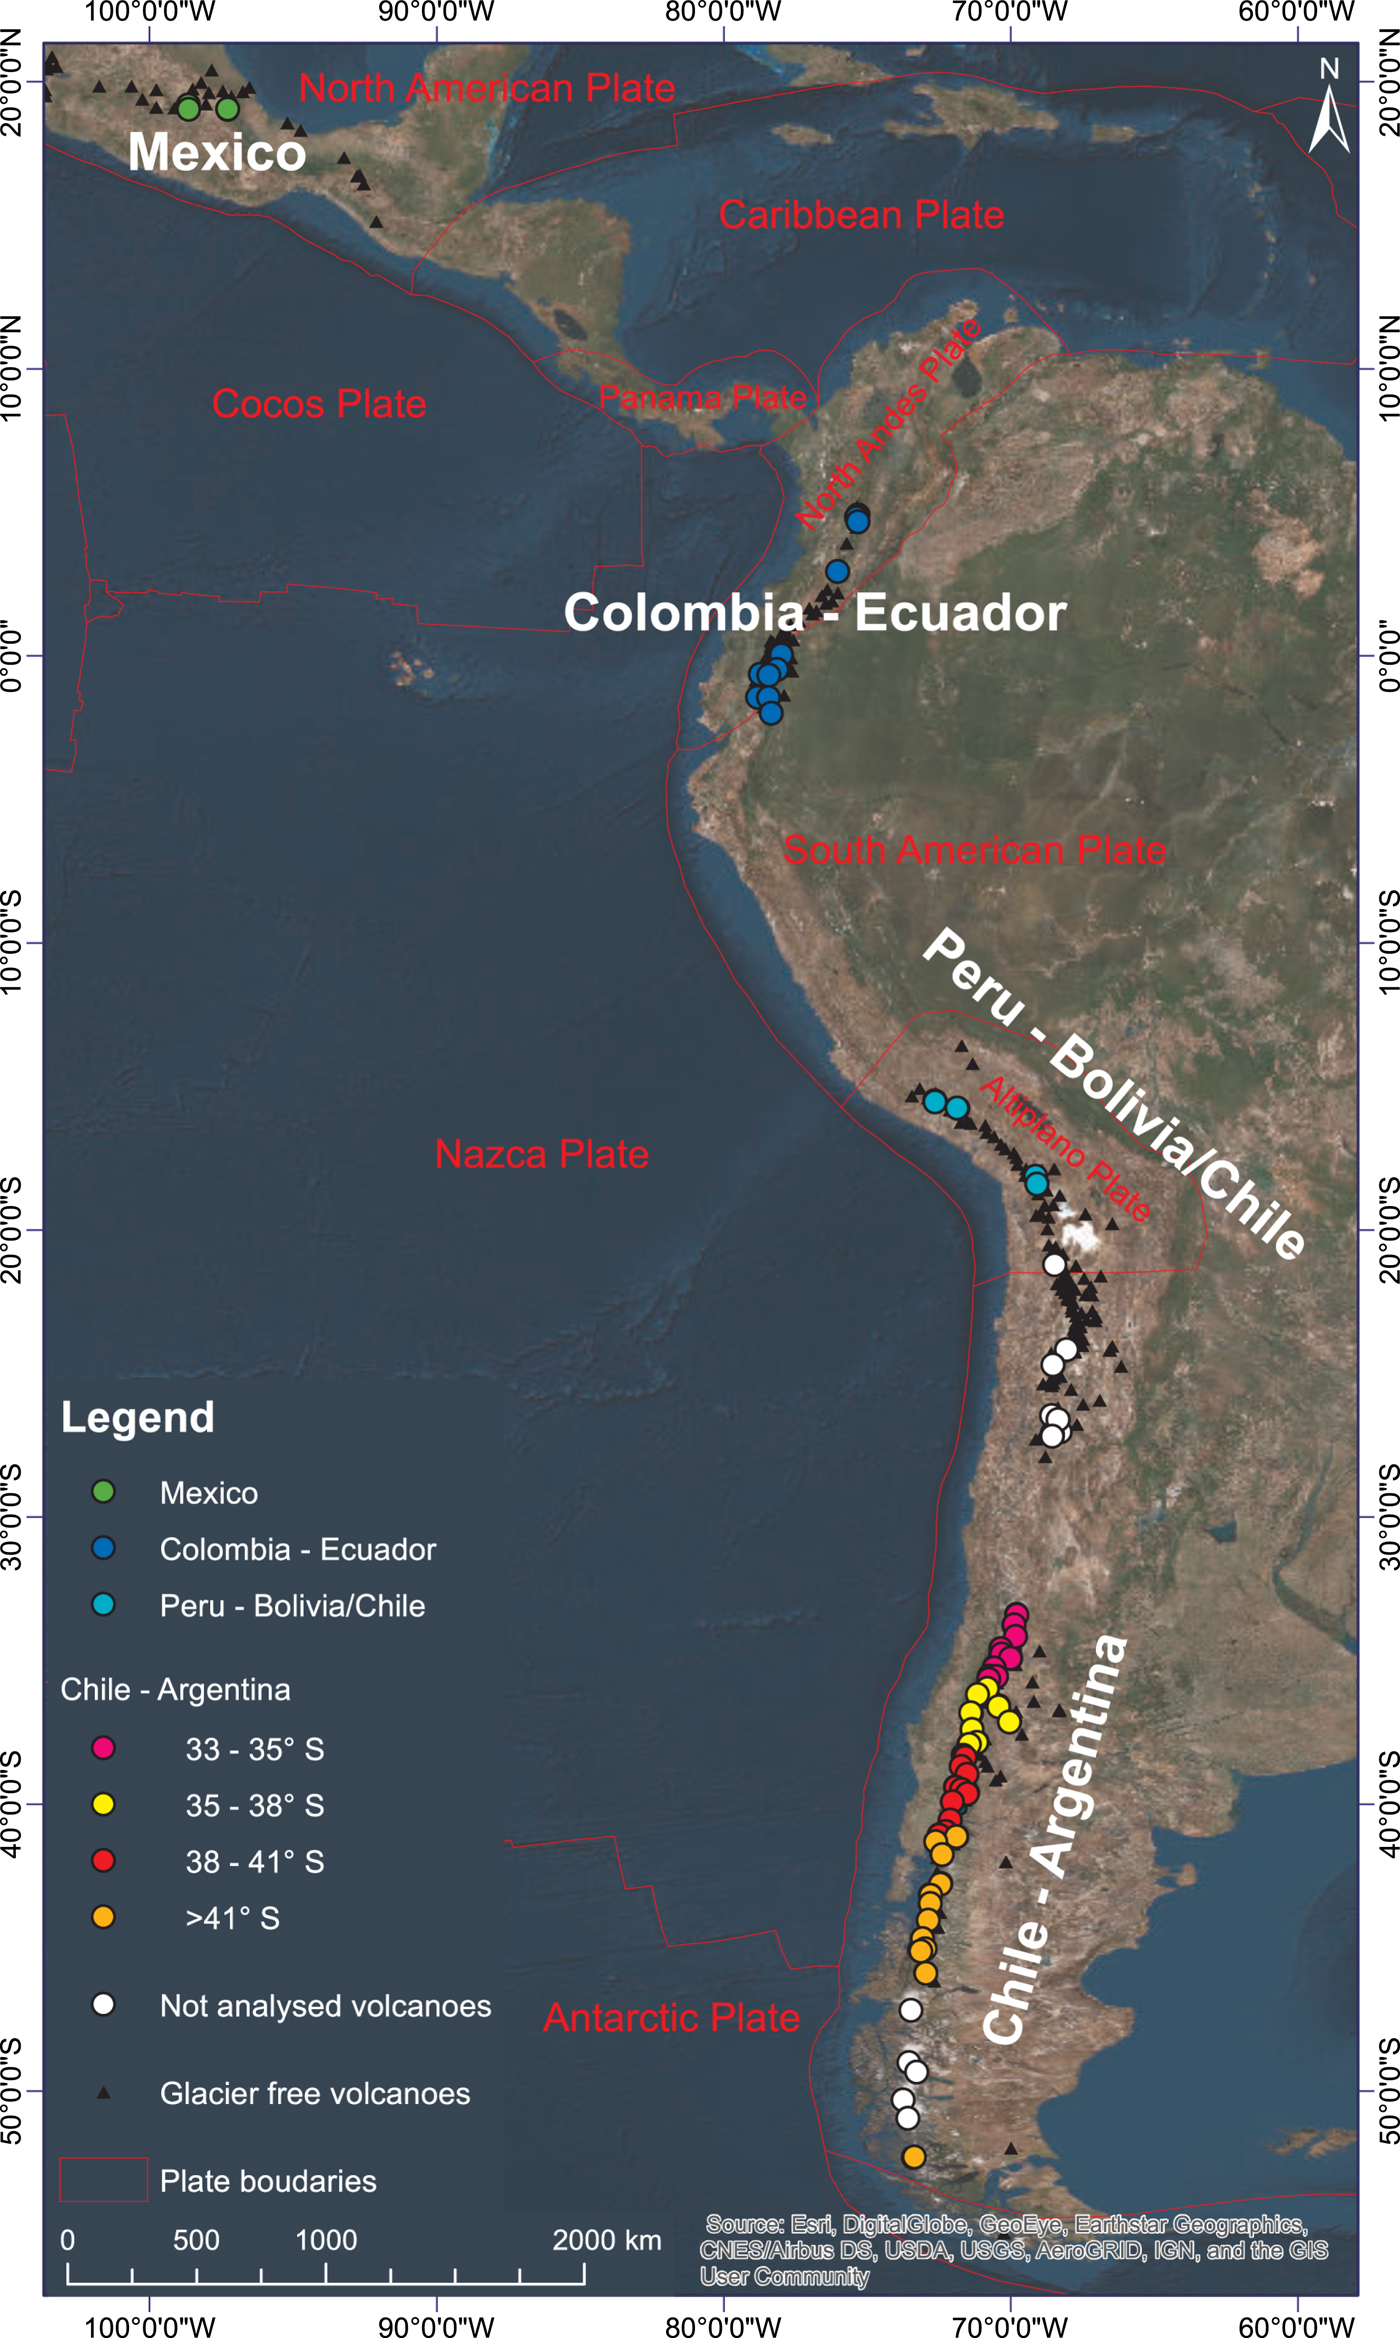
In Mexico, the volcanism of the Trans-Mexican Volcanic Belt is a result of the subduction of the Cocos and Rivera plates underneath the North American plate (Ferrari and others, Reference Ferrari, Orozco-Esquivel, Manea and Manea2012). In South America, the subduction of the Nazca and Antarctic plates underneath the South American plate is responsible for the high volcanic activity (Stern, Reference Stern2004). Volcanoes stretch almost continuously along the American Cordillera, apart from the Peruvian and Pampean flat slab segment as well as the Patagonian volcanic gap (Stern, Reference Stern2004). In Central America, volcanoes are not high enough for glaciers to form. In total, 76 active volcanoes that have or until recently had some ice cover were analysed in this study. For 59 of these, glacier areas were calculated for three points in time to determine change rates over two periods. To facilitate the graphical presentation of the results, glacier-covered volcanoes were divided into regions and sub-regions according to their location and latitude (see Fig. 1).
The climate from Mexico to the southern Andes varies largely due to its long north-south extension (10 000 km). The key requirements for the presence of glaciers are a temperature below 0 °C and sufficient solid precipitation. The intersection of the EL (equilibrium line) with the terrain determines the altitude at which glacier accumulation and ablation are equal (ELA) and therefore where glaciers can form if the terrain is higher (Condom and others, Reference Condom, Coudrain, Sicart and Théry2007; Benn and Evens, Reference Benn and Evens2010). Due to the high temperatures in the inner tropics, glaciers can only be found on the highest peaks (the lowest studied being Nevado de Santa Isabel at 4944 m a.s.l.; Fig. S2) even though precipitation is abundant. Cáceres (Reference Cáceres2010) sets the ELA to 4700 m a.s.l. for the inner tropics. In the dry Andes, precipitation is rare (wet season between January and March) and its seasonal distribution is the main driver of glacier mass balance (Rabatel and others, Reference Rabatel2013). Rabatel and others (Reference Rabatel2012) set the ELA for Zongo glacier (Bolivia) at 5150 m a.s.l. In the southern Andes, the climate is much cooler and abundant precipitation favours the formation of large glaciers and the two Patagonian Ice Fields. For example, Aniya and others (Reference Aniya1996) give an ELA of ~1000 m a.s.l. in southern Patagonia. Additionally, all Andean glaciers (but especially those in tropical regions) are particularly sensitive to changes in sea surface temperatures and the El Niño Southern Oscillation (Francou and others, Reference Francou, Vuille, Favier, Cáceres and Ca2004; Bown and Rivera, Reference Bown and Rivera2007; Veettil and others, Reference Veettil, Leandro Bayer Maier, Bremer and de Souza2014).
3. DATASETS
3.1 Data used for glacier mapping
For the calculation of present and past glacier outlines, scenes from multi-spectral Landsat 4 or 5 Thematic Mapper (TM), Landsat 7 Enhanced Thematic Mapper Plus (ETM+), Landsat 8 Operational Land Imager (OLI) and Sentinel-2A Multi Spectral Instrument (MSI) sensors (all obtained from glovis.usgs.gov) were used. All scenes were provided as orthorectified images (Level 1 T) in geotif format with a projection referring to the respective UTM zone. The resulting outlines were re-projected to the world cylindrical equal area projection for the analysis. In total, 72 different scenes were selected to map glacier outlines, of which 38 are Landsat TM (24 for time step 1986 and 14 for 1999), 11 Landsat ETM+ (all for 1999), 20 Landsat OLI and 3 Sentinel-2 (all for 2015) scenes. A list of all scenes used is provided in Table S2. Additionally, for the manual editing of the outlines, Google Earth™ images as well as the outlines of the GLIMS database (https://www.glims.org) were considered to support the interpretation.
3.2 Scene selection
All satellite scenes were manually selected to avoid seasonal snow and clouds and all glacier outlines were manually corrected to include glaciers covered by ash and debris. Selection of the best possible satellite scenes is required to derive the most accurate results. Hence, scenes with the least amount of seasonal snow are preferred as otherwise snow cover might hide the glacier perimeter. The date of minimal snow cover varies by the region and usually differs each year. As there are no seasons in the tropics, most of the year could feature the date of minimal snow cover. However, in most regions, the period between November and February (dry season) showed minimal snow and cloud cover. In Mexico, even though it is in the northern hemisphere where usually the date of minimal snow cover is at the end of the boreal summer, images were chosen from February to March. This corresponds to the end of the dry season as in May the wet season starts and more snow is present at high altitudes.
For most of Chile and Argentina, the date of minimal snow cover is again near the end of the summer and in early autumn. Most images were acquired from February to April, generally before the first large snowfall of the year. As these dates can vary from year to year, the date of minimal snow cover also varies. For some glaciers, no images without snow and clouds could be found. In such cases, scenes from different dates (±1 year but locally up to 3 years) were combined to capture the whole glacier perimeter.
3.3 Volcano data
The interaction of glaciers and volcanoes was analysed using a volcano database provided by UNAM (Universidad National Autónoma de Mexico). The database is based on the Smithsonian Volcano Database (Global Volcanism Program, Reference Venzke2013a) with the same features, but it only contains the volcanoes valid for this study (Mexico and South America), and it includes also information provided by several researches and volcano monitoring institutions in Latin America (Ortiz and others, Reference Ortiz Guerrero, Brown, Delgado-Granados, Lombana-Criollo, Loughlin, Sparks, Brown, Jenkins and Vye-Brown2015). For this study, data of all volcanoes that have shown some activity in the Holocene were extracted from the database to quantify the differences between regions and between volcanoes with and without glacier cover. The extracted datasets were stored locally and could be accessed by SQL queries within the open source program pgAdmin 3. In total, the database contains information of 237 volcanoes that were active during the Holocene (76 glacier covered and 161 glacier free), with a total of 1374 known eruptions (as of December 2016). Other stored volcano-related information is location, population within a certain radius (5, 10, 30 and 100 km), volcano characteristics, rock types and volumes. The database also contains eruption details such as the start and stop date, Volcano Explosivity Index (VEI), eruption volume and other eruption characteristics (e.g. eruption location). Furthermore, hazards, fatalities and pre-eruptive indices are listed in the database. A full description of the database feature can be found in Siebert and others (Reference Siebert, Simkin and Kimberly2010) and Ortiz and others (Reference Ortiz Guerrero, Brown, Delgado-Granados, Lombana-Criollo, Loughlin, Sparks, Brown, Jenkins and Vye-Brown2015).
The volcanic activity over the study period of each volcano was quantified using a new volcanic activity index. It is a combination of the eruption frequency and the VEI of each eruption and is calculated by adding up the VEI values of all eruptions that have taken place on the volcano over the observation period. For example, Popocatépetl had four eruptive events since 1985, three with a VEI 2 and one with VEI 3, therefore the activity index is 9 (2 + 2 + 2 + 3). The activity index should only be seen as a conceptual classification for a simplified quantification of the volcanic activity, as the VEI normally uses a logarithmic scale. Additionally, this index does not include non-eruptive features such as geothermal heat variations that might also affect the glaciers (Hemmings and others, Reference Hemmings, Whitaker, Gottsmann and Hawes2016).
4. METHODS
4.1 Glacier mapping
As Landsat 4/5 (TM) were launched in 1982/1984, respectively, the study period was initially divided into the three time steps 1985, 2000 and 2015 to have a 30-year study period with equal intervals. Sometimes, useful scenes could not be found in a specific year and earlier/later years were considered as well. As the number of useful scenes for 1985 or earlier was limited, most of them were acquired during 1986 and 1987. On average, scenes were taken from the years 1986, 1999 and 2015.
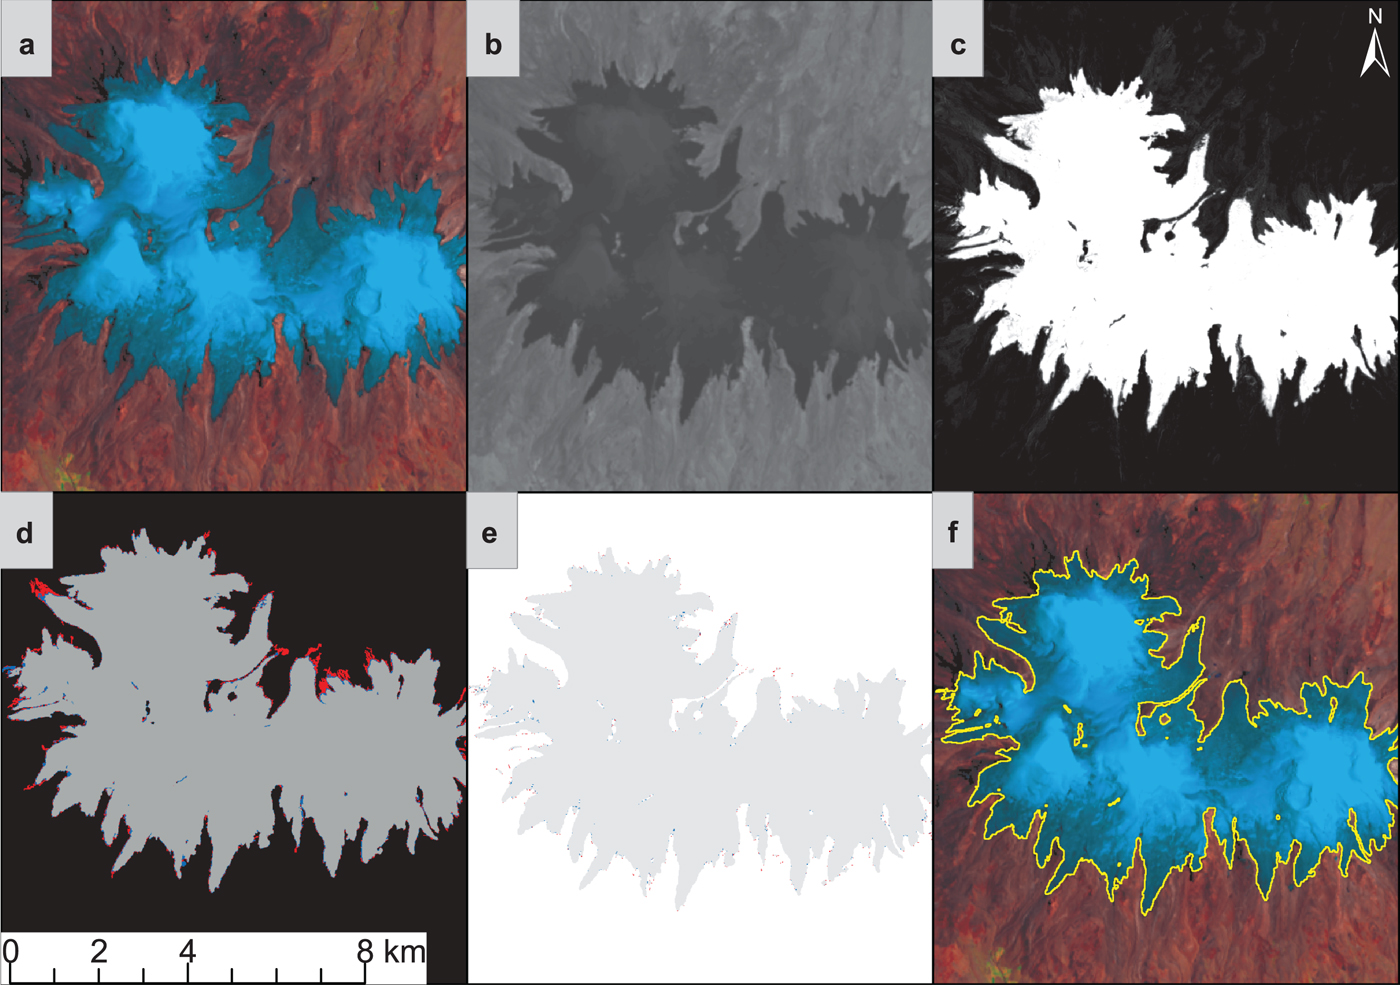
Scenes with minimal snow cover were selected by visually comparing false-colour-composites (bands 543 as RGB for Landsat 5 and 7, Fig. 2a). Glacier outlines for clean ice were generated using the semi-automatic band-ratio method introduced by Hall and others (Reference Hall, Ormsby, Bindschadler and Siddalingaiah1987). It is based on the very specific spectral reflectance properties of snow and ice compared to other surface types. Snow and glacier ice absorb most of the short-wave infrared (SWIR) radiation and appear very dark compared to their reflectance in the red or near infrared (NIR) band (Fig. 2b). By using multispectral satellites that also feature a SWIR band, this method can be applied for a rapid and precise glacier outline generation, at least for clean to slightly dirty ice (Paul, Reference Paul2002). In a first step, the raw digital numbers (DNs) of a red or NIR band are divided by the SWIR band DNs. In this ratio image, clean glacierice has high values whereas all other terrain types have low values (Fig. 2c). Using a NIR band instead of the red band results in a reduced sensitivity to atmospheric scattering and a lower likelihood of shadows being wrongly mapped as glacier ice. The red band, on the other hand, performs better in detecting ice and snow in shadow and does not misclassify vegetation in shadow as glaciers (Paul and others, Reference Paul2015). For Landsat 4/5 and 7 images, the NIR band was chosen over the red band due to the limited regions with vegetation and shadow on cone-shaped volcanoes. For Landsat 8, band 8 (panchromatic) was preferred over the NIR or red band due to its higher resolution (15 m). For this purpose, the 30 m OLI SWIR band 6 was first bilinearly resampled to match the pan-band resolution (Paul and others, Reference Paul, Winsvold, Kääb, Nagler and Schwaizer2016). An overview of the satellite sensors, time periods, band combinations and threshold values used is presented in Table 1. A list of all satellite scenes used can be found in Table S2.
Example of the mapping process for Coropuna (Peru). (a) Landsat 8 false colour image (bands 654 as RGB), (b) SWIR band, (c) ratio image, (d) image after applying different threshold numbers (grey = 1.4, grey + blue = 1.2, grey + blue + red = 1.1), (e) image after applying the median filter (blue: added pixels, red: removed pixels), (f) final glacier outline as vector polygon.
Overview of used satellites for the specific time period with their bands, resolution and threshold values

In a second step, a threshold value was manually selected and applied to a separate glacier area from a non-glacier area (Fig. 2d). Thirdly, a median filter (3 × 3 kernel) was used to fill small gaps resulting from rocks on the ice and to remove small snow patches (Raup and others, Reference Raup2007) (Fig. 2e). By using the same median filter for all glaciers, the correction is uniform without subjective interpretation. The resulting binary glacier map in raster format (geotif) was converted to glacier outlines (Fig. 2f) in vector format (shapefile) and its area calculated following Paul (Reference Paul2002). In the case of misclassification, like in regions with cast shadow or debris cover, glacier outlines were manually edited. The same approach was applied to all glaciers, independent of the sensor and region. In addition, the ice cover of each volcano was interpreted as one entity (i.e. as a glacier complex) rather than divided by hydrological or national borders. The calculated relative area changes have thus to be interpreted with care. Annual change rates were calculated using the satellite scene acquisition dates (day and year). In the case of regional and total change rates, acquisition dates for each time step were averaged.
Paul and others (Reference Paul2013) found that manual delineation of glacier outlines shows a variability of about one pixel (±15 m for TM) for clean ice and two pixels for debris-covered ice. In order to estimate the uncertainty of the generated outlines in this study, a buffer of ±1/2 pixel was applied and the relative change in area calculated. For small glaciers, the related area uncertainties are thus larger than for large glaciers. For the entire study region, the resulting mean area uncertainty was 5.7% for 1986, 5.6% for 1999 and 3.4% for 2015. For the threshold value determination in the second step, different values were tested, especially in the shadow area. An example of how different values change the mapped area is depicted in Figure 2d. Here, the glacier does only have small areas in shadow, but a difference in the mapped area is well visible, especially with threshold values lower than 1.3. For Landsat 8, mostly the threshold values of 1.2 or 1.4 were used. For Coropuna, the area difference between the two threshold values was <1%, whereas 1.2 would already lead to a 2.5% larger glacier extent and 1.1 to an inclrease of almost 6%.
4.2 Challenges and limitations
At a spatial resolution of 30 m (TM), glaciers as small as 0.01 km2 (equivalent to ~11 pixels) might be identified. However, the uncertainty of the area determination strongly increases towards smaller glaciers and might easily reach 10–20% for glaciers <0.1 km2 (Paul and others, Reference Paul2013; Pfeffer and others, Reference Pfeffer2014; Fischer and others, Reference Fischer, Huss and Hoelzle2015). As area changes have to be larger than the uncertainty to be significant, changes in some very small glaciers might not be significant. However, most glaciers in our sample are larger than 0.5 km2 so that also area changes smaller than 5% will likely be significant.
As some parts of debris-covered glaciers could not be accurately mapped automatically when using the band ratio or other methods, manual editing was applied to include such regions. Of course, the subjective interpretation is a source of uncertainty. Paul and others (Reference Paul2013) suggest checking high-resolution images that might be available in Google Earth™ or other tools to visually interpret the debris-covered part, even if the images were not taken on the same date. For scenes acquired in the 1980s, this is more difficult as suitable high-resolution images are seldom available. Hence, higher uncertainties in interpretation have to be considered for this earlier time period.
Apart from debris cover, glaciers on active volcanoes may also have a temporary ash layer on the ice surface after an eruption. If the ash layer is relatively thin, the thermal band of the Landsat satellites can be useful to determine the glacier outline (Raup and others, Reference Raup2007). As the resolution of this band is 120 m for Landsat 4/5, 100 m for Landsat 8 and 60 m for Landsat 7, it can only be used as an additional indicator rather than for primary mapping. Furthermore, especially in tropical regions, the presence of clouds is one of the greatest limitations of optical sensors. Due to the high altitude of tropical glacier-covered volcanoes, they are frequently cloud covered and images of the entire glacier area without seasonal snow and clouds are rare. However, by combining multiple scenes, it was possible to fill cloud-covered parts and get glacier outlines for the entire ice cap (Paul and others, Reference Paul2017).
Another limitation of the band ratio method when using the NIR band is the sometimes poor performance in cast shadow. Due to the low reflectance of both channels (NIR and SWIR) in such regions, ice bodies have also low values when calculating the ratio (Paul, Reference Paul2002). By using a lower threshold value, ice in cast shadow can be included as well but the performance of the method might be degraded in other regions. In such a case, a compromise among several threshold values is needed to get the best performance over the entire glacier area. Another option is to use a different threshold value only for the shadow area and combine it with the result of the shadow-free classification afterwards. Nevertheless, manual corrections had to be applied for parts of some glaciers in cast shadows (Paul and others, Reference Paul, Winsvold, Kääb, Nagler and Schwaizer2016).
5. RESULTS
5.1 Glacier inventory
In total, 76 volcanoes with some form of ice cover were initially detected. For 59 of these, area values were derived. The other 17 were either under the Patagonian Ice Fields or too small to be properly detected at 30 m resolution. Especially in northern Chile and Argentina, the distinction between small multiyear firn patches and glacier ice could not be made using 30 m resolution images. High-resolution images from the 1980s would have been necessary to properly identify the glaciers. Volcanoes under the Patagonian Ice Fields were excluded due to the difficulty of confining the glacier area influenced by the volcano and the already existing studies on glacier outlines (White and Copland, Reference White and Copland2015; Davies and Glasser, Reference Davies and Glasser2012).
After glacier outlines were corrected and areas were calculated, a frequency analysis per size class was performed to obtain the general characteristics of the studied sample. The related histogram of glacier count and area at the different points in time is shown in Figure 3. The distribution is very broad, reaching from glaciers as small as 0.1 km2 to large ice masses with more than 100 km2. In 1986, no glacier was in the class of 0.5 km2 or smaller, whereas in 2015 ~14% of the glaciers are smaller than 0.5 km2. Note that there are two glaciers fewer in 2015 compared to 1986 and 1999 as they melted away after 1999. The largest part (45% in 2015) of the total glacier area is comprised of glaciers larger than 100 km2. For 1986 and 1999, its contribution was 39 and 43%, respectively. Small glaciers, even though these are larger in number, only make up a fraction of the total glacier area. Glaciers smaller than 25 km2 (75% of all glaciers for 1986, 80% for 1999 and 81% for 2015) only contribute ~25% to the total glacier area in all years. In statistical terms, the mean glacier area is 17.83 km2 with a std dev. of 31.08 km2.
Glacier count (bars) and area (lines) per size class for the three investigated dates.

5.2 Glacier change
All glaciers lost area within the study period. The relative change of all glaciers combined was −27.4 or −0.92% a−1 over the full 1986–2015 period. In absolute terms, this corresponds to a decrease of 383.21 km2 from an initial total area of 1399.3 ± 80 to 1016.1 ± 34 km2. The overall area shrinkage rate changed from −1.20% a−1 before 1999 to −0.83% a−1 afterwards. It is noticeable, that all regions have a lower retreat rate in the second period. Only a few glaciers had temporary advances or stagnation: for example, the volcanoes Tupungatito (Fig. S10) and San José (Fig. S11) before 1999 and Descabezado Grande (Fig. S14), Cerro Azul (Fig. S15) and Lonquimay (Fig. S21) after 1999. Overall, they all lost area over the full study period. Partly, these stagnations and temporary advances might be related to wrongly mapped seasonal snow (for Tupungatito and San José) as glacier fronts continued to retreat. On the other hand, this pattern might also be due to an adjustment of glaciers in terms of thickness rather than area, something that could not be measured with the 2-D method applied here. Two volcanoes lost their entire glacier cover during the observation period: Popocatépetl in Mexico (Fig. S1) and Tungurahua in Ecuador (Fig. S9).
Plotting the relative change in area against initial glacier size (Fig. 4) shows that there is a correlation between them. There is a large spread of relative changes for all sizes (r = 0.56), but generally, small glaciers lost more area relative to their initial size than large glaciers. Nevertheless, six of the glaciers larger than 5 km2 lost more than 70% of their area. On the other hand, eight glaciers smaller than 15 km2 lost <40% of their area. Glaciers larger than 100 km2 lost ~20% of their area and showed change rates of −0.20 to −0.92% a−1.
Relative glacier area change (black dots) and absolute change rate (orange squares) vs initial glacier size.

Plotting the relative change rate and initial area against the latitude, geographical differences can be detected (Fig. 5). At low latitudes (20°N to 20°S), change rates of the glaciers show a high variability independent of the initial glacier area (mean relative change rate of −2.51% a−1 ± 2.43%). The change rate of Tungurahua glacier is not shown in Figure 5, as it is with −11.93% a−1 much higher than all others and represents a clear example of the above-mentioned high variability. From 33 to 41°S, the variability of the change rates is lower than in inter-tropical regions and correlates with glacier area (mean relative change rate of −1.85% a−1 ± 0.84%). South of 41°S glacier change rates are more uniform and generally lower than further north, independent of their size (mean relative change rate of 0.75% a−1 ± 0.24%). A complete list of all area changes for each volcano and time step can be found in Table S1.
Glacier area change rates (1986–2015) vs latitude. Circle size indicates the initial glacier area. Tungurahua is not plotted here due to its high change rate of −11.93% a−1.

5.3 Regional glacier area changes
Relative area changes for the different regions are presented in Figure 6a. The largest changes were found in subtropical Mexico. In total, 2.79 ± 0.38 km2 of glacier area was present in 1986/87 on the three high-altitude volcanoes in Mexico, of which only 0.80 ± 0.07 km2 remained in 2017. Iztaccíhuatl (Fig. 7a) lost 57.6% of its area from 1987 to 2017, Pico de Orizaba (Fig. 7b) lost 66.1% from 1986 to 2017, and Popocatépetl (Fig. S1), the most active volcano, lost its entire glacier area after the eruptive period starting in 1994 (Julio Miranda and Delgado Granados, Reference Julio Miranda and Delgado Granados2003; Andrés and others, Reference Andrés, Zamorano, SanJosé, Atkinson and Palacios2007). In April of the year 2000, there was still half of the glacier area left (0.28 ± 0.04 km2) compared to 1987, but the glacier became extinct in the late year 2000 after a phase of intense eruptions (Delgado Granados and others, Reference Delgado Granados, Julio, Huggel, Ortega del Valle and Alatorre2007).
(a) Relative area change for each region (CL = Chile, AR = Argentina). (b) Relative area change of Colombia and Ecuador.

Glacier outline overlays for Iztaccíhuatl (a) and Pico de Orizaba (b), the only two still glacier-covered volcanoes of Mexico.

In Colombia and Ecuador, the glacier retreat was smaller than in Mexico, with 40.1% being lost during the study period (114.95 ± 5.27 km2 in 1987 and 68.91 ± 2.09 km2 in 2016). Surprisingly, the regions of Colombia and Ecuador show large differences in their glacier development (see Fig. 6b). Whereas the volcanoes of Colombia show an increase in the area change rate after 2001 (from −1.61 to −2.24% a−1), the glaciers on Ecuadorian volcanoes display a decreasing change rate after 1999 (from −1.49 to −0.75% a−1). Cayambe (Fig. S3) is the northern most volcano in Ecuador and has the most constant change rate over the full period. By intersecting the outlines from this study with elevation change data from Braun and others (Reference Braun2019), the amount of thinning could be estimated. Glaciers on Ecuadorian volcanoes show between 2000 and 2012/14 on average slightly less elevation change (−0.41 m) than glaciers on Colombian volcanoes (−0.51 m). We have to add that Tungurahua lost its entire ice cover after 1998 and therefore does not influence the average after 1999.
Tropical glaciers are known to be linked to changes in sea-surface temperature and ENSO variability on a decadal timescale (Vuille and others, Reference Vuille2008), but Rabatel and others (Reference Rabatel2013) state that glaciers in Colombia and Ecuador react in a similar manner to such climate impact. Thus, the observed differences must have also other origins than volcanic activity (Huggel and others, Reference Huggel, Ceballos, Pulgarín, Ramírez and Thouret2007b). A related comparison of glacier changes of Nevado de Huila (Columbia) and Cotopaxi (Ecuador) is presented in Figure 8.
Glacier outline overlays for Nevado de Huila (a) and Cotopaxi (b).

Glaciers on volcanoes in Peru and on the Chilean–Bolivian border had an overall relative change of −45.3%. In absolute values, the initial glacier area was 103.05 ± 4.99 km2 in 1987 and shrunk to just 56.49 ± 1.87 km2 in 2016; most on Guallatiri (−2.69% a−1; Fig. S8) and Sabancaya (−2.54% a−1; Fig. S6), less on Parinacota-Pomerape (−1.94% a−1; Fig. S7) and Coropuna (−0.86% a−1; Fig. S5). All volcanoes except Coropuna had a higher area loss rate during the first period. Sabancaya, being one of the most active volcanoes in the region with nine eruptions since 1986, lost most of its area and the pre-existing ice cover broke up into many independent patches. Glaciers on Coropuna on the other hand, being much larger and higher, had a constant area loss rate and still form a continuous ice cap.
Glaciers along the Chilean–Argentinian border were divided into four subregions according to their latitude (see Fig. 1). Between 33 and 35°S (Tupungatito to Cerro Azul), the Andes largest volcanic ice covers can be found (outside the Patagonian Ice Fields). These are around Tupungatito (Fig. S10), San José (Fig. S11) and Palomo (Fig. S12) with each still holding more than 100 km2 of glacier area in 2015. Furthermore, these glaciers are all characterised by debris-covered tongues. Apart from the three large ice masses, the other volcanoes in this subregion hold smaller ice caps. The relative area loss in this subregion is −22.6%, slightly lower than the overall average, with area changes from 489.24 ± 36.56 km2 in 1986 to 378.50 ± 15.74 km2 in 2015. As in other regions, area loss rates are higher (−0.84% a−1) before 1999 and lower (−0.68% a−1) after 1999. Only Tupungatito and San José showed an accelerating shrinkage, but the satellite scenes from 2001 might have some seasonal snow included and would thus underestimate glacier shrinkage. This is supported by the observed continued retreat of glacier fronts. Nevertheless, the overall small relative change rate is supported by the study of Rivera and others (Reference Rivera, Bravo and Buob2017) who found a relative area loss of Marmolejo and San José of just 5% between 1986 and 2013.
Between 35 and 38°S (San Pedro-Pellado to Tolhuaca), volcanic ice covers are much smaller than further north. The total glacier area decreased from 71.60 ± 9.86 km2 in 1988 to just 27.34 ± 2.81 km2 in 2016. The relative area loss is −61.8% and, after Mexico, the second highest of all regions and subregions. The highest relative area loss was observed for Nevado de Longaví (Fig. S16; −96.2%) with just 0.085 ± 0.03 km2 remaining (in 2017) of initially 2.76 ± 0.52 km2 (in 1989). Domuyo (Fig. S17) is the highest volcano in this subregion and lost the ‘smallest’ fraction of its area (−42.9% from 1986 to 2015) in this region. The trend of decelerating change rates is also present in this sub-region. The change rate before 1999 was −3.20% a−1 and decreased to −1.43% a−1 afterwards. Three of the nine volcanoes showed an accelerating change rate (see Table S1), being Copahue (Fig. S18) and Callaqui (Fig. S19), which both experienced multiple eruptions, and Tolhuaca (Fig. S20).
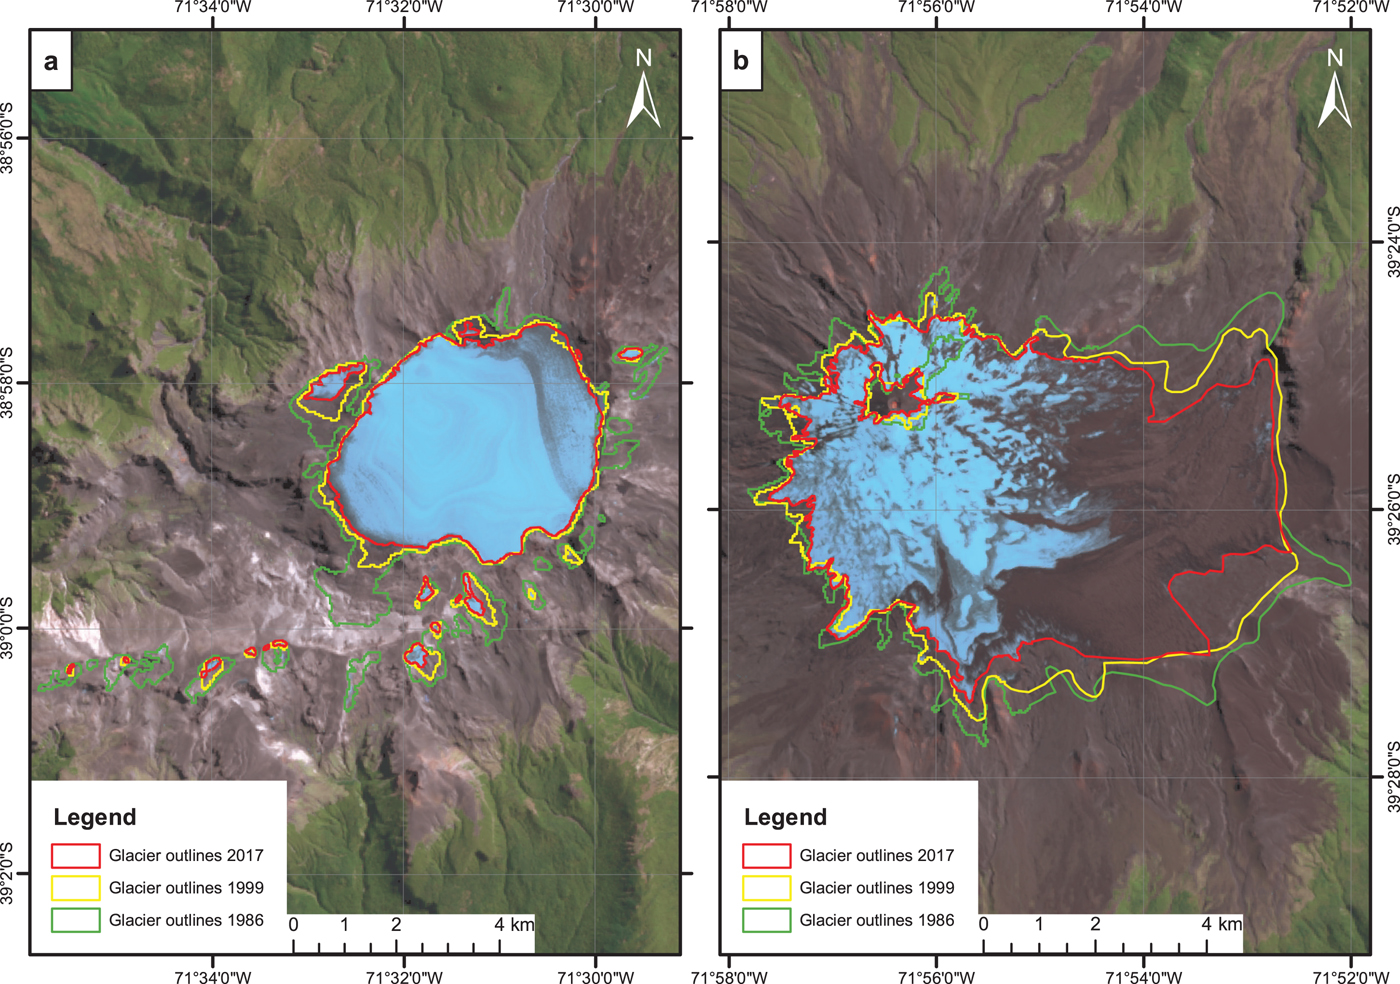
The sub-region between 38 and 41°S (Lonquimay to Osorno) contains Llaima (Fig. S22) and Villarrica (Fig. 9b), two of the most active ice-capped volcanoes in entire Latin America (11 and 15 eruptions, respectively, since 1990). The relative area loss in this subregion was −37.1% and therefore much less than between 35 and 38°S. The total area decreased from 111.62 ± 6.39 km2 in 1986 to 70.22 ± 2.2 km2 in 2016, which results in an average change rate of −1.22% a−1. All glaciers displayed a slower change rate after 1999 except on Puyehue-Cordón Caulle (Fig. S25). Here, the glacier still filled the whole crater in 1986 (total area of 2.37 ± 0.17 km2). By 1999, it shrank to 1.57 ± 0.15 km2 and by 2015 was only visible on the north-western inner slope of the crater (0.24 ± 0.04 km2), while the remaining area was likely covered by tephra during the VEI 5 eruption of 2011 that took place at the Cordón-Caulle fissure north of the Puyehue crater. Villarrica, even though it experienced multiple eruptions during the study period, lost less glacier area (−0.77% a−1) than other volcanoes in the region (e.g. Mocho-Choshuenco lost −1.10% a−1; Fig. S24 or Quetrupillán lost −2.26% a−1; Fig. S23).
Glacier outline overlays for Sollipulli (a) and Villarrica (b).
South of 41°S (Monte Tronador to Monte Burney) relative glacier area change was, with −18.2%, the smallest of all subregions. The changes were also the most uniform with a standard deviation of 7.7%. In absolute terms, the glacier area changed from 506.02 ± 16.50 km2 in 1985 to 413.81 ± 9.35 km2 in 2015. In addition, the volcanic activity played a minor role for this subregion with only two eruptions (both on Hudson Volcano; Fig. S29) recorded during the study period. Additionally, Chaitén volcano near Michinmahuida (Fig. S28) erupted in 2008 and covered the nearby glacier with a 10–20 cm thick ash layer (Alfano and others, Reference Alfano2011; Rivera and others, Reference Rivera, Brown, Carrión and Zenteno2012). Calbuco volcano (Fig. S27) started erupting just a few days after the image used for calculating the area of 2015 was acquired. This might have an impact on future glacier area evolution.
5.4. Area changes and volcanic activity
When a volcanic eruption occurs on a volcano with a small ice cover, the proportional effects on glacier area is larger. Popocatépetl and Tungurahua both had an area of <1 km2 at the beginning of the study period and lost all of it following continuous volcanic activity. Copahue lost 88.5% of its initial 7.05 km2 ice cover from 1989 to 2016 following seven eruptions within this time. On Sabancaya, 77.9% of the glacier area was lost between 1986 and 2016 following nine eruptions. Focusing on total area loss, Hudson Volcano lost the largest amount of glacier area of the volcanoes that experienced an eruption (−27.35 km2 between 1985 and 2016 or −18.4%). Only two eruptions occurred within the study period (1991 and 2011), but the eruption of 1991 was classified as VEI 5 and was one of the largest eruptions of the 20th century worldwide. Rivera and Bown (Reference Rivera and Bown2013) state that an ice-covered area of 20 km2 within the caldera melted or became severely disrupted during the 1991 eruption but partly recovered afterwards.
Another VEI 5 eruption took place at Puyehue-Cordón Caulle in 2011. It was a rift zone eruption located north of the 1960 fissure of Cordón Caulle and covered the glacier at Puyehue with a tephra layer (Global Volcanism Program, Reference Wunderman2013b). Centro de Estudios Cientificos (2011) calculated a change rate of just −0.56% a−1 between 1985 and 2011 (scene taken before the eruption). At that time, most of the glacier was present and visible in the crater of Puyehue. In 2015, only a small patch of ice was visible on the inner north side of the crater. ASTER thermal images indicate the presence of ice, but at this point, it is not possible to verify how much ice was buried underneath the tephra. Therefore, further research is necessary to confirm the presence of ice in the Puyehue crater and the 2015 glacier extent might need to be recalculated. Planchón-Peteroa (Fig. S13) lost 17.17 km2 (or −1.92% a−1) of ice cover between 1986 and 2015 following four eruptions. Centro de estudios Cientificos (2011) measured a change rate of −2.14% a−1 for the Chilean part of the glacier between 1985 and 2011. Llaima, the volcano with the highest activity index (19), lost 54.7% of its glacier area between 1986 and 2017 down from initially 12.23 ± 1.12 km2. Most ice was lost on the western slopes, as the eastern slopes are partly debris covered and thus better insulated. Glasser and others (Reference Glasser2016) confirm that on the northern Patagonian Ice Field, a larger portion of debris cover was found on eastern and northern slopes. This is probably due to the predominant wind direction, especially in the case of Llaima and Villarrica, where the material ejected during an eruption is mostly transported eastward.
Not all glaciers on volcanoes with eruptions had a noticeable increase in the rate of glacier area reduction (e.g., Cotopaxi, Villarrica and Tupungatito, all lost <25% of their area during the study period). For Cotopaxi in Ecuador, one eruption occurred starting on 14 August 2015 and ending on 24 January 2016, just a few days before the satellite image for the glacier mapping was taken (2 February 2016). On that image (Fig. 8b), large parts of the ice were still covered with ash and tephra. Troncoso and others (Reference Troncoso2017) estimated a layer thickness of <2 mm that would initially lead to a lower albedo and a higher ablation. Tupungatito holds one of the largest ice masses in central Chile, and as of 2016, it covers an area of 112.84 ± 3.66 km2, down from 119.89 ± 8.36 km2 in 1986. During the study period, two eruptions occurred, a very small VEI 1 eruption in 1986 and a VEI 2 eruption in 1987. The latter one triggered a mudflow, which killed 49 people in the region. The eruption was limited to the crater area and only parts of the ice were covered with an ash layer (Global Volcanism Program, 1987). Because of the size of the ice mass, the volcanic eruption was not large enough to change the glacier area significantly.
6. DISCUSSION
6.1 Glacier mapping and seasonal snow
Glacier mapping using carefully selected multispectral satellite scenes and the band-ratio method has been proven as a useful and reliable tool, at least for bare ice. The main advantages are its fast performance and the reproducibility of results. When applying this method to all glaciers, results are comparable with only little subjective interpretation (e.g. for the threshold). Nevertheless, some limitations persist like the presence of a debris/ash cover, shadow areas, clouds and seasonal snow. Such regions have been manually corrected to the extent possible but we admit that locally also other interpretations might be possible. However, we do not expect any impact on our main results and conclusions.
6.2 Comparison of area changes with volcano data
When combining glacier change data with volcanic eruption data, possible differences can be identified between glaciers on volcanoes that experienced eruptions and glaciers on dormant volcanoes. All volcanoes listed below are considered active. Therefore, fumaroles, enhanced geothermal heat flow and other non-eruptive features could still be present. The observed glaciers were split into two groups: the first group consists of all glaciers on volcanoes that experienced an eruption within the study period, the second of glaciers on dormant volcanoes. In total, 19 volcanoes erupted during the study period, five just once and the other 12 multiple times. In Table 2, the mean relative area change of volcanoes with, vs without, eruptions is listed.
Differences between glacier area change on volcanoes with and without eruptions

A statistical t-test revealed that the differences among the area changes are not significant for the 95% confidence interval but significant for the 90% interval (p = 0.054). Hence, there is a tendency of difference between the two groups but it is statistically not significant. Apart from area changes, also glacier volume can change following an eruption. By combining the glacier outlines with elevation change data from Braun and others (Reference Braun2019), it was possible to estimate differences in elevation change between glaciers that experienced an eruption since 1985 and currently dormant volcanoes. The latter showed an average elevation change of −0.2 m between the year 2000 and 2012–15, whereas glaciers that experienced an eruption since 1985 were thinning by 0.9 m within the same time. Note that the exact year of the acquisition of the elevation change data for each volcano is not known. Furthermore, Braun and others (Reference Braun2019) used the Randolph Glacier Inventory (RGI) 6.0 as an outline base, which is not free of errors. For example, some debris-covered tongues are missing (like on Villarrica or Hudson Volcano) which lead to an underestimation of the elevation loss.
Whereas eruption frequency and VEI are easily quantifiable using the volcano database, non-eruptive features such as geothermal heat release are difficult to quantify and its contribution to glacier area reduction is difficult to estimate (Barr and others, Reference Barr, Lynch, Mullan, De Siena and Spagnolo2018). Several papers (Hamza and Muñoz, Reference Hamza and Muñoz1996; Davies, Reference Davies2013; Vieira and Hamza, Reference Vieira and Hamza2014) tried to quantify geothermal heat flux on a continental scale. Vieira and Hamza, Reference Vieira and Hamza2014 found high heat flux values along most of the American Cordillera (more than 300 GJ m2), whereas the rest of South America shows lower values (<200 GJ m2, except some heat pockets in, for example, the Parnaiba and Paraná basin). On a local scale, geothermal heat flux at volcanoes can be spatially (and partly also temporally) extremely heterogeneous. Fumaroles, hydrothermal activity, and dyke intrusions can be very confined, leading to a local influence on the ice (Huggel and others, Reference Huggel, Caplan-Auerbach, Waythomas and Wessels2007a).
To better compare glacier changes and volcanic activity, we apply a new volcanic activity index, which is a combination of the eruption frequency and the VEI of each eruption to quantify the activity of the volcano. Figure 10 reveals a slight increase in relative glacier area loss rate with increasing volcanic activity, but the correlation is very weak (r = −0.26). Tungurahua and Popocatépetl lost their entire glacier cover, as multiple eruptions prevented glaciers to recover. According to Delgado Granados and others (Reference Delgado Granados, Julio, Huggel, Ortega del Valle and Alatorre2007), Popocatépetl lost 40% of its glacier area between 1958 and 1996 (without eruptions) and 32% between 1996 and 2000 during the active period. Comparing the area change of glaciers in Ecuador and Colombia, volcanoes with eruptions had a faster loss rate (−1.53 ± 4.65% a−1) compared to dormant volcanoes (−1.27 ± 0.98% a−1). Also notable is the large spread of the change rate values on volcanoes with eruptions. This is largely influenced by the complete loss of Tungurahua glacier and the relatively low change rate on Cotopaxi (−0.70% a−1, Fig. 8b), despite having an eruption. Given this variability, it is difficult to determine what contributed most to the overall difference between glacier change rates on volcanoes with eruptions and without. To do so, every eruption needs to be analysed separately and in detail to understand the processes, which is beyond the scope of this study.
Glacier change rates against volcanic activity index (sum of VEI values since 1985). The black circle indicates the average of all glaciers on volcanoes without an eruption.

Climate data show that a precipitation reduction and a slight warming trend in the mid and upper troposphere (mostly in autumn) was observed in central and southern Chile over the last decades (Bown and Rivera, Reference Bown and Rivera2007; Falvey and Garreaud, Reference Falvey and Garreaud2009; Burger and others, Reference Burger, Brock and Montecinos2018). Volcanoes such as Villarrica (Fig. 9b) and partly also Llaima (at least the eastern slope) had relatively low change rates even though the volcanic activity was very high. This is likely because multiple eruptions have covered parts of the glacier with a thick layer of tephra and therefore considerably reduced surface melting (Brock and others, Reference Brock, Rivera, Casassa, Bown and Acuña2007; Delgado Granados and others, Reference Delgado Granados, Haeberli and Whiteman2015; Delgado and others, Reference Delgado, Pritchard, Ebmeier, González and Lara2017). Other glaciers in the region (e.g. Quetrupillán) seem to have suffered more from this precipitation deficit and warming trend than Villarrica and Llaima, despite the volcanic activity. If we compare all glacier-covered volcanoes along the Chilean/Argentinian border that experienced an eruption to dormant ones, area loss rates are −0.83 ± 1.0 and −0.81 ± 0.84% a−1, respectively, so almost identical. This means that volcanic eruptions can either preserve the glacier (e.g. Villarrica and Llaima) or be destructive (e.g. Copahue and Puyehue-Cordón Caulle), depending on the volcano.
6.3 Influence of glacier change on volcanic activity
Since glaciers are likely to continue to retreat in response to ongoing and projected future atmospheric warming (IPCC, 2014), it remains unclear how much the future melting influences the volcanic activity and the possibility of volcano-related hazards. In Iceland, unloading of ice related to current and future glacier shrinkage may lead to an increase in mantle melting and magma production, while stratovolcanoes in Latin America are also affected by crustal stress changes that lead to pressure changes in the magma chamber (Pagli and Sigmundsson, Reference Pagli and Sigmundsson2008; Sigmundsson and others, Reference Sigmundsson2010). Reinthaler (Reference Reinthaler2017) describes an increase of 600% of eruption frequency between glacier-covered and glacier-free volcanoes in Latin America. The difference increased from an average of 3.1 eruptions per decade per 100 volcanoes between 1500 and 1820, to 19 eruptions per decade per volcano after 1820. Nevertheless, this number has to be interpreted with care considering the uncertainties of the dataset and the different frequencies of each volcano.
Apart from the eruption frequency, ice unloading also affects the eruption style, possibly leading to more explosive eruptions under a thinning ice cover. If thinning continues, more volcanoes might shift from intrusive towards explosive eruptions (Tuffen, Reference Tuffen2010). This may occur for Sollipulli in southern Chile (Fig. 9a) which consists of a 4 km wide glacier-filled caldera and recent eruptions always took place at the rim of the caldera. The last known eruption took place in the year 1240, but once the ice load (~6 km3 in 1993) gets substantially reduced, eruptions at the caldera centre could occur again, leading to potential devastating hazards (Gilbert and others, Reference Gilbert1996).
Furthermore, due to the lack of mechanical support after the unloading of ice, hazards can range from rock avalanches to volcanic collapses (Huggel, Reference Huggel2009; Capra and others, Reference Capra, Bernal, Carrasco-Núñez and Roverato2013; McGuire, Reference McGuire, Huggel, Clarey, Clauge and Kääb2015). With ongoing climate change, some glaciers will disappear completely as already happened for Popocatépetl and Tungurahua. Hazards from lahars might be reduced due to the limited availability of water and ice even though new crater lakes might form (Huggel and others, Reference Huggel, Caplan-Auerbach, Waythomas and Wessels2007a). Although the eruptive style is governed mainly by the rheology of the magma and the content of volcanic gases in the magma (Dingwell, Reference Dingwell1996; Roberge and others, Reference Roberge, Delgado Granados and Wallace2009), eruption styles are likely to be less explosive if no ice or water is present with less phreatomagmatic activity (Tuffen, Reference Tuffen2010). It is likely that the activity will increase with ice unloading, but the response time and magnitude have large uncertainties and requires further research (Albino and others, Reference Albino, Pinel and Sigmundsson2010; Tuffen, Reference Tuffen2010). Notwithstanding, an important fact should be taken into account: unloading would not be a cause of the eruptive activity but the triggering mechanism. Volcanoes that are ready to erupt could start an eruption by the forcing of the unloading of glacier ice. With an extension of the study period to the Little Ice Age or further back in time, a stronger correlation between glacier change and volcanism might be seen. Measured geodetic mass-balance changes could feed into future load variation models (similar to Albino and others, Reference Albino, Pinel and Sigmundsson2010) to calculate the effect of glacier mass loss on volcanic activity and eruption likelihood.
7. CONCLUSION
As of 2015–2017, the 59 observed active volcanoes in Latin America still hold 1016.07 ± 34.16 km2 of glacier ice. In total, 27.4% of the glacier area was lost between about 1986 and 2015, highest values are found in Mexico (−71.3%) and between 35 and 38°S (−61.8%). Overall, area change rates have been very negative in the last three decades, even though a slight deceleration trend was detected after 1999/2000. An exception being glaciers of Colombia that showed an increasing shrinkage rate.
Eruptions on glacier-covered volcanoes can either insulate the glacier by covering it with tephra thicker than 2 cm or enhance the melt (e.g. enhanced geothermal heat, contact of volcanic edifices and ice). Differences between glacier-covered volcanoes that experienced an eruption during the study period and dormant volcanoes are minor and statistically not significant. The latter lost generally less area (−0.86% a−1) compared to volcanoes with eruptions (−1.03% a−1) but this could also result from a different size distribution. The impact of eruptions on the glacier varies, depending on the eruption magnitude, morphology of the volcano and the size of the glacier. In addition to area changes, thinning could have occurred. To quantify this, further analysis and the integration of elevation change data as provided for example by Braun and others (Reference Braun2019) are necessary. Furthermore, a comparison with non-volcanic glaciers would be useful and provide additional insights on the influence of the volcanic activity on the glacier.
With ongoing atmospheric warming, the glaciers on the volcanoes will likely continue to shrink and lose mass in the 21st century. This might have various effects on volcanism: Ice thinning will generally increase the explosivity of eruptions, can cause volcanic collapses and slope instabilities like rock and ice avalanches. For volcanoes with only small ice cover, which might be gone by the end of the 21st century, the hazards from lahars will be reduced, as water availability will be limited. Still uncertain is the volcanic response time and magnitude to load variations. The here generated multi-temporal glacier outlines along with elevation change data from other sources could possibly be used to drive load variation models (similar to Albino and others, Reference Albino, Pinel and Sigmundsson2010) and calculate the effect of glacier mass loss on volcanic activity and eruption likelihood over a longer time period.
SUPPLEMENTARY MATERIAL
The supplementary material for this article can be found at https://doi.org/10.1017/jog.2019.30. Shapefiles of glacier outlines used in this paper are available on request.
ACKNOWLEDGEMENTS
This research is partially funded by Fondecyt and CECs. CECs is a non-profit research institute funded by the Basal Finance program of CONICYT, among others. We also acknowledge funding from the ESA project Glaciers_cci (4000109873/14/I-NB). In addition, IAVCEI contributed with a grant for the formation of the GLOVOMODA database. We also want to thank the reviewers (M. Gudmundsson and one anonymous) as well as the chief editor H. Jiskoot for the useful and constructive comments to improve this paper.


 Open access
Target article
Area changes of glaciers on active volcanoes in Latin America between 1986 and 2015 observed from multi-temporal satellite imagery
Related commentaries (1)
Comments on ‘Area changes of glaciers on active volcanoes in Latin America’ by Reinthaler and others (2019)