


Introduction
The physical mechanisms governing the response of ice sheets to climate warming remain poorly understood, and ice-sheet models neglect many of these processes. Firstorder changes in surface mass balance can explain the large- scale behaviour of ice sheets over timescales of 104-105 years (e.g. Reference WeertmanWeertman, 1976; Reference GreveGreve, 1997); however, the details of deglaciation likely depend on other, more nonlinear, processes. For contemporary ice sheets, this lack of process understanding translates to significant uncertainty in future ice-sheet evolution and contribution to sea-level change (Reference LittleLittle and others, 2007; Reference Lowe and GregoryLowe and Gregory, 2010). A number of studies have implemented individual processes in flowline models (e.g. Reference Parizek and AlleyParizek and Alley, 2004; Reference Nick, Vieli, Howat and JoughinNick and others, 2009; Reference GladstoneGladstone and others, 2012); however, more process studies, especially using full, three-dimensional (3-D) ice-sheet models, are clearly needed.
The surface meltwater effect (SME) is the transfer of supraglacial meltwater to the ice/bed interface, which enhances basal sliding and thus the flux of ice toward the margin. This process was first documented by Zwally and others (2002) on the Greenland ice sheet (GrIS) and Bingham and others (2003) on a Canadian Arctic poly-thermal glacier; earlier work had pointed to the possibility of lubrication-induced speed-up on alpine glaciers (e.g. Reference Mair, Willis, Fischer, Hubbard and Nienow Pand HubbardMair and others, 2003). Of the modern ice sheets, the SME is likely more important on Greenland because Antarctic surface melt is limited outside the Antarctic Peninsula (Reference Torinesi, Fily and GenthonTorinesi and others, 2003; Reference MoteMote, 2007).
The present-day importance of surface melt-induced speed-up on Greenland is currently under debate (Joughin and others, 2008; Reference Van de WalVan de Wal and others, 2008; Reference BartholomewBartholomew and others, 2011, 2012; Reference Sundal, Shepherd, Nienow, Hanna, Palmer and HuybrechtsSundal and others, 2011). While short-term speed-ups have been recorded in response to increased surface melting (e.g. Reference Zwally, Abdalati, Herring, Larson, Saba and SteffenZwally and others, 2002; Reference Shepherd, Hubbard, Nienow, McMillan and JoughinShepherd and others, 2009; Reference BartholomewBartholomew and others, 2011) and supraglacial lake drainage (Reference DasDas and others, 2008; Reference DoyleDoyle and others, 2013), the overall importance of speed-up as a mechanism for mass loss is disputed (Van de Reference Van de WalWal and others, 2008). It has been argued that increased surface melt may lead to faster development of an efficient drainage system and thus a reduction in overall speed-up (Reference SoleSole and others, 2011; Reference Sundal, Shepherd, Nienow, Hanna, Palmer and HuybrechtsSundal and others, 2011). Other studies suggest that increased basal sliding and prolonged dynamic response can occur even after channels have been established, when meltwater flux exceeds the drainage system capacity (Reference Gulley, Grabiec, Martin, Jania, Catania and GlowackiGulley and others, 2012; Reference CowtonCowton and others, 2013). Furthermore, Bartholomew and others (2012) argue that the rate and duration of meltwater delivery to the bed is more important than its volume for controlling subglacial water pressure, thus questioning steady-state drainage theories and allowing for velocity response even after an efficient drainage system has been established.
It has been shown that sufficiently far inland of the margin the SME influences ice surface velocities on marineterminating glaciers in a similar manner to land-terminating glaciers (Reference SoleSole and others, 2011), albeit with only a small effect on annual motion. Currently, marine-driven glacier thinning and mass loss on Greenland dominates that from land-terminating glaciers (Reference Sole, Payne, Bamber and Nienow Pand KrabillSole and others, 2008); however, the relative importance of mass loss mechanisms may change as outlet glaciers retreat past their grounding lines. Moreover, future warming will lead to an expansion of ablation zone area (Reference Parizek and AlleyParizek and Alley, 2004; Reference NghiemNghiem and others, 2012), increasing the fraction of the ice sheet that is subject to the SME and, thus, likely to experience increased inland velocity response (Reference Bartholomew, Nienow, Sole, Mair, Cowton and KingBartholomew and others, 2012).
The possibility that the SME may exacerbate dynamic ice loss in Greenland under future warming also suggests that it played a part in mass loss from past ice sheets, particularly the Scandinavian ice sheet. The two ice sheets are geographically close to one another and have similar topographic and climatologic settings. Both ice sheets grew from a zone of mountainous topography along a coast that receives much precipitation (Reference Hebeler, Purves and JamiesonHebeler and others, 2008; Reference EttemaEttema and others, 2009), and both have, or had, a subglacial basin near their centres (e.g. Reference Bamber, Layberry and GogineniBamber and others, 2001; cf. the modern Baltic Sea). At its maximum extent, the Scandinavian ice sheet extended ~10° of latitude farther south than the modern GrIS, showing that surface meltwater must have been abundant at its margin during deglaciation. The close resemblance between the modern GrIS and the vanished Scandinavian ice sheet creates an opportunity to learn about the possible future importance of the surface meltwater effect on Greenland by studying its traces in the Scandinavian landscape. We have not observed the disintegration of an ice sheet directly, so ancient deglaciations provide an important source of information about what might happen in the future. Furthermore, evaluating the role of meltwater-enhanced basal sliding on deglaciation of the Eurasian ice sheets may provide us with a glimpse of the future of the GrIS.
Previous modelling studies
Early modelling of the Eurasian ice sheets began with Denton and Hughes (1981), whose seminal text provided a numerical method for reconstructing palaeo-ice sheets from flowband modelling. These ice-sheet reconstructions provided two contrasting maximum and minimum extent scenarios; however, the simplistic flowband approach could not represent ice flow variability in the reconstructed ice sheets. Holmlund and Fastook (1993) applied a finite- element map-plane model with improved spatial representation of variation in flow dynamics to simulate the Scandinavian ice sheet, with a particular focus on the Younger Dryas. This study made assumptions to allow for ice-sheet evolution matching Last Glacial Maximum (LGM) geological evidence, prescribing a frozen bed above 100 m elevation, basal sliding below 100 m, and enhanced basal sliding on a deformable bed below –100 m. Holmlund and Fastook (1993) found that simulation of a Baltic ice stream was necessary to allow sufficient ice flow through the Baltic basin to reproduce the LGM extent, with the inclusion of a frozen patch around Åland to dam flow and slow thinning during the pre-Younger Dryas deglaciation. Holmlund and Fastook (1993) further emphasized fast deglaciation succeeding ice-margin retreat past Åland, reactivating the Baltic ice stream and rapidly draining the ice-sheet interior, already diminished by drawdown before the Younger Dryas.
In an effort to model ice-stream locations on the Scandinavian ice sheet, Payne and Baldwin (1999) described the application of a 3-D thermomechanical model. This modelling study was based upon realistic topography and reproduced a maximum ice-sheet extent comparable to that suggested by geomorphic traces; however, it neglected basal sliding, with fast flow features forming without the need for basal sediment, topographic troughs, or meltwater transfer to the bed. The steady-state fast flow features generated by their model were thus used to argue that a thermomechanical mechanism, or localized creep instabilities, could explain ice-stream locations linked to fan-like assemblages of lineations across Scandinavia (Reference DongelmansDongelmans, 1995; Reference Kleman, Hattestrand, Borgstrom and StroevenKleman and others, 1997), often found on non-topographically constrained bedrock. This approach was quite different from that of Naslund and others (2003), where the calculated quantity 'basal sliding distance' was used as a way to study regional erosion rates. That study concluded that modelled ice flow directions could be useful in constraining existing geological information in a historical context, while basal sliding distance can give an insight into the erosional capacity of individual flow events, i.e. ice streaming.
Summarizing the numerical modelling studies of the QUEEN (Quaternary Environment of the Eurasian North) programme, Siegert and Dowdeswell (2004) described an inverse modelling approach to reconstructing the Late Weichselian Eurasian ice sheet. Climatic inputs were varied to yield a simulated ice-sheet growth that matched geological evidence of ice extent. In contrast to Payne and Baldwin (1999), these model runs incorporated water-saturated basal sediments as a further influence on ice velocity. The study found that at its maximum extent the ice sheet occupied the entire Barents Sea. Deglaciation in response to increased temperatures was most pronounced along the southern margin, leading to a rise in the equilibrium-line altitude (ELA) and consequent increased meltwater production.
Moving towards the approach of the present study, application of the SICOPOLIS (Simulation COde for POLy-thermal Ice Sheets) model to the Eurasian ice sheets has been previously conducted by Forsström and others (2003), followed by a further exploration of ice-sheet dynamics and freshwater fluxes by Forsström and Greve (2004). Both modelling studies were forced with UK Meteorological Office (UKMO) Paleoclimate Modelling Intercomparison Project (PMIP) data (Reference Hewitt and MitchellHewitt and Mitchell, 1997), scaling between present and LGM with a glacial index derived from the Greenland Ice Core Project (GRIP) record. Forsström and others (2003) reproduced an LGM extent matching reasonably with the QUEEN reconstructions for the western limit, excepting the British Isles which were not included in the model domain. In the east, however, the model extensively over-glaciated the Kara Sea area. Forsström and Greve (2004) addressed this issue by adapting their climatic forcing scheme to use LGM anomalies rather than absolute output to reduce systematic general circulation model (GCM) errors, and where modified precipitation and temperature data were tested to produce a best-fit ice-sheet extent. Forsström and others (2003) also described modelled areas of fast flow as they correspond to known ice-stream locations.
The influence of the SME on the development of the Eurasian ice sheets has previously been investigated in one- and two-dimensional models (Reference Arnold and SharpArnold and Sharp, 1992, 2002). Using a map-plane model, Arnold and Sharp (2002) applied a water-pressure-dependent sliding law to derive velocity changes on the Scandinavian ice sheet in response to subglacial configuration and varying sensitivity to supraglacial meltwater discharge. By introducing sensitivity to a critical discharge, in essence the amount of water which might be needed to drive a crevasse to the bed, the distribution of fast flow within the model was controlled by the distribution and timing of surface meltwater reaching the critical discharge. Fast flow occurred more frequently when the ice sheet was at its maximum extent and during deglaciation than during the period of growth, due to the warming climate and the consequent increase in meltwater availability. From modelling studies of meltwater-driven crevasse propagation (Reference Alley, Dupont, Parizek and AnandakrishnanAlley and others, 2005; Reference Van der VeenVan der Veen, 2007; Reference Clason, Mair, Burgess and NienowClason and others, 2012) the melt rate is shown to be the strongest control on the depth of crevasses, translating to the consequent dynamic response recorded in field observations (Reference Zwally, Abdalati, Herring, Larson, Saba and SteffenZwally and others, 2002; Reference Shepherd, Hubbard, Nienow, McMillan and JoughinShepherd and others, 2009; Reference BartholomewBartholomew and others, 2011) when melt is transferred through crevasses or moulins reaching the bed. The ice thickness must also be considered, however, when implementing the SME in ice-sheet modelling. There is thus decreased likelihood of full ice thickness crevasse propagation further inland from the margin where melt rates are lower, crevasses are fewer and the possibility for refreezing is greater.
In this paper, we apply a recently developed parameterization of the surface meltwater effect (R. Greve and S. Sugiyama, http://arxiv.org/abs/0905.2027) to the development of the Eurasian ice sheets over glacial-interglacial timescales, focusing especially on the last deglaciation. We reconstruct a plausible LGM extent, and investigate the influence of the parameterized SME on flow dynamics and ice retreat during deglaciation. While we conclude that the most appropriate value for the surface meltwater coefficient likely varies over the ice sheet's surface and over time, we demonstrate the sensitivity of ice-stream longevity and marginal retreat to the SME, particularly in the southwest sector of the Scandinavian ice sheet.
Modelling Approach
We simulate the growth and decay of the Eurasian ice sheet using the SICOPOLIS model (Reference GreveGreve, 1997). SICOPOLIS is a 3-D, shallow-ice approximation model that uses Glen's flow law to describe ice flow. The model includes thermodynamic coupling, as described by a rate factor dependent on the local temperature and water content of the ice (Reference Greve, Weis and HutterGreve and others, 1998). Isostatic adjustment is treated in the model using the elastic-lithosphere-relaxing-asthenosphere (ELRA) approach (Reference Greve and BlatterGreve and Blatter, 2009). Important inputs to the model include grids of modern precipitation and temperature, and curves of temperature as a function of time (see below). Model outputs include ice thickness, age, temperature, velocity and water content.
In this study, we aim to explore the ice-sheet-wide influence of the SME, and the extent to which it may have played a role in deglaciation. Because SICOPOLIS is a shallow-ice approximation model, it does not explicitly simulate ice streams (Reference Kirchner, Hutter, Jakobsson and GyllencreutzKirchner and others, 2011a). However, it can produce fast-flow features through sliding over a temperate base, as shown for the Scandinavian ice sheet by Forsström and others (2003). The use of a simplified ice flow treatment in SICOPOLIS presents an obvious limitation in modelling the precise locations of ice streams, as well as their width, which is limited by the 40 km model resolution. Given the objective of our study, however, producing broad fast-flow areas is sufficient for a first-order exploration of the mechanism. Furthermore, there is little to no understanding of whether melt-enhanced sliding is a control on the locations of the ice streams themselves, so it is reasonable to isolate the SME as a physical process.
The model domain extends from the British Isles in the west to the Taymyr peninsula (northern Siberia) in the east, thus including the reconstructed LGM extent of the combined Scandinavian, Barents-Kara and British-Irish ice sheets (Reference SvendsenSvendsen and others, 2004). The domain has a horizontal grid spacing of 40 km, resulting in grid dimensions of 151 gridcells in the x-direction and 71 gridcells in the y-direction. In the vertical there are 10 gridpoints within temperate ice and 80 within cold ice. For this study, we use a temporal resolution of 10 years for the computation of ice velocities and topography, as well as ice temperature, age and water content. The standard values of the physical parameters used in this study are defined in Table 1.
Standard physical parameters in SICOPOLIS
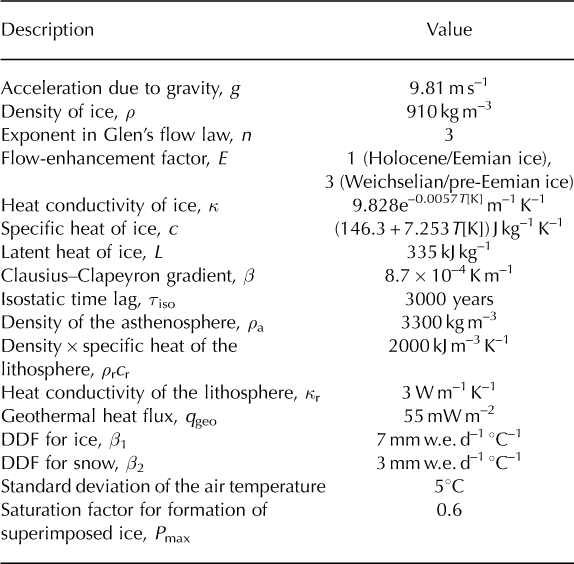
The model is run from an ice-free state at 250 ka BP until present, providing sufficient spin-up time prior to our period of interest, the Late Weichselian. Modelled ice-sheet extent and conditions at the LGM, ~20 ka BP, are the primary focus of this study. Eurasian ice-sheet extents for the Late Weichselian glacial maxima, as reconstructed by Svendsen and others (2004), provide a benchmark for our modelling experiments.
Basal sliding and the surface meltwater effect
To investigate the extent to which supraglacially originating meltwater may affect the evolution of the Eurasian ice sheets, particularly during deglaciation, we apply a parameterization of the SME developed by Greve and Sugiyama (http://arxiv.org/abs/0905.2027). This parameterization improves on an earlier study by Greve and Otsu (2007), in which the SME depended only on the local surface melt rate and thus did not account for the influence of ice thickness on meltwater transfer efficiency. In reality, the likelihood of crevasses or moulins reaching the bed decreases towards the ice-sheet interior, where ice thicknesses are greater and where less meltwater is available to drive crevasse penetration, with the possible exception of lake drainage events in years of increased melt production at high elevation (Reference Alley, Dupont, Parizek and AnandakrishnanAlley and others, 2005; Reference Van der VeenVan der Veen, 2007).
The basal sliding velocity, vb, is given by a Weertman- type sliding law, adjusted by an exponential factor to reflect sliding at sub-melt temperatures (Reference Hindmarsh and MeurHindmarsh and Le Meur, 2001; Reference GreveGreve, 2005):

where C b is the sliding coefficient, τ b is the basal shear traction in the bed plane, P b is the overburden pressure and eT’ b/γsms is a term representing exponentially decreasing submelt sliding where the sub-melt-sliding coefficient, γsms, is 1°C and T’ b is temperature relative to pressure melting.
Surface-meltwater enhanced basal sliding is parameterized within the sliding coefficient as

where  is 11.2 m a−1 Pa−1 (Reference Greve and OtsuGreve and Otsu, 2007), M is the surface melt rate, H is the ice thickness and γ is the surface meltwater coefficient. The exponents r and s control the extent to which ice thickness and runoff, respectively, influence surface meltwater-driven flow enhancement. SME-enhanced basal sliding is thus related to the local surface melt rate and can be dependent on the local ice thickness, accounting for the less efficient transfer of meltwater through ice of increasing thickness. The surface meltwater coefficient, γ, is estimated at 0.1 yearm−1 for r, s =0, 1, after Greve and Otsu (2007) who calculated this value based upon field data from Swiss Camp on the west central GrIS by Zwally and others (2002).
As discussed by Greve and Otsu (2007), this estimated value for γ is only accurate for one position at one time on the GrIS, so more appropriate values may be suitable across other areas of the ice sheet. For the Eurasian ice sheets we have no field data, and thus must rely on estimates regardless. For runs 3 and 4, we thus apply values of 0.2 ma−1 and 0.4ma−1 for γ, to illustrate the effect of doubling and quadrupling the surface meltwater coefficient across the ice sheet when enhanced basal sliding is related to local surface melt rate alone (r, s = 0,1). Run 5, an 'extreme' scenario, uses a surface meltwater coefficient ten times greater than the original Greenland-based estimate, at 1.0 m a−1. We then compare ice-sheet response when enhanced basal sliding is related to both surface melt rate and the additional control of ice thickness (r, s =1, 1). In these runs (6–9) the ability of meltwater to penetrate through the ice column is parameterized such that enhancement of basal sliding decreases with increasing ice thickness. Using the same input arguments based upon the data from Zwally and others (2002) and solving for 7 in Eqn (2), the surface meltwater coefficient is calculated as 122 years, 244 years, 488 years and 1220 years for runs 6, 7, 8 and 9 where (r, s =1, 1), for direct comparison with runs 2, 3, 4 and 5.
A sediment mask has been included for this study such that increases threefold to 33.6 m a−1 Pa−1 where the basal substrate is deemed to be deformable sediment, compared to 11.2 m a−1 Pa−1 over bedrock. The sediment mask is based upon the sediment thickness map of Laske and Masters (1997), a 1° x 1° global map compiled for both the continents and the oceans. Gregoire and others (2012) used this approach in modelling the post-LGM deglaciation of the Laurentide and Cordilleran ice sheets. We follow their approach by prescribing a value of 20 m for the minimum thickness necessary to designate the bed substrate as deformable sediment.
Climate forcing
Climatic conditions within the model are linked to a 250 ka ice-core δ18O record, based upon a merging of two data series. The NorthGRIP record (Reference Wolff, Chappellaz, Blunier, Rasmussen and SvenssonWolff and others, 2010) is used until 122.2 ka BP, extended past the 60 ka BP GICC05 counted age scale using the modelled ss09sea age scale, corrected for age offset (NorthGRIP members, 2004; Reference AndersenAndersen and others, 2006). The ice-core record is extended to 250 ka BP using a synthetic Greenland ice-core record (GLT_syn), based upon Antarctic ice-core data and the thermal bipolar seesaw model (Reference BarkerBarker and others, 2011). A glacial index approach is applied to scale temperature and precipitation distribution over time between present-day (g = 0) and LGM conditions (g = 1) (Eqn (3); Fig. 1). The index is modified from Greve (2005), scaling the δ18O record directly between present and LGM without the need to convert to corresponding air temperatures.
Glacial index scaling between present-day (0) and LGM (1) conditions.


To ensure proportionate scaling between present-day and LGM conditions for each of the merged δ18O data series, the LGM minimum was taken between 19 and 26.5 ka BP (Reference ClarkClark and others, 2009) for each series, with a minimum value of –42.31% at 23.7 ka BP for GLT_syn, and –44.51% at 25.5 ka BP for NorthGRIP. A δ18O value of-35.16%, taken at 20 BP on the NorthGRIP record, is used for both present- day values, as the synthetic record starts at 5 ka BP.
In choosing appropriate inputs for present-day and LGM air temperature and precipitation, a total of nine climate data combinations were compared from three present-day and three LGM climate datasets, using an approach previously applied by, for example, Kirchner and others (2011b) and Pollard and others (2000). The reanalysis products, ERA-40, ERA-Interim and CFSR (Climate Forecast System Reanalysis) (Reference UppalaUppala and others, 2005; Reference SahaSaha and others, 2010; Reference DeeDee and others, 2011) were compared to constrain present-day conditions, while the IPSL-CM5A-LR, CCSM4 and MPI-ESM-P model experiments (Reference GentGent and others, 2011; Reference KageyamaKageyama and others, 2013; Reference StevensStevens and others, 2013), all of which are part of the CMIP5 Project (Reference Taylor, Stouffer and MeehlTaylor and others, 2012), were compared for the LGM.
Of the resulting ice-sheet configurations from the nine climatic forcing runs, the combination of CFSR present-day and IPSL (Institut Pierre Simon Laplace) CM5A-LR LGM data produced the most realistic ice-sheet extent when compared with the Svendsen and others (2004) ice limit reconstruction for the LGM. The results described in this paper are thus based upon this climate-forcing combination, with a detailed comparison of climate models, particularly for the LGM, to be considered in future work. The CFSR is a highresolution reanalysis product with global coverage at 0.5° × 0.5° spatial resolution (Reference SahaSaha and others, 2010). Temperature and precipitation have been calculated as long-term averages for each month over a 32 year period from 1979 onwards. The climatic outputs of the IPSL-CM5A- LR LGM model experiment (Reference KageyamaKageyama and others, 2013) are from a full Earth system model, for which the atmospheric model has a spatial resolution of 1.875° × 3.75°. Temperature and precipitation were averaged for each month over the final 50 years of the 200year LGM simulation, clearing any initial spin-up. The resulting climate data were interpolated onto the ice-sheet model grid.
For the purposes of this study, the palaeoclimatic forcing was altered to produce an ice-sheet extent comparable to that illustrated by Svendsen and others (2004). We superimposed a linear temperature gradient on the IPSL-CM5A-LR LGM temperature data, with a reduction of 7.5°C in the west of the domain to an increase of 2.5°C in the east. While this approach is physically unrealistic, the main focus of this study was not to reproduce the ice-sheet extent, but rather to evaluate the effect of a physical process, in this case the SME, on ice-sheet evolution. We thus create a climate that can produce an ice sheet within the bounds of the Svendsen and others (2004) reconstructed ice-sheet extent.
The LGM temperature and precipitation data are represented as anomalies of the present-day climate data following a method adapted from Forsström and Greve (2004). The monthly precipitation (P) anomaly factor is thus calculated as

and the monthly air temperature (T) anomaly as

The temperature at any given time, t, is then given by

plus any difference in temperature due to changes in elevation. For precipitation over time, the precipitation anomaly is first interpolated, in this case linearly, such that

allowing precipitation at any given time to be calculated as

Precipitation falling as snowfall is defined following the empirical relation of Marsiat (1994), with rainfall assumed to contribute to superimposed ice. For the degree-day melt modelling approach employed in this study, standard values of 8 and 3 mm w.e. d−1 °C−1 for the degree-day factors (DDFs) for ice and snow respectively were chosen, following testing of a range of DDFs.
Marine limit treatment
To allow for marine-based glaciation, the modelled ice sheet is permitted to glaciate the sea floor, bounded by a threshold bedrock depth of 1000 m below sea level. This cut-off differs from the limit of 500 m below sea level applied by Forsström and others (2003) since using this limit results in a small area within the ice sheet, south of Norway at approximately 58° N, 10° E, where the bathymetry is deeper than –500 m, so no ice can form. Through model experiments we thus concluded that –1000 m was the optimum value for this parameter, although comparison of modelled ice-sheet extent within this study using both the –500 m and –1000 m limits shows very little difference in areal coverage or in volume.
Modelled Ice-Sheet Reconstructions
Ice-sheet simulation using standard parameters
Running the model as described above and without modifying the sliding coefficient, Cb, to include the SME (run 1), results in a double-peaked LGM and a Eurasian ice sheet with two ice domes centred over Fennoscandia and the Barents-Kara Sea (Fig. 2). Ice-sheet volume peaks at 25 ka BP, and it is at this first LGM peak that the Scandinavian ice sheet and the British ice sheet are connected across the North Sea. By 20 ka BP, the British and Scandinavian ice sheets have separated, and the depression between the Fennoscandian and Barents-Kara domes has largely been filled.
LGM maxima at 25 ka BP (a) and 20 ka BP (b) for model run 1. Blue shading represents ice surface topography, and green shading represents land surface elevation. Land surface elevation is represented by the same shading in all subsequent plan-view figures. LGM extent from Svendsen and others (2004) is depicted in orange for comparison.

The extents for the double-peaked LGM produced using this model match well with the asynchronous Svendsen and others (2004) LGM extent. Although ice thickness in the Barents-Kara Sea area of the model domain is likely too large, the areal extent is an improvement on the ice-sheet extents produced by Forsström and Greve (2004) from another SICOPOLIS model experiment. Reproducing a dry, cold (or polar-continental) climate in the eastern half of the model domain, however, remains a constraint on simulating ice-sheet extent in this area, even with a new generation of LGM GCMs available as input.
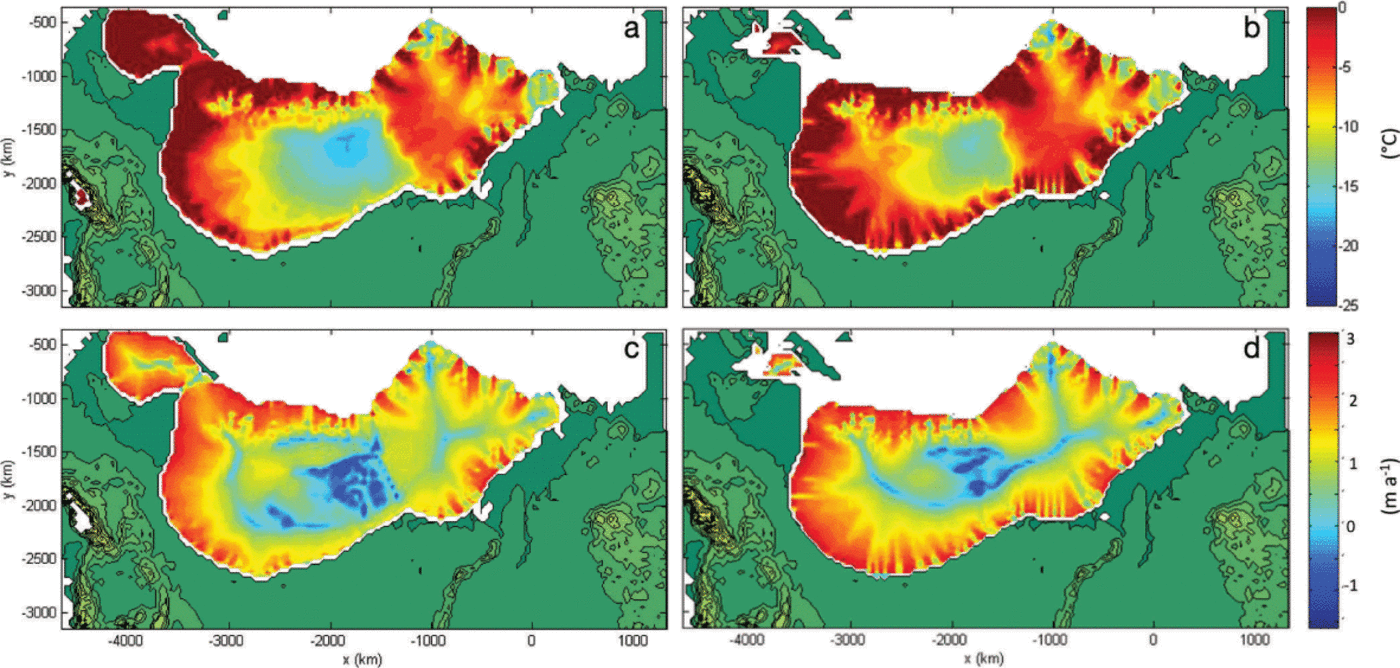
The shallow-ice approximation approach can provide only a crude representation of ice-stream activity due to limitations of the model physics; however, ice surface velocities and basal temperature conditions relative to pressure-melting point replicate the locations of major known ice streams, documented from flow-parallel features (e.g. Reference Punkari and AberPunkari, 1993, 1997; Fig. 3). This fast flow is attributed to sliding over a temperate base, and provides only a broad estimation of ice-stream locations at the coarse 40 km resolution. Activity in the regions of the Norwegian Channel, Baltic and Bjørnøyrenna (Bear Island Trough) ice streams is particularly notable in our simulations. Fast flow in the southwest of the ice sheet, the area of the Baltic ice stream, switches on later into the LGM period, with inland expansion of higher basal temperatures and high ice velocities at 20 ka BP in the Gulf of Bothnia region, extending into post-LGM deglaciation. The Norwegian Channel ice stream area is characterized by fast flow over a temperate bed from the first LGM peak at 25 ka BP, remaining active with increasingly high flow velocities at 20 ka BP. At the LGM the Bjørnøyrenna ice stream was the dominant ice stream draining the Barents-Kara ice sheet (Reference Winsborrow, Andreassen, Corner and LabergWinsborrow and others, 2010). This feature is reflected in the model output by a temperate base and widespread high surface velocities extending far inland of the margin by 20 ka BP.
Basal temperatures relative to pressure-melting point (a, b) and ice surface velocities (c, d) at 25 ka BP (a, c) and 20 ka BP (b, d) for model run 1.
Ice-sheet simulations inclusive of the surface meltwater effect
To investigate model sensitivity to inclusion of the parameterized SME, a further eight model runs were conducted. The set-up of SME runs 2–9 is listed in Table 2.
Set-up of model runs inclusive of the SME
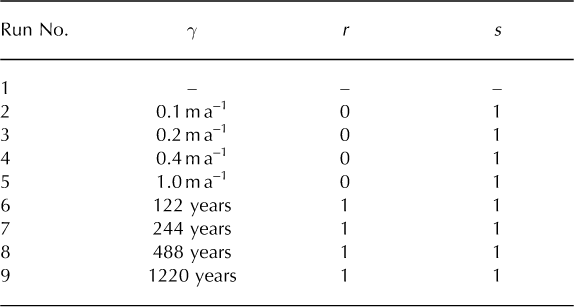
Figure 4 illustrates the effect of increasing the value of j (runs 2–5) on total ice volume over time. The consequent decrease in ice volume is particularly notable during stages of deglaciation, for example at 17 ka BP, where the percentage reduction in volume between runs 1 and 2 and runs 1 and 5 is 6.6% and 18.7% respectively. Glacial maxima during the Late Weichselian (approximately 25 and 20 ka BP) and particularly the Middle Weichselian (~60 ka BP) are also dampened, albeit to a much lesser extent, by the inclusion of the SME. At 20 ka BP the percentage reduction in ice volume is 0.9% between runs 1 and 2, and 1.3% between runs 1 and 5, while at 60 ka BP it is 1.7% between runs 1 and 2, and 4.5% between runs 1 and 5. Correspondingly, maximum surface velocities increase drastically with inclusion of the SME, reaching well over 10 km a−1 in runs 4 and 5, where γ is four and ten times above the Greve and Otsu (2007) estimate respectively. The peaks in velocity maxima are largest at the beginnings of deglacial periods, notably following the LGM corresponding to Meltwater Pulse 1A, such that large melt-induced speed-up events trigger faster subsequent deglaciation than for run 1. This meltwater peak corresponds to a post-LGM sea-level rise contribution of ~10m (cf. Reference Jones and KeigwinJones and Keigwin, 1988, who suggested 15 m).
Total ice volume (a), maximum Ice surface velocity (b) and freshwater production (c) over time for runs 1–5.

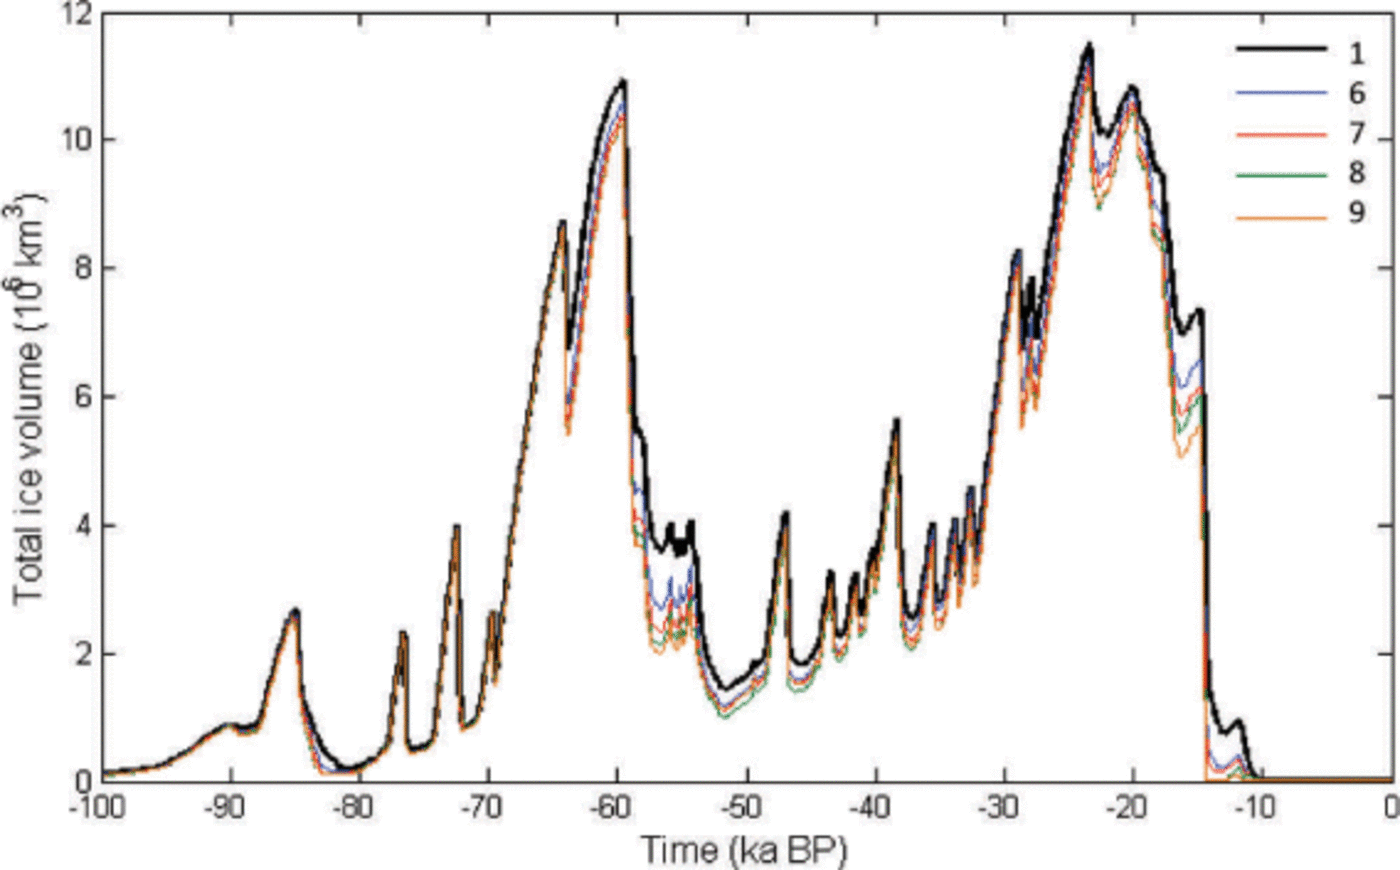
Runs 6–9 are set up as for 2–5 but include a further dependency on ice thickness. The parameter γ was originally estimated for ice thicknesses of 1220m (Reference Greve and OtsuGreve and Otsu, 2007); SME-enhanced basal sliding decreases with increasing ice thickness and increases with decreasing ice thickness, relative to this baseline. In these latter runs, glacial maxima peaks are noticeably reduced in comparison to the earlier runs (Fig. 5), particularly for the Middle Weichselian maximum, where the percentage reduction in ice volume is 3.4% between runs 1 and 6, and 6.2% between runs 1 and 9. Glacial minima are also further deepened, resulting in a post-LGM deglaciation with a reduction in volume of 11.9% between runs 1 and 6 and 24.5% between runs 1 and 9 at 17 ka BP, coming close to complete early glacial termination by ~15 ka BP. Indeed run 9, which has a surface meltwater coefficient ten times above the initial estimate, results in complete deglaciation far in advance of the Younger Dryas, and thus is a clear minimum bound on SME values when they are static in space and time. In addition, in allowing for increased enhancement of basal sliding at ice thickness under 1220 m, the temporal occurrence of maximum ice velocities of 1000 m a−1 and higher is greatly increased.
Total ice volume over time for runs 1, 6, 7, 8 and 9.
Spatially, the effect of including the SME is most pronounced for the Late Weichselian during post-LGM deglaciation. Figure 6 shows the ice-sheet limits at 15 ka BP, where it is apparent that the southwest sector of the Scandinavian ice sheet is influenced most by the SME, in comparison to the British ice sheet and the colder eastern limits of the Barents-Kara ice sheet.
Ice-sheet extent at 15 ka BP for runs 1, 2 and 6. Shading represents ice surface topography from run 1.

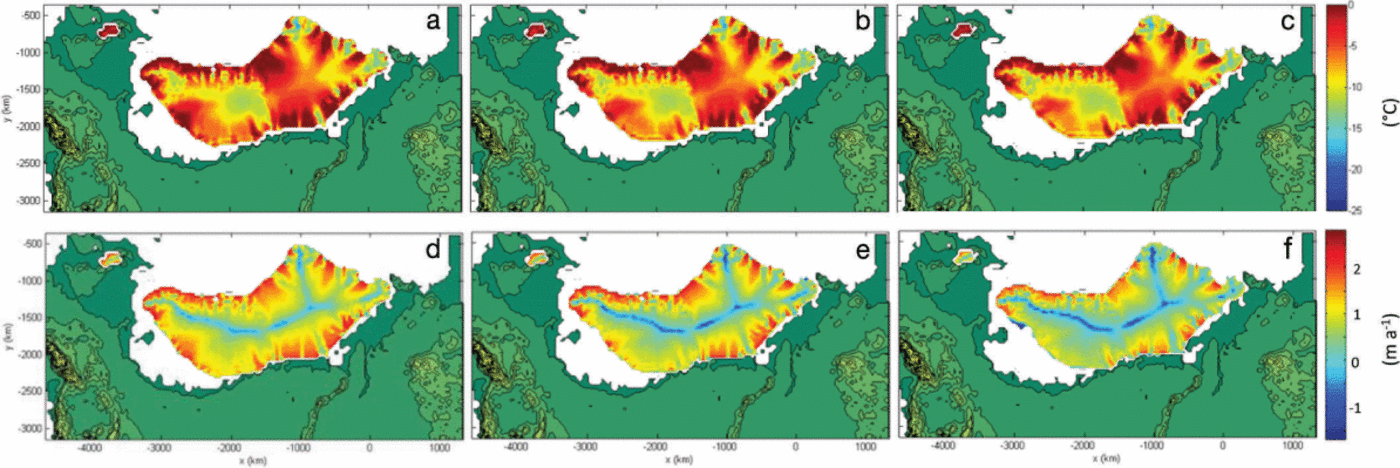
Comparing basal temperatures relative to the pressure-melting point and ice surface velocities at 15 ka BP for runs 1, 2 and 6, the effect of the SME is such that fast flow or 'ice streaming' activity in the southeast sector ceases more quickly with inclusion of the SME, especially in run 6 for which basal sliding is increased under the thinner marginal ice (Fig. 7). In run 1 the ice surface velocities in the Baltic ice stream region are significantly less than at 20 ka BP, however; ice velocities in this sector still approach 500 m a−1. This area is also characterized by pronounced temperate basal conditions. In runs 2 and 6, the basal temperatures are decreased, and in run 6 there is no fast flow in the Baltic area, where instead the ice has retreated into the Gulf of Bothnia.
Basal temperatures relative to pressure melting (a-c) and ice surface velocities (m a−1) (d-f) at 15 ka BP for runs 1 (a, d), 2 (b, e) and 6 (c, f).
These results suggest that application of a surface meltwater coefficient of 0.1 ma−1 for r, s = 0,1 is not appropriate for the whole ice sheet and that spatial variations must be considered in the future, as deglaciation becomes too rapid when values greater than 0.1 ma−1 are applied. Furthermore, the application of γ = 1 year for r, s = 1,1 suggests that the SME becomes too pronounced at ice thicknesses below 1220 m, resulting in fast ice drawdown and mass loss in areas characterized by fast flow, such as the Baltic ice stream. This result warrants further investigation into the prescription of suitable γ values for different elevation bands and latitude, based upon a broader range of field data. Furthermore, this parameterization does not account for the spatial variability in delivery of meltwater to the bed, storage of meltwater at the surface, or the mechanism of delivery, i.e. moulins or lake drainages.
Discussion
Modelled LGM reconstruction
Through application of new climate data inputs (Reference SahaSaha and others, 2010; Reference KageyamaKageyama and others, 2013), chosen following a series of tests with available datasets, the LGM spatial extent of the Eurasian ice sheets has been reproduced within the bounds set by the Svendsen and others (2004) QUEEN reconstruction. It must be reiterated that this extent could only be reproduced by applying a temperature gradient across the domain. The thickness of ice over the Barents Sea is likely too great, in response to an overestimation of accumulation over the Barents-Kara ice sheet resulting from the climate data. The model does, however, reproduce the southeastern LGM margin of the Barents-Kara ice sheet (Reference SvendsenSvendsen and others, 2004; Fig. 2), improving on extent in the Kara Sea produced by modelling in Svendsen and others (2004). The modelled ice-sheet extent does not reach the north Taymyr ice-marginal zone, marked with a question mark in Figure 2, with the maximum eastern extent instead reaching the southern shores of Severnaya Zemlya. Further tests were conducted with manipulated precipitation, but could not resolve an LGM marginal extent better than the results illustrated here. Svendsen and others (2004) applied an inverse modelling approach to ice-sheet reconstruction, such that in one model scenario accumulation was curtailed over the Kara Sea sector to reduce over-glaciation in the east. Our findings support this approach and that of Siegert and Dowdeswell (2004), confirming that climate models, at least those tested in this study, do not adequately simulate the cold, dry climate that is necessary to abate accumulation and confine eastern glaciation.
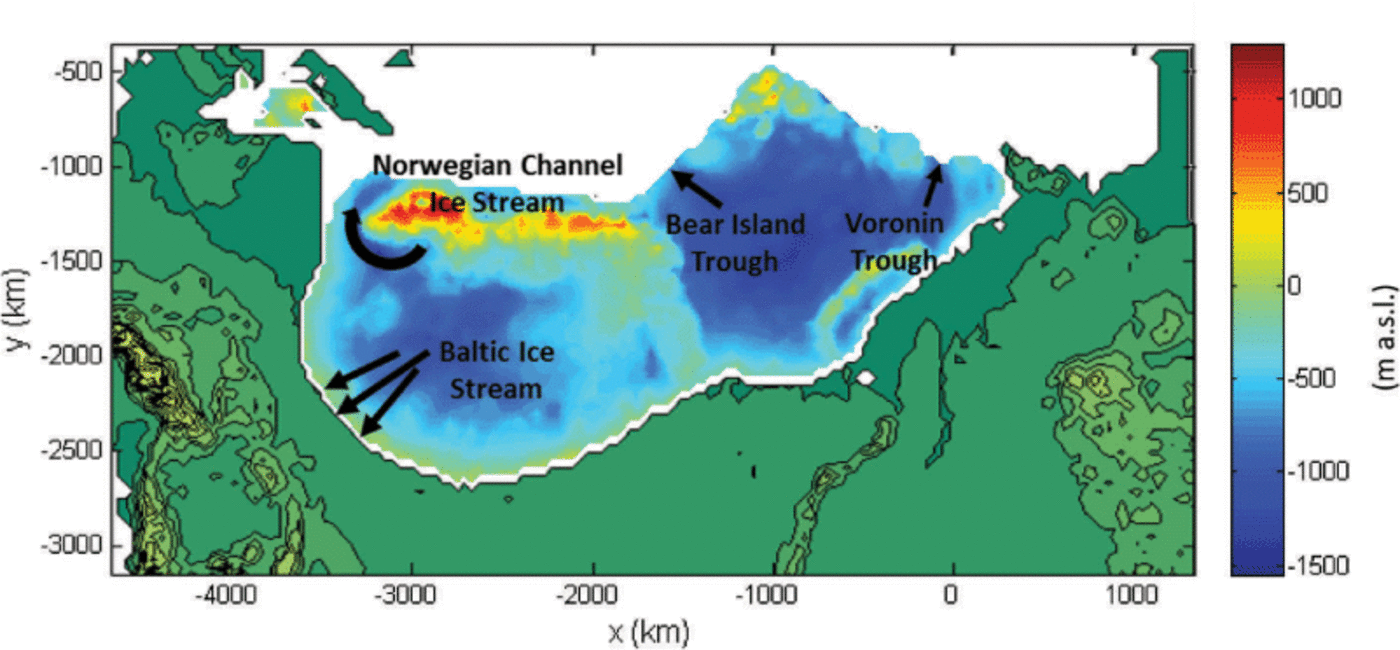
The Barents-Kara and Scandinavian ice sheets join in their southern margin at the north of the Kanin peninsula, with the modelled Barents-Kara ice sheet peaking in the centre of the Barents Sea (Fig. 2). The ice divide of the Scandinavian ice sheet, although centred over the Gulf of Bothnia at 20 ka Bp, lies further south than has been inferred from previous modelling studies (i.e. Reference Siegert and DowdeswellSiegert and Dowdes-well, 2004). Patterns of basal temperature below pressure-melting point at 20 ka BP (Fig. 3) across the Scandinavian ice sheet match well with frozen bed conditions inferred from ribbed moraines (Reference Kleman and HattestrandHattestrand and Kleman, 1999; Reference Kleman and HattestrandKleman and Hattestrand, 1999). LGM northwest-sector ice streams inferred by Kleman and Glasser (2007) are picked up by the model both in the basal temperatures and surface flow velocities (Fig. 3), with fast-flow features constrained in their width and controlled by steeper basal and ice surface topography to the north and west, particularly in the Norwegian Channel ice stream area (Fig. 8). These topographically controlled fast-flow features are also seen in the northern Barents-Kara ice sheet, particular in the Bear Island and Voronin troughs. The lower-gradient southern margin of the Scandinavian ice sheet gives rise to modelled fast-flow features on low-relief terrain which are not controlled as strongly by topography, excepting the broad Baltic ice stream area which occupied the area of the present-day Gulf of Bothnia.
Topography of the lithosphere beneath the 20 ka BP ice-sheet extent for run 1, with topographic troughs and locations of ice streams derived from geomorphic data.
Towards a better representation of the surface meltwater effect in ice-sheet models
The application of a single, spatially and temporally constant value for the surface meltwater coefficient in the SME parameterization produces an unrealistic response to increased melting when considering the response of the ice sheet as a whole. Further quantification of the proportion of basal sliding that can be attributed to the SME should be considered in the future, perhaps making use of the wealth of velocity, melt rate and ice thickness data that has been gathered for the GrIS. A parameterization for the spatial density of surface-to-bed meltwater pathways (crevasses, moulins and supraglacial lake drainages) could also be developed to better quantify meltwater transfer in future modelling studies. A statistical approach may then be one way to parameterize discrete surface-to-bed meltwater transfer events that cannot be resolved individually at the ice-sheet model scale.
Perhaps the most challenging to parameterize is that of release of stored water in supraglacial lakes which can penetrate through especially thick ice (Reference DasDas and others, 2008), inducing local speed-up. Stromberg (2010) described the occurrence of multiple localized sites of meltwater flutes in the Stockholm archipelago and on Åland. These polished flutes, set within a landscape of polished bedrock, were younger, deeper and aligned in directions varying from neighbouring glacial striations. Given the analogue between present-day Greenland and the Scandinavian ice sheet, these geomorphological features provide a qualitative basis from which to infer the past occurrence of meltwater transfer from the surface to the bed of the Scandinavian ice sheet during periods of melting, and further justify the inclusion of meltwater-enhanced basal sliding within ice-sheet modelling.
Regardless of the inapplicability of a single surface meltwater coefficient value across the whole ice sheet, the response of individual fast-flow areas to inclusion of the SME poses an important consideration in examining the longevity of these ice-stream or major outlet glacier features. Under deglacial conditions where melting is higher, the flux of ice, and consequent marginal retreat, through SME-enhanced fast flow is large enough to prompt earlier cessation of ice- stream activity than was modelled in the standard run in the Baltic ice stream area. Our results are also in agreement with Arnold and Sharp (2002) who found that fast flow was highest when the ice sheet was at its maximum extent and during deglaciation, due to increased meltwater availability.
The extent to which the SME may have a role in enhanced sliding speeds and mass loss of the GrIS may currently remain disputed, but future increased meltwater production at higher elevation (Reference Parizek and AlleyParizek and Alley, 2004) may expose a larger area of the ice sheet to enhanced sliding. Furthermore, velocity responses to meltwater inputs may be possible even after the establishment of efficient drainage systems (Reference Gulley, Grabiec, Martin, Jania, Catania and GlowackiGulley and others, 2012; Reference CowtonCowton and others, 2013), and there is little contemporary evidence for efficient reorganization of the subglacial drainage system under thick ice away from the margin. Meltwater-enhanced sliding should thus not be discounted as a mechanism for rapid ice-sheet drawdown in areas experiencing high melt rates over large areas. This process may thus have important consequences both for the future response of the GrIS with retreat of the ELA and ice- sheet-wide melt events (Reference NghiemNghiem and others, 2012) and for interpretation of geomorphological traces in reconstructing palaeo-ice-sheet dynamics and collapse.
Conclusion
This modelling exercise has reproduced a plausible LGM extent for the Eurasian ice sheet and investigated modelled ice-sheet sensitivity to the introduction of a simple parameterization of the surface meltwater effect. The modelled influence of the SME on the longevity of fast-flow features and associated marginal retreat in areas experiencing high melt rates poses an important consideration for ice-sheet response to a warming climate. The true extent to which the SME influences ice sheet as a mechanism for mass loss cannot, however, be examined with confidence while physically based coupling of ice-sheet dynamics and subglacial hydrology in ice-sheet models remains unimplemented.
Acknowledgements
We thank Clas Hattestrand and Johan Kleman for helpful suggestions during the modelling process, and comments on the manuscript. We also thank Jim Fastook, an anonymous reviewer and the Scientific Editor Ralf Greve for constructive feedback which helped to improve the manuscript. This research was supported financially by Strålsäkerhetsmyndigheten, the Swedish Radiation Safety Authority.



