

1. TORP Working Party Sessional Paper Synopsis
1.1. Introduction
1.1.1 This paper is a key read for those who work in reserving and who work around reserving teams. It outlines frameworks to use for reserving validation and gives the reader an overview of current techniques being employed. In the experience of the authors, many companies lack an embedded reserve validation framework and reserve validation can appear piecemeal and unstructured.
1.1.2 Although the paper is aimed at practitioners in the field of general insurance, the validation approaches outlined in section 3 may well be relevant to actuaries working in other fields and in particular those working in health insurance who may well apply general insurance reserving techniques as part of their work. Moreover, the application of machine learning fitting techniques such as those described in section 6 of this paper may well aid validation in other areas where sufficient data are available, such as to the fitting of mortality curves to crude mortality data or the extrapolation of past mortality improvements for modelling future improvements.
1.1.3 The paper then outlines a case study demonstrating how successful machine learning techniques will become and then goes on to discuss the implications of machine learning to the future of reserving departments, processes, data and validation techniques.
What Will You Get from this Paper?
1.1.4 Reserving validation can take many diverse forms, from simple checks to full independent reviews; if done well, it adds value to the reserving process, enhances governance and increases confidence and reliability in results.
1.1.5 This paper discusses:
-
The significance and importance of reserving validation
-
Common weaknesses and their solutions
-
Suggestions of a framework in which to apply validation tools
-
Current developing techniques used in reserve validation
-
Specific and unique impacts of the COVID-19 pandemic on reserving validation
What Does the Future Hold for the Reserving Actuary?
1.1.6 Reserving is entering a new era as machine learning techniques take hold. No doubt this will include a trial-and-error phase during which much dialogue will occur regarding failing and succeeding projects. The result may well be improvements in predictive capabilities the likes of which we have not seen in decades. To add to this, these methods will produce these predictive capabilities in much faster timeframes than a human could achieve leading to much needed automation of parts of the process.
1.1.7 The final section of the paper is focused on a case study on machine learning together with discussion of the implications of this technology for reserving departments, processes and validation techniques, we also discuss data implications for these processes.
Why is Validation Important?
1.1.8 Setting correct reserves is critical to insurance businesses. The results of the reserve review form a key component of the management and statutory accounts. They form the starting point for capital calculations and a crucial feedback loop into the pricing and planning process. It is critically important that management and non-executive directors have confidence in the judgements and processes underpinning the reserve booking decision and reserving actuaries need to ensure that this confidence is not misplaced. The topic of reserve risk was also highlighted in the November 2020 Dear CRO letterFootnote 1 from the PRA which itself followed a Dear CEO letterFootnote 2 and Dear Chief Actuary letterFootnote 3 on the same theme a year earlier. Clearly the area of reserve risk and hence validation within the process is of great importance to both regulators and to Boards – a focus which has been increased by the COVID-19 pandemic and consequent recession.
2. Why is Reserving Validation Important?
2.1. Reserving Validation
2.1.1 In the case of reserving validation, we are interested in ensuring the results from the reserving analyses are reasonable and appropriate. Given that perfect accuracy in the estimation of reserves is an impossible target, reserving validation looks to ensure reserves are unbiased and not inaccurate and that there is a thorough understanding of what the estimates represent and the uncertainty around these.
2.1.2 Certain validation techniques can also be used to highlight when reserves are becoming invalid in an automatic way to focus the Actuary’s attention in the relevant areas. It can take many forms, from simple checks to full independent reviews. Done well it adds value to the reserving process, enhances governance and increases confidence in the results.
2.1.3 This paper discusses the importance of reserving validation, common weaknesses in the current process and how to overcome them. We also suggest a framework in which to apply validation tools. Subsequent sections of this paper set out the current techniques used in reserving validation and the developing techniques that could be used by the reserving actuary of the future to embed validation techniques in the reserving process.
2.2. The Importance of Reserving Validation
2.2.1 Setting adequate reserves is critical to the continued solvency of insurance companies. Previous studies have shown that inadequate reserves are among the primary causes for insurer insolvency.
2.2.2 The results of reserve reviews are used extensively throughout insurance companies. They form a key component of the management and statutory accounts, the starting point for capital calculations and a crucial feedback loop in portfolio management, pricing and planning processes.
2.2.3 A robust reserving validation process can help ensure stable and unbiased reserves are set and that key stakeholders have a clear understanding of any point estimates (e.g. best estimate) as well as the key risks and uncertainties in the figures presented. It can provide the tools and information upon which to challenge and can ultimately help the board make informed decisions about the results presented and the level of reserves to hold.
2.2.4 Key areas that validation can assist with are:
-
a. During the reserve review:
-
Identifying assumptions at an early stage that are no longer valid.
-
Detecting emerging trends and risks that may need to be allowed for.
-
Identifying the most material assumptions and the sensitivity of those assumptions.
-
Selection of best-fit models.
-
Highlighting areas of concern requiring additional attention.
-
Providing an overview of areas of uncertainty in the review.
-
-
b. When signing off reserves:
-
Enabling users to challenge more effectively.
-
Identifying the key assumptions that impact the overall results.
-
Demonstrating that key assumptions have been challenged and plausible alternatives considered.
-
Giving clarity around point estimates and uncertainty.
-
Providing evidence of good governance and appropriate challenge.
-
-
c. Out of cycle
-
Providing ongoing monitoring of experience to ensure assumptions remain appropriate.
-
Providing evidence to respond to regulatory queries (e.g. Dear Chief Actuary/CRO/CEO letters).
-
Supporting/feeding into other processes.
-
Providing meaningful comparisons to market.
-
Policing of new “black box methods”.
-
2.3. How Validation Can Help Reserving Actuaries Overcome Current Challenges
2.3.1 This section sets out the key challenges that current reserving processes face and how a strong validation framework can help address them.
Increased Time-Pressure to Deliver Results
2.3.2 Reserving processes across the market are facing pressure to move more quickly from the cut-off date for data to delivering results. This means actuaries can be faced with difficult decisions as to where to prioritise their time. There can be a trade-off between performing a broad review of all reserving classes and methods, against the need to perform a deep dive in key problem areas. It is also desirable to spend time on forward-looking proactive analyses to pre-empt potential future issues.
2.3.3 Reserving validation can help in two ways:
-
1. First, it can help the actuarial team determine how to prioritise their resource by helping identify problem classes and those where the previous review’s assumptions still stand. Time spent testing and then setting appropriate diagnostics and triggers can be outside of peak-review time, making the overall process more efficient.
-
2. A similar diagnostic suite can allow a small risk team or 2nd line of defence to monitor the activity of a larger actuarial function effectively. Where previously 2nd line reviews might follow a significant deterioration, a strong reserving validation framework can allow a risk team to engage pro-actively with the actuarial function.
Perceptions of Stakeholders
2.3.4 Stakeholders, such as Finance Directors and Non-Executive Directors, may have perceptions about the reserving process which influence how they view the results of a review. A common stereotype is the assumption that actuaries include an inbuilt margin or element of caution into reserves, perhaps because giving good news is easier than bad.
2.3.5 Sometimes management concerns in this field are justified, but they can also arise when they are not justified. For example, a class that sees improvements 9 out of 10 years in succession might be prudently reserved, but equally the distribution of losses may be skewed (the mean being far above the median).
2.3.6 It is essential that stakeholders have a clear understanding of the reserves, as well as the main risks and uncertainties within them.
2.3.7 A strong reserving validation framework will help detect trends in the reserving strength, pre-empt challenge from stakeholders and to provide clarity as to where pre-conceptions are valid or not.
Increased Regulatory Scrutiny
2.3.8 There has been increased focus on general insurance companies over recent years as demonstrated by the PRA’s Dear Chief Actuary, Dear CEO (both Nov 2019) and Dear CRO (Nov 2020) letters.
2.3.9 Dear Chief Actuary letter (November 2019): Covered a variety of reserving issues including possible biases in reserve assessment (upside is allowed for but downside risks less so). Concerns over weakening of case reserving across several classes, for example,Medical Malpractice and US General Liability. The PRA also raised concerns that there was inadequate allowance for claims inflation and concern that information provided to Boards may not be understood due lack of transparency.
2.3.10 Dear CEO letter (November 2019): Concern that Boards and management are not receiving sufficient data or information to fully understand key uncertainties to facilitate challenge of the reserving assumptions before sign-off. The letter also highlighted that some actuarial functions remained undeveloped and so reserving, pricing and claims departments were not always consistent in setting of assumptions and that detection of trends are also slower. There was also a general concern that underwriting remediation was being allowed for prematurely in the reserving process even if there was a lack of evidence to suggest the re-underwriting was having a positive impact. General concern that poor infrastructure and data systems meant that firms are also unable to identify trends or react to emerging risks in a timely manner.
2.3.11 Dear CRO letter (November 2020): Although targeted at risk functions, reserving processes continued to be flagged as a key concern in the paper. In particular indications of possible weakening of case reserve estimates and biases in reserve estimates (concerns that worsening claims experience is not being incorporated to setting of reserves). The PRA set out expectations for risk functions to provide evidence of how they challenge the reserving processes and results, and how the risk function is helping to ensure that stakeholders such as the Board understands the uncertainty in the reserves before being signed off.
2.3.12 Regulators expect companies to consider their reserves carefully, and by including it in both the “Dear CEO” and “Dear CRO” letters, it is clear they are looking for better reserving engagement from outside of the Actuarial Function. Reserving validation forms an important part of this engagement.
Commercial Pressures
2.3.13 Reserving actuaries have always had the pressure of balancing regulatory and commercial pressures. This is not a new problem but one which is becoming more prevalent. For example, Lloyd’s Decile 10 has put poor performing classes in the spotlight whereby underwriters will be keen to improve these classes and want to see benefit taken in the reserving process quickly. However, this is in direct conflict with regulatory pressures faced by reserving actuaries who need to ensure deterioration in experience is being allowed for in the latest reserving exercises.
2.3.14 This is also a concern highlighted by the PRA as outlined above in the Dear CEO letter, with the regulator hinting that firms should expect reserving to remain “important area of supervisory focus for us in the months ahead, particularly for firms with material exposure to longer-tail casualty lines, firms that show a poor track record or reserving developments compared with initial assumptions and those who have shown rapid growth”
2.3.15 With the increase in availability of data, enhanced computing power and development of new techniques, there is competitive advantage to be had by automating processes, focusing effort in the value-add areas and ultimately understanding your business better. Given how important reserving analyses are to the business, reserving validation is an essential part of this.
2.4. COVID Provisions as an Example of Validation under Stress
2.4.1 The global pandemic had a significant impact on the insurance market as a whole in 2020 and the impact varied by type of firm (personal lines/London market) and by class of business (e.g. motor has performed well whereas contingency and financial lines e.g. Directors & Officers (D&O) or Political and Financial Risk have seen deteriorations).
2.4.2 This made reserving for affected classes difficult given the sensitivity and subjectivity of assumptions (e.g. duration of lockdown and multiplicity of lock downs), and it tested our standard validation techniques. For example, where reported claims were lower than expected (typically a measure of improved experience), it was not clear whether this was simply a delay in claims notification as a result of lockdown or a genuine improvement in claims experience. The impact of COVID on some of our standard validation techniques will continue long after the reserving assumptions return to a “normal” level as it has disrupted the prerequisite assumption that data sets are relatively stable.
2.4.3 Reserving actuaries are under the spotlight more than ever to effectively communicate key uncertainties and assumptions to both the Board as well as external stakeholders such as auditors and regulators and validation forms an important part of this.
2.4.4 The pandemic has impacted other departments, for example, capital, pricing of future policies and wordings. This has put additional pressure on the actuarial function to ensure a consistent approach in methodology and assumptions in determining COVID provisions and validation of the reserves set for these losses. Overall, the impact of COVID has brought into focus the limitations of our current validation techniques.
2.5. Validation Framework
Current Status of Validation in the Industry
2.5.1 Reserving validation is not a new topic, most firms have been completing some form of validation on their reserves for many years, using techniques such Actual versus Expected analysis and comparing their reserves to market benchmarks. The wide range of validation approaches used is described in detail in section 3. The challenge is that these are often applied piecemeal and have significant limitations when only looked at individually.
2.5.2 Overall, there is little standardisation to the validation of reserves in the insurance market, and there is often no formal validation framework used. This contrasts with many firms’ approaches to capital validation, where the methodology is reasonably homogenous across the industry and the objectives are well defined and agreed upon.
2.5.3 If a firm does not yet have a formal validation framework, we recommend developing one.
Why Adopt a Validation Framework
2.5.4 A robust validation framework for reserving is important to ensure the reserves booked by an insurance company are reasonable and appropriate for the risks written by the insurance company This is more true today than ever before given factors such as
-
Increased regulatory scrutiny (Dear CEO, CRO and Chief actuary letters)
-
The impact of COVID-19 and increased economic uncertainty in the aftermath
-
Climate change and other ESG risks
2.5.5 Each validation method (set out in section 3) has distinct strengths and weaknesses. Applying techniques in a scatter-gun approach risks duplicating effort in some areas of reserving validation, whilst potentially missing other missing signs of reserve inadequacy elsewhere.
2.5.6 Where validation is unstructured, the emphasis is on the reviewing actuary to judge where validation tools are most needed and then apply them. For example, there might only be time to conduct scenario analysis or backtesting of assumptions on one or two specific classes and limited other validation information to assist with the selection of those classes.
What Makes a Good Validation Framework?
2.5.7 A good validation framework provides appropriate assurance that the reserves are appropriate in the most efficient way possible. A well-designed validation framework is set up in advance and includes a full “toolkit” to assess the validity of reserves. This ensures the right tools are available at the right time to both:
-
Monitor the portfolio in aggregate
-
Perform detailed validation in high-risk areas.
2.5.8 We classify validation techniques into three categories:
-
1. Numerical validation
-
2. Contextual validation
-
3. Governance validation
2.5.9 A good validation process will include aspects of all three to ensure complete coverage of the reserves. This is an example of the “swiss cheese model” where each layer of validation has flaws (holes in the cheese), but each slice of cheese has the holes in difference places, so there is no direct path through the multiple layers.
2.5.10 Figure 1 sets out a suggested structure for a reserving validation process, with key methods added to each stage.
Suggested structure for reserving validation process

3. Current Approaches to Validation
3.1. Reserving Validation Toolkit
3.1.1 Validation activity is an integral part of the actuarial control cycle and forms an indispensable part of the reserving process. Reserving validation is not therefore a new topic; most firms have been completing some form of validation on their reserves for many years, irrespective of whether or not these activities are called “validation” or carried out as part of a structured reserving validation framework. A wide range of validation methods already exist and have wide use across the market, assisting firms with the following:
-
Validity of data
-
Appropriateness of the data segmentation into projection classes
-
Suitability of the projection methodology
-
Reasonableness of the key assumptions and judgements
-
Reasonableness of movements in ultimate between reviews
-
Assessment of uncertainty in best estimate
-
Appropriateness of the booked reserve results (if different to the best estimate).
3.1.2 Figure 1 in section 2.5.9 sets out some of the main approaches used by reserving teams to assist with reserving validation following the structure of a proposed optimal validation framework. This section discusses these current approaches to validating reserves, together with their strengths and limitations.
3.2. Numerical Validation Methods
3.2.1 Ratio Analysis
Method Overview
3.2.2 The appropriateness of reserves can be quickly checked by comparing the reserves over the accident or underwriting periods against historical experience. Below are some common metrics frequently used for this purpose:
-
Incurred to ultimate ratio
-
Paid to ultimate ratio
-
IBNR to outstanding ratio (or to total reserve)
-
Paid to incurred ratio
-
Survival ratio (for latent claims and long tailed classes)
-
Similar metrics can also be applied when projecting frequency and severity separately.
Best practice for Implementation
3.2.3 Quantitative metrics should be calculated for each accident/underwriting period, and comparison between current periods and historical experience should be made for each accident/underwriting period projected. Accident/underwriting periods identified as outliers/sticking out of the pack of historical experience should be justified (e.g. large events, changes in claims handling), as should clear trends in metrics, for example, step changes or fanning out of patterns.
3.2.4 It is good practice is to apply a range of quantitative indicators, as no one metric can provide assurance that the projected reserves are reasonable alone.
3.2.5 The best implementations make use of automation to flag classes of business where reserving assumptions may be strained or broken, and thus where a detailed review is required. Automation reduces the amount of actuarial time spent on producing and reviewing the analysis. Successful automation can be based on setting review thresholds for each metric and then performing deep dives in areas flagged up. This relies on a robust exercise to set the appropriate validation thresholds. More advanced implementations can use machine learning to look for outliers or unusual features in data.
Strengths and Weaknesses
3.2.6 Quantitative validation metrics are the workhorse of many existing validation processes. This is because they can be designed in a structured manner and then rolled out automatically review after review, for example, in a validation dashboard. Results of these tests can be displayed graphically and are relatively simple to interpret. Inclusion of a range of diagnostics as appendices to reserving committee papers can assist NEDs on the Board/Reserving Committee with challenging the reserves and understanding areas of potential prudence or optimism.
3.2.7 The key disadvantage of most quantitative metrics is that the main point of comparison is against past experience. In situations where the past is not a good guide to the future, assumed incurred/ultimate or paid/ultimate ratios may sit substantially outside the range of historically observed ratios. This may arise where a portfolio has been re-underwritten, where the claims process has been materially changed, or following legislative change. It is in these circumstances that validation of the reserves is most critical, but it is also when ratio analysis and comparisons to past experience are least likely to be meaningful.
3.2.8 Another disadvantage is the circular nature of some metrics. For example, if projecting claims trends using an incurred chain ladder, it is likely that the incurred to ultimate ratio will appear reasonable, so the paid to ultimate ratio is a more powerful validation test. One approach to avoiding the circular nature of ratio analysis is to validate patterns on a different basis to the projection. So, where the development patterns are applied on an accident basis, validation can be more independent if the reserves are transformed to an underwriting basis and quantitative metrics derived on this basis.
3.2.9 Actual v Expected (AvE)
Method Overview
3.2.10 Actual versus Expected analysis (AvE) tracks the difference between actual claims experience and the expected experience, based the assumptions from the most recent reserving exercise (or from the business plan). The main forms of AvE are as follows:
-
a. Incurred/paid AvE: The actual incurred (or paid) position is compared to an expected position derived from claims development patterns.
-
b. Ultimate AvE: The new “actual” incurred position is projected to ultimate and then compared to the ultimate from the previous reserving exercise.
-
c. A v Plan: Actual experience is compared to forecasts from the business plan.
3.2.11 Although more commonly used as a guide to adjusting development patterns, AvE is also a powerful validation tool. The change in ultimate cost resulting from reserving assumption changes can be compared to the output of AvE analysis. Ordinarily, ultimate movements should be in the same direction as the AvE. The magnitude of the ultimate movement should also be proportionate to the AvE change. Reserving assumptions should be challenged if (for example) the actual experience is worse than expected, but changes to reserving assumptions have reduced the ultimate or failed to increase the ultimate in line with emerging experience.
3.2.12 The same comparison approach can be applied to the business plan. This provides additional validation of any underwriting/planning assumptions used in the reserving process.
Best Practice for Implementation
3.2.13 A best practice implementation should consider AvE at both an aggregate and granular level:
3.2.14 The granular tracking provides feedback on individual development patterns or on key assumptions. This is important because this type of feedback can be directly compared to adjustments to reserving assumptions and used to challenge them.
3.2.15 Aggregate AvE is also important because it provides a holistic overview of how a class or portfolio has performed compared to expectations and how assumptions have been adjusted to reflect this. Aggregate AvE is particularly useful for ensuring that the cumulative impact of numerous small adjustments is proportionate to emerging experience. A common challenge with reserve reviews is to make granular adjustments that can be justifiable at a granular level, but either overcautious or optimistic in the aggregate.
3.2.16 Overall, the most effective AvE validation processes are semi-automated processes that require very limited mechanical update at each review. They include a well thought out mix of granular and aggregate tracking and include comparisons of emerging experience to both the ultimate cost and (for live accident or underwriting years) to the business plan. The AvE differences are captured in a dashboard alongside ultimate movements. Appropriate tolerances are set and a clear explanation is provided for any inconsistencies between ultimate movements and AvE when those tolerances are breached.
Strengths and Weaknesses
3.2.17 AvE is most effective for classes of business that are stable and develop smoothly to ultimate. It can also be applied to almost any assumption, for example, separately for frequency and average cost, as well as in aggregate. This means AvE is a very flexible validation tool for challenging both granular assumption setting and aggregate level account performance.
3.2.18 The outputs from an AvE are quantitative in nature and typically easy to explain to a reserving committee, which helps stakeholders challenge the reserving process.
3.2.19 AvE is less effective for classes that have lumpy experience, for example, low frequency and high severity classes like motor large bodily injury. The lumpy experience can lead to significant AvE differences which are due to random volatility rather than a driver that the reserving process needs to react to. Unfortunately, these classes are often the ones where validation is most important. Steps can be taken to improve the AvE analysis on such classes, for example, aggregating classes together to increase the volume of data, or considering annualised movements instead of monthly or quarterly data.
3.2.20 A further limitation is that AvE can be difficult to perform on a net of reinsurance basis. This is because development patterns are only derived on a gross basis and netted down, as interactions between the gross reserve and non-proportional reinsurance layers, or profit shares can be hard to model as adjustments to the gross development pattern.
3.2.21 A final weakness of AvE is that it is often tracked only between quarterly reviews, with expectations “reset” at each review point. As such, it is possible to miss systematic pattern changes over time if on a quarterly basis they do not exceed the review threshold. The very best AvE analysis processes include tracking that continues across multiple review periods to ensure that longer term systematic deviations between experience and assumption are captured. In this respect, AvE overlaps with pattern back-testing analysis.
3.2.22 Bootstrapping
Method Outline
3.2.23 Bootstrapping claims triangles or historical development factors is a common method to measure reserve variability in a structured and quantitative way. Plausible alternative datasets are derived by sampling residuals between the best fit chain-ladder and the dataset from which it is derived. A range of ultimates is produced from the outcome of the alternative projections (typically 1000’s). This provides a quick quantitative assessment of the uncertainty in the reserve on a particular class.
3.2.24 Bootstrapping is often used to assist with the calculation of management margins where companies choose to book their reserves above the mean (eg booking at the 60th or 75th centile). In the context of reserving validation, bootstrapping is a quick and effective way of demonstrating that the fitted chain ladder model is not an outlier and has not been fitted in a biased way. For example, all things being equal, the result of the fitted chain ladder should be close to the mean of the bootstrap distribution.
3.2.25 If the output of the fitted chain ladder is towards one end of the range of simulated outcomes, this could mean that
-
Too many “outlier” link ratios have been excluded from the analysis
-
The model is fitted to an inappropriate number of historical origin periods.
3.2.26 A good implementation of bootstrapping as a validation tool is to assess which centile of the bootstrap distribution the selected ultimate cost sits at. The methodology should be challenged and the deviation justified if the result is outside an agreed range or below the mean. This type of analysis works well in conjunction with assessing results at different granularities (see section 3.2.4).
Strengths and Weaknesses
3.2.27 When bootstrapping, it is important to assess the appropriateness of the inclusion of development factors in the sample, for example, those related to one–off events. Also historical development factors may not always reflect the underlying variability when the portfolio has been through significant change over the past.
3.2.28 Reserve variability is also measured in the capital model. Ideally, there should be consistency between the volatility calculation used for reserve benchmarking and the capital model.
3.2.29 Bootstrap volatilities can be hard to explain, as can changes in the volatility between reviews. In particular, they can be sensitive to large individual residuals within the triangle. Therefore, performing an effective bootstrap calculation can be quite time intensive for the reserving team.
3.2.30 Bootstrap works well with densely populated data triangles and performs less on sparse data triangles. Consequently, for the most recent periods in the lowest part of the data triangles bootstrap results might exhibit a wide range, making validation harder. In addition, when methods other than chain-ladder are used (e.g. B-F (Bornheutter - Fergusson) methods in the more recent origin periods), bootstrap results can significantly depart from the actuarial best estimate. All these issues should be considered when interpreting the bootstrap results in validating the actuarial best estimates.
3.2.31 Back-Testing
Method Outline
3.2.32 Back-testing in the context of reserving validation means assessing the goodness of fit when applying current reserving assumptions to older historical cohorts.
3.2.33 In the case of incurred or paid development patterns, this might mean fitting the development pattern to the latest data set but then back-testing it by applying it to older historical data and considering actual versus expected movements between the historical date and today.
Best Practice
3.2.34 Back-testing of development patterns is not currently widely adopted as a validation approach but can be complementary to AvE analysis. Back-testing is particularly powerful where a reserving or risk team has a particularly robust AvE process.
3.2.35 A good practice implementation would take the newly fitted development patterns and then apply them to the data set from previous reviews (e.g. last quarter, last half year, last year). For each historical data set, the AvE arising between the as-at date of the data and today is calculated. For firms with strong thresholds or metrics for assessing AvE, it is thus possible to test whether the new proposed development pattern would pass AvE if it had been implemented in the past. This approach can be useful to help validate whether changes to development patterns have accurately compensated for emerging experience identified in the AvE and ratio analysis work.
Strengths and Weaknesses
3.2.36 Back-testing in this format is an extension of the AvE process. As such, it is most effective where the AvE process itself is robust. Conversely, it is difficult to implement where the AvE process is run at the start of the reserving exercise but not incorporated into the validation feedback loop.
3.2.37 A key strength of back-testing is it can provide quantitative assurance that the latest adjustments to reserving assumptions allow for recent trends in data. Often AvE is used to identify classes with AvE tracking errors, but there is no formal validation exercise to prove that refined assumptions correct that tracking error.
3.2.38 Like AvE, back-testing is straightforward to apply to classes where the reserving methodology is triangle/chain ladder based. It is more challenging to apply to claim-by-claim models or to apply to net reserves.
3.2.39 Ultimate Tracking
Method Overview
3.2.40 The ultimate liability estimated at a preceding valuation date may be revised at the current valuation date. This revision can arise due to any of the following reasons:
-
Updating data for the current period (for, e.g. adding the diagonal to the Chain ladder method)
-
Change in the method
-
Change in the assumptions
3.2.42 The impact of the first reason will be captured in AvE diagnostics. For instance, a reduction in the actual claims compared to expected can be inferred as a positive movement resulting in reduction of the ultimate liability. This shows an underlying link from the AvE to the movement in ultimate.
3.2.40 However, the other reason also needs to be monitored and their impact on the ultimate liability should be estimated and explained to stakeholders. The results of Movement Analysis can aid in discussion with stakeholders, where they can provide additional feedback and corroborate with our findings. We can explain the movement in form of a waterfall chart where the reader can understand the most important component leading to change in ultimate:
3.2.43 Figure 2 shows the change in the reserving method has mainly contributed to an increase in ultimate from 90 to 100. This change in the ultimate is monitored on an accident year/underwriting year basis for different classes of business. There can be higher volatility in ultimate liability for the less mature years or the long-tailed classes of business.
Movement analysis on movement in ultimate claims

3.2.44 Helping users to understand the movements helps them to understand the drivers of the model which allows them to validate the model more easily and sense check the movements against how they expect the figures to move based on experience.
3.3. Contextual Validation Methods
3.3.1 Sensitivity, Stress, and Scenario Testing
Method Overview
3.3.2 Stress testing, sensitivity testing and scenario testing can all be used to help validate reserving assumptions by providing context around possible alternative outcomes. Understanding possible alternatives can provide comfort that the most critical assumptions are within the range of reasonable best estimates. This is particularly useful for assumptions that are material, uncertain, prone to change over time or a combination of all three!
Best Practice
3.3.3 A best practice approach to stress, scenario and sensitivity testing is one which is joined up with the wider business. Most firms perform a range of tests, but these are often focused on overall business risks in the ORSA (Own Risk and Solvency Assessment) or on validating the 99.5th centile of the capital model. Reserving functions can independently implement their own sensitivities and scenario tests on key parameters, but the best approaches create a joined-up testing regime across reserving, risk and capital, covering all key parameters and the full range of outcomes across the probability distribution.
3.3.4 Sensitivity and scenario tests should consider both upside and downside risks. Reserving actuaries may tend to focus on downside risks because these are often topical from a reserving committee perspective. However, from a validation perspective, it is also important to include sufficient upside testing to demonstrate that the reserving parameters being tested are best estimate.
3.3.5 The parameters subjected to scenario/sensitivity testing should be regularly reviewed, as should the range of tests applied. The parameters that are most uncertain, or to which the reserve is most sensitive, may change over time. Scenario tests are best when they include situations that are currently topical, or which pose a current risk to the business. There is a risk that they become stale and irrelevant if not regularly reviewed.
Strengths and Weaknesses
3.3.6 Scenario tests are usually transparent and easy for stakeholders to understand. Other functions can provide input into the selected sensitivities and scenarios and can assist with interpreting the results. This helps improve the understanding of key drivers of reserves across the business and helps demonstrate this to regulators and auditors understanding the risks of the business.
3.3.7 One of the main challenges of scenario analysis is often in scenario design. Key assumptions that would benefit from sensitivity testing (like inflation) may only be captured implicitly within a model rather than as an explicit adjustable parameter. This makes the design of scenarios for these parameters very challenging. Partial implementations (e.g. only adjusting inflation assumptions in prior assumptions and not in chain ladders) risks providing false comfort about the importance of these assumptions.
3.3.8 Industry Benchmarking
Method Overview
3.3.9 Industry benchmarks are most commonly used to assist with reserving when the company has a low volume of data to arrive at credible claims development patterns and to estimate the ultimate losses. The different industry benchmarks can be used for a variety of assumptions including the frequency and severity of claims, ultimate loss ratios, inflation assumption and claims development patterns.
3.3.10 Industry benchmarks are also a useful tool in validation to compare a company against others in the market, even where an understanding of the industry benchmark and the method of its estimation is essential to do a valid comparison between a company’s reserves and the reserves estimated by using industry benchmark. If we find that our estimates do not fall within the range of the benchmark, it may indicate under reserving or over reserving and should trigger further analysis depending on materiality.
Best Practice for Implementation
3.3.11 Industry benchmarking is more common in the London Market where the LMA (Lloyd’s Market Association) claims and premium triangles are available at Lloyd’s risk code level. It is less common in the personal/commercial lines space, except in areas of sparse data, for example, Motor large bodily injury and PPOs (Periodic Payment Orders).
3.3.12 Where benchmark validation is used to best effect, the benchmarks are applied as reserving assumptions to produce an alternative scenario. This approach can be applied across all classes or targeted towards the highest risk classes, for example, volatile classes where quantitative validation practices are weaker.
3.3.13 Differences between the benchmark scenario and the actual result should be understood in discussion with underwriting and claims teams. Analysis should compare the following between the internal data and benchmark results:
-
Relative shape of claims development patterns
-
Relative duration of liabilities
-
Differences between average loss ratios, claim sizes and frequency
-
Reserve implied by internal and benchmarking result
3.3.14 The results of benchmarking exercises can form a compelling part of actuarial reporting to help stakeholders understand whether adverse (or favourable) trends in claims development are an industry wide phenomena, or a specific feature of the insurer’s portfolio, for example due to anti-selection.
Strengths and Weaknesses
3.3.15 The key strength of using benchmarking to help validate reserves is through analysis of the differences between the insurer’s portfolio and the wider market. The quantitative outcome of applying benchmark patterns instead of internally derived patterns provides a useful scenario, but it is the analysis of the drivers of difference that adds most value.
3.3.16 The use of industry benchmarks in validation has numerous limitations which users should be aware of, including:
-
Unavailability of an industry benchmark
-
Benchmark not regularly updated so it could be out of date for your purpose
-
The mix of business is often different in industry benchmarks compared with your portfolio
-
Insufficient details or granularity provided by the benchmark which can make its usage limited, for example, the data are for Motor Insurance and not split by Own Damage and Third-Party Liability or the benchmark data includes major catastrophes
-
Lack of clarity in the benchmark construction (e.g. have rating trends been allowed for or how has the Ogden rate change been treated).
-
Difficulty validating the industry benchmark (e.g. erroneous data)
-
Differences in underwriting and claims practices followed by each company
3.3.17 Alternative Methods
Method Overview
3.3.18 Stress, scenario and sensitivity analysis typically focuses on validating reserves through testing of alternative plausible assumptions but using the same modelling approaches. It can be equally valuable to consider the outcome of a wider range of methodologies as part of validation.
3.3.19 In a simple case, this may mean considering paid chain ladders as well as incurred, or burning cost models alongside frequency and severity.
3.3.20 The greatest value comes from considering alternative methodologies where complex modelling is required, for example, when projecting PPO liabilities or when using stochastic reserving models. In these cases, it can be difficult to understand the drivers of movements, so applying simplified models can assist with understanding the drivers.
Best Practice
3.3.21 Use of complementary methods, such as projecting both incurred and paid data, is widely adopted within reserving processes when the data are available. However, methods that are unlikely to be selected often receive limited review, which can limit their effectiveness when used as comparators in reserving validation.
3.3.22 The best approaches to reserving validation define a range of useful methods and then ensure that they are all rigorously reviewed. Differences between methods are challenged and discussed with the business to assist with identifying drivers of claims trends.
3.3.23 Adoption of simplified projections to help sense check complex stochastic models, GLMs (Generalized Linear Models), or PPO cashflow models are less widespread but should be considered best practice. This is analogous to aspects of capital model validation where the impact of model changes or re-parameterisation is often validated using more straight forward side calculations.
Strengths and Weaknesses
3.3.24 A strength of considering multiple methods as part of the review is that uncertainty in the modelling is captured alongside the wider volatility in the reserves. It may also be that performing scenario testing on a single model produces a much narrower range of outcomes than is really possible. Alternative methods can identify this limitation and help identify hidden uncertainties.
3.3.25 A further strength is that cutting the data in different ways (e.g. burning cost, versus frequency/severity) can provide added insight into trends in data.
3.3.26 On the other hand, use of alternative methods is time consuming, as to be effective, each requires a similar level review to those being used to set the best estimate. This contrasts with other validation techniques that can be near automatic or at least quick to update. A balanced approach can be to consider alternatives only on key classes where there is significant uncertainty in the reserve. Simplified calculations for complex models (e.g. PPOs) can be set up or investigated as part of a deep dive, and out of the main review cycle.
3.3.27 Alternative Granularities
Method Overview
3.3.28 Validation using alternative granularities involves applying;
-
Ratio analysis at more aggregate and more granular segmentations than the standard reserving segmentation
-
Using the same reserving approach applied to alternative granularities.
3.3.29 For example, a projection of a personal lines household portfolio may be performed with numerous peril splits (flood, storm, escape of water, fire, accidental damage, subsidence, theft, etc). A powerful approach to validation can be to consider ratio analysis and projections in aggregate (e.g. buildings/contents, or all perils excluding catastrophe) as a check that granular assumptions stack up in aggregate.
Best Practice
3.3.30 Good practice includes applying ratio analysis to aggregate classes. The purpose of this is to ensure that granular assumptions are still valid when combined across a business class or portfolio. For example, it is not uncommon to perform projections at peril level and to err on the side of caution when making selections. For each peril these judgements can be reasonable and pass quantitative validation tests, but when aggregated these selections amount to a level of prudence beyond the best estimate. Aggregate validation is an effective method of identifying such situations.
3.3.31 Best practice goes beyond applying ratio analysis at aggregate levels and also considers re-projection at alternative granularities. This can provide better evidence about the materiality of any prudence or optimism in the granular reserving.
3.3.32 The use of validation at a more granular level than projection is not widely adopted except where an insurer needs to allocate reserves between sub classes; for example, allocating reserves to business units, products or brokers. Where an allocation process is required, ratio type diagnostics are invaluable for helping confirm that the allocation between classes is reasonable.
3.3.33 Arguably, this same granular validation approach can help identify heterogeneity within a portfolio, even if no allocation is required. This is a strong approach to validating the reserving segmentation itself. Whilst not widely adopted, new generations of machine learning tools an assist with the practicalities of monitoring very granular segmentations reliably.
Strengths and Weaknesses
3.3.34 The main limitation of aggregate validation is heterogeneity within the data. Reserving segmentation is chosen to eliminate as much heterogeneity as is practical. Applying ratio analysis or reprojection in aggregate can fail to capture heterogenous features of the data or changes in portfolio mix over time. This needs to be taken into consideration when assessing the results of the validation exercise, which can make the process less automated, more judgemental and more time consuming.
3.3.35 The main limitations to granular validation are data availability and resourcing. Data are not always captured at a more granular level than the reserving segmentation. Even if it is captured, it may not be included in the reserving data, or may be difficult to feed into the existing reserving process. As such, significant resource may be needed to implement a granular validation approach, though this may be worthwhile given the societal trends towards greater use of data.
3.4. Governance Validation
3.4.1 This section provides a brief examination of the role of the governance process in validating the reserves. From the perspective of the reserving team, these validation activities are downstream activities after the team’s internal validation is complete. However, the ultimate purpose of validation is to ensure appropriate reserves are set and thus help protect policy holders. From this standpoint, the three lines of defence model and governance-based validation remains important. As such, we discuss it at a high level for completeness although the main focus of this paper is on more technical validation.
We consider the following:
-
1. Assumptions challenge
-
2. Reserving committee
-
3. Three lines of defence model (including the role of 2nd line review, internal audit and external reviews)
Assumptions Challenge
3.4.2 A powerful form of validation is the process for agreeing and challenging key assumptions with the wider business during the reserving process. An effective process ensures that the views of all stakeholders are captured, ensuring the reserving team does not operate in a silo.
3.4.3 Business challenge can take many forms, from informal conversations with interested parties through to formal assumption setting committees.
3.4.4 From a validation perspective, it can be useful to carry out this type of internal review in at least a semi-structured way. This might include
-
Having a key assumptions log and a set review schedule to review and debate key assumptions (eg inflation rates) with the business.
-
Formalising discussions around key assumptions in regular working groups or committees.
-
Documenting the discussions to ensure that appropriate evidence in support of parameter setting is captured. This is standard practice for capital model validation, but not yet fully adopted in reserving.
3.4.5 Some of the challenges associated with assumption setting groups are
-
Participants often lack a consistent basis to compare views or data. For example, claims teams considering inflation on a settlement basis, pricing actuaries on an underwriting basis and reserving actuaries on an accident basis.
-
It can be difficult to validate an individual assumption out of context of the overall reserving process.
-
There may be the perception that some participants have a vested interest in setting assumptions higher or lower than best estimate.
Reserving Committee
3.4.6 The reserving committee is a key stage in the challenge of reserves for any insurer. The purpose is to bring together expertise and knowledge from across the business to review and agree the reserving results. Many firms’ reserving committees include or are chaired by Non-Executive Directors, but this is not universal.
3.4.7 The effectiveness of validation and challenge provided by a reserving committee depends on both the range of skills represented on the committee and also on the quality of reporting.
3.4.8 In terms of committee composition, it is normal practice to bring together senior stakeholders from underwriting, claims, and finance. These function areas overlap the most with reserving and their representatives are well placed to provide detailed challenge or debate of key assumptions or areas of concern within the reserves. The role of the NEDs (non-executive directors) is to challenge the overall strength of the reserves and to ensure that it is appropriate. This challenge is important as it involves taking a step back from intricacies of individual classes, movements and assumptions.
3.4.9 Key to any successful reserving committee is the quality of reporting provided to the committee. The content and structure of reserving committee papers is, on the whole, beyond the scope of this review. However, the inclusion of good quality exhibits from a strong validation process can help stakeholders get comfortable with reserves or to challenge assumptions as appropriate.
Three Lines of Defence
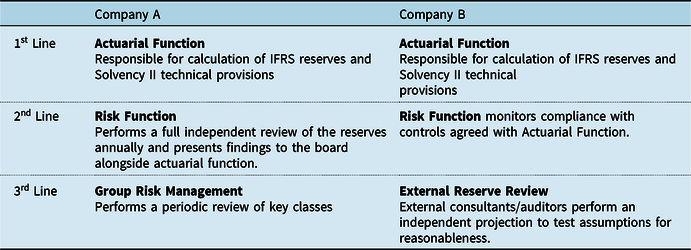
3.4.10 Almost all firms operate a do/check or do/check/review process within the actuarial function itself. This is not surprising, given the IFOA’s APS X2 requirements that actuarial work should be reviewed by an appropriately skilled person. Most firms also operate a form of the 3-lines of defence model. However, there is wide variation in who acts as the 3 lines, and what the remit of each line is. Consider the two contrasting examples in Table 1:
Different Roles within Three Lines of Defence
Risk Team
3.4.11 The risk team often acts as the second line of defence for reserve validation. In smaller firms its role may be blended with that of internal audit (see below), with the principal form of oversight via a control framework. For larger firms a more hands-on approach is more commonplace, with the risk team forming its own independent opinion on all or part of the reserves or performing deep dives to validate the first line assumptions in key areas.
3.4.12 The risk team is perhaps the team that can benefit most from the adoption of a technical validation framework that includes many of the technical validation methods discussed already in this section. Adopting a strong validation framework can help an (often small) risk function fulfil its second line of defence role more effectively by helping focus its efforts on at-risk classes or the most uncertain assumptions. This can be much more proportionate than simply re-projecting key classes using similar methods and judgements to the first line.
Internal Audit
3.4.13 Third line independent testing of the reserving processes provides assurance on controls and governance. It is an additional safeguard against material risks that could be missed due to process related oversights such as data quality. It can also assess whether reserve results are presented in a way that is appropriate for the audience to make the best use and judgement of reserving information.
3.4.14 However, the scope of a third line internal audit is not particularly detailed, where the focus is usually on reserving process and operation rather than reserve selections. This is because internal auditors tend to have an accountancy and audit background rather than being actuaries.
3.4.15 Actuarial resource may be called upon for some Internal Audit reviews, but this may be an actuary from another part of the business (as an internal co-source arrangement) or an external actuarial consultant. They are also generally asked to focus on the compliance with the relevant Reserving Policy and Control Validation testing (with line 1), rather than challenging the reserve model assumptions and selections.
3.4.16 Such reviews would tend to be infrequent and may be conducted only when issues are identified or at the request of Board, Audit and Risk Committees or when required to by a regulator. So, it is more reactive rather than proactive at identifying and dealing with issues. Typically, an internal audit review could focus more on the reserving process rather than the reserving results themselves – that is, the remit being to check the robustness of process – with such an approach reflecting the background and viewpoint of internal auditors in practice.
External Audit
3.4.17 Compared with internal audit, the scope of an external audit will typically include independent projections or methodology and assumptions review on company’s reserves. External audit engagements generally span several years, and the auditor may focus on different areas each year, but the insurer can discuss with the auditor the classes that should be reviewed in detail. The auditor will provide an independent view for comparison especially where independent projections are performed and can also provide comparison to an alternative approach (e.g. reserving at a less granular level). The auditor has access to market views, which provide points of comparison against the market.
3.4.18 The goal of the external auditor may be to only form a view as to whether the methodology and assumptions are unreasonable and may not always perform an independent projection and provide an alternative view. However, the auditor can make suggestions and request results based on alternative scenarios, which can be helpful for the insurer to understand its reserve risk better. Auditors may not always consider the specific issues faced by the insurer and may not go into as much detail which may make their independent estimates less useful.
3.4.19 The auditor’s market view can be particularly useful for market wide loss events to compare to market wide estimate, such as for losses related to COVID, to understand if the insurer’s approach and results are in line with the market.
Independent Actuarial Reviews
3.4.20 An external actuarial review may be requested by the Board, Audit, Risk or Reserving Committees. It is like an external audit, where an independent actuarial team performs independent projections. Because the scope is requested by the company, there is the flexibility to set the scope such that it is aligned to the company’s aims, which can include deep dives in targeted areas.
3.4.21 Unlike external audit, where the same team handles the audit engagement for several years, the actuary performing the reserve review can be selected using a tender process. This means the company can select the reviewer that has the most extensive experience in the area reviewed.
3.4.22 The actuary performing the reserve review usually does not normally have knowledge of the reserves set by the company, so should give a truly independent review of the reserving process and reserve selections. The independent actuary can provide benchmarking of both process (to best in class in market) and reserving selections (loss ratios etc.) to other insurers operating in the country, internationally or specific market segment.
3.4.23 When reserve review results differ significantly, it is commonplace to hold discussions to understand the reasons for the deviation between the internal company view and that of the external reviewer. These discussions may lead the insurer to revise the reserving assumptions in some situations. At other times deviations may be identified as providing areas for deep dives in future reserving exercises. An agreed approach or policy should be put in place prior to the review to outline what approach will be taken if the reviewers’ numbers are significantly different from the internal view. This will enable decisions to be impartial and minimise the impact of commercial pressures.
Regulatory Actuarial Reviews
3.4.24 Reserve reviews can also be conducted by regulator, which may follow a regular review cycle or be ad-hoc if concerns are identified. The regulator may use their own actuaries or commission firms of consulting actuaries to conduct the review. The regulator tends to use experienced actuaries who have wide market experience given they review the reserving of multiple insurers.
3.4.25 The Regulator usually has access to both public and private reporting (e.g. Solvency II reporting), so will also usually benchmark company metrics (loss ratio, paid to incurred ratio, reserve to premium ratio, etc.) against the whole market and other individual insurers, and provides a percentile of where the company’s metrics lie in the range of outcomes for all insurers. This can show if the company is out of line with the market. However, these measures may not always be comparable due to the reporting segmentation not being granular enough or various company specific factors.
3.4.26 The limitations identified above in the section on external reserve reviews applies here in this context as well. The review may only be done at a high level and smaller classes may be excluded from the review. Actuaries conducting the review may not have explicit knowledge of the insurer and its products. This is important when products or policy coverages are non-standard in the market as this can give rise to unusual features impacting the claims reserving which reduces the usefulness of external reserve reviews in this context.
4. Validation of Reserves Affected by COVID-19
4.1.1 The below discussion offers some observed examples from members of the working party as to how they believe COVID has impacted their reserves during 2020. It is relevant for this paper as an example of how validation processes have been affected by a major occurrence (e.g. the advent of the COVID-19 pandemic).
4.1.2 It is clear that an over-arching principle is that a reserving practitioner must make a number of decisions and highlight them explicitly in their documentation. This is a key factor when responding to such an occurrence:
-
Is the impact short or long term?
-
Does the impact change the ultimate claims or just how you get to the ultimate claims in terms of timing?
-
How certain are you of the above?
4.1.3 Inevitably there will great uncertainty with these issues as, at the time of the COVID-19 pandemic, reserving practitioners had nothing historic to compare with. Below are some anecdotal examples of the types of changes seen in different classes of business during the onset of the pandemic.
4.1.4 COVID adversely impacted classes such as travel and business interruption and introduced behavioural changes that has favourably impacted other classes such as fewer miles driven for motor policies and changing frequency by claim type as people stay at home more for household (e.g. lower theft and escape of water, but more accidental damage). These will generally be captured in the AvE.
4.1.5 COVID also impacted the operation of insurers and third-party suppliers and indirectly impacts the claims development for other classes of business. Disruptions to operation such as working from home and reduced activity by claims management companies, lawyers and doctors can distort and slow down the speed of claims handling.
4.1.6 It is important to understand the drivers of change before putting reliance on AvE as a favourable AvE does not always indicate the ultimate results will be better than expected. The triangle of accident period by development period in Figure 3 is for small bodily injury claims. One AvE approach is to compare the latest leading diagonal in the claims triangle with that predicted by the previous period reserve model. Green denotes favourable AvE.
Claims triangle with AvE

4.1.7 Here, we can see favourable AvE over all accident periods shown. The impact on prior year reflects reduced activity in lockdown impacting claims management causing a slowdown in pattern, which may not necessarily lead to a reduction in ultimate as this may create a backlog and cause a catch up of claims.
4.1.8 The impact on the lead diagonal (i.e. 2020) is from fewer claims due to reduced vehicle usage, reducing claims frequency. However, this may possibly lead to higher average cost ultimately as higher proportion of injured not in vehicles, for example, cyclists and pedestrians.
4.1.9 COVID has added complexity where the actual experience differs from the expected and it can be highlighted as a one-off event. In Figure 4, we explain that the COVID impact on liability has been separately quantified for the Health class of business. Considering that there were more hospitalisations than expected but drop in the normal procedures, we can quantify the –COVID-19 liability for the stakeholders.
Example of movement analysis for ultimate claims

4.1.10 For frequency trends, we can analyse reported and the settled claim counts. Due to COVID-19, we observed a spike in reported health claims due to higher hospitalisation. The settlement trends would slow down due to lower manpower to process the claims. Considering the early waves in the pandemic, practitioners at the time looked to incorporate these new trends in our estimation of the ultimate reserves. The challenge was to decide the quantum of increase in frequency expected to capture the emerging experience.
4.1.11 The residuals of the fitted link ratios can provide us information if there are any underlying patterns to help detect distortions in the data. Widely spread or skew distributed residual patterns indicate that the estimate of link ratio is highly uncertain or even inappropriate. The impact of COVID on motor own damage claims was to reduce the link ratio for the latest calendar period (since less vehicles ply on the road, reduced movement of traffic). To disallow for this experience, we can either eliminate the latest diagonals for selection of the link ratio. Second, if the view is that this experience continues in future, practitioners would more weight on the recent diagonals for selection of the link ratios.
4.1.12 Scenario analysis can be used to give an indication of the degree of uncertainty of the impact from COVID, which was a function of infection rate, government actions and economic impacts, which were interrelated. Scenarios for the COVID effect can be generated by considering the following:
-
Starting from the current infection rate at the time of the analysis, look to develop different scenarios of how future infection rates will rise and fall.
-
Consider different patterns, infer from experiences so far and experience from other countries who are ahead of the curve.
-
Link to the timing of events such as the introduction and easing of government restrictions.
-
Government restrictions will influence economic activity and policyholder behaviours.
-
Management actions: risk appetite, and its wish to reduce damages preserve reputation by settling disputed claims.
-
Longer term trends: how will claims trends revert smoothly back to the norm or will there be a new norm?
4.1.13 Scenario analysis can be used to determine a range of reserves, which can be used as the new reserve as a situation changes (e.g. in the event of a second surge in infections leading to more lockdowns). The above analysis and section is important for showing approaches used by practitioners to set and validate their reserves during early to mid-stages of the COVID-19 pandemic and could well be applied to future pandemic events or shocks. The above shows an approach and type of questions to address in response to a shock occurrence and hence provide tools to help tackle future shocks.
4.1.14 Due to COVID-19, we have been faced with a situation of unavailability of benchmark frequency or severity trends to compare our reserving assumptions. The impact of the pandemic varies at different time points and across geographies. For instance, when determining the IBNR reserves for the health claims when the pandemic was at peak, we would have assumed a different frequency and severity as compared to when the lockdown was announced and later when the vaccination drive started. The evolving external environment and the difficulty in estimating the impact of the pandemic makes estimation of the industry benchmark equally difficult and complicated to use.
5. Current Areas of Focus in Reserving Validation
Having explored traditional validation approaches and the standpoint of key stakeholders, this section looks at some current areas of focus in reserve validation. The following couple of topics are covered to give a forward-looking view:
-
Reserve validation under IFRS 17
-
Early warning indicators for adverse development (driven by regulatory scrutiny and by feeding input from validation into forward-looking assumptions)
5.1. Impact of IFRS 17 on Reserving Validation
5.1.1 IFRS 17 is the revision of IFRS 4 standard issued by the IASB (The International Accounting Standards Board) that will drastically change how business performance is measured and reported by (re)insurers globally. These changes are intended to bring standardisation and transparency within financial reporting by insurance companies.
5.1.2 IFRS 17 measures the liabilities in terms of fulfilment cashflows arising from insurance contracts. The fulfilment cashflows include estimate of future cashflows including premium, claims and expenses; besides, an adjustment for the time value of money and provision for the non-financial risks are included. Moreover, the netting-down approach utilised for reinsurance cashflows is no longer compliant and should be replaced with independent processes to source and form assumptions for reinsurance contracts held.
5.1.3 These requirements will drastically change the present processes and validations for IFRS 4 and GAAP reporting. Consequently, this will impact the work of the reserving actuary in various ways – including the approach towards validation as shown in Figures 5 and 6 below.
Pre-IFRS 17 implementation example reserving workflow

Post IFRS 17 implementation example reserving workflow

Working Day Acceleration Impact ![]()
5.1.4 IFRS 17 imposes additional requirements for cashflows modelling, discounting and complex allocations. All these additional steps in the workflow will put pressure on the actuarial resources and processes. Typically, Solvency II processes are completed in the last half of month of closing. But IFRS 17 requires more work than Solvency II and these have to be completed in the first week of any reporting entity. Consequently, IFRS 17 implementation will put pressure on the validation. Solvency II continues and IFRS 17 builds on these foundations.
5.1.5 The response to this challenge is yet to be finalised by companies. A strategy including the mix of automated checks and roll-forwards, reduction in manual processes, continuous validation (as compared to expost-facto (after the event) validation) appears to be the best way forward.
IFRS 17 Adds More Layers to Validation ![]()
5.1.6 IFRS 4 and GAAP focuses on point estimate of reserves within liability. In contrast, IFRS 17 aims to provide transparency regarding financial and non-financial risk elements within financial statements and these will need validation. Consequently, the below apply.
5.1.7 Validation has multiple layers and is no longer linear like in IFRS 4. The AvE actual versus expected net claims experience is the key driver of profitability under IFRS 4. In contrast, IFRS 17 liability and income perspectives are dynamic in that it considers cashflows view factoring the time value of money, financial and non-financial risks, often acting together. Also, IFRS 17 unpacks additional elements, and these will have P&L impact and more public disclosure – for example, unwind of discount rate.
5.1.8 IFRS 17 includes assumptions regarding compensation for uncertainty, that is, the risk adjustment. Therefore, the current validation metrics will need changes to support a risk and time value adjusted view aligned to IFRS 17 and will need validation.
5.1.9 Most of the current validation techniques rely on gross and net of reinsurance metrics. However, IFRS 17 unpicks this approach and requires separate validation and tracking of inwards business and outwards reinsurance.
Renewed Focus on Unearned Exposures ![]()
5.1.10 The current validation for IFRS 4 focuses on earned business. This is because the unearned business liability is simply the unearned premium with any provision for the additional unexpired risk result (AURR). The AURR provisions are typically nil because they are calculated at an aggregated level that offsets profitable and unprofitable business.
5.1.11 But under IFRS 17 there are specific requirements around how the groups of contracts are identified and the losses in one group of contracts cannot be offset against the other. The losses at initial measurement have to be recognised at day zero within the liabilities and flows directly into the P&L. Consequently, IFRS 17 puts unearned business under spotlight and new validation metrics for unearned assumptions will become important and prevalent.
Analysis of Change ![]()
5.1.12 IFRS 17 disclosures and presentation requires the break-down of the movement of various components of liability and traces their movement into P&L. For example, the liability for remaining coverage (LFRC), liability for incurred claims (LFIC), contractual service margin (CSM), loss components (LC) are all broken down in terms of movements within components. The drivers of changes in liability are explained as experience against expected, economic variances and premium variances. Therefore, IFRS 17 will require the creation of additional validation metrics to support with the analysis of change and to explain them to external and internal stakeholders. For example, coverage units under General Measurement Model are dependent on the level of benefits and extent of coverage provided by the insurance company. There is monitoring, tracking and validation of the coverage assumed (for example, sum assured, PML) to be provided – all these will be new requirements for insurance companies and will require provision of additional data fields and corresponding meta-data. Some of the current validation techniques like movement analysis should be transformed to be line with IFRS 17 view of movements.
Hybrid KPIs ![]()
5.1.13 IFRS 17 reporters are likely to amend metrics to an IFRS 17 basis, like insurance service, revenue and expenses, CSM, risk adjustment and loss component within their internal reporting and planning. This will facilitate a good link between how results are reported externally and how performance is measured internally. Alongside these metrics and KPIs, many IFRS 4 metrics will be retained because of demand from business and investors. For example, the measures like gross written premium, combined ratios provide a sense of continuity. However, they are likely to be adapted for IFRS 17. The expenses within combined ratios will be the IFRS 17 view of attributable expenses.
Validation
5.1.14 Under IFRS 4, there was no strict requirement for reserving validation. Historically, the validation has often been completed expost-facto, at specific points within the reserving workflow, and sometimes after important decisions had been taken that had a bearing on the valuation of liabilities. However, because of the integrated structure of IFRS 17 described above, this approach to validation may not be feasible. IFRS 17 may need controls that can predict and are more responsive to an evolving risk within the broad environment of the company. Consequently, the emerging view of validation under IFRS 17 has the features below:
-
Automated: Because of the working day pressures, the sheer number of assumptions and complex hand-offs between teams, automation of validation is recommended.
-
Continuous: Rather than an expost-facto view of validation, a continuous approach is required because there are a number of off-cycle processes that have an important bearing on the quarter-end/annual results.
-
Adaptive: There are non-linear impacts arising within IFRS 17 because the cumulative impact of several risks acting together are just as important as single stress events; and
-
Predictive: The validation metrics, measures and diagnostics have a forward-looking view – taking into consideration the future impacts arising from the current play of risk factors.
5.1.15 More generally, we consider these to be desirable characteristics of a validation process, whether reporting under IFRS 17 or not.
5.2. Early Warning Indicators for Adverse Development
5.2.1 With growing demands for explanation of variability around actuarial best estimate results, there is significant interest in identifying the business drivers of adverse development, and thereby understanding leading indicators of future adverse development as well to calibrate reserve estimates accordingly.
5.2.2 The following KPIs serve as leading indicators to signal worse than expected claim frequency and/or IBNR. This is important for reserving validation as an indicator or areas for further analysis. This section is here because of the increasing use of feedback loops to set forward-looking assumptions is becoming increasingly important in the validation tool box:
Mix of Business in a Leading Indicator of Claims, and Claims are Leading Indicators of Loss Ratio Performance
-
Worse than expected mix of business (skewed more towards high-risk segments)
-
○ For example, in Workers’ Compensation (in the US) or Employers Liability, if the mix of business is skewed towards high-risk industries/class codes
-
○ Similarly, in Motor Liability or Motor Physical Damage, if the mix of business is skewed towards high-risk territories/age groups
-
-
Actual versus expected policy counts and premiums in different risk segments (low/medium/high)
-
○ Risk is defined based on predictive model scores, where high risk = high expected loss ratio
-
-
Higher than expected number of claims during initial earned exposure months
-
○ For example, in Professional Indemnity, or Cyber Liability, if a particular trend in claims leads to a consistent upward trend in reported claims, relative to historical years
-
○ Similarly, in personal/commercial auto, if the number of reported claims within a policy year is higher than the “seasonality-adjusted” average of prior historical years
-
-
Actual versus Expected large losses, early in the policy life cycle
-
○ Ultimate claims incurred amounts are lagging indicators due to the tail on development
-
○ Claims predictive models are used to predict the claim severities
-
5.2.3 Figure 7 shows an example of how the combined effect of a worse-than expected mix of business and a higher-than-expected number of claims during initial exposure months was used to forecast IBNR loss ratios (accounting for adverse development), with a margin of uncertainty using Bayesian predictive modelling methods. An example set of different insurers from different industry segments is presented in Figure 7.
-
1. A multivariate Bayesian frequency model (using size, industry, territory, limit and deductible) was developed to estimate the number of claims per unit of exposure (measured in terms of revenue)
-
2. That multivariate model was applied to future earnings of exposures to forecast claim counts for each policy, based on future Earned Revenues
-
3. A multivariate Bayesian severity model (using industry, territory, limit and deductible) was developed to forecast the ultimate severity for claims forecasted in step 2 above. This gave loss forecasts for each policy
-
4. The orange bars represent the predicted range of unadjusted loss ratios, calculated by dividing the total losses forecasted, by the unadjusted premiums. The green bars represent the adjusted loss ratios, after the premiums were adjusted to account for prospective rate adjustments based on rating plan changes
Predicted unadjusted loss ratio v loss ratio (adjusted for rate change)

5.2.4 The following KPIs serve as leading indicators to signal worse than expected claim severity IBNR:
-
Worse than expected mix of claims (skewed more towards high-risk claim types)
-
○ For example, in Workers’ Compensation (US) or Employers’ Liability, if the mix of claims is skewed towards high-risk injuries (head injuries, motor vehicle accidents, etc.)
-
○ Similarly, in Motor Liability or Auto Physical Damage, if the mix of claims is skewed towards high-risk claims such as multi-party claims, or legally represented claims
-
-
Worse than expected claim severities during initial earned exposure months
-
○ For example, in Motor Liability or Professional Indemnity, if the average settlement amounts in initial development periods indicate a consistent severity uptrend driven by social inflation
-
5.2.5 Figures 8, 9, 10 and 11 are the results of the multivariate Bayesian severity model mentioned in step 3.
-
X axis represents the age of the accident year (in months)
-
Y axis represents the severity (actual and forecasted) where the divergent coloured lines represent forecasted severity
2018 Severity charts

2019 Severity charts

2020 Severity charts

2021 Severity charts

6. The Future of Reserving Process Validation
This section looks at the future of reserving process validation and considers the following aspects:
-
Analysis of trends in reserving validation
-
How we can use machine learning to move the dial on validation
-
What about data and how data quality affects reserving validation
6.1. Analysis of Trends in Reserving Validation: Future Outlook
Why Validate
6.1.1 At the core of validation is the analysis of expectation from actuarial method that requires this to be best estimate; unbiased; stable; responsive and independent. It has to be comprehensive in order to provide sufficient coverage.
Questions to Answer While Validating Reserve Results
6.1.2 In earlier sections, we have reviewed the questions to address when validating reserve results. These include measurement of estimation error; appropriateness to specific circumstances and provision of insights into relative strengths and weakness of methods under circumstances such as through the COVID-19 pandemic. However, we would like to add the following goals based on our experience across commercial and personal lines in both a Lloyds and non-Lloyd’s context:
-
Diagnostics of results against experience such as the table proposed in section 3.2.42
-
Avoidance of methodological bias and other systematic errors
-
Early warning for appropriate action – these can be developed using development factor heat aps such as that shown in section 4.1.6 in the context of COVID-19
-
Visualisation of key risks and insights
-
Striking the right balance in terms of estimation bias; variance and accuracy
-
The implementation of methods that as simple to explain, easy to measure and understand
-
The adoption of a goal of the avoidance of cognitive bias
-
Clarity regarding appropriate levels of prudence
-
Adoption of clear assumptions regarding stationarity
What Stages to Apply Validation
6.1.3 We note that there has been great progress in development of validation methods over recent years, and that this has of necessity taken a significant jump forward in response to the COVID-19 crisis and the inability of reserving models to respond dynamically to the data and development challenges of COVID-19. Although it should be noted that the topic of validation was raised in the PRA Dear Chief Actuary letter of November 2019 (which pre-dated the emergence of COVID-19 by several months). Validation should not be an ex-post facto exercise and look at, for example:
-
Performance testing on statistical predictions, and
-
Performance testing on (for example, clinical predictions) (including the actuary’s judgment) within the validation process.
How to Address the Weakness of Current Validation Methods
6.1.4 In order to develop a view of the future of validation, the weaknesses of current validation methods need to be identified and addressed. This could be achieved by techniques such as enhanced movement analysis to avoid anchoring and biases, embedded stress and scenario testing, and the use of sensitivity test libraries from reserve reviews and stress testing of reserves on a quarterly basis. This will highlight the uncertainty around the best estimate reserves and provide business insight into reserve adequacy.
6.1.5 As discussed in section 3.2.3, it is also important to look at approaches such as scenario and sensitivity testing around the key assumptions being used on both a gross and net basis. This will include development patterns, initial expected loss ratios (IELRs) and RI (return on investment) ratios. It is also important to look at scenario testing, and work with the business to determine key scenarios that may impact the reserves of a company. This should include large losses and catastrophe (cat) losses. This will bring more focus on reinsurance and net ultimate incurred losses with the use of the capital model to remodel complicated reinsurance structures and how changes in gross positions change RI, and to investigate key percentiles for assessing reserve risk. It is important to address then known weaknesses of actual versus expected (AvE) tracking, and also to recognise that constantly adding additional diagnostics may lead to a point of diminishing returns being reached.
Leveraging New Tools for Expanding the Actuarial Repertoire for Validation
6.1.6 Cross learning and best practices from other fields can help reserving actuaries move forward in terms of validation. Machine learning (ML) predictive models are increasingly being used to validate assumptions that provides an approach to improve validation by introducing a degree of automation into the validation process. Typical validation questions can then become whether the mean of implied frequency and severity models from the reserving process fall in the ballpark of a ground up claim-level frequency/severity ML model?
6.1.7 We can transplant validation techniques or use ML as diagnostics. This allows cross-validation techniques to become important, with a need to consider that these are commonly used in statistics and ML. It is very useful to measure model, parameter and process risks as part of the validation process. This can be used to enhance the following techniques in use: AvE; back testing and variants of cross validation (K-Fold Covariance analysis etc.). At present, these only measure the error of statistical predictions and are difficult to perform for clinical predictions (for example), and there are challenges with application of serial correlation.
6.1.8 The use of clustering has been suggested to identify homogeneous groups and have AvE at the granularity of homogenous risk groups – this helps to avoid Simpson’s paradox (2021) (i.e. where a trend appears in several groups of data but reverses or disappears when they are combined). Auto roll-forward approaches and dynamic weightings are growing in popularity as part of the trend to use clustering to select homogenous risk groups for AvE analysis.
6.1.9 Bootstrapping, sensitivity and scenario analysis are mainstays of validation and can be supplemented by more advanced visualisation. Such advanced visualisation approaches to validation include partial dependence plots, receiver operating characteristics, shapley value and SHAP dependence plots.
6.1.10 Looking to the future is also important. Big data (i.e., extremely large data sets that can be analysed computationally to reveal patterns) and IFRS 17 are topics of great interest in respect of their impact on validation (and IFRS 17 and validation processes was covered in detail in section 5). These lead to the need for the ability to perform reserve validation at a much more granular level (e.g., claim level, market segment level) and to ask whether particular cohorts of claims or particular market segments (geographies, industries, etc.) are driving any observed reserve deterioration.
6.1.11 Companies and consultants are both investigating techniques such as ML. This creates new opportunities for validation and cross learning opportunities. Advances in natural language processing bring the automation of the following into scope:
-
Checks and balances between assumption setting for reserving, planning, capital, and pricing:
-
○ Frequency-severity assumptions implied by reserving (at a granular level) are being compared against frequency-severity assumptions implied by pricing
-
-
Dynamic dashboards for reserving:
-
○ Big data can now be aggregated real-time thanks to much better processing power, and this is being used to feed dynamic dashboards that break the down the implied reserving assumptions and allow for better assumption tracking
-
○ Are the implied loss ratios (say at an industry/geography level) moving away from the pricing assumptions, and is this movement within an acceptable threshold?
-
6.1.12 The design of early warning indicators of under reserving and deterioration is important. These include
-
Use of big data/granular data and ML to provide early warning indicators
-
○ For example: if number of litigated claims is higher than expected, even if the case reserves may not have developed yet, it is an early warning to increase (incurred by not enough reported) IBNER
-
-
Claims/UW ML predictive models predict a higher-than-average number of “complex” claims, or project higher-than-average frequency, the IBNR should reflect those projections even if the loss experience does not reflect yet
-
There should also be a quarterly feedback loop between the loss experience and the ML models
6.2. Why Machine Learning is Important to the Future of Reserving
In this section, we do not seek to explain how Machine Learning methods work or give a guide as to how they should be used. Instead, we use an example to demonstrate that they are capable of successfully being as predictive as humans to demonstrate to the reader our conclusion that they are important to the reserving actuary of the future.
In this section, we discuss two developments that we foresee will impact reserving individually but to a greater extent together.
More Predictive Reserving Methods from Machine learning (ML) Algorithms
6.2.1 The first development is on the reserving methodology side. Within the next ten years several carriers will develop new reserving methods through the application of ML techniques that will see improvements in predictive capabilities that we have o’t seen in the last 40 years. Not only that, but these methods will also be automated, meaning that the time taken to make these predictions will be greatly reduced. The following section aims expand on this.
6.2.2 The Arch actuarial team have kindly allowed us to publish the results of an exercise that they carried out in conjunction with a data science specialist consultancy called Augmize. Again, we do not give all the details as to how this work was implemented – we merely use the results as a case study to prove our point. Alastair Lauder oversaw this project while working at Arch and this is how it was introduced to the working party. If you would like an original copy of the paper, you should contact Steven Loyens the Chief Actuary at Arch Insurance.
6.2.3 The work involved carrying out an experiment using Lloyd’s risk code data. The Arch Insurance actuarial team provided a database of historic risk code projections going back to 2016 carried out by actuaries.
6.2.4 The accuracy of the human projections was tested against that of ML algorithms built to predict the ultimate premiums and claims for risk code data. For this machine learning software with interpretable AI for granular loss modelling platform for creation and maintenance of reserving and pricing models was used (supplied by Augmize).
6.2.5 The purpose of this section is not to give an in-depth view of the methodology but to demonstrate that these algorithms provide a similar level of accuracy to that of a human actuary.
Dataset
6.2.6 Risk code data which spanning 1999–2019 with 2100 unique classes of business and account years. Models were trained on a core bed of data spanning 1999 to (end of) 2015. Training data were then added incrementally for more recent origin years to compare to those estimates made by actuaries.
6.2.7 Figures 12 and 13 demonstrate what information was used by the ML algorithms.
Comparison of actuary versus machine learning
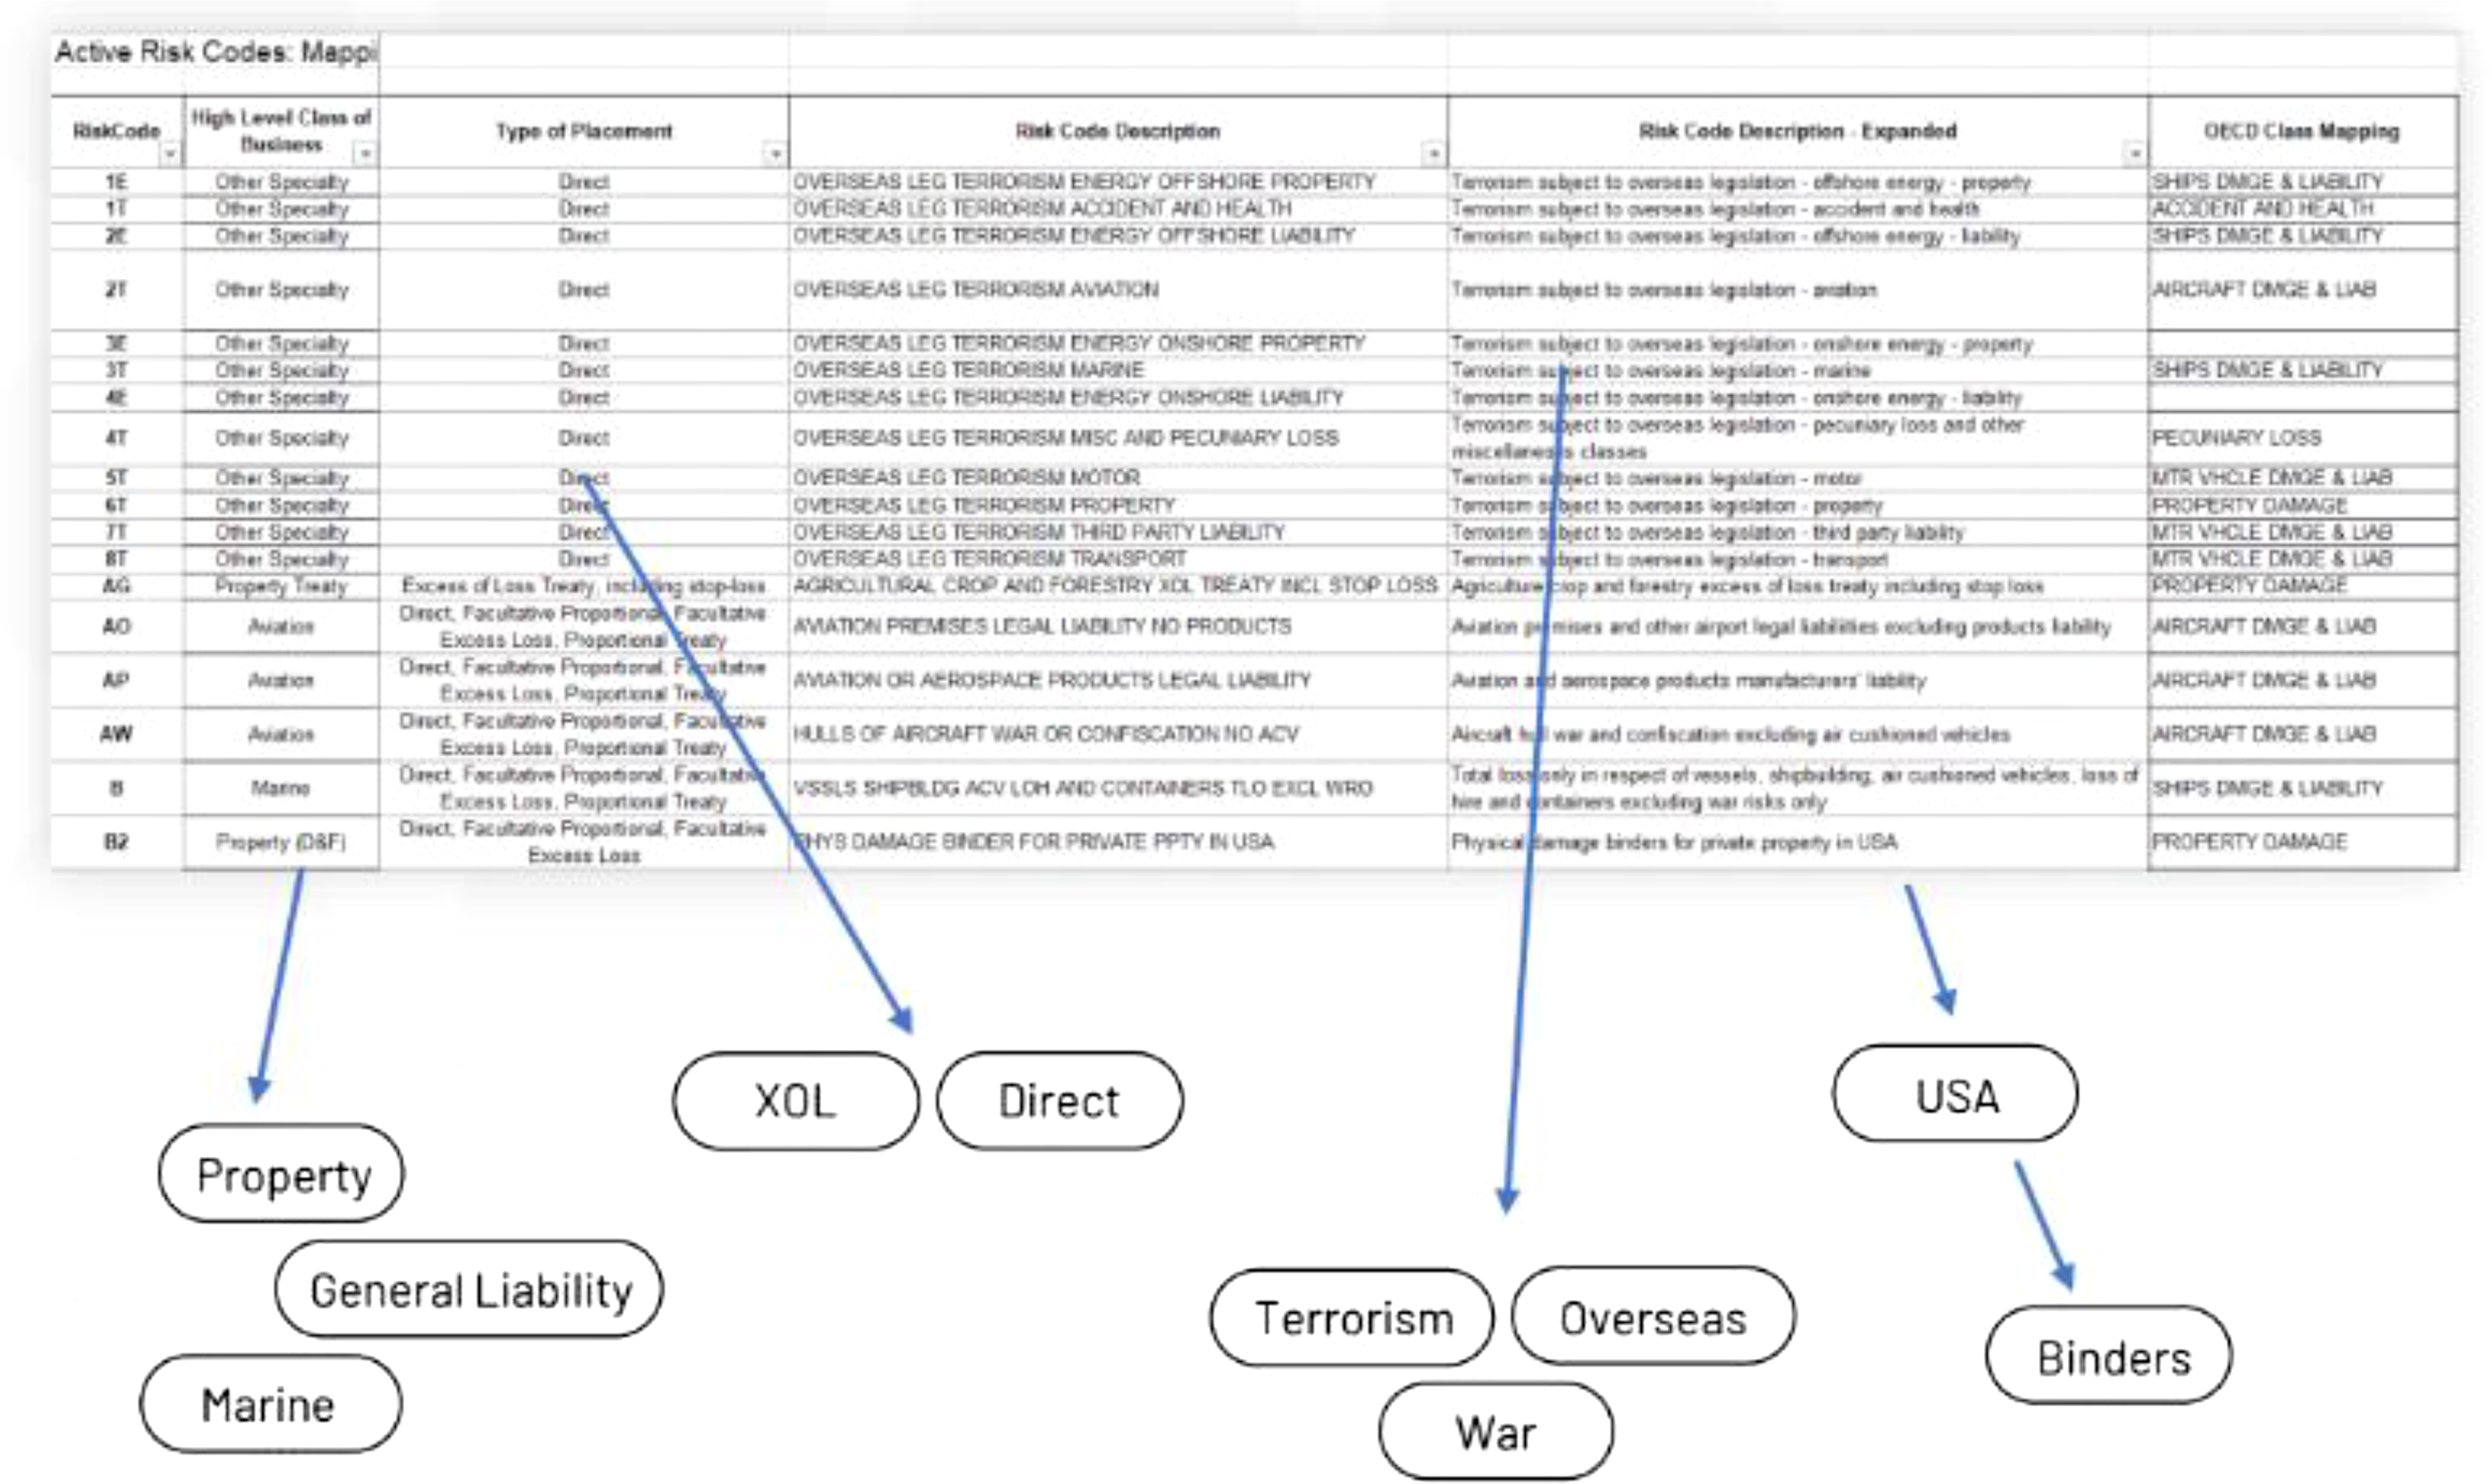
Breakdown of predicted ULR

6.2.8 Models were based on premiums, paid and incurred triangles along with the risk code mapping text data in order to assign labels to the data.
6.2.9 The simple error metric is taken as % error of the prediction versus actual ultimate loss from history. Two different calculations of actual ultimate loss were used. However, there are many, and it is one area that requires more analysis and discussion as to the pros and cons of each way of assessing the error.
6.2.10 Error method 1: Chasing known ultimates from history. This method filters for examples of historical classes that have fully developed, which form ground truth examples of Ultimate Loss. Here we may challenge both the ML and actuary to predict these ultimates and measure absolute errors of human and machine. Note that overall this limits the number of data points because only fully developed years are relied upon.
6.2.11 Table 2 shows average errors of the ML are equivalent to the actuary, within +/− figures showing the ML to be more consistent in the ultimate predictions. At low development the ML performs very well, with significant out performance at the development ranges 0–3 years.
Errors for Machine Learning versus Actuary

6.2.12 The difference in performance at high development is relatively small with a plus or minus tolerance roughly equal to the error introduced in filtering for historical ultimates in the data selection for the backtest. The final diagonal for the actuary performs well, brought about again by the backtest filtering process, where we define the ultimate in the same way that an actuary would, adding bias towards the humans estimates.
6.2.13 We highlight that the ML generated results are completely automated, forming compelling opportunities for scalable and fast business-user analysis.
6.2.14 Figure 14 shows the ML average error performance, with win-lose-same frequency visualised along the bottom row. Figure 15 shows the actual average errors. The low development portion of the triangle is circled showing the larger errors from the actuary in deep red.
Machine Learning average errors

Actual selected average errors

Machine Learning average errors

Actual selected average errors

6.2.15 At low development the ML outperforms the actuary. Also note that the shaded standard deviation is higher for the actuary than ML suggesting that the ML deals better with the difficulty faced in predicting ultimates at low development.
6.2.16 Error method 2: Chasing the most recent actuarial ultimate. This method takes the actuary’s latest selected ultimate as the value to measure error against. This gives more data points to measure than error method 1; however, it is unknown if the actuaries ultimate is accurate or not.
Errors for Machine Learning v Actuary

6.2.17 The results are similar to error method 1 where overall the ML error is similar to the actuaries’ error, however, it is better at lower development and worse in the middle development.
6.2.18 The same pattern emerges where the ML is better at lower development and not as good in the middle development. Note that this means that the ML predictions converge to the most recent actuarial estimate faster at lower development periods.
6.2.19 The above result is slightly counterintuitive. One suggestion, however, is that when the actuary models a single risk code at low development, they do not really factor in any data from other risk codes. However, the ML will make up for the lack of data by using data from all other risk codes. This increases accuracy and lowers standard deviation. This could also explain why the actuary is better in the middle of the development. The actuary is focused on that particular triangle, however, the ML is still trying to use information from all other classes. If the actuary more successfully predicts the result, it implies that in practice that particular triangle is more important than the ML is giving it credit for. This theory is still under investigation.
Key Observations
6.2.20 Given that with this initial POC on risk code data has demonstrated that ML methods are oughly in line overall with Actuaries in terms of predictive capability, it does not take a giant leap of imagination to see that within a few years, with more fine tuning and increased data sets, the ML methods will be able to at least produce a reliable first cut of estimates in the reserving process for certain classes of business or for attractional claims.
6.2.21 Especially in light of the fact that the real power of these ML algorithms will be brought to bear when they are fed individual risk and claim data where they will be able to highlight trends and spot correlations, calendar year effects, over/under reserving in ways that humans would never be able to do.
Implications for the Reserving Process
Implications of Machine learning to the reserving process
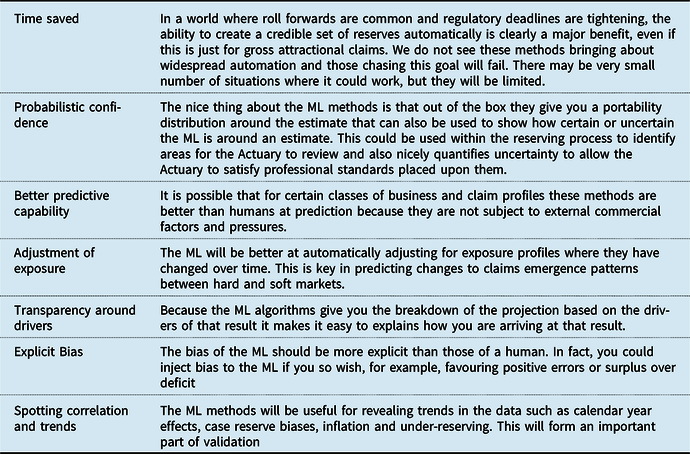
6.2.22 Within the reserving process, there are multiple uses possible:
-
Use as a validation tool
-
Replace actuarial estimates
-
Fully automated projections with Actuarial review
6.2.23 There is an obvious link to validation and in the first instance these methods will likely be compared to older methods in order to validate them or used as a validation tool for the old methods. Over time people will gain more comfort that these methods actually are more predictive in some circumstances than allowing humans to make judgements.
6.2.24 It will not be possible to carry out fully automated or unsupervised reserving for the vast majority of classes of business due to the complexity of the reserving problem and the inadequate data that actuaries are using to carry out their reserving processes.
6.2.25 Instead, the real value from these ML methods will be in aiding the actuary to be more predictive. It will be a combination of machine supervised by human which will succeed in this space. This will mean that understanding these methods will be a must within reserving teams. Moreover, regulators and auditors will need solid explanation of how the algorithms are making decisions.
6.2.26 Note that these methods favour bigger carriers with larger data sets rather than small. This provides large insurers with another advantage relative to smaller insurers – when arguably solvency 2 has already created an advantage for larger carriers through economies of scale (including but not limited to diversification benefits).
Uncertainties
6.2.27 The risk code projections used are not fully signed off reserves as would be the case for a company’s reserves and as such less time and effort has gone into the estimates in terms of review and sense checks which may adversely impact the accuracy of the Actuarial estimates.
Next Steps
6.2.28 Ideally, we would like to compare to a larger sample of Actuarial estimates. If you or your company have a similar database of risk code projections that you would be willing to volunteer and you do not believe is sensitive or contains any intellectual property, then please get in touch. Clearly as time passes, we can also add to the analysis in terms of underwriting years.
6.2.29 A deeper analysis of errors is required looking at distribution of errors and outliers. Currently, the averages we are using could be skewed by a limited number of risk codes.
6.2.30 There are already people doing active portfolio management and clearly they are already a step ahead. For them such technologies will serve to improve their analysis both in terms of accuracy and frequency. Arguably, those not using these techniques will find it hard to eke out margin in a more and more efficient market in terms of pricing. This is discussed further in the next section.
Automated Data Extraction from Insurance Contracts
6.2.31 There are currently multiple providers of a service that uses ML to automatically read a slip/insurance contract and to populate the data from that contract into an underwriting system or similar database. In fact some providers are providing an out of the box data quality assessment of that data. This should achieve the goal of putting data quality at the forefront of underwriters minds.
6.2.32 These offerings are gaining traction and as the algorithms suck in more and more clients their accuracy will improve. This will lead to two things in particular:
-
More accurate and consistent exposure data
-
More granular, accurate and consistent segmentation labelling of risks
6.2.33 The above two are requirements for modern data-driven portfolio management. We are strong believers and in fact it has been demonstrated that there is a correlation between a carrier’s ability to segment their portfolio for analysis and their performance against peers.
6.2.34 The benefits of this technology for the Actuary are huge in terms of data quality, however, there are issues that will be faced in the implementation of such technology. Primarily:
-
The politics around shrinking operational divisions devoted to data entry.
-
In many cases, the Chief Actuary does not hold ultimate responsibility for the data processing.
-
The same technology will/is being used to supplement reserving information with data from claim files.
Implications for the Reserving Actuary
6.2.35 Not only will this be good news for the reserving actuary in terms of the data available, but the combination of the ML applied to reserving and the better segmentation of available data will mean that the reserving actuary can regularly produce credible predictions at lower levels of granularity. This is precisely what is needed for active data-driven portfolio management and as such the reserving actuary will become more heavily involved in this task.
6.2.36 As discussed, before they will need to fully understand how the ML algorithms are working so as to identify issues/biases and adjust assumptions when things are not working properly. They will need to explain how the algorithms have reached their conclusions and share any insight derived from the model drivers.
6.2.37 Further they will need to be more conformable giving predictions of what will happen and think more like an underwriter in this part of their role. Making calls on what the future holds and not hiding behind language of uncertainty as the Actuarial profession seems to have moved towards in the last 15 years.
6.2.38 They will also need to be operationally astute or reserving departments will need to have a team member who has this mind-set in order to set up efficient processes that can be updated frequently.
6.3. What about Data How Does Data Affect Reserve Validation Conceptually and in Detail
6.3.1 As shown in section 6.2, reserving is entering a new era as machine learning techniques are gaining ground as an artificial intelligence reserving framework to set reserves or to serve as a validation tool of the reserves set by a human actuary. However, setting or validating best estimate reserves has a much wider implication than merely checking the calculation of the reserves.
6.3.2 Upstream of any reserving exercise is the quality of the data. Hence, any reserving calculation or validation must also include the validation of the claims and premium data at aggregate level but also at policy level. Validating the data for reserving purpose can have many dimensions including homogeneity, accuracy, completeness, timeliness, consistency, reasonableness, etc. at various levels of granularity.
6.3.3 The process of validating data should include:
-
Data Cleansing – Removing nonsense data points from the data. Algorithms can be defined to do this automatically as a first line check.
-
Consistency Checks – The introduction of IFRS17 has made it even more important for consistent data to be used between Actuarial and Finance areas as any inconsistencies in data will directly impact the financial accounts and the auditing of these accounts. Many insurers have used this as an opportunity to evaluate their data systems and implement transformation programmes in order to ensure consistent data going forward. The topic of data with respect to IFRS17 is covered in section 4.1.
-
Accuracy Checks – More sophisticated methods using machine learning and data profiling tools could be introduced in order to analyse the data format, identify any patterns in the data, compile any data value distributions and use this to highlight any potential anomalies with the data set. In addition, dashboards and KPIs can be configured in order to monitor and track data accuracy over time. This allows providers and receivers of the data to quickly view any anomalies.
-
Completeness Checks – Ensuring complete data are not simple. It is difficult to configure automated checks to highlight if data is incomplete. Often it is left to the responsibility of the process performer (such as the actuary) to ensure that they have included all classes of business in their analysis or taken the correct cut of the data. Strict workflow deadlines are one way to mitigate some of these risks.
-
Governance – Having a formal data governance process and sign-off before the data are fed further downstream into the reserving process
-
Identifying Gaps – As well as ensuring that currently available data are fit for purpose, processes or projects should be considered which aim to identify known data gaps. By increasing the amount of quality data items that are at the user’s disposal, downstream assumptions and allocations can be minimised which are subjective and prone to variation period on period.
7. Conclusion and Next Steps
7.1.1 The reserving and reserve validation landscape is constantly undergoing changes and pressures from multiple sources. This has been the experience of the authors of this paper over the past 5–10 years. Methods and processes currently applied in reserve validation need to be adapted and upgraded to respond to these in an ever more dynamic manner. Clearly, the strength and resilience of validation within reserving processes needs to be firmly embedded – the experience of the COVID-19 pandemic reveals that embedded validation is often not up to scratch during a major macro level event such as COVID. Artificial intelligence (AI) and machine learning are potential solutions to improve to scope and reach of embedded validation if the quality and lineage of data can be improved for those many businesses which struggle with data. The example sighted in this paper from the London market is built on a relatively rare example of a good data (available from the central market).
7.1.2 Some future changes have been known about in advance and can therefore be planned for – e.g., IFRS17 will need validation methods to be updated to meet new requirements (section 4). Other changes have been unexpected, for example, the COVID 19 pandemic and government response to this could not have been predicted and in many areas has altered trends in data used for validation.
7.1.3 On the plus side, actuaries have more sophisticated and powerful tools in data analysis and machine learning to help meet at least some of these challenges. In particular, machine learning should bring a step change in the analysis of data and trends far greater than would have been possible by human processing power. If these new tools are applied well, they should help actuaries meet the changes. But knowing how and when to use the tools may be the real challenge. As many found out in 2020, algorithms and other automated predictions can have their limitations. What is clear, however, is that a tight reserve validation framework is not an optional extra or an after the event thought or construct. It needs to be a clear embedded and structured part of a modern company’s reserving framework. Otherwise, boards, regulators and practitioners alike lose confidence in the validation of reserves regardless of whether they are subsequently proven right by development. This leads to our conclusion (which is also the title of this paper) which is that reserves may well be right but may not be valid (as a best estimate).
Disclaimer:
The views expressed in this publication are those of invited contributors and not necessarily those of the Institute and Faculty of Actuaries. The Institute and Faculty of Actuaries do not endorse any of the views stated, nor any claims or representations made in this publication and accept no responsibility or liability to any person for loss or damage suffered as a consequence of their placing reliance upon any view, claim or representation made in this publication. The information and expressions of opinion contained in this publication are not intended to be a comprehensive study, nor to provide actuarial advice or advice of any nature and should not be treated as a substitute for specific advice concerning individual situations. On no account may any part of this publication be reproduced without the written permission of the Institute and Faculty of Actuaries.
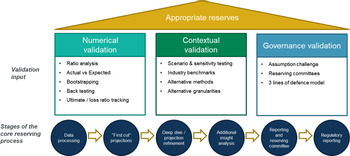


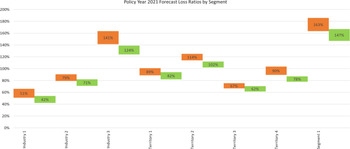


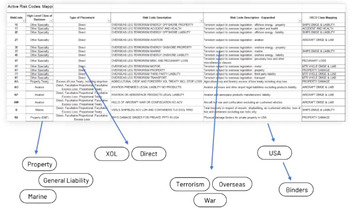
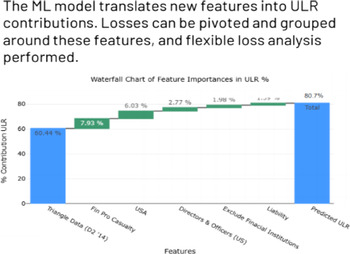

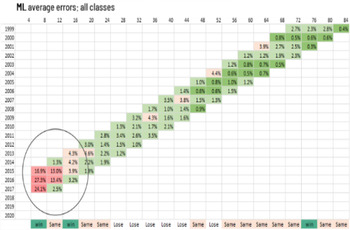
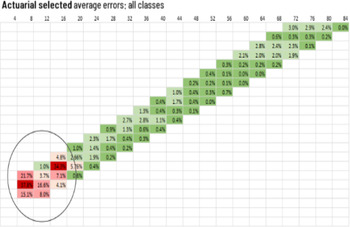

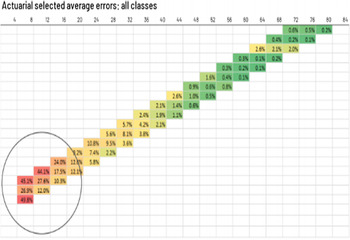

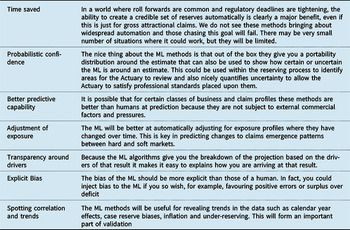

 Open access