
1.1 Introduction
Craters were first discovered on the Moon by Galileo in 1610, but he only described these features as “circular spots.” In 1791, the astronomer J. H. Schröter first used the term “crater” to describe lunar craters. Because little was known about the physics of impact crater formation, at that time most astronomers believed these features to be extinct volcanoes. Even at the dawn of the Space Age, some scientists believed that lunar craters were volcanic in origin (cf., Ronca, Reference Ronca1966; Wells and Fielder, Reference Wells and Fielder1967; Green, Reference Green1971) because almost all the morphological features in and around the craters appeared to agree with a volcanic origin. Initial clues favoring an impact origin had been obtained a few years earlier with the identification of shock metamorphic features in rocks found at Meteor crater in Arizona, USA (Shoemaker, Reference Shoemaker, Middlehurst and Kuiper1963). Acceptance of the idea that craters resulted from the collision of large pieces of debris from space with a planetary surface was reached only after high-resolution images and in situ investigation by the Apollo astronauts in the late 1960s and early 1970s. Hyper-velocity impact experiments (Gault et al., Reference Gault, French and Short1968), the analysis of nuclear and chemical explosions (Roddy, Reference Roddy, Roddy, Pepin and Merrill1977), and field studies of impact craters (Shoemaker, Reference Shoemaker, Middlehurst and Kuiper1963) provided valuable additional insights into the physics of impact events.
In this chapter, we introduce the mode of formation of craters on planetary surfaces to set the stage for comparisons of crater morphology throughout the Solar System (Chapter 2) and on Mars specifically (Chapters 4 to 8). We will see that there are some common features of craters across the Solar System and some significant differences in their morphology that are influenced by the material within which the crater formed as well as the presence/absence of an atmosphere and the gravity of the body. Mars also has some unusual properties that are climate-related, with the distribution of ice in the near-surface layers varying across the planet as a function of time and location, and these properties are introduced in Chapter 3. The book concludes in Chapter 9 with a discussion of some of the issues pertaining to Martian crater morphology that remain unresolved, as well as some suggestions for how further advances in our knowledge might be achieved.
Impact craters are the only planetary landform for which the final shape can be predicted from basic physics, and so the diversity of morphologies and geometries provide information about the target and the post-impact evolution of the crater. A few craters, such as Meteor crater in Arizona, have been extensively studied via drilling (Roddy et al., Reference Roddy1975) or ground-penetrating radar (Pilon et al., Reference Pilon1991) to better understand the three-dimensional structure of craters. Some excellent texts have documented the different stages of formation of hypervelocity impact craters, to which the reader is referred for a more detailed explanation. For example, Melosh (Reference Melosh1982, Reference Melosh1989, Reference Melosh2011) provided a comprehensive review of the physics of impact and explosion cratering. More recently, Osinski and Pierazzo (Reference Osinski and Pierazzo2013) included in their book some comparisons of lunar and Martian craters to terrestrial examples such as Lonar crater in India and Meteor crater, as well as considered the geological effects associated with impact cratering on Earth. The 24 km diameter Nordlinger Ries crater in Germany has also been investigated as a terrestrial analog to Martian craters, aided by the relatively young age (~14.8 Ma) of the crater that allows parts of the ejecta blanket to be investigated in the field (Hörz and Banholzer, Reference Hörz, Banholzer, Papike and Merrill1980; Sturm et al., Reference Sturm2013, Reference Sturm2015).
The physical processes by which an impact crater formed on a planetary surface can be investigated with laboratory experiments, field observations of high-energy (i.e., nuclear) tests, and from numerical simulations. In this chapter, we are planetary agnostics; the basic process of a projectile hitting a planetary surface, the excavation and relaxation of the crater cavity, and the emplacement of the ejecta are similar whether the target is the Moon, Venus, Mercury, Mars, or one of the moons of the outer Solar System planets. True, the details of the amount of energy partitioned into the excavation of the crater and the resultant ejecta will be different depending on such attributes as the velocity at which the projectile hits (which in part is determined by the gravity of the impacted body), the composition of the projectile (for example, an iron or a carbonaceous meteorite), and even the angle at which the projectile hits the surface, but the basic physics as described here will be the same.
When a projectile strikes the surface of a planet or moon at high velocity (typically many kilometers per second), an orderly sequence of events is initiated that produces a crater. Although this is a continuous process, to aid in the interpretation of impact craters presented in subsequent chapters, it helps to describe the overall process by focusing on distinct stages, each dominated by different physical processes (Gault et al., Reference Gault, French and Short1968; Melosh, Reference Melosh1989): contact/compression, excavation, and modification. The excavation of the crater cavity produces a copious volume of material that is then thrown onto the surrounding terrain or, particularly on bodies with a low gravity, thrown off the body to escape into space. The processes associated with ejecta emplacement can be predicted from numerical simulations (e.g., Oberbeck and Morrison, Reference Oberbeck and Morrison1973; Oberbeck, Reference Oberbeck1975; Oberbeck et al., Reference Oberbeck1975), and these can serve as a basis for the analysis of ejecta blankets on airless worlds such as the Moon. In turn, as subsequent chapters focus on Martian ejecta deposits, the differences between ejecta on Mars and the Moon (or Mercury) can be identified.
1.2 Contact and Compression
At the beginning of the process of forming an impact crater, when the projectile first touches the target, the contact and compression stage typically lasts only briefly; a few times longer than the time required for the impacting projectile to traverse its own diameter into the surface of the target. The incoming projectile can encounter the surface at a speed as high as 70 km/sec, but commonly the velocity is dependent on the gravity of the planet, which causes the projectile to strike Mars with a “modal impact velocity” of ~12 km/sec. For the Moon, the modal impact velocity is typically ~20 km/s due to proximity to Earth. For Mercury, modal impact velocity is ~42.5 km/s because the planet is close to the Sun.
At first contact, a system of shock waves forms that provides the mechanism for transferring the kinetic energy of the impacting projectile into the target. During this stage, the projectile plunges into the target generating a strong shock wave as material in both the projectile and target are compressed. This slows the projectile and compresses it, as well as compressing and accelerating the target material downward. The shock wave in the object eventually reaches the projectile’s trailing edge releasing the pressure as the surface of the compressed projectile expands upward. A wave of pressure relief, a “rarefaction wave,” propagates back toward the interface between the object and the target. During decompression of the projectile, heat deposited during the irreversible compression process may cause the projectile to change phases to either liquid or vapor. The projectile generally penetrates the target less than its diameter below the original surface before it is destroyed as the decompression wave rips it apart. The projectile typically retains about half of the total initial energy if the compressibility and density of the target and projectile are similar. The balance of energy moves into the target where it eventually is expended in opening the crater and heating the target.
The contact and compression stage is generally accompanied by high-velocity jets of highly shocked material that form where strongly compressed material is close to the free surface. These jets may exceed the impact velocity by a factor greater than five. In vertical impacts, these jets account for less than 10% of the projectile’s mass, but jetting can be much more important in oblique impacts.
1.3 Excavation
Following the contact and compression stage, the excavation stage begins with expansion of the shock wave. The basic shock wave geometry approximates a hemispherical shell of compressed material, expanding radially and distributing the kinetic energy over a steadily increasing mass of the target material. As a result, the shock pressure and energy drop as the shock wave spreads outward through the target. This shock wave eventually weakens into an elastic wave, while the crater itself is opened by the much slower excavation flow.
Target material engulfed by the shock wave is quickly released as the shock passes but still has a residual velocity of ~20% of the particle velocity in the shock wave. The residual velocity is caused by thermodynamic irreversibility in the shock compression of the target and eventually excavates the crater. This velocity field has a characteristic downward-outward-then-upward pattern that excavates and ejects target material from the crater cavity. Lines of flow (“streamlines”) of target material coming out of the growing crater cut across the contours of maximum shock pressure. As a result, material ejected at any one time may contain material with a wide range of shock levels, although early in ejection process the fast ejecta contains a higher proportion of highly shocked material than the later slower ejecta. In addition, the mixture of vaporized projectile and target may expand rapidly out of the growing crater, forming a vapor plume. If massive enough, this plume may blow aside the surrounding atmosphere during ejecta emplacement or even play a role in impact erosion of the entire atmosphere (Walker, Reference Walker1986; Kegerreis et al., Reference Kegerreis2020).
Near the free surface, the expanding shock wave encounters a special condition that causes the pressure at the surface to be always zero. This is because stress cannot be transferred across a free surface and hence drops to zero at that surface (e.g., faults cannot extend from the ground into the air). In impact events, this results in a thin layer of rock at the surface comprising only about 1% to 3% of the total ejected mass being ejected at very high velocity, sometimes nearly as high as the impact velocity. Because the surface rocks are not compressed to high pressure, small quantities of unshocked ejected rock may exceed the escape velocity of the planet. In the case of impact events on Mars, this material can have particular importance because some ejecta can find their way to Earth to be collected as meteorites. The Shergottite, Nakhlite, and Chassignite (SNC) meteorites (Treiman et al., Reference Treiman2000; McSween, Reference McSween2002), of which at least 262 have been identified from at least 11 ejection events (Udry et al., Reference Udry2020), are examples of this type of material.
The shape of the growing crater is at first hemispherical, with the depth and diameter growing at nearly the same rate. But soon the cavity stops increasing in depth, while the diameter continues to increase to form a shallow bowl-shaped depression with a diameter about three to four times its depth. This is called the “transient” crater. Material deeper than about one third of the transient crater depth is pushed downward into the target. Deformation of the surrounding rock accommodates the volume of this material. Material lying above this depth in the transient crater is ejected ballistically from beyond the transient cavity rim to form the continuous ejecta blanket (Oberbeck, Reference Oberbeck1975), thereby forming one of the most studied aspects of impact craters on Mars (see Chapters 6, 7, and 8). Ejecta blankets can be divided into continuous deposits close to the crater rim and discontinuous deposits at greater radial range. Secondary craters, formed by individual blocks of ejecta re-impacting the target to produce new small craters, populate most of the discontinuous ejecta blanket.
1.4 Modification
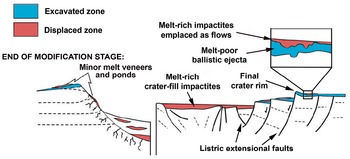
The modification stage of the cratering process starts shortly after excavation has opened the transient crater and the ejecta have been launched into ballistic trajectories (Melosh and Ivanov, Reference Melosh and Ivanov1999). The shapes of craters are modified by different processes. Some involve the direct effects of impact cratering at the end of the transient crater formation, while others such as gradation, infilling by lava or sediment, and isostatic adjustment processes operating over a longer timescale to modify the shapes of the craters (Craddock et al., Reference Craddock2018). Crater cavity modification lasts for about the same amount of time as the excavation phase. Major changes in motion occur both beneath and within the crater, as debris begins to move downward and back toward the center of the crater. This collapse is driven by gravity, although elastic rebound of the compressed, underlying rock may also play a role. The effects of this collapse are dependent on the size of the crater (Figure 1.1). In small craters (“simple craters”), this generally entails the collapse of the steep rim slopes inside the crater onto its floor and uplifted strata within the crater rim. This results in a shallow bowl-shaped depression, a “simple craters,” whose diameter is about five times its depth. In larger craters (“complex craters”), collapse causes the floors to rise and the formation of central peaks or peak rings, central pits, and stepped terraces. Collectively, these processes result in the formation of shallow, broad, relatively low-relief depressions (Figure 1.1). Melt-rich crater-fill material may occur at various places within the crater, as ponds of material collect in local topographic depressions that are controlled by terrace blocks forming along listric faults (Figure 1.2). For transient crater depths of 1–10 km (i.e., final crater diameter in the range 10–100 km), the gravity collapse time is 10–30 seconds (Melosh and Ivanov, Reference Melosh and Ivanov1999).
Typical cross-sections of simple (A) and complex (B) craters. “D” represents the final crater diameter which is defined as the diameter of the topographic rim that rises above the surface for simple craters or above the outermost slump block not covered by ejecta for a complex crater. Note that the crater-fill within the complex crater occurs not only around the central uplift but also on top of some of the terrace blocks that formed along the listric extensional faults.
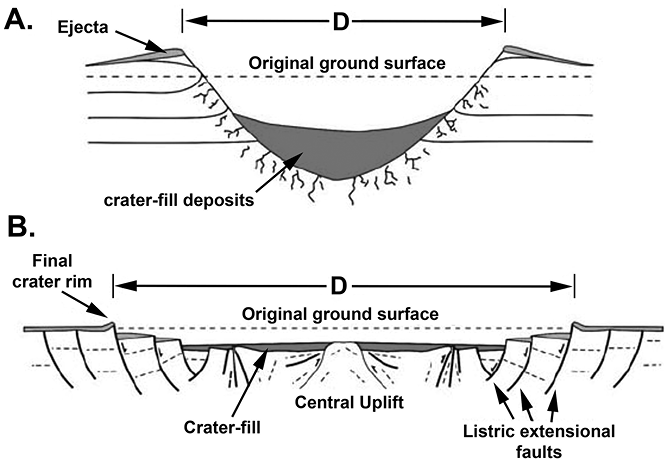
Figure 1.1 Long description
Diagram showing cross-sections of simple (A) and complex (B) craters. Section A depicts ejecta, crater-fill deposits, and the final crater diameter (D) defined by the topographic rim above the original ground surface. Section B illustrates a complex crater with a central uplift, crater-fill, final crater rim, and listric extensional faults, all within the diameter (D).
Representations of the final cross-section of simple craters (left) and complex craters (right), illustrating the relative positions of displaced and excavated materials.

Figure 1.2 Long description
Diagram final cross-sections of simple and complex craters. The left section illustrates a simple crater with an excavated zone in blue and a displaced zone in red. The right section depicts a complex crater with similar zones and additional features such as melt-rich impactites emplaced as flows, melt-poor ballistic ejecta, and a final crater rim. Labels indicate minor melt veneers, melt-rich crater-fill impactites, and listric extensional faults.
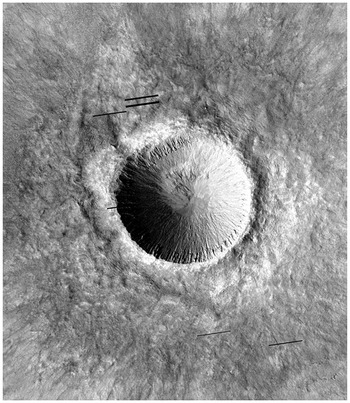
Simple craters on Mars (Figure 1.3) are generally less than about 8 km diameter but can be larger on the Moon due to the lower gravity (Pike, Reference Pike and Merrill1980a; Boyce and Garbeil, Reference Boyce and Garbeil2007; Robbins and Hynek, Reference Robbins and Hynek2012). When fresh, these craters possess an uplifted rim and are filled with an allochthonous breccia lens that comprises largely unshocked target materials, possibly mixed with impact melt-bearing lithologies (Shoemaker, Reference Shoemaker, Middlehurst and Kuiper1963). The overall low shock level of material in the breccia lens suggests that it is formed due to slumping of the transient cavity walls and is not “fallback” material (Grieve and Cintala, Reference Grieve and Cintala1981). Volume conservation suggests that the transient crater diameter of the crater is increased by ~15% from this collapse.
A fine example of a fresh simple crater on Mars located at 51.60°N, 333.02°E. This crater is ~1.2 km in diameter. The thin black lines on the ejecta blanket are data dropouts. HiRISE image ESP_027866_2320.

Figure 1.3 Long description
Aerial view of a fresh simple crater on Mars, approximately 1.2 kilometers in diameter, located at 51.60 degrees N, 333.02 degrees E. The crater features distinct ejecta blankets with visible thin black lines indicating data dropouts.
Complex craters display a much wider variety of interior features. These tend to transition to different types as a function of crater size and target material. Central peaks (Figure 1.4) result from the uplift of the floor after the passage of the shock wave, with the uplifted material “freezing” in place to form a central peak. A result of complex crater formation is that material from depth is brought to the surface. Thus, the materials identified within the central peak of a crater may well be different from the composition of the surrounding terrain or the material exposed on the crater rim. Central peaks are, therefore, probes into the subsurface geology of a planet (Pieters, Reference Pieters1982; Michalski and Niles, Reference Michalski and Niles2010; Caudill et al., Reference Caudill2012; Pan et al., Reference Pan2015). For craters the size of Manicouagan (100 km) on Earth or Copernicus (92 km) on the Moon, the distribution and expected cooling rate of impact melt on the crater floor have allowed the time for central peak formation to be estimated to be ~100 seconds (Melosh and Ivanov, Reference Melosh and Ivanov1999).
The lunar crater Moretus (70.63°S, 354.05°E) displays a fine example of a central peak. The crater is ~114 km in diameter. Illumination is from the left. LROC WAC mosaic.
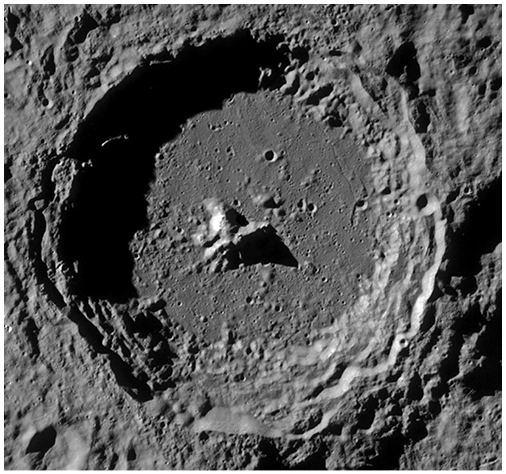
Figure 1.4 Long description
Lunar crater Moretus, approximately 114 km in diameter, features a prominent central peak. The crater is located at 70.63 degrees S, 354.05 degrees E on the Moon’s surface. The image is illuminated from the left, showcasing the craters detailed topography. NASA/GSFC/Arizona State University mosaic.
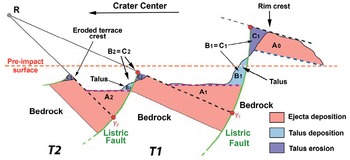
The walls of the complex craters experience greater collapse than that seen in simple craters. These walls typically exceed the angle of repose in the transient cavity, so that large-scale slumping may occur immediately after the excavation stage to produce terrace blocks (Figure 1.5). Slumping occurs in complex craters along discrete faults, forming terraces whose widths are controlled by strength of the rock and the stresses as the floor rises (Melosh, Reference Melosh2011). Structural uplift of the rim crest is also a permanent feature of the cratering process. For Martian craters, Sturm et al. (Reference Sturm2016) documented this phenomenon for 10 complex craters in the diameter range 8.2–53.0 km and found that the mean structural uplift at the final crater rim comprises ~80% of the total rim elevation, implying that the thickness of the ejecta on the rim is ~20% of the total (Figure 1.6). A similar amount of rim uplift was also reported by Sharpton (Reference Sharpton2014) for lunar craters.
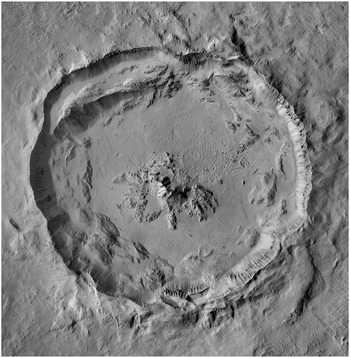
Tooting crater on Mars (23.21°N, 207.76°E) displays multiple terrace blocks on the inner western walls of the crater, as well as a very large central peak. Tooting crater is 28.0 km in diameter. CTX image P01_001538_2035.

Figure 1.5 Long description
Aerial view of Tooting crater on Mars, featuring multiple terrace blocks on the inner western walls and a prominent central peak. The crater is 28.0 km in diameter.
Illustration of how terrace blocks (T1 and T2) may form along listric faults and then may be eroded in a complex crater. Talus eroded from exposed blocks were rotated along these faults (C1 and C2), and then redeposited at the base of the blocks (B1 and B2). This diagram illustrates that one might find ejecta deposits (impact breccia and impact melt) at multiple places within the interiors of complex craters.

Figure 1.6 Long description
Geological diagram illustrating terrace blocks (T1 and T2) forming along listric faults in a complex crater. Depicts talus eroded from blocks (C1, C2) rotating along faults and redeposited at the base (B1, B2). Shows ejecta deposits, including impact breccia and impact melt, within the crater interior.
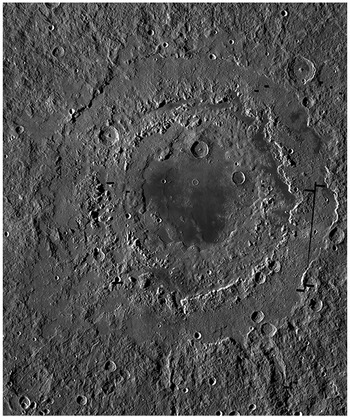
The largest “craters” in the Solar System are known as multi-ringed basins, of which Orientale Basin (Figure 1.7) is one of the best-defined basins on the Moon (Head, Reference Head1974). Baker et al. (Reference Baker2011) gave a fine summary of the progression of morphologies with increasing crater diameter (Figure 1.8).
Orientale Basin is the youngest of the large lunar basins (19.56°S, 266.25°E). The distinct outer ring is about 930 km in diameter from east to west. The black lines on the eastern and western rims are due to data dropouts. LROC WAC mosaic.

Figure 1.7 Long description
Lunar basin image the Orientale Basin, the youngest large lunar basin, located at 19.56 degrees S, 266.25 degrees E. The basin features a distinct outer ring approximately 930 km in diameter from east to west. Black lines on the eastern and western rims indicate data dropouts. The image is a LROC WAC mosaic from NASA/GSFC/Arizona State University.
The complexity of fresh craters as a function of diameter. Simple craters exhibit smooth, featureless interiors (simple) to minor wall slumping (modified simple). Complex craters exhibit large slump deposits and rudimentary terracing with small central peaks (immature complex) to strong terracing and single central peaks to clusters of central peak elements (mature complex). The onset of basin morphologies occurs with a ringed arrangement of peak elements (ringed peak cluster) or the presence of both a small central peak and peak ring (proto-basin). Peak-ring basins have large, prominent peak rings with no central peaks. Multi-ring basins (not shown here) exhibit three or more rings and commonly an inner depression.
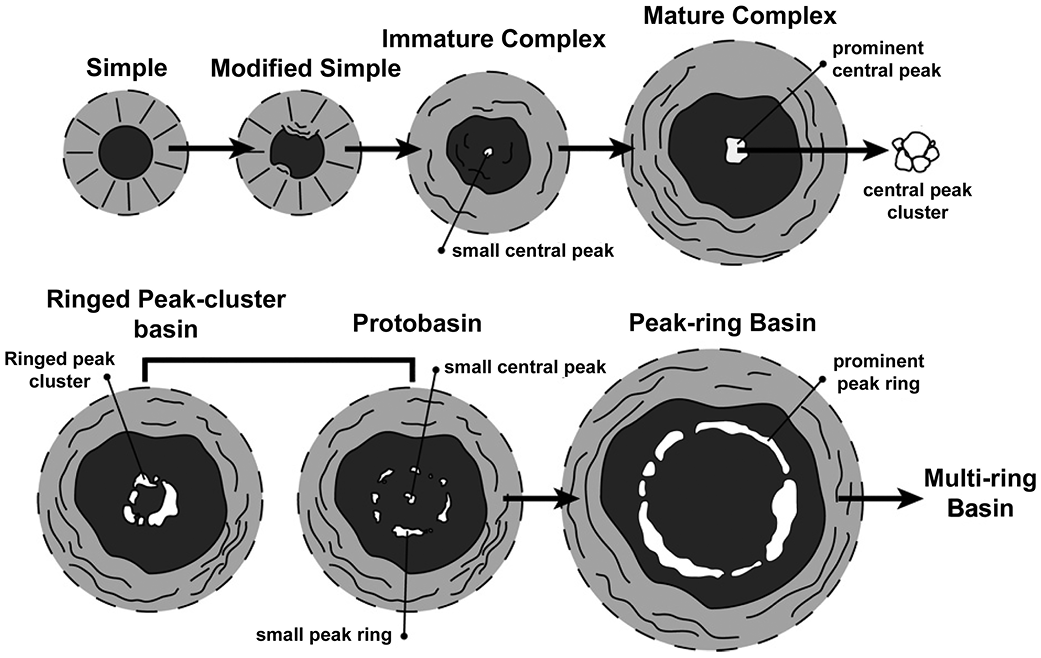
Figure 1.8 Long description
Chart displays crater complexity by diameter. Simple to modified simple craters have smooth to sloped interiors. Immature complex craters feature large slump deposits and basic terracing with small central peaks. Mature complex craters show strong terracing and single or clustered central peaks. Ringed peak-cluster basins have a ringed peak arrangement. Proto-basins have small central peaks and peak rings. Peak-ring basins have prominent peak rings without central peaks. Multi-ring basins, not shown, have three or more rings and an inner depression.
1.5 Ejecta Emplacement
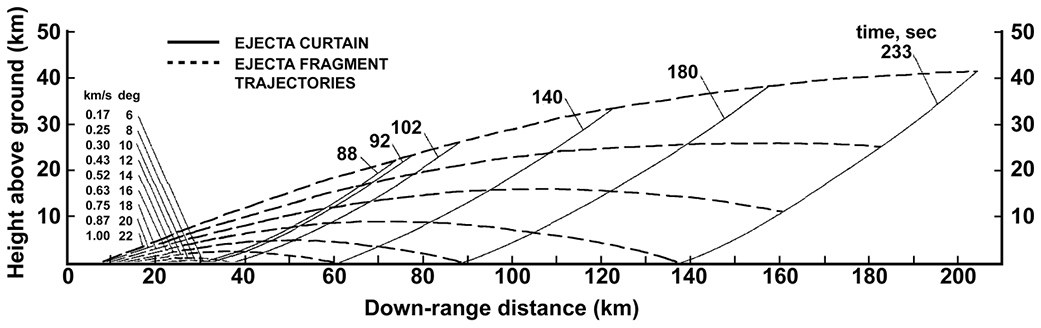
The ejecta blankets of Martian craters are some of the most diverse and, potentially, most informative about the characteristics of the target material (Head and Roth, Reference Head and Roth1976; Carr et al., Reference Carr1977; and many others). This is particularly true when impacts into targets containing volatiles are concerned (Gault and Greeley, Reference Gault and Greeley1978). The major types of ejecta blanket on Mars will be discussed in detail in Chapter 6. Absent of atmospheric effects, ejecta from any impact crater are thrown from the crater cavity in ballistic trajectories (Oberbeck, Reference Oberbeck1975; Oberbeck et al., Reference Oberbeck1975). Ejecta from close to the point of impact are ejected at the highest velocities and highest angles relative to the impacted surface (Figure 1.9). Ejected material will first hit the surrounding surface near the crater rim and then at progressively greater ranges. Importantly for the analysis of the layered ejecta surrounding craters on Mars, the re-impacting ejecta land at progressively higher velocities with increasing range due to their point of origin within the crater cavity. Some of the characteristic flow features associated with fluidized ejecta, such as the distal ramparts (see Section 6.6), may be a consequence of this velocity field (Boyce and Mouginis-Mark, Reference Boyce and Mouginis-Mark2025).
Calculated trajectories (dashed lines) and positions of ejecta at a given constant time (solid lines) after the impact of the body that produced the 92 km diameter Copernicus crater on the Moon. Note that the ejection angles vary from 22° close to the point of impact to 6° further from the impact. Over this range of angles, ejecta leave the cavity at speeds of 1.0 to 0.17 km/sec and will re-impact the surface at these speeds. Due to the higher surface gravity, flight times and down-range distances will be smaller on Mars for a comparable energy impact.

Figure 1.9 Long description
Graph trajectories and positions of ejecta from the impact that formed the 92 km Copernicus crater on the Moon. Dashed lines represent calculated trajectories, while solid lines indicate ejecta positions at constant time intervals. Ejection angles vary from 22° near the impact point to 6° further away. Ejecta speeds range from 1.0 to 0.17 km/sec.
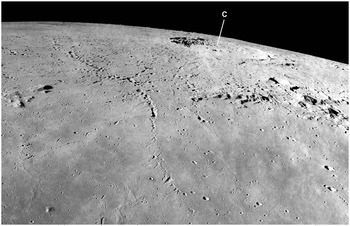
As the crater size increases, the velocity at which ejecta re-impact the surface will be sufficiently high that the surrounding surface is excavated by secondary cratering. Material from these “secondary craters” will mix with the primary ejecta. Where individual ejecta blocks land sufficiently close to each other, they form a “herringbone” or dune-shaped pattern. The ejecta from the lunar crater Copernicus (Figure 1.10) provide fine examples of such secondary craters (Guest and Murray, Reference Guest and Murray1971). Copernicus crater is estimated to be ~800 Ma old (Eberhardt et al., Reference Eberhardt1973), so that the slow rate of erosion on the Moon allows the analysis of these fine-scale features (Pieters et al., Reference Pieters1985).
Ejecta northeast of Copernicus crater on the Moon (9.61°N, 339.92°E) clearly illustrate the role of secondary impact cratering and the formation of crater chains with the associated “V-shaped” deposits between individual craters. Copernicus crater (92 km in diameter) is near the horizon just right of the center in this image (“C”). In this view, the closest pit chain to the crater is ~170 km from the rim of Copernicus, and the secondary craters at the bottom of the image are ~243 km from the rim. The mounds at right and far left are topographic features that predate Copernicus crater.

Figure 1.10 Long description
Lunar surface image ejecta northeast of Copernicus crater. The crater, marked C near the horizon, is 92 km in diameter. Secondary impact craters and V-shaped deposits are visible, illustrating secondary impact cratering and crater chain formation. Mounds predate Copernicus crater.
During the ballistic emplacement of the ejecta, a considerable amount of the original surface is excavated (Oberbeck, Reference Oberbeck1975). Large fragments of the ejecta in low-angle-low-velocity trajectories are the first to impact the surface close to the crater rim. With increasing velocity, particles from closer to the point of impact attain a greater range from the still-forming primary crater and hit the surface at higher angles. Collectively, the ejecta sweeps up additional material from the pre-existing terrain such that the ejecta blanket contains more locally derived material with a greater radial distance from the impact site. The physical properties of the radial flow of the mixed primary and secondary material behind the ejecta curtain also change with radial distance from large relatively slow-moving particles close to the rim to finer particles moving more quickly.
In the case of the Moon, approximately half the volume of ejecta falls within one crater radius of the rim (McGetchin et al., Reference McGetchin1973; Settle and Head, Reference Settle and Head1977). The ejecta blanket becomes thinner with radial distance and becomes increasingly discontinuous. Over 90% of the debris excavated from the crater cavity falls within ~4 radii of the crater rim. In the case of Mars, the ejecta may incorporate volatiles (water or ice) from multiple levels of the stratigraphic column of the target. These volatiles may provide a level of fluidization that allows the ejecta to flow across the surface as a late-stage part of the ejecta emplacement process. Thus, ejecta blankets may well be the “Rosetta Stone” of Martian geology when it comes to investigating target conditions at the time of impact. As we investigate ejecta blanket morphology in later chapters, it must be recognized that some of the material originated from within the crater cavity and that other material is reworked material incorporated from the surrounding terrain. The influence of the atmosphere should also be considered (Schultz and Gault, Reference Schultz and Gault1979), as aerodynamic drag may restrict the range of fine particles.
1.6 Crater Geometry
As described earlier, crater diameter is a critical parameter in determining what the interior features might be within a fresh impact crater (Turtle et al., Reference Turtle2005). The measurement of the diameter and other dimensions of craters (Figure 1.11) has become an important way in which the global population of craters can be investigated as well as quantify the degree of degradation of crater shape. As is the case on the Moon and Mercury, it is well known that Mars displays a spectrum of morphologies that increase in complexity as diameter increases (Hartmann, Reference Hartmann1972; Cintala et al., Reference Cintala1976). Simple bowl-shaped craters are associated with the smallest craters. As diameter increases, the walls are sufficiently unstable so that they start to collapse, forming “terraces” on the walls that partially infill the crater floor, making the crater shallower. The simple-to-complex transition for Mars craters occurs at diameters between ~8 and ~11 km (Garvin and Frawley Reference Garvin and Frawley1998; Robbins and Hynek, Reference Robbins and Hynek2012). Central peaks and central pits both occur at larger crater diameters beyond this transition.
Idealized cross-section for an impact crater on Mars, showing the attributes of the cavity that are most often used in the geometric analysis of the crater.
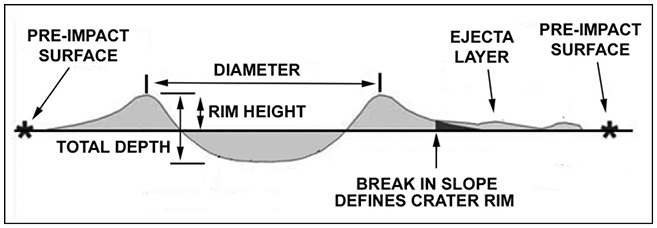
Figure 1.11 Long description
Idealized cross-section diagram of a Mars impact crater, key attributes: pre-impact surface, diameter, rim height, total depth, ejecta layer, and break in slope defining the crater rim.
The geometry of these attributes (Figure 1.11) has been investigated for Mars for more than 40 years (e.g., Cintala and Mouginis-Mark, 1980; Pike, Reference Hörz, Banholzer, Papike and Merrill1980b; Garvin et al., Reference Garvin2000; Chappelow and Sharpton, Reference Chappelow and Sharpton2002; Boyce et al., Reference Boyce2005; Tornabene et al., Reference Tornabene2018a; Robbins et al., Reference Robbins2018a). The goal has often been focused on the search for the effects of subsurface volatiles (Mouginis-Mark and Hayashi, Reference Mouginis-Mark and Hayashi1993; Barlow and Perez, Reference Barlow and Perez2003) as well as target strength (Boyce et al., Reference Boyce2006; Stewart and Valiant, Reference Stewart and Valiant2006), or the geometric comparison of Martian craters with those on the Moon and Mercury (Malin and Dzurisin, Reference Malin and Dzurisin1977) to identify the effects of gravity or the atmosphere of Mars. Crater depth/diameter ratio (Figure 1.12) has been used most often (Daubar et al., Reference Daubar2014; Tornabene et al., Reference Tornabene2018a), but other geometric attributes, such as rim height versus diameter (Craddock et al., Reference Craddock1997; Watters et al., Reference Watters2015), central peak diameter versus crater diameter (Barlow et al., Reference Barlow2017), rim height versus depth (Figure 1.13; Watters et al., Reference Watters2015), and central peak height versus rim height (Bennett and Bell, Reference Bennett and Bell2016), have all been investigated. Other relationships have addressed different attributes of the ejecta blanket, such as the “ejecta mobility,” which is the maximum range of the ejecta from the crater rim (Mouginis-Mark, Reference Mouginis-Mark1978; Barlow et al., Reference Barlow2014), the ejecta run-out distance versus the crater rim height (Mouginis-Mark and Baloga, Reference Mouginis-Mark and Baloga2006), and the “lobateness” of the ejecta layers (Barlow, Reference Barlow1994; Baratoux et al., Reference Baratoux2002).
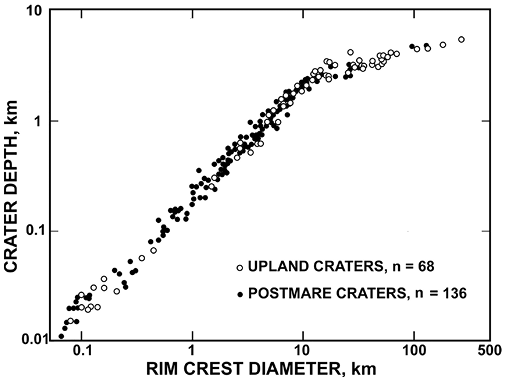
An example of a depth/diameter plot for fresh craters. This example is for 204 fresh lunar craters, compiled photogrammetrically from Apollo 15, 16, and 17 images. Note the transition from simple to complex craters at ~11 km in diameter. Reprinted from Pike (1974). “Depth/diameter relations of fresh lunar craters: Revisions from spacecraft data,” Geophysical Research Letters, vol. 1, pp. 726–740, Figure 1, with permission from John Wiley and Sons.

Figure 1.12 Long description
Graph illustrating crater depth versus rim crest diameter for lunar craters. The plot includes data for 204 fresh craters, compiled from Apollo 15, 16, and 17 images. It distinguishes between upland craters (68) and postmare craters (136). The graph highlights a transition from simple to complex craters at approximately 11 km diameter.
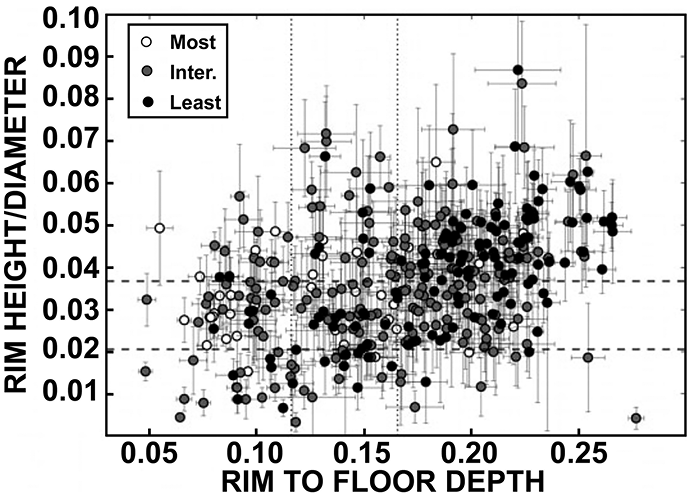
Diameter-normalized rim height (h/D) versus rim-to-floor depth (d/D) for a global distribution of Mars craters 25 m to 5 km diameter. White points represent the most modified craters, black points the least modified, and gray points the intermediate values. The purpose of this diagram is to investigate how the rims of craters degrade over time compared to the widening of the crater as erosion proceeds.

Figure 1.13 Long description
Scatter plot diameter-normalized rim height versus rim-to-floor depth for Mars craters. Data points are categorized by crater modification: white for most modified, black for least modified, and grey for intermediate values. The plot includes error bars and a legend indicating the categories.
Measuring crater diameter is relatively straightforward, although some changes as the crater is eroded have been noted (Chappelow and Sharpton, Reference Chappelow and Sharpton2002). But critical to the correct interpretation of any of these geometric relationships is the accurate measurement of height, be it the height of the rim crest above the crater floor, the height of the rim above the surrounding terrain, or the height of the distal rampart on the ejecta blanket. Over the decades, there have been many methods employed to measure heights with increasing levels of accuracy. For Mars, these have included Earth-based radar altimetry (Roth et al., Reference Roth1989), shadow length measurements using known lighting geometry (Cintala and Mouginis-Mark, Reference Cintala and Mouginis-Mark1980), photometry of the surface from single spacecraft images (Davis and Soderblom, Reference Davis and Soderblom1984), laser altimetry (Garvin and Frawley, Reference Garvin and Frawley1998; Garvin et al., Reference Garvin2000; Robbins and Hynek, Reference Robbins and Hynek2013), and measurement from digital elevation models derived from stereo images (Mouginis-Mark et al., Reference Mouginis-Mark2018). Robbins et al. (Reference Robbins2018a) provide a comprehensive summary of these different techniques.
Most often used today because of the global nature of the data set is the altimetry derived from the Mars Orbiter Laser Altimeter (MOLA) (Smith et al., Reference Smith2001). However, even this data set has limited spatial resolution at the kilometer scale (Figure 1.14). Particularly near the Equator, the cross-track (roughly east-west) spacing of the laser profiles may be a few kilometers, while along-track (approximately north-south) the 300 m-spacing of the individual laser shots means that the highest points on the rim, or the lowest points on the floor, may be missed. In a comparison between MOLA and High-Resolution Stereo Camera (HRSC) digital elevation models, Robbins and Hynek (Reference Robbins and Hynek2013) found that crater diameters determined from MOLA data are reliable for diameters >10 km. For craters smaller than 1 km, the shadow measurement technique of Chappelow and Sharpton (Reference Chappelow and Sharpton2002) is preferred for the determination of crater depths compared either to altimetric or stereo measurements, both of which have lower spatial resolution (Herrick, Reference Herrick2013).
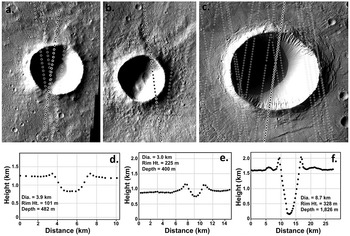
Examples of individual MOLA tracks across Mars craters of different diameters. Faint lines of dots indicate the locations of all the MOLA laser shots in the area, and black dots indicate where the data have been used for each profile. “Distance” is measured along the profile from the top of each image. (a) A 3.9 km diameter crater (15.21°N, 98.30°E) where four profiles cross the central part of the crater floor. THEMIS image V28627019. (b) A 4.1 km diameter crater (8.77°N, 181.34°E) where only one MOLA profile crosses the crater with the measurement falling on the inner wall rather than the crater floor. THEMIS image V53698016. (c) Multiple MOLA profiles cross this 9.3 km diameter crater (29.65°N, 116.55°E). THEMIS image V28876009. (d) to (f) show the corresponding topographic profiles across each crater.

Figure 1.14 Long description
Graphs MOLA tracks across Mars craters of varying diameters. Top row: Images of craters with faint lines of dots indicating laser shot locations and black dots marking data points. a) 3.9 km diameter crater with four profiles crossing the central floor. b) 4.1 km diameter crater with one profile crossing the inner wall. c) 9.3 km diameter crater with multiple profiles. Bottom row: Corresponding topographic profiles. d) Profile of 3.9 km crater height variations. e) Profile of 4.1 km crater with height measurements. f) Profile of 9.3 km crater displaying depth and height data.
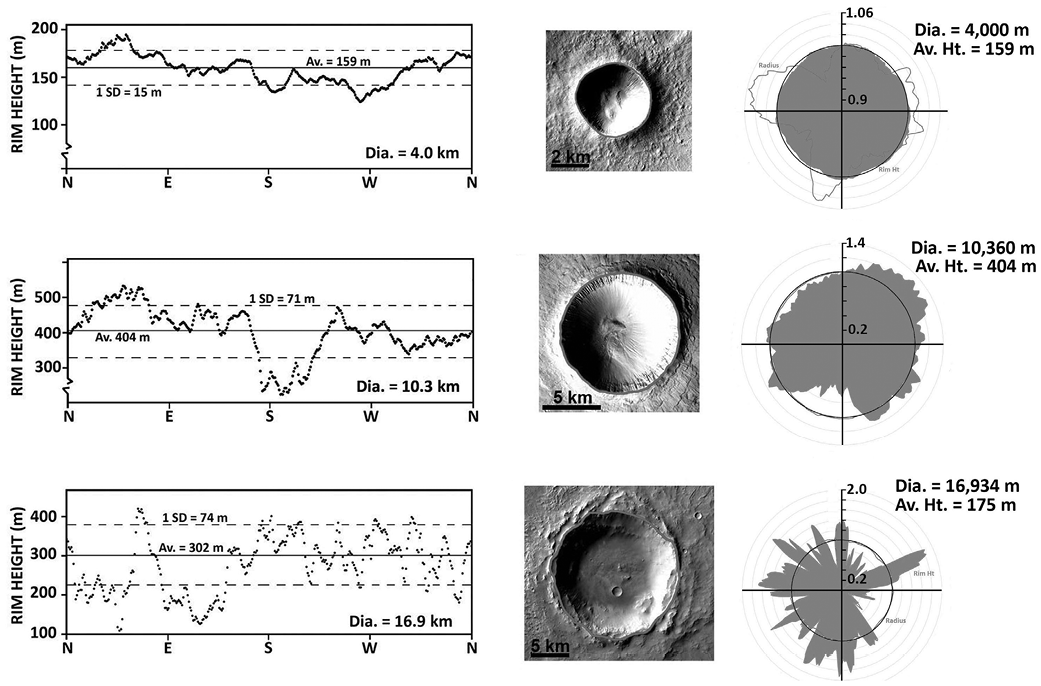
Complicating the determination of geometric ratios that involve crater depth and rim height are actual topographic variations of the rim crest, which will lead to varying estimations of the crater depth. Uneven crater floors can also make these measurements less meaningful, because craters can often have tens to hundreds of meters of height variation across the floor due to slumping of the inner walls or to nonuniform uplift of the central peak. Originally recognized at lunar craters by Sharpton (Reference Sharpton2014), Mouginis-Mark et al. (Reference Mouginis-Mark2018) demonstrated that the elevation of crater rims on Mars can vary with azimuth by several hundred meters (Figure 1.15). A detailed discussion of this rim height variation is provided in Section 9.7. Thus, the simple relationship between crater depth and diameter may not be as simple as originally believed. Particularly given uneven crater floor topography, the actual rim height and the measured floor depth may vary significantly (perhaps ±10%). At Tooting crater, for example, Mouginis-Mark and Garbeil (Reference Mouginis-Mark and Garbeil2007) noted that the rim crest has a minimum height of 386 m above the surrounding terrain, a maximum height of 893 m, and an average height of 628 m (i.e., a variation of ~40% from the average). Taking 28.0 km as the diameter of the crater, the average rim height value gives a rim height/crater diameter ratio of 0.022. Making similar measurements for the depth of the floor below the rim crest gave a value of 1,690 m for the northern portion of the crater floor and 1,881 m for the southern part of the floor, giving an average of ~1,785 m and a range equivalent to ~11% of the measurements. Although not drastically different, the depth/diameter ratio may consequently vary from 0.058 to 0.065 depending upon where the measurements were made.
Variations in rim height for three Mars craters in the diameter range of 4.0–16.9 km. At left are traverses along the identifiable rim crater. North is at the far left and far right of each plot. Average (solid horizontal line) and one standard deviation values (dashed horizontal lines) for the 360 individual rim height measurements are also shown. Center images are CTX frames (Top: D22_035823_1870; middle: P15_007027_2099; bottom: D22_035823_1870) with the rim crest showing the trace of each measured rim crest. At right are azimuth plots showing the variation in crater rim height as a fraction of the average rim height for the three hundred and sixty 1° azimuth measurements. Notice that for the smallest crater (top), there is little azimuthal variation in rim height, but for the largest crater (bottom), there are large excursions from the average height.

Figure 1.15 Long description
Graphs variations in rim height for three Mars craters with diameters ranging from 4.0 to 16.9 km. Each graph displays rim height measurements along traverses, with average and standard deviation values indicated. Central images are CTX frames of the craters, with rim crest traces marked. Azimuth plots on the right illustrate rim height variations as a fraction of the average height for 360-degree measurements.
1.7 Summary
In this chapter we have reviewed the stages of the impact cratering process including ejecta emplacement. Measurement of parameters such as the crater depth, diameter, and rim height may be used to compare craters from different locations on any planetary body. The basic classification of craters as either simple or complex, as well as the larger basin-sized craters, is a useful tool to investigate details of the morphology of specific craters. In Chapter 2 we take a tour through the Solar System to gain an overview of crater morphology, as seen on bodies with rocky or icy surfaces, as well as those with or without an atmosphere. This will form a reference point against which the morphology of impact craters on Mars can be intercompared. Not all places on Mars are the same, and so in Chapter 3 we will consider some of the spatial and temporal differences that may result in craters having very different morphologies even if they are the same size and age, as well as what might constitute a “fresh” or “pristine” crater on Mars.