



INTRODUCTION
E. coli O157 is both a commensal in the gut of ruminant animals and an enteric pathogen in humans. Although infections in ruminants are asymptomatic, infection in humans can result in serious disease, including haemolytic uraemic syndrome and death [Reference Pennington1]. Cattle faeces are widely regarded as the most important source of infection for humans, with exposure occurring either indirectly by the consumption of contaminated food or water, or by direct contact with faecal material of cattle [Reference Chapman2]. The frequency and duration of shedding of the organism in bovine faeces, along with the concentration of the organism in faeces, represent important determinants of the risk of human exposure to E. coli O157 [Reference Chase-Topping3, Reference Matthews4]. Marked variation in these attributes between and within individual cattle through time has often been observed [Reference Munns5–Reference Williams7]. Obtaining an accurate understanding of the temporal dynamics of shedding of E. coli O157 is a key step in appraising the potential reduction in risk to human health that could be obtained from controlling this pathogen. Moreover, variability of shedding needs to be accounted for when evaluating the benefit of measures for controlling E. coli O157 in live cattle.
Substantial differences in the duration and frequency of shedding of E. coli O157 in naturally infected cattle have been reported [Reference Smith, Paiba and Ellis-Iversen6, Reference Besser8–Reference Williams12]. It has been suggested that shedding events are either transient, where the pathogen is discarded over a short time period following ingestion, or long term, arising from colonization [Reference Lim13]. The shortest duration of shedding identified in the literature is 15 days [Reference Robinson9], obtained in a study reliant on once daily and twice daily sampling (short sampling interval). Studies based on long sampling intervals (weekly, monthly or longer) report far greater duration of shedding, varying from 4 to 16 weeks [Reference Smith, Paiba and Ellis-Iversen6, Reference Besser8, Reference Shere, Bartlett and Kaspar10–Reference Williams12]. However, inferences about the duration and pattern of shedding made when the sampling intervals are long do not take into account the possibility of intermittent shedding of E. coli O157. Often it is implicitly assumed that periods of non-shedding do not occur between sampling points. If shedding is to any extent volatile in the short term then misclassification error can bias the outcomes of attempts to evaluate control measures by longitudinal assessment of shedding status.
The concentration of E. coli O157 in faeces is generally reported to range from <102 to 107 c.f.u./g faeces [Reference Munns5, Reference Chase-Topping14]. Furthermore, the within-herd prevalence of E. coli O157 faecal shedding is also reported to range from 0·7% to 100% [Reference LeJeune15, Reference Williams, Ward and Dhungyel16]. Variations in these quantities, are partly due to differences in sampling and measurement methodology, and also reflect unequal distribution of the organism within the faecal pat [Reference Echeverry17–Reference Robinson19]. However, variation in concentration may also occur temporally due to intermittent shedding, which might result from individual animal or environmental factors [Reference Smith, Paiba and Ellis-Iversen6]. Thereby, many researchers propose there is an effect of season [Reference Barkocy-Gallagher20, Reference Heuvelink21] or day length [Reference Edrington22, Reference Edrington23] on E. coli O157 prevalence in cattle, possibly due to hormonal alterations within the animal. Thus far, only one study has studied diurnal patterns in shedding in housed dairy calves [Reference Robinson9].
Most studies that address shedding in cattle have used calves that were either housed in pens or individually restrained [Reference Robinson9–Reference Widiasih11]. Only a few studies have focused on cattle managed on pasture which is the predominant form of cattle management in many parts of the world. Of those studies performed on pasture, most have relied on sampling intervals of ⩾1 week [Reference Cobbold and Desmarchelier24, Reference Kondo25]. A recent study by Williams et al. [Reference Williams7] assessed the presence and concentration of E. coli O157 in dairy heifers on pasture over a period of 5 months using weekly sampling intervals. A similar study, performed in beef cattle but using 3- to 7-day intervals identified a distinct pattern associated with E. coli O157 shedding [Reference Lammers26]. The latter work also indicates that accurate definition of temporal patterns of shedding requires even shorter sampling intervals combined with enumeration of the pathogen.
The current study intensively sampled 24 beef cattle in a commercial herd in a temperate grazing system over 14 days. The overall objective was to describe the diurnal dynamics of E. coli O157 shedding in cattle managed on pasture. Specifically, the aims were to identify the value of a single measurement for predicting subsequent shedding events, assess whether or not shedding occurs in blocks or patterns or is random through time, and evaluate whether the presence of a high shedder is predictive of low shedders being present.
METHODS
Identification of study group
Preliminary screening was performed to identify shedding of E. coli O157 in Angus cows (n = 196) aged from 3 to 9 years and pastured at Charles Sturt University's beef farm in Wagga Wagga, NSW, Australia in February 2014. A minimum of 10 g faeces was collected from each cow by rectal palpation or during defecation while cows were restrained. All faecal samples were held in sterile Whirl-Pak bags (Nasco, Australia), placed immediately on ice and transported to the laboratory within 4 hours of collection. All samples were examined for E. coli O157 by direct faecal culture. From those samples that were negative on direct culture, 100 samples were chosen at random for immunomagnetic separation (IMS). Six days after the preliminary screening, 24 animals were selected as the study subjects (all of the direct culture-positive animals, complemented with randomly selected IMS-positive animals) and managed together as a group for the duration of the work. The study group was grazed on a pasture of 4 ha close to the cattle yards, with no possibility of contact with other cattle.
Sampling from the study group
Study subjects were managed over a 14-day period on pasture adjacent to cattle yards. The herd was fed cereal and ryegrass silage every second day because the availability of fresh grass was limited. Faecal samples were obtained as per the above procedure twice daily (08:00 and 15:00 hours) during the first 7 days, continuing with daily sampling (08:00 hours) for an additional 7 days.
Laboratory assays
All samples were examined for the concentration of E. coli O157 by direct culture. Briefly, 10 g faeces from each sample were homogenized in 90 ml of sterile buffered peptone water (Oxoid, Australia). For each homogenized broth, 100 µl was plated directly on sorbitol MacConkey + 5-bromo-4-chloro-3-indolyl-b-d-glucuronide agar (Oxoid) containing cefixime (0·05 mg/l) and potassium tellurite (2·5 mg/l) (Oxoid) (CT-SMAC + BCIG) and incubated for 18–24 h at 37 °C for direct culture. Suspect colonies were tested using an E. coli O157 latex test (Oxoid) for rapid presumptive identification of E. coli O157.
Homogenized broths not yielding E. coli O157 by direct plating were enriched at 37 °C for 6 h after which manual IMS was performed. This consisted of a clarification spin at 52 g for 2 min, after which 1000 µl supernatant was mixed with 20 µl anti-E. coli O157 immunomagnetic beads (Invitrogen, Australia) and separated on a plate magnet. The supernatant was removed and the beads were washed in 1000 µl IMS wash buffer (phosphate-buffered saline with 0·05% Tween-20). This wash step was repeated twice and after the second wash the beads were re-suspended in 100 µl wash buffer. The resulting solution was split and inoculated onto CT-SMAC + BCIG plates and incubated for 18–24 h at 37 °C. Again, suspect colonies were tested using an E. coli O157 latex test (Oxoid) to confirm the colonies as O157 or otherwise.
Isolates positive by latex test were screened by polymerase chain reaction (PCR) for the presence of rfbE, encoding the E. coli O157 serogroup, and for the virulence genes stx1 and stx2. Colony PCR was performed using OneTaq DNA polymerase (New England Biolabs, USA). A multiplex PCR assay was set up for detection of the above-mentioned genes using a multiplex PCR plus kit (Qiagen, Australia). Thermocycling was performed in a Bio-Rad S1000 Thermal Cycler (Bio-Rad, Australia) following the cycling conditions from Paton & Paton [Reference Paton and Paton27]. PCR products were then visualized on a 2% agarose gel containing SYBR Safe DNA gel stain (Invitrogen).
Statistical analysis
The first goal of the statistical analysis was to assess whether variation in time of day (morning or afternoon) could be associated with the shedding of E. coli O157, using a generalized linear mixed model. Shedding (Y/N) was specified as the outcome, time of day was included as a fixed effect and cow identifier (nos. 1–24) and sampling day were included as random effects. A null hypothesis significance test was conducted by calculation of the analysis of variance table. Least squares estimates and standard errors were calculated from the model.
The second goal was to assess whether the presence of a high shedder could be associated with the presence of a large number of low-shedding animals. Based on the estimated counts from faecal samples animals were categorized as negative, low-level (<103 c.f.u./g) or high-level (⩾103 c.f.u./g) shedders of E. coli O157. These data were analysed using a generalized linear model with presence of a high shedder as the binomial outcome, low shedding as a fixed effect and cow identifier as a random effect. The model residuals were examined by implementing the le Cessie–van Houwelingen–Copas–Hosmer unweighted sum of squares test for global goodness of fit.
The third goal was to identify whether previous shedding status (on the individual and group level) could be associated with current shedding. A general linear mixed model was used to identify associations between the shedding status of each individual animal and its previous shedding status. In this model, shedding status (Y/N) at time t was specified as the outcome, shedding status at time t – 1 was included as a fixed effect and cow identifier was included as a random effect. The model residuals here were examined by applying the le Cessie–van Houwelingen–Copas–Hosmer unweighted sum of squares test for global goodness of fit.
At the group level, the correlation between the number of cattle positive for E. coli O157 at sampling points and the number of cattle positive at previous sampling points was examined using Pearson correlation statistics. All statistical procedures were performed with the R analysis package [28].
Ethical standards
The use of animals in this study was approved by Charles Sturt University Animal Care and Ethics Committee (Protocol number 12/060).
RESULTS
Identification of study group
Of the 196 Angus cattle tested at the initial screening, a total of four (2·0%) were identified as shedding E. coli O157 by direct plating. Concentration of the pathogen in these samples ranged from 200 to 500 c.f.u./g faeces. Of the 100 randomly chosen samples that were tested by IMS, a total of 40 (40%) were positive for E. coli O157. Out of these 40 positive cattle, 20 were randomly selected to be part of the study group. The four cows that were selected by direct plating, were ID nos. 2, 4, 6 and 23 (Fig. 1). On the first sampling point of the 14-day study (day 0), 16 of the 24 cattle were shedding E. coli O157.
Plot of the individual shedding patterns. Samples in which E. coli O157 was detected only by immunomagnetic separation are represented as 50 c.f.u./g for graphical purposes. Stx genes are represented by different colours: stx1 and stx2 (blue), stx1 (orange), stx2 (green), no stx genes (grey). Samples in which no E. coli O157 was detected are represented by ‘•’. Note that the y-axis is a logarithmic scale.

Sampling from the study group
A total of 504 faecal samples were collected at 21 sampling points over the 14-day study period. Forty-seven (9·3%) samples from direct culture tested positive by latex test and 272 (54·0%) samples from IMS tested positive by latex test. Out of these 319 isolates that tested positive by latex test and that were subsequently screened by PCR, 295 (92·5%) were positive for the O157 rfb gene, bringing the total proportion of E. coli O157 isolates to 58·5% (295/504). From the isolates confirmed as E. coli O157 by PCR, 199 (67·5%) were positive for stx1 and stx2, 18 (6·1%) were positive for stx1 only, 55 (18·6%) were positive for stx2 only and 23 (7·8%) were lacking stx genes. The stx genes in the E. coli O157 isolates from individual cows were not consistent over the 14-day study period. Within cows, stx genes varied between days as well as within days (Fig. 1).
Only one of the 24 animals in the study group did not shed the pathogen during the study period (Fig. 1). Visual comparison of the 24 plots in Figure 1 suggests that there is no common pattern in the shedding of E. coli O157.
Marked variation in the frequency of shedding was seen in animals that were positive for E. coli O157. E. coli O157 was shed intermittently and the proportion of all occasions on which an individual cow was identified as shedding E. coli O157 ranged between 28·6% and 85·7% (mean of 57·1%). The number of changes in shedding status over the study period differed considerably for each animal, ranging from 5 to 12 changes, not including the non-shedding animal.
Fourteen (58·3%) out of 24 animals shed the pathogen at concentrations ⩾102 c.f.u./g faeces, of which three animals shed >103 c.f.u./g faeces on several occasions. The highest concentration detected was 15 200 c.f.u./g faeces.
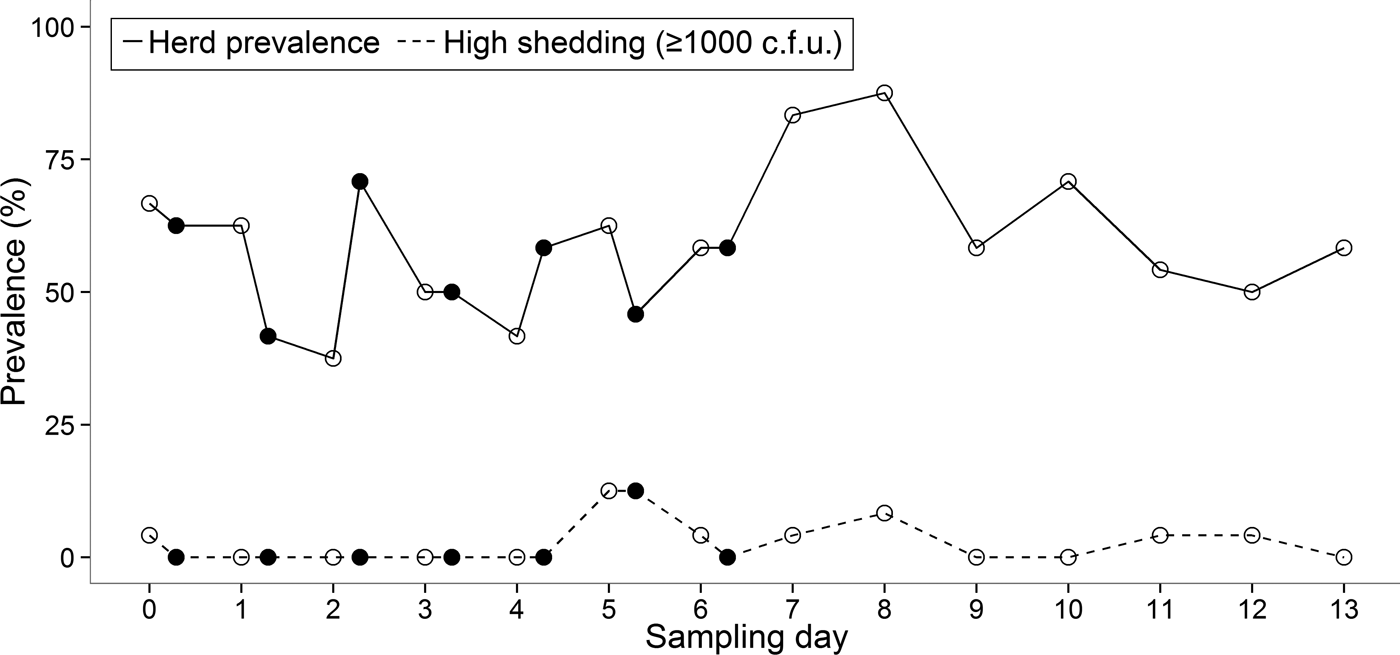
There was substantial variation in the duration for which an animal was continually shedding. Two cows (ID nos. 1 and 4) were positive for E. coli O157 on each day of the 14-day study, although on some mornings or afternoons the pathogen was undetectable in these individuals (Fig. 1). The maximum number of consecutive sampling points that an animal was found to be positive (by either direct plating or IMS) was 14, which equated to 9 days. The group prevalence of shedding during the 14-day study ranged from 37·5% to 87·5% with an average of 58·5% of cattle shedding per sampling point (Fig. 2).
Prevalence of E. coli O157 at morning (○) and afternoon (●) sampling points during the 14-day study.
Statistical analysis
Within the same animal, shedding concentrations were not always consistent between faecal samples collected in the morning and afternoon (Fig. 1). Statistical analysis showed that there was no significant difference between morning and afternoon in the frequency (P = 0·27) of positive samples.
In total, E. coli O157 was isolated from 295 samples on 14 of the 14 sampling days. The presence of a high-level shedder was not associated with a higher proportion of low-shedding animals on the same day (odds ratio = 1·03, P = 0·84).
No association between shedding status of individual animals within a 7-, 24- or 31-h period was identified (P = 0·08, 0·29, 0·49, respectively, Table 1). No relationship was found between the number of cattle positive for E. coli O157 at a sampling point and the number of cattle positive at any preceding sampling point (Table 2).
Results of analysis showing the association between the shedding status (Y/N) of each individual animal and shedding status at previous morning or afternoon sampling points

OR, Odds ratio; CI, confidence interval.
Pearson correlation coefficients for comparison between the number of cattle positive for E. coli O157 at a sampling point and the number of cattle positive at previous sampling points (morning vs. afternoon samples)

DISCUSSION
The current study focused on the daily shedding dynamics of E. coli O157 in adult grass-fed beef cattle in their natural environment. The results show sudden diurnal change in the shedding of E. coli O157 in individual animals, which conforms to findings from feedlot cattle, dairy heifers on pasture and dairy calves in pens [Reference Munns5, Reference Robinson9, Reference Williams, Ward and Dhungyel16]. These findings suggest that the highly variable nature of shedding is not restricted to intensively managed animals, e.g. feedlot and dairy cattle, but can occur in at least some forms of extensive cattle production. The intermittent shedding can be explained by either (a) misclassification in shedding of individual animals occurring either due to sampling error or assay insensitivity, or (b) a consequence of true variations in underlying shedding concentrations, or, (c) a combination of these. Some misclassification is probably inevitable because the underlying laboratory assays are not infallible (particularly at low concentration of pathogen) and because sampling error is inevitable when relatively small amounts of faeces are obtained from an animal and when subsamples are taken from this for assays. The sporadic intake of E. coli O157 strains from environmental sources is reported as one of the reasons for the intermittent shedding patterns [Reference Shere, Bartlett and Kaspar10, Reference Gautam29]. Moreover, as Williams and colleagues [Reference Williams, Ward and Dhungyel16] assert, the large amount of studies that have reported intermittent shedding, while using sensitive detection methods, suggests that observed intermittent shedding patterns can be due to sudden changes in shedding of the pathogen rather than laboratory, sampling or interpretive errors.
Sudden changes in shedding of the pathogen and the possibility of misclassification of shedding from sampling or laboratory errors make assessment of the ‘true’ shedding status of an individual impractical and costly. Only four high-shedding animals were detected during initial screening of the herd which is insufficient to draw any conclusions regarding prediction of future shedding behaviour based on a single high-shedding event. The maximum duration of continuous shedding was found to be 9 days in this study. Both Robinson et al. [Reference Robinson9] and Williams et al. [Reference Williams, Ward and Dhungyel16] define these cows as persistent shedders, e.g. animals which remained positive throughout the week.
No obvious patterns within days were found, which is in agreement with a previous study by Robinson and colleagues [Reference Robinson9] and supported by the statistical analysis in which no association between time of day and shedding was found. Within 1 day, populations of E. coli O157 shed by some cattle varied between undetectable to 1000 c.f.u./g faeces. In addition, no common pattern in E. coli O157 excretion in individual cattle could be detected. This was supported by the current statistical analysis in which no association between shedding 1 day before and current shedding was found, or between shedding in the morning vs. afternoon. There was some evidence of an association between the most proximate samples (P = 0·08), and perhaps the current sample size was slightly too small to detect an association. However, there were clearly no associations beyond these most immediate sampling points. The results of the current study show that the excretion of E. coli O157 is highly variable within individuals and therefore difficult to predict. In addition, no correlation was found between the numbers of cattle positive at a sampling point and the number of cattle positive at any preceding sampling point, which also reflects the unpredictability of shedding at the group level.
Finally, while earlier studies found an association between the presence of a high-level shedder and a higher proportion of low-shedding animals [Reference Chase-Topping14, Reference Lammers26, Reference Low30], this association was not detected in the current study. Within the current study there were numerous days with many low-shedding animals, despite the lack of a high-concentration shedder. Studies identifying this association between a high-level shedder and a high proportion of low-shedding animals were not able to confirm that high-level carriage was the cause of the low-level carriage. A study conducted in the same pasture-based production system [Reference Lammers26], did find an association between high-level shedders and low-level shedding. These contradictory results show that it is not possible to make firm predictions regarding the relationship between high- and low-shedding animals within this system. The current study, as well as early research, categorized the animals as high and low shedding. Using the actual counts may have added more detail to the analyses and subsequently changed the outcomes.
In the current study 92·2% of the E. coli O157 isolates were positive for stx genes, of which 67·5% carried stx1 and stx2, 6·1% carried stx1 only and 18·6% carried stx2 only. A percentage of >86% stx2-producing isolates is considerably greater than a previous study in which it was found that the prevalence of Australian E. coli O157 isolates harbouring stx2 is 4% [Reference Mellor31]. Stx genes varied within one cow between different sampling visits, even between morning and afternoon samples. This suggests that cattle can host multiple E. coli O157 strains at one point in time and that variation in results could merely reflect the impact of distribution of the different strains throughout the faecal pat at the time of sampling. Other investigators have also reported that several faecal samples had multiple isolates with different MLVA types, suggesting the co-existence of different E. coli O157 populations in an animal [Reference Kondo25]. In addition, a study performed in England and Wales discriminated 57 E. coli O157:H7 isolates from bovines on 11 farms [Reference Liebana32].
Because this study was based on a single herd, care must be exercised when extrapolating interpretation to the broader population of cattle. Nevertheless, the major findings are useful because they report a hitherto undocumented extent of individual animal variability [Reference Robinson9, Reference Lammers26, Reference Matthews33]. The formation of a new group of 24 cattle may have led to some additional stress although no elevation in E. coli O157 shedding was visible following formation of the study group.
It is difficult to believe that management factors can play a role in shedding of E. coli O157 in cattle when there is so much individual variation in shedding of the pathogen. The extent of variation in shedding of E. coli O157 by individual cattle poses challenges in the way that studies on risk factors and interventions are interpreted and designed. Based on the randomness of shedding at the individual level, it can be recommended to now focus on comprehensive evaluation of overall shedding of the herd, as opposed to individual shedding.
ACKNOWLEDGEMENTS
The authors acknowledge farm manager Jim Mellor for his cooperation throughout study, and the assistance of James Stephens, Mahala Gunther and Clare Ferris (Charles Sturt University) with sampling the animals. We are grateful to Emma Kalle for technical assistance.
This work was supported by Meat and Livestock Australia Ltd (grant no. A.MFS.0247).
DECLARATION OF INTEREST
None.



