

I. Foundational discovery of Anfinsen and coworkers – the amino acid sequence of a polypeptide contains all of the information required for folding to the native state
In the late 1950s, groundbreaking discoveries were being made concerning the components and steps involved in the synthesis of polypeptide chains (Crick, Reference Crick1957; Siekevitz and Zamecnik, Reference Siekevitz and Zamecnik1981). A foundational discovery was also made concerning the folding of polypeptide chains into their three-dimensional active structures. In 1957, Sela et al. (Reference Sela, White and Anfinsen1957) reported that the 124-residue bovine pancreatic RNAse A, completely inactivated by incubation in 8 M urea and thioglycolic acid, which fully reduced its four disulfide bonds, could be partially reactivated by air oxidation in a phosphate buffer. Soon after, with the use of either further-purified thioglycolic acid or β-mercaptoethanol during the inactivation step, reactivation was obtained to the level of ~80% (White, Reference White1960). Comparison of the starting native pancreatic RNAse A and the reoxidized enzyme showed the two to be identical, by proteolysis and peptide mapping, the latter including identification of the disulfide-containing peptides, as well as by optical rotation, UV spectral measurements, and observation of identical crystallographic diffraction data (Bello et al., Reference Bello, Harker and De Jarnette1961; White, Reference White1961). This indicated that a unique native active conformation had been reachieved. From these studies, it could be concluded that ‘the information for the correct pairing of half-cystine residues in disulfide linkage, and for the assumption of the native secondary and tertiary structures, is contained in the amino acid sequence itself’ (Anfinsen et al., Reference Anfinsen, Haber, Sela and White1961).
Subsequent kinetic studies of the renaturation reaction, carried out at varying concentrations and temperatures, indicated an optimal rate and extent of recovery of activity at ~1 µM RNAse A and 24 °C, exhibiting a t ½ of 20 min (Epstein et al., Reference Epstein, Goldberger, Young and Anfinsen1962; note that the original reoxidation experiment was conducted at 1 mM RNAse A concentration). Recovery of activity exhibited a sigmoid behavior, whereas formation of disulfides exhibited first-order behavior (Fig. 1); this supported the idea that non-native disulfides might be forming initially and subsequently rearranging to the native ones (Anfinsen et al., Reference Anfinsen, Haber, Sela and White1961). In support, when renaturation was carried out at 100 µM concentration, where a pronounced lag phase in the production of activity had been observed, the lag phase was associated with the transient formation of rapidly sedimenting protein, whose formation could be blocked by the presence of β-mercaptoethanol (Epstein et al., Reference Epstein, Goldberger, Young and Anfinsen1962). Thus, it was proposed that non-native disulfide bonds, here intermolecular ones, could be formed early during renaturation, but subsequent rearrangement, driven by ‘thermodynamic forces’, produced full recovery of the unique native arrangement of the native state, presumed to lie at ‘the lowest configurational free energy’ (Anfinsen et al., Reference Anfinsen, Haber, Sela and White1961; Epstein et al., Reference Epstein, Goldberger, Young and Anfinsen1962).
RNAse A refolding involves first-order kinetics of disulfide bond formation with the slower formation of the native state, likely a function of rearrangement of non-native to native disulfides. Adapted from Anfinsen et al. (Reference Anfinsen, Haber, Sela and White1961).

II. Discovery of a cellular accelerant to renaturation of RNAse A – microsomal protein disulfide isomerase
In 1963, the groups of Anfinsen (Goldberger et al., Reference Goldberger, Epstein and Anfinsen1963) and of Straub (Venetianer and Straub, Reference Venetianer and Straub1963a) reported that a microsomal protein, in the former case from the liver and the latter from the pancreas, could accelerate the reactivation of reduced RNAse A at a physiological temperature, such that the t ½ was now ~5 min, and complete recovery required ~20 min. Both groups observed that the microsomal enzyme required a ‘cofactor’, and the latter group observed that the oxidant dehydroascorbate (DHA) could serve this function (Venetianer and Straub, Reference Venetianer and Straub1963b), in retrospect likely enabling reoxidation of the microsomal enzyme to its active (disulfide-donating) form. Of course, on its own, DHA could completely oxidize RNAse A to a non-active form. But when DHA and microsomal enzyme were added together, RNAse activity was now recovered, but the rate of free thiol oxidation was far greater than that of recovery of RNAse activity, supporting that the microsomal enzyme is catalyzing the rearrangement of non-native disulfides, ultimately to the thermodynamically stable native arrangement (Venetianer and Straub, Reference Venetianer and Straub1964; Givol et al., Reference Givol, Goldberger and Anfinsen1964). Indeed in an order of addition experiment, DHA was added first, completely oxidizing reduced RNAse A to an inactive state. The DHA was then removed by G25 gel filtration, and subsequent rapid reactivation was achieved by incubation with the microsomal enzyme and mercaptoethanol, whereas no activation occurred with the microsomal enzyme alone (Givol et al., Reference Givol, Goldberger and Anfinsen1964). Thus, the reduction of disulfide bonds by mercaptoethanol allowed the microsomal enzyme to catalyze disulfide interchange to yield the native, active RNAse A enzyme. This both further supported Anfinsen's model of the kinetics of the spontaneous renaturation reaction and was the first identification of an in vivo catalyst of protein folding, protein disulfide isomerase.Footnote 1, Footnote 2
III. Pelham's discovery that a cellular heat shock-induced protein, Hsp70, binds hydrophobic surfaces in heat-shocked nuclei and is released by ATP
While protein disulfide isomerase could accelerate folding in the relatively oxidizing compartment of the microsome (endoplasmic reticulum) by acting to rearrange disulfide bonds to a unique thermodynamically stable arrangement of the native state, outside of the secretory compartment, conditions are relatively reducing, and disulfides are not generally formed. Thus, in the absence of protein disulfides on which to act to influence folding rates, is there any type of assistance available to a thermodynamically-directed folding process in such compartments? Here, the work of Pelham in the mid-1980s, studying heat shock protein 70 kDa, pointed to such machinery.
Heat shock proteins
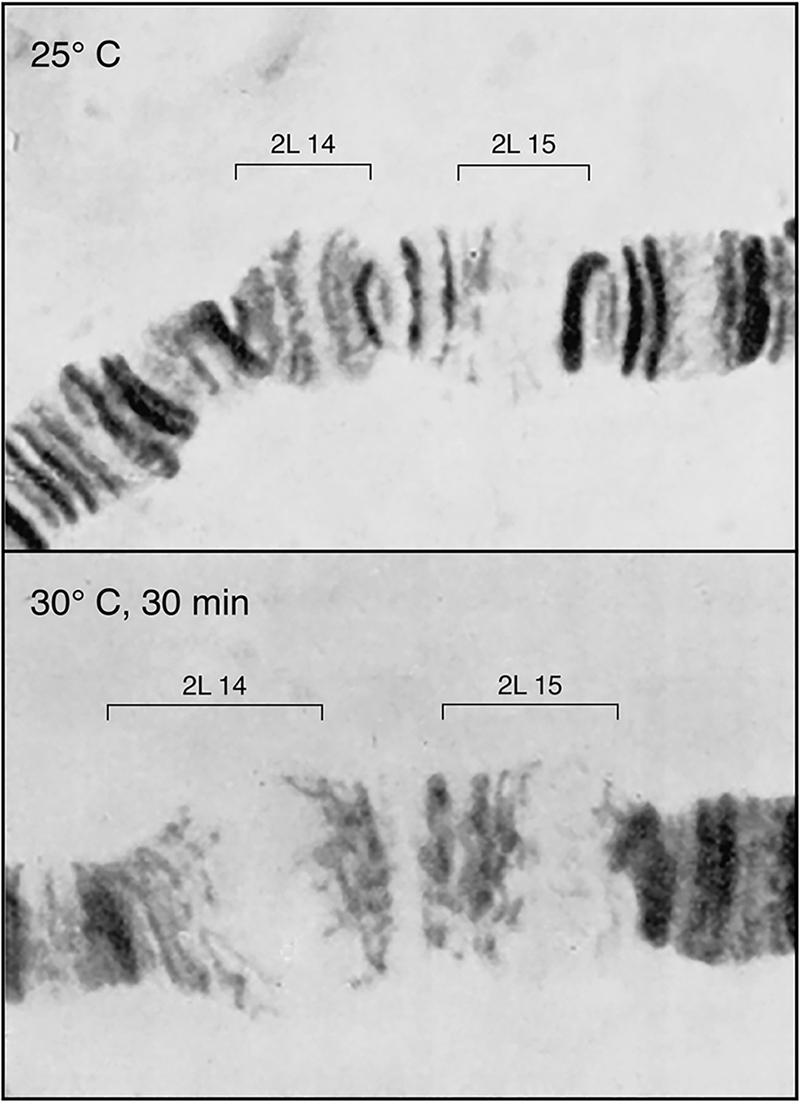
During the 1970s, a class of heat-inducible proteins variously of ~90, 70, 60, and 20 kDa had been recognized in Drosophila (Tissières et al., Reference Tissières, Mitchell and Tracy1974), bacteria (LeMaux et al., Reference Lemaux, Herendeen, Bloch and Neidhardt1978; Yamamori et al., Reference Yamamori, Ito, Nakamura and Yura1978), and mammalian cells (Kelley and Schlesinger, Reference Kelley and Schlesinger1978). These proteins were the products of heat-induced transcription of loci encoding them, as most dramatically shown in Drosophila, where visible ‘puffs’ of salivary polytene chromosomes, indicative of high-level local transcription, had first been observed under heat shock conditions in 1962 by Ritossa (Fig. 2). A study of Tissières et al. (Reference Tissières, Mitchell and Tracy1974) correlated the most prominent locus of salivary gland puffing (87B) with the most strongly induced protein, the 70 kDa protein, Hsp70. A number of other groups then explored this relationship (e.g. Lindquist McKenzie et al., Reference Lindquist McKenzie, Henikoff and Meselson1975; Spradling et al., Reference Spradling, Penman and Pardue1975), and it was ultimately established as direct using cloned Hsp70 genomic sequences (Schedl et al., Reference Schedl, Artavanis-Tsakonis, Steward and Gehring1978). Correspondingly, in mammalian cells, Kelley and Schlesinger (Reference Kelley and Schlesinger1978) observed that the response could be blocked by the transcription inhibitor actinomycin D. They also observed that exposure to the amino acid analogue, canavanine, induced the same set of proteins as heat. This was presumed to result from misincorporation of this amino acid analogue with an effect on the structure of one or more proteins. The authors discussed that a single sensitive protein was likely involved and that it might regulate glucose metabolism. Hightower (Reference Hightower1980) also studied canavanine-mediated induction, discussing that the induced proteins might regulate the degradation of the abnormal ones being synthesized. Other investigators postulated the effects of heat shock proteins on nucleotide metabolism or as mediating direct effects on promoter regions in DNA.
Transcriptional response to heat shock. Drosophila salivary gland chromosome ‘puffs’ occurring with heat shock. These sites of increased transcription were shown later to encode heat shock 70 proteins. From Horwich (Reference Horwich2014); adapted from Ritossa (Reference Ritossa1962), by permission from Springer, copyright 1962.
Hsp70 stimulates the recovery of nucleolar morphology after heat shock
Against this backdrop, Pelham (Reference Pelham1984) reported studies on constitutive expression from a transfected Drosophila heat shock protein 70 gene in cultured mammalian cells. Under non-stress conditions, a pattern of nuclear and perinuclear staining was observed with anti-Drosophila Hsp70 (DHsp70) antibodies. After a heat shock (43 °C, 45 min), the anti-DHsp70 staining became localized to nucleoli, with re-direction of the DHsp70 as an explanation, because this occurred even in the presence of the translation inhibitor cycloheximide. These results agreed with earlier ones that nucleoli and ribosome synthesis are very sensitive to heat shock (e.g. Simard and Bernhard, Reference Simard and Bernhard1967). Indeed when Pelham stained cells with toluidine blue (which has an affinity for RNPs and selectively stains nucleoli), he observed the nucleoli to change morphology upon heat shock from ‘large’ with smooth edges to smaller and rough-edged or spiky. In the presence of DHsp70, however, there was a more rapid transition from heat-shocked morphology back to normal of those nucleoli that received redirected DHsp70 (detected by immunostaining). This was interpreted to indicate that DHsp70 functions directly to accelerate recovery. The specific action of Hsp70 here was speculated to be one of facilitating reassembly of RNPs.
Binding of Hsp70 following heat shock and ATP-driven release
Hsp70 binding to nuclei and nucleoli – hydrophobic interaction
In Lewis and Pelham (Reference Lewis and Pelham1985), the involvement of ATP in the function of mammalian Hsp70 was described. An antibody was raised against the two co-purified human Hsp70 species, constitutively expressed Hsp72 and thermally inducible Hsp73 (which were not physically separable). Upon carrying out antibody staining of COS cells in culture, the same behavior seen with transfected Drosophila Hsp70 was observed – nuclear staining with the exclusion of nucleoli and perinuclear staining in normal conditions, and localization to nucleoli after heat shock. The strength of Hsp70 association was measured by isolating nuclei from both unstressed and heat-shocked cells, using NP40 lysis in isotonic buffer. In the absence of stress, there was no Hsp70 recovered in the nuclear pellet, indicating that its association with the nucleus was weak and reversible. By contrast, after heat shock, 30–40% of Hsp70 pelleted with the nuclei. Fluorescent imaging of cells prior to extraction indicated that Hsp70 initially remained associated with the nucleus in the extranucleolar space but then became nucleolar-localized.
Next, tests were carried out to identify conditions that might elute Hsp70 from the isolated nuclei. First, neither 0.4 M nor 2 M NaCl/DNase produced efficient release from nuclei, suggesting that binding might be primarily hydrophobic in character. Such salt-insensitive insoluble behavior had been similarly reported a month earlier by Evan and Hancock (Reference Evan and Hancock1985) for c-myc protein in the nuclei of heat-shocked Colo or HeLa cells. They proposed that a large multi-protein aggregate was produced upon heat shock, which Lewis and Pelham referred to as a ‘hydrophobic precipitate’ or ‘an aggregate (formed) by improper hydrophobic interactions’. Lewis and Pelham also referred to additional unpublished data of their own supporting hydrophobic interaction of purified human Hsp70, namely that it bound tightly to phenyl and octyl-Sepharose but not to heparin, poly(A), or rRNA Sepharose.
ATP-driven release
Finally, tests of ATP effects on Hsp70 were carried out. First, ATP was added at various points after heat shock during the cell lysis step, and fluorescent staining carried out of the isolated nuclei. This revealed that when ATP was added, there was a complete absence of Hsp70 from the isolated nuclei, compared with, for example, its presence when ADP was added (nuclear and then nucleolar anti-Hsp70 staining observed). In a second experiment, isolated nuclei from heat-shocked cells were challenged with ATP, then supernatant and pellet fractions prepared and immunoblotted. Here also, ATP completely released Hsp70 from the nuclei within 1 min (at 37 °C) and at concentrations as low as 1 µM ATP (Fig. 3). In contrast, none of ADP, AMP-PNP, or ATPγS could promote the release. Thus it appeared that the binding or binding/hydrolysis of ATP could specifically release Hsp70 from the hydrophobic surfaces in aggregates produced when proteins became exposed to heat shock. The affinity of Hsp70 for ATP had been appreciated in an earlier paper from Welch and Feramisco (Reference Welch and Feramisco1985), observing strong affinity of Hsp70 for ATP-agarose; and ATP binding and hydrolysis had been observed in an earlier study of an E. coli homologue of Hsp70, DnaK (Zylicz et al., Reference Zylicz, LeBowitz, McMacken and Georgopoulos1983).
ATP-driven release of Hsp70 that had accumulated in the nuclei of cultured COS cells after heat shock. Isolated nuclei were incubated without additions, with glucose/hexokinase, or with ATP, then fractionated into supernatant (S) and pellet (P) fractions. ATP produced a complete release of Hsp70 from the isolated nuclei. Adapted from Lewis and Pelham (Reference Lewis and Pelham1985), with permission, copyright EMBO, 1985.

Model of action
Thus, Pelham (Reference Pelham1986) proposed a model of action of Hsp70 in protein disaggregation (Fig. 4), with Hsp70 binding to hydrophobic surfaces that become exposed when proteins are subject to thermal stress and which are prone to multimolecular aggregation, and helping to disrupt such interactions through the energy of ATP action, the Hsp70 undergoing a conformational change itself during the process. This could give released proteins a chance to correctly refold and/or to reassemble with others. Repeated cycles of action of binding and release could ultimately correct the damage.
Model of Hsp70/ATP action to reverse incipient protein aggregation. Adapted from Pelham (Reference Pelham1986), with permission from Elsevier, copyright 1986.

This was the earliest model of a chaperone reaction cycle, correctly identifying the hydrophobic nature of chaperone–substrate interactions [borne out for Hsp70, e.g. in a crystal structure of a complex of the DnaK peptide binding domain with a synthetic hydrophobic peptide (Zhu et al., Reference Zhu, Zhao, Burkholder, Gragerov, Ogata, Gottesman and Hendrickson1996)]. Here, ATP hydrolysis was indicated as the effector of substrate protein release. Notably, later studies showed that ATP binding alone is employed by both Hsp70s and the chaperonin ring assemblies to achieve substrate protein release (Palleros et al., Reference Palleros, Reid, Shi, Welch and Fink1993; Schmid et al., Reference Schmid, Baici, Gehring and Christen1994; Rye et al., Reference Rye, Burston, Fenton, Beechem, Xu, Sigler and Horwich1997). Moreover, both chaperone classes are remarkable for the inactivity in substrate release of the two non-hydrolyzable ATP analogues that were tested here. ATP hydrolysis is employed by these chaperones following ATP binding-mediated substrate release to reset their conformations to the states with high affinity for substrate protein (e.g. in the case of Hsp70s, see Kityk et al., Reference Kityk, Kopp, Sinning and Mayer2012, Zhuravleva et al., Reference Zhuravleva, Clerico and Gierasch2012, and Qi et al., Reference Qi, Sarbeng, Liu, Le, Xu, Xu, Yang, Wong, Vorvis, Hendrickson, Zhou and Liu2013). Finally, this early description of Hsp70 function fits into the contemporary view of protein disaggregation, but its cooperation with other components is critical (see below).
IV. Broader role of Hsp70 in protein disassembly and in maintaining an unfolded state of monomeric species
Disassembly of clathrin and of a protein complex at the λ replication origin
Constitutive members of the Hsp70 family were recognized early (e.g. Kelley and Schlesinger, Reference Kelley and Schlesinger1982) and were found to have several specific functions under normal physiologic conditions. In 1984, Schlossman et al. (Reference Schlossman, Schmid, Braell and Rothman1984) reported that an abundant 70 kDa protein from bovine brain cytosol could mediate ATP-dependent dissociation of clathrin cages, which are removed from endocytosing coated membrane vesicles prior to their fusion with target membranes. The uncoating enzyme was subsequently identified as a constitutive member of the Hsp70 family (Ungewickell, Reference Ungewickell1985; Chappell et al., Reference Chappell, Welch, Schlossman, Palter, Schlesinger and Rothman1986). The dissociation of protein–protein interactions in the uncoating reaction accorded well with the dissociating action by Hsp70 proteins during heat shock as modeled by Lewis and Pelham. Such action also well-described the involvement of the bacterial Hsp70 homologue, DnaK, in promoting lambda phage DNA replication at an origin sequence, where Georgopoulos and coworkers had first observed that DnaK bound the lambda P protein (Zylicz et al., Reference Zylicz, LeBowitz, McMacken and Georgopoulos1983). This was later understood to be an action of dissociating lambda P from lambda O and the helicase DnaB, thus triggering the activity of the latter and allowing replication to proceed (Zylicz et al., Reference Zylicz, Ang, Liberek and Georgopoulos1989).
Maintenance of import-competent unfolded state of ER and mitochondrial precursor proteins in the cytosol
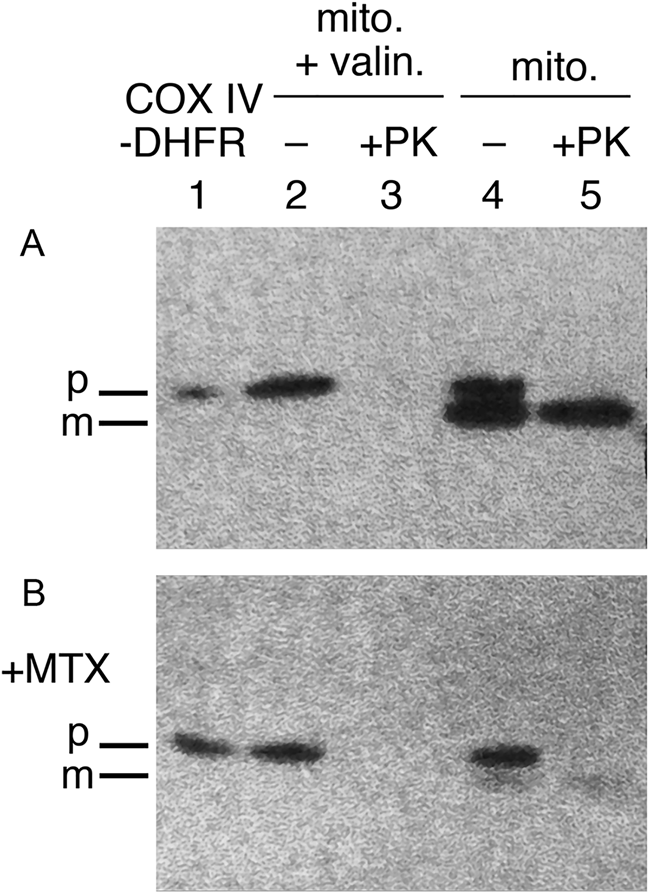
In addition to oligomeric protein disassembly, a broader role of Hsp70s, likely acting on monomeric proteins to maintain an unfolded state, was indicated. In the case of mitochondrial precursors, a study of Eilers and Schatz (Reference Eilers and Schatz1986) had indicated a requirement for such an unfolded state: when a fusion protein joining a 22 residue N-terminal import signal from cytochrome oxidase IV was joined with a mouse DHFR sequence, the fusion protein was readily imported into isolated mitochondria, but if the DHFR ligand methotrexate (MTX) was present, stabilizing the native state of DHFR and thus preventing unfolding, import was blocked (Fig. 5). In 1988, two studies, by Deshaies et al. (Reference Deshaies, Koch, Werner-Washburne, Craig and Schekman1988) and by Chirico et al. (Reference Chirico, Waters and Blobel1988), observed that cytosolically-synthesized precursor proteins destined for import into ER or mitochondria were maintained in unfolded, translocation-competent states by cytosolic Hsp70 proteins (prior to translocation and processing inside the organelles to mature forms). In the Deshaies et al. study, deficiency of the yeast cytosolic Hsp70 proteins of the SSA class under non-stress conditions was shown to result in the accumulation of two different secretory precursor proteins (prepro-α factor and carboxypeptidase Y) and a mitochondrial precursor (F1ATPase β-subunit). In the case of ER precursor translocation, an in vitro test was carried out using wheat germ-synthesized prepro-α factor and yeast microsomes (requiring also a yeast post-ribosomal supernatant fraction) – added SSA protein or lysate containing SSA produced a large enhancement of translocation. Along the same line of in vitro study, Chirico et al. observed two activities from yeast cytosol required for the import of prepro-α factor into yeast microsomes, a NEM-sensitive activity and a NEM-resistant one, the latter of which purified as two constitutively expressed SSA proteins. Notably, 8 M urea unfolding of a prepro-α factor translation mixture produced a stimulation of translocation that was even greater than that conferred by the SSA proteins. This result, however, was fully consistent with an action of the SSA proteins to mediate an unfolding action on precursor proteins in the cytosol. Indeed, the addition of SSA to the diluted urea-treated translation mixture produced only a small further increase of translocation.
An unfolded state required for protein import into mitochondria. Stabilizing the DHFR moiety of a CoxIV targeting peptide-DHFR precursor protein with methotrexate (MTX) prevents import. Top panel shows import into isolated mitochondria in the absence of MTX and conversion of the imported precursor to the mature form that is resistant to exogenously added proteinase K (lane 5). Valinomycin blocks import by abolishing inner membrane potential gradient (lane 3), as a control. Bottom panel shows that added methotrexate blocks import (lane 5), with neither production of mature form nor protection from proteinase K. Adapted from Eilers and Schatz (Reference Eilers and Schatz1986), by permission from Springer Nature, copyright 1986.
ER-localized Hsp70 is the immunoglobulin heavy chain binding protein (BiP)
Finally, in the ER, Haas and Wabl (Reference Haas and Wabl1983) had identified a protein that physically associated with translocated immunoglobulin heavy chains expressed in the absence of light chains with which they normally assemble. They termed this protein the ‘immunoglobulin binding protein’, BiP. Further study by Munro and Pelham (Reference Munro and Pelham1986) and by Bole et al. (Reference Bole, Hendershot and Kearney1986) identified this as an Hsp70 relative of the ER (also known as Grp78, glucose-deprivation responsive protein of 78 kDa) and further established that it transiently interacts with heavy chains during the assembly process with light chains, thus attributing an ‘unfoldase/holdase’ action for an Hsp70 protein in this context.
V. Contemporary view of polypeptide binding by Hsp70 and the roles of its cooperating components
The early studies of Hsp70s pointed clearly to its breadth of roles in virtually all cellular compartments, fundamentally, binding hydrophobic stretches (Flynn et al., Reference Flynn, Pohl, Flocco and Rothman1991; Rüdiger et al., Reference Rüdiger, Germeroth, Schneider-Mergener and Bukau1997) in its own hydrophobic ‘arch’ of the β-sheet peptide binding domain (Zhu et al., Reference Zhu, Zhao, Burkholder, Gragerov, Ogata, Gottesman and Hendrickson1996). Recent NMR studies from Kay and coworkers indicate that such binding of an unfolded state occurs by a selection process from among an ensemble of substrate protein conformations, i.e. by the preference for a pre-existing unfolded state among the ensemble, as opposed to an induced fit (unfoldase) action (Sekhar et al., Reference Sekhar, Velyvis, Zoltsman, Rosenzweig, Bouvignies and Kay2018). The conformation of an Hsp70-bound protein is not affected by the presence or absence of nucleotide (e.g. no ‘power stroke’-mediated change of conformation of bound substrate protein occurs in relation to the large conformational change in Hsp70 upon hydrolysis of ATP to ADP; Sekhar et al., Reference Sekhar, Rosenzweig, Bouvignies and Kay2015). However, it appears that, for at least one small three-helix substrate, binding reduces long-range transient contacts observed in the unbound globally unfolded state, biasing folding in the bound state toward the more local formation of secondary structure and mid-range contacts. Thus binding by Hsp70s appears to bias the folding landscape and to favor a diffusion–collision mechanism over a nucleation–condensation one (Sekhar et al., Reference Sekhar, Rosenzweig, Bouvignies and Kay2016).
Later studies have also pointed to the exquisite regulation of Hsp70s by, on one hand, specific DnaJ proteins, able themselves in some cases to recognize hydrophobic regions of non-native polypeptides then present them to the peptide binding pocket of Hsp70s, but also interacting with the ATP-binding domain of Hsp70 (via the J domain) to promote ATP turnover, locking in substrate protein (Kampinga and Craig, Reference Kampinga and Craig2010). At a next step of the Hsp70 reaction cycle, Hsp70s occupying the ADP state are regulated by a diversity of nucleotide exchange factors that act to convert ADP-bound Hsp70s with high affinity for non-native polypeptide to ATP-bound states that have low affinity for polypeptide, in some cases thus regulating a rate-limiting step in the Hsp70 reaction cycle (Brehmer et al., Reference Brehmer, Gässler, Rist, Mayer and Bukau2004; Rauch and Gestwicki, Reference Rauch and Gestwicki2014).
VI. Discovery of a double-ring complex in bacteria, GroEL, with a role in phage assembly
Role of a host bacterial function, groE, in bacteriophage assembly in E. coli
During the 1970s and early 1980s, an entirely different line of investigation, paralleling that of heat shock proteins, uncovered molecular actions that appeared to assist oligomeric assembly during the steps of biogenesis of large complexes. Phage researchers were first to uncover such action. In 1972, side-by-side publications described mutations in host bacteria that blocked phage head assembly of both T4 and λ phages (Georgopoulos et al., Reference Georgopoulos, Hendrix, Kaiser and Wood1972; Takano and Kakefuda, Reference Takano and Kakefuda1972).
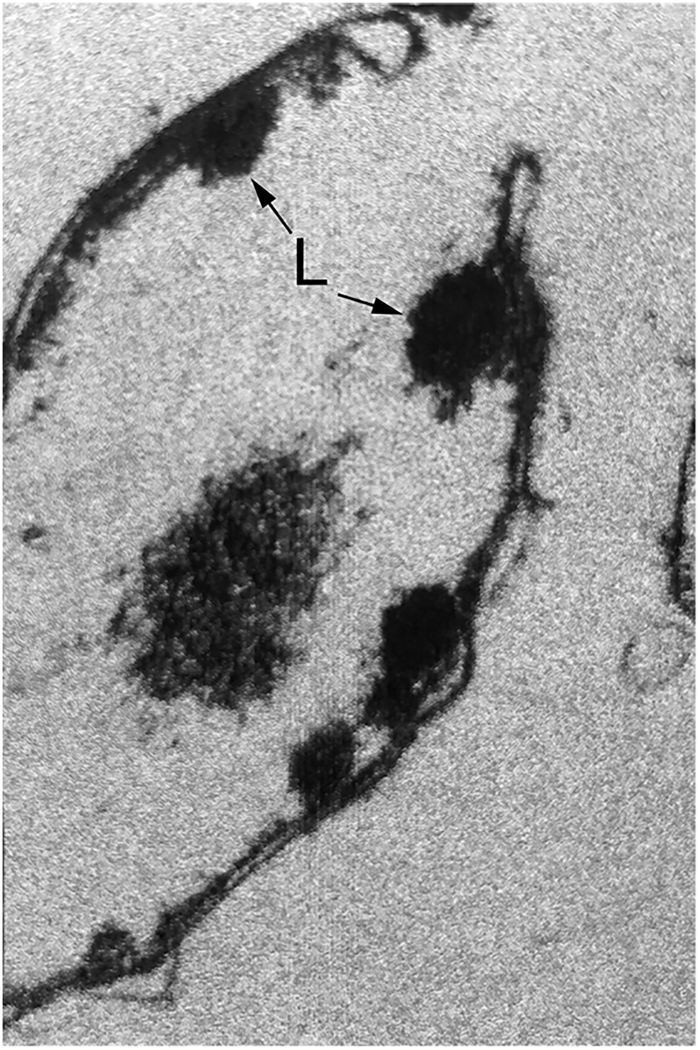
Takano and Kakefuda focused initially on T4 biogenesis. They described a host E. coli mutant, called mop (morphogenesis of phages), produced by MNNG mutagenesis, that restricted the growth of T4 phage. EM studies of T4-infected mop cell lysates revealed the absence of phage heads and the presence, instead, of aggregates or ‘lumps’ associated with bacterial membranes (Fig. 6), resembling the morphology seen in standalone T4 phage gene 31 mutants where head assembly is likewise affected (Kellenberger et al., Reference Kellenberger, Eiserling and Boy de la Tour1968). By contrast, phage tails in the mop mutant were present in normal number and able to assemble with normal heads supplied in a complementing lysate. Remarkably, growth could be restored to T4 phage on this host mutant when particular mutations were also present in the T4 phage gene 31. (We now know that gene 31 encodes, remarkably, a GroES cochaperonin homologue, but that realization lay 20 years off! See page 107) The investigators also observed that phage λ was affected by mop and that, likewise, phage head assembly was blocked. They commented that certain mutants in the major phage head protein encoded by λE could overcome the block.
‘Lumps’ (L) of aggregated T4 phage heads on the cell membranes in a lysate of T4 phage-infected E. coli bearing mutation at the groE locus. Reprinted from Takano and Kakefuda (Reference Takano and Kakefuda1972), by permission from Springer Nature, copyright 1972.
In the companion paper, Georgopoulos et al. made similar observations, initially isolating host mutants affecting λ phage propagation but then observing them also to affect T4 biogenesis. The mutants were referred to as groE because here, as in the other study, a number of mutations in the λ phage gene E, encoding the phage major head protein, could suppress the λ growth defect. The defective phage heads in groE-deficient cells were observed in EM to occupy aggregated forms termed ‘monsters’ and ‘tubular forms’ (Fig. 7 and Georgopoulos et al., Reference Georgopoulos, Hendrix, Casjens and Kaiser1973). The T4 gene 31 suppression observed by the other group was also identified by Georgopoulos et al. (Reference Georgopoulos, Hendrix, Kaiser and Wood1972) and indicated to comprise a cooperative action between the host gene and phage gene 31 in head morphogenesis. But notably, Georgopoulos et al. also observed that the groE strain groEA44 exhibited altered growth on its own, with nearly twice the doubling time at 37 °C and halted growth and filamentous behavior at 43 °C. Thus it seemed likely that there were effects on host functions.Footnote 3
Defective λ phage heads, including tubular structures, observed in infected groE-deficient E. coli. Lower center is wild-type control showing normal phage with globular heads and narrow tails. Adapted from Georgopoulos et al. (Reference Georgopoulos, Hendrix, Casjens and Kaiser1973), with permission from Elsevier, copyright 1973.

Identification of a groE protein product of ~60 kDa, GroEL
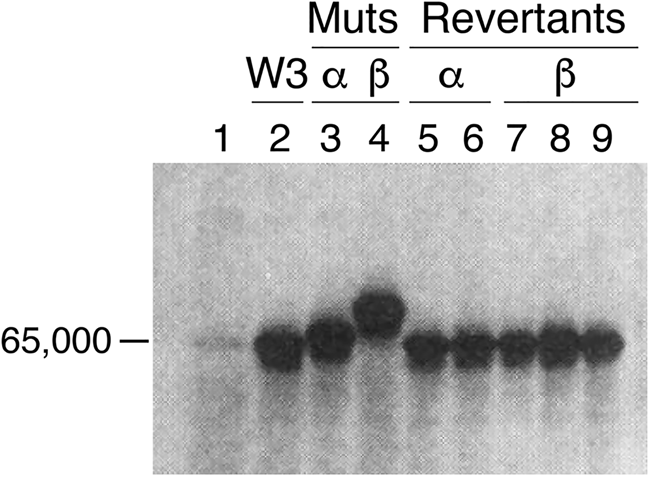
With the advent of restriction enzymes and construction of λ phage libraries, it became possible to rescue groE mutants, and in January 1978, both Georgopoulos and Hohn (Reference Georgopoulos and Hohn1978) and Hendrix and Tsui (Reference Hendrix and Tsui1978) reported in companion papers the rescue of λ phage growth of groE-deficient strains (to plaque formation) by a groE+ transducing phage and identification of an ~60 kDa protein product (in a setting where cells were UV-irradiated to block host protein synthesis and then infected with the groE+ transducing phage). In the former study, mutagenesis of the groE+ transducing phage itself was shown to produce 60 kDa protein products with altered migration (Fig. 8). This supported that the rescuing phage encoded a groE product. Likewise, Hendrix and Tsui isolated a transducing phage that rescued the λ phage production of groE mutants and also rescued the ts growth phenotype of groEA44. Here also, an ~60 kDa protein was produced after UV irradiation and infection. In addition, an amber mutation was able to be produced in the rescuing phage genome, blocking the production of the 60 kDa species in the absence of an amber suppressor, further supporting this as a product of the groE gene.
Transducing phage (W3) rescuing groE-deficient E. coli encode an ~60 kDa protein. Lanes 3, 4 mutants of the W3 phage (α and β) reduce rescue and produce altered mobility of the encoded protein, with reversion restoring normal mobility (lanes 5–9). From Georgopoulos and Hohn (Reference Georgopoulos and Hohn1978).
Double-ring tetradecamer structure of GroEL
In 1979, Hendrix (Reference Hendrix1979) and Hohn et al. (Reference Hohn, Hohn, Engel, Wurtz and Smith1979) both reported on the overproduction of the 60 kDa protein, from transducing phage and temperature-inducible prophage, respectively, followed by purification of the protein using glycerol gradients (where it migrated as a larger complex at 20–25 S), anion exchange chromatography, and gel filtration. In negative stain EM, both groups observed two stacked sevenfold radially symmetric rings of 12.5–13 nm diameter with a central ‘hole’ (Fig. 9), interpreted as two stacked seven-membered rings. Side views showed rectangles with four stain-excluding striations, with dimensions ~12.5–13 nm × 10–11.6 nm. Both groups misinterpreted the striations as lying parallel to the long axis of the particle. This interpretation was later corrected by Hutchinson et al. (Reference Hutchinson, Tichelaar, Hofhaus, Weiss and Leonard1989), examining a related sevenfold symmetric particle contaminating Neurospora crassa mitochondrial cytochrome reductase preparations [see page 20 as related to EM work of McMullen and Hallberg (Reference McMullen and Hallberg1987, Reference McMullen and Hallberg1988), on mitochondrial chaperonin Hsp60]. The study of Hutchinson et al. used both negatively stained and frozen hydrated samples, and carried out 30° and 60° tilting of the specimens – when the investigators tilted around an axis perpendicular to the striations, the striations were preserved, whereas they were lost when tilting along an axis parallel to them. This indicated that the perpendicular tilt must have been carried out around the sevenfold axis (thus preserving the striations via radial symmetry as the specimen was tilted). Because the stain-excluding striations lay perpendicular to the sevenfold symmetry axis, Hutchinson et al. concluded that the four striations must comprise two major globular domains, with two such pairs of striations brought together in apposed rings.
Early negative stain EM studies of purified GroEL, showing sevenfold rotational symmetry in end views and four ‘stripes’ in side views. Models in panel (c). Reprinted from Hendrix (Reference Hendrix1979), with permission from Elsevier, copyright 1979, and adapted from Hohn et al. (Reference Hohn, Hohn, Engel, Wurtz and Smith1979), with permission from Elsevier, copyright 1979.

In retrospect, such rings had first been observed as a contaminant of RNA polymerase preparations (Lubin, Reference Lubin1969, plate IX therein). Also, in 1976, Ishihama et al. (Reference Ishihama, Ikeuchi, Matsumoto and Yamamoto1976) had shown that there was an ATPase activity contaminating the RNA polymerase preparations that was stable to polymerase dissociation by high salt, and that the activity purified as a 900 kDa particle in equilibrium sedimentation. Upon SDS solubilization, gel analysis revealed an ~70 kDa subunit. The authors suggested 13 or 14 subunits per molecule, and observed 7–9-membered rings in EM. Thus, their observations now connected to the groE-encoded 60 kDa product, and ATPase activity was attributed to it. The ATPase activity was further confirmed by Hendrix using the preparation employed for EM studies (Reference Hendrix1979).
Second groE gene product, GroES
One of the mutant λ transducing phages bearing groE that exhibited altered mobility of the 60 kDa (GroEL) protein in transduced cells (called phage W3α), rescued a selective set of groE mutants, raising the possibility that these rescued groE mutants bore mutation in a second gene (that was being rescued by what would be an unaltered second gene in the transducing groE phage; Tilly et al., Reference Tilly, Murialdo and Georgopoulos1981). In support of this, an amber mutant selected for in the 60 kDa-encoding gene (producing only a 35 kDa truncation product) could still rescue phage growth on exactly the same group of groE mutants as W3α. Deletions in groE transducing phage were then made using an EDTA treatment procedure and were mapped using restriction enzymes and DNA heteroduplexing. This indicated that indeed two genes were present, segregated on the basis of the extent of DNA deletion – e.g. in one deletion class, the 60 kDa encoding region was deleted (abolishing the growth of these phages on the respective group of groE mutants), and in another, the deletion extended to both the 60 kDa and the second gene, with no rescue of phage growth on any of the groE mutants. When the groE insert in the transducing phage was reversed in orientation and the same deletion analysis carried out, now the second gene was deleted in one group and both genes in the more extended group.
To identify the putative second gene product, the various deleted transducing phages were transduced into UV-irradiated bacteria and the phage-encoded protein products observed – as predicted, when the 60 kDa-encoding sequence was deleted, no 60 kDa product was observed. A second ~15 kDa product was also observed, which was absent when the corresponding region of the sequence was deleted. Further phage mutants affecting the second product were isolated, and one phage directed a 15 kDa product with an altered pI, retaining the ability to rescue mutants affecting this region, supporting this as the product of the second groE gene. Based on the size of the products, the two products of the groE locus were assigned names of GroEL, for groE Large, and GroES, for groE Small, respectively. Interestingly, the phenotypes of both groEL and groES mutants were the same, indicating that the two products act at the same step of phage head morphogenesis.
GroEL and GroES are heat shock proteins
An abundant protein (called B56.5) originally observed in 2D gels by Herendeen et al. (Reference Herendeen, VanBogelen and Neidhardt1979) was soon shown by them to have a peptide map pattern identical to that of GroEL, allowing an understanding that GroEL was a heat shock protein whose abundance rose from ~1% of total cellular protein in the basal state to ~12% of total cell protein at 45 °C (Neidhardt et al., Reference Neidhardt, Phillips, VanBogelen, Smith, Georgalis and Subramanian1981). In the case of GroES, a species in 2D gel studies, C15.4, was matched with that encoded by transducing phage by peptide mapping and shown to be similarly heat induced (Tilly et al., Reference Tilly, VanBogelen, Georgopoulos and Neidhardt1983). Using DNA probes derived from both GroES and GroEL, Northern analysis identified a single 2200 base RNA from the groE locus, explaining the coordinate regulation of the two products.
GroEL and GroES interact with each other
Genetic interaction
Suppressors of GroES mutants temperature-sensitive for growth at 42 °C were isolated and tested for a mutation in GroEL via inability of such suppressors to propagate phage T4, known to require GroEL but not GroES for its biogenesis (Tilly and Georgopoulos, Reference Tilly and Georgopoulos1982). The reduced ability of T4 to propagate on the class of suppressor strains was rescued by a transducing lambda groE version deleted of GroES but encoding GroEL, indicating that suppression arose from a mutation in GroEL. At a biochemical level, a number of the suppressor mutants exhibited altered pI of the GroEL protein. Thus clearly the two products genetically interacted with each other.
Physical interaction of GroEL and GroES
In 1986, Chandrasekhar et al. (Reference Chandrasekhar, Tilly, Woolford, Hendrix and Georgopoulos1986) overproduced GroES from a plasmid bearing the groE promoter and contiguous GroES coding sequence, thus improving the expression by increasing copy number. Expression was further increased by incubating the cells at heat shock temperature. GroES was then purified through a series of chromatographic steps. Notably, on sizing columns or in glycerol gradients, native GroES migrated as a 70–80 kDa protein, larger than the mass predicted from its coding sequence (10.5 kDa, the sequence cited as unpublished at the time). Negative stain EM revealed ‘donut-shaped’ structures, with rotational symmetry, a diameter of ~8 nm and a ‘hole’ of ~2 nm. Because GroES exhibited no ATPase activity, interaction could be assessed via an effect on the ATPase activity of purified GroEL: this revealed that increasing concentrations of GroES relative to GroEL progressively inhibited ATPase activity of GroEL, with a maximum of ~50% inhibition observed at what was indicated to be a 2:1 molar ratio of GroES subunits to GroEL subunits [this would later be corrected by studies of Gray and Fersht (Reference Gray and Fersht1991) and Todd et al. (Reference Todd, Viitanen and Lorimer1993), to 1:2, i.e. one GroES heptamer per GroEL tetradecamer]. Note, however, that the relative levels of GroES7 to GroEL14 in E. coli are estimated to be 2:1 (Lorimer, Reference Lorimer1996). Physical interaction of GroES with GroEL was demonstrated in glycerol gradients, with a fraction of GroES molecules comigrating with the larger (840 kDa) GroEL when gradients were run in the presence of Mg-ATP (Fig. 10). Finally, radiolabeled GroES was found to associate with GroEL coupled to an Affi-Gel matrix in the presence but not the absence of Mg-ATP. In discussing the results, the authors concluded that GroEL and GroES must act at the same step of macromolecular metabolism.
Physical interaction of GroES with GroEL in ATP observed in glycerol gradient analysis. Reprinted with permission from Chandrasekhar et al. (Reference Chandrasekhar, Tilly, Woolford, Hendrix and Georgopoulos1986); copyright ASBMB, 1986.

Potential actions of GroEL/GroES
Chandrasekhar et al. discussed the uncertainty of the action of GroEL/GroES. In the case of assembly of bacteriophage λ, they directed attention to what they considered to be a specific step that requires the groE components, involving the λB protein, which was known to form a head–tail connector piece (Tsui and Hendrix, Reference Tsui and Hendrix1980). In particular, Kochan and Murialdo (Reference Kochan and Murialdo1983) purified λB from λC-minus λE-minus cell extracts (blocked from prohead assembly). They observed GroEL associated with a small fraction of λB, migrating at 25 S, and concluded that GroEL could bind one or two λB monomers along a path to producing 25 S λB assemblies in vitro (for a contemporary consideration of λB as the groE-dependent substrate in λ biogenesis, see Georgopoulos, Reference Georgopoulos2006).
Chandrasekhar et al. also referred to DNA and RNA synthesis as another site of action, referring to a paper from Wada and Itikawa (Reference Wada and Itikawa1984), which showed by pulse-labeling experiments that temperature-sensitive groE mutants exhibited diminished DNA and RNA synthesis rates within 10–30 min of temperature shift, whereas translation rate was maintained in most of the mutants. Along these lines, as relates to DNA replication, Fayet et al. (Reference Fayet, Louarn and Georgopoulos1986), and in a companion paper Jenkins et al. (Reference Jenkins, March, Oliver and Masters1986), isolated a hybrid phage bearing an E. coli DNA fragment that could suppress a dnaA allele, dnaA46. The suppressing fragment turned out to bear the groE operon. DnaA had been implicated in the initiation of DNA replication at the oriC site in E. coli and, in these two reports, the temperature-sensitive phenotype of the dnaA46 allele could be suppressed by the increased expression of groE (by either increased chromosomal copy number through lysogenization or by supplying a multicopy plasmid), restoring oriC replication to normal. Georgopoulos and coworkers discussed that, in the same way as phage assembly required the action of groE, here, the assembly of replication initiation complexes might also require the groE products.Footnote 4
VII. Discovery of a plant chloroplast double-ring complex, the Rubisco subunit binding protein, with a role in the assembly of the abundant multisubunit CO2-fixing enzyme, Rubisco
Discovery of a complex
A study of Barraclough and Ellis (Reference Barraclough and Ellis1980) identified another higher molecular weight protein complex, composed of 60 kDa subunits, inside the chloroplast stroma, that was implicated in the assembly of the oligomeric chloroplast-localized CO2-fixing enzyme Rubisco. Rubisco enzyme in the chloroplast stroma of higher plants is a 16-mer composed of eight identical large subunits (55 kDa), encoded by the chloroplast genome and translated on chloroplast ribosomes, and eight identical small subunits, encoded in the nuclear genome as precursors that are post-translationally imported into chloroplasts and proteolytically processed to mature size (14 kDa) (e.g. Rutner, Reference Rutner1970; Blair and Ellis, Reference Blair and Ellis1973). In the 1980 study, Barraclough and Ellis (Reference Barraclough and Ellis1980) isolated chloroplasts from pea and radiolabeled newly-translated chloroplast proteins by the addition of 35S-methionine to the medium. With radiolabeling for an hour, they observed, in the analysis of lysed extract in a 5% non-denaturing gel, two major 35S-labeled species, a 600–700 kDa species that was very abundant by Coomassie staining, and mature Rubisco, the most abundant protein in the chloroplast, at ~500 kDa (Fig. 11a). With shorter-term labeling, only a single major radiolabeled species was produced in the opening minutes of labeling, migrating to the 600–700 kDa position. With radiolabeling extended to a half hour and beyond, the additional appearance of 35S-methionine in mature Rubisco (~500 kDa) occurred, suggesting that there might be a chase of large subunits from the 600–700 kDa binding protein into mature Rubisco (Fig. 11b; the latter production suggested to occur via a slow assembly of large subunits with a pool of non-labeled small subunits). When the 600–700 kDa band containing the ‘binding protein’ was excised and electrophoresed in an SDS denaturing gel, it migrated as a Coomassie-stained 60 kDa species. Similarly, in 3% non-denaturing gels, while newly-made Rubisco subunits migrated to a different position in the gel, they again comigrated with an abundant (Coomassie staining) species and, once again, after excision and fractionation in an SDS gel, the species produced a 60 kDa derivative. Thus, these observations supported the physical association of the newly-made Rubisco large subunit with a complex of the 60 kDa species, which was called the Rubisco large subunit binding protein.Footnote 5
(a) Synthesis of Rubisco in isolated pea chloroplasts. Soluble proteins recovered after a 1 h incubation of chloroplasts with 35S-methionine were separated on a non-denaturing acrylamide gel. Left lane: Coomassie-staining; right lane: autoradiograph of the lane; ‘Rubisco’ marks the position of mature L8S8 Rubisco. (b) Time-course of assembly of mature 35S-Rubisco in pea chloroplasts during incubation with 35S-methionine. Newly translated Rubisco large subunit appears to associate initially with (Rubisco) binding protein and then is increasingly incorporated into mature Rubisco. Adapted from Barraclough and Ellis (Reference Barraclough and Ellis1980), with permission from Elsevier, copyright 1980.

The behavior of the Rubisco large subunit binding protein complex in the oligomeric assembly of L8S8 Rubisco inside the chloroplast resembled the previously described role of the GroEL complex in directing the assembly of phage particles inside infected bacteria. Here, in the absence of the large subunit binding protein, Rubisco large subunits were subject to aggregation (e.g. Gatenby, Reference Gatenby1984), in the same way that λ phage heads formed ‘lumps’ in groE-deficient bacteria.
Oligomeric complex resembling GroEL in the soluble fraction of pea leaves
Along these same lines, in 1982, Pushkin et al. (Reference Pushkin, Tsuprun, Solovjeva, Shubin, Evstigneeva and Kretovich1982) identified a high molecular weight protein from young pea leaves that bore structure and ATPase activity resembling that of GroEL. In their purification procedure, leaves were placed in a tissue disintegrator under hypotonic conditions, so all of the chloroplast stroma, mitochondrial matrix, and cytosol would be obtained. Following subsequent calcium phosphate chromatography and gel filtration, the purified material was subject to negative stain EM. The same architecture as had been observed earlier for GroEL was obtained – two stacked sevenfold rotationally symmetric rings. A low level of ATPase activity was measured, similar to that of GroEL. A molecular weight of 900 ± 150 kDa was obtained by gel filtration, and in SDS-PAGE, a subunit molecular weight of 67 000 ± 3000 was obtained. These values could have been matched to the molecular weight of the already-described large subunit binding protein complex and subunit, linking structure to function. However, it was not until 1988 that the link between this complex and Rubisco biogenesis was made.
Role of ATP in the release of Rubisco large subunit from the binding protein
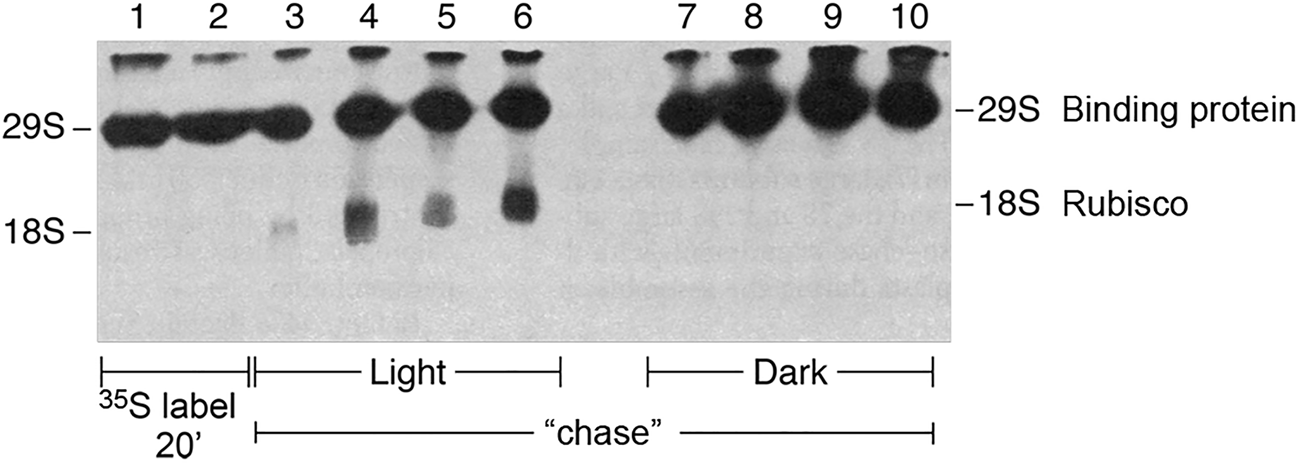
In 1983, Bloom et al. (Reference Bloom, Milos and Roy1983) showed that the complex between newly-translated Rubisco large subunits and the binding protein could be dissociated by MgATP. Two forms of the experiment were carried out. In one, isolated chloroplasts were allowed to translate radiolabeled large subunits for 20 min in the presence of light and 35S-methionine, then an excess of non-labeled methionine was added to halt the synthesis of radiolabeled subunits, and a chase was carried out in the presence or absence of light as the energy source. Extracts were then prepared and fractionated in a non-denaturing gel. In the presence of light, large subunits chased from the binding protein complex into mature Rubisco, whereas in the dark, the large subunits remained associated with the binding protein complex (Fig. 12). In a second experiment, similar 35S-methionine-radiolabeling with isolated chloroplasts was carried out for 30 min, the chloroplasts were then lysed in the presence or absence of added MgATP, and a soluble supernatant fraction analyzed in a non-denaturing gel. In parallel to the result with light, MgATP produced the release of radiolabeled large subunits from the binding protein, associated with the assembly into mature Rubisco enzyme, whereas in the absence of ATP, the Rubisco large subunits remained associated with the binding protein.Footnote 6
Assembly of Rubisco in intact chloroplasts requires light/energy. Non-denaturing gel displaying newly-translated 35S Rubisco. Release from the binding protein and assembly into mature Rubisco requires light/energy. From Bloom et al. (Reference Bloom, Milos and Roy1983).
Large subunit binding protein complex contains two subunit species
The large subunit binding protein was found to be composed of equal amounts of two subunits, termed α and β, of ~61 and ~60 kDa relative mobility, respectively, in SDS gels (Hemmingsen and Ellis, Reference Hemmingsen and Ellis1986; Musgrove et al., Reference Musgrove, Johnson and Ellis1987). Antibodies prepared to the two subunits recovered from SDS gels did not cross-react, and V8 partial digests of the subunits did not resemble each other (surprising considering that the subunits were later shown to be 50% identical and 78% similar to each other). The subunits were shown to be nuclear-encoded and translated as larger precursors via in vitro translation and immunoprecipitation.
Close relatedness of Rubisco binding protein α subunit and GroEL
When the α-subunit cDNA from the wheat Rubisco binding protein was isolated and its predicted amino acid sequence examined, it exhibited 46% identity to the predicted amino acid sequence of E. coli GroEL as reported by Hemmingsen et al. (Reference Hemmingsen, Woolford, van der Vies, Tilly, Dennis, Georgopoulos, Hendrix and Ellis1988). The amino acid identity distributed fairly uniformly across the two amino acid sequences, with many additional residues exhibiting conservative substitutions. Notably, however, a GGM repeat at the C-terminus of GroEL was not present in Rubisco binding protein α subunit. In light of the earlier EM study of Pushkin et al. (Reference Pushkin, Tsuprun, Solovjeva, Shubin, Evstigneeva and Kretovich1982), revealing a soluble plant protein complex with an architecture homologous to GroEL, the authors concluded that this complex must be Rubisco binding protein and that the binding protein must contain seven subunits per ring. The authors commented on the now-recognized presence of abundant double-ring tetradecamer complexes in three different ‘compartments’: GroEL in the bacterial cytoplasm, Rubisco binding protein in the chloroplast stroma, and a double-ring assembly of a heat shock protein of ~60 kDa identified by McMullen and Hallberg (Reference McMullen and Hallberg1987, Reference McMullen and Hallberg1988) inside the mitochondrial matrix, antibodies to which cross-reacted with GroEL (see page 20), noting the endosymbiotic relationship of these compartments and their resident double-ring complexes. They then commented on the putative action of these complexes, noting that they were associated with ‘post-translational assembly of at least two structurally distinct oligomeric complexes’, i.e. phage particles in the bacterial cytoplasm and Rubisco in the chloroplast stroma. The double-ring complexes fulfilled the definition of ‘chaperone’ via their ability to prevent inappropriate protein–protein interactions such as aggregation of phage heads, for example, or aggregation of Rubisco large subunits, and by not being present in the final assembled structure, e.g. not found in mature phage particles or in mature Rubisco. With the unique double-ring architecture, this family of chaperones was referred to as the ‘chaperonins’.
The authors further discussed ‘normal roles’ for chaperonins and revisited some of the commentaries from the Fayet et al. (Reference Fayet, Louarn and Georgopoulos1986) paper on DNA and RNA synthesis, commenting that such involvement could extend to DNA replication within the organelles. They expanded further with an idea ‘that the chaperonins (could) mediate the assembly of oligomeric complexes other than those involved in nucleic-acid metabolism.’
Assembly of two prokaryotic Rubisco enzymes in E. coli promoted by groE proteins
In January 1989, Lorimer and coworkers reported reconstitution in E. coli of the assembly and activity of expressed Rubisco coding sequences from Anacystis nidulans, a cyanobacterium containing an L8S8 Rubisco, and from Rhodospirillum rubrum, a proteobacterium with a simplified L2 Rubisco (Goloubinoff et al., Reference Goloubinoff, Gatenby and Lorimer1989a). In both cases, assembly and activity were promoted by overexpression of GroE proteins. Considering the close sequence and architectural relationship of the Rubisco binding protein and GroEL, as had been reported by Hemmingsen et al. (Reference Hemmingsen, Woolford, van der Vies, Tilly, Dennis, Georgopoulos, Hendrix and Ellis1988), the investigators had decided to test whether the function of GroEL and GroES might be sufficient to promote the assembly of active Rubisco from the two prokaryotic sources, with R. rubrum a particularly revealing consideration because of the simpler L2 dimer form of the holoenzyme.
In the case of A. nidulans, coexpression in E. coli of its L and S subunits from a lac promoter-bearing plasmid produced readily detectable Rubisco enzyme activity, increased 10-fold by overexpression from a second plasmid of the GroES–GroEL coding region (Fig. 13a), also regulated by a lac promoter. Notably, the amount of large subunits, measured by 35S-methionine radiolabeling (90 min) and SDS gel analysis (with band excised and counted) was not affected by GroES/GroEL overexpression, implying that the effect was on extent/efficiency of assembly of the subunits produced. This was corroborated by an at least eightfold increase in the level of 35S-labeled L8S8 species observed in a non-denaturing gel after the same period (Fig. 13a; species also excised and counted). GroES was required as well as GroEL, because a frameshift mutation of GroES in the overexpression plasmid blocked the increase of L8S8 assembly (despite a large amount of GroEL tetradecamers observed in the non-denaturing gel). Conversely, in cells expressing L and S subunits but with groE mutations affecting either GroES or GroEL, Rubisco activity was negligible and no L8S8 material could be detected in non-denaturing gels. Both activity and the L8S8 assembled species were restored, however, when the plasmid overexpressing GroES and GroEL was introduced into either groE-deficient strain. Finally, the effect of heat shock on assembly was measured, switching from 26 to 42 °C – this produced a fivefold increase of assembly of L8S8, as might be expected for the induction of GroES–GroEL by heat shock.
Overexpression of GroEL/GroES (+GroEL + GroES lanes) stimulates the assembly of an L8S8 Rubisco from Anacystis (a) or an L2 homodimer from R. rubrum (b) in intact E. coli co-expressing the respective Rubisco subunits. Assembly was scored both by the assay of Rubisco enzyme activity (top panels) and by the presence of assembled complex in non-denaturing gels of 35S-Met labeled cultures (middle panels). The same levels of expressed Rubisco large subunit (L) were present in the absence or presence of overexpressed GroEL/GroES (bottom panels). Adapted from Goloubinoff et al. (Reference Goloubinoff, Gatenby and Lorimer1989a), by permission from Springer Nature, copyright 1989.
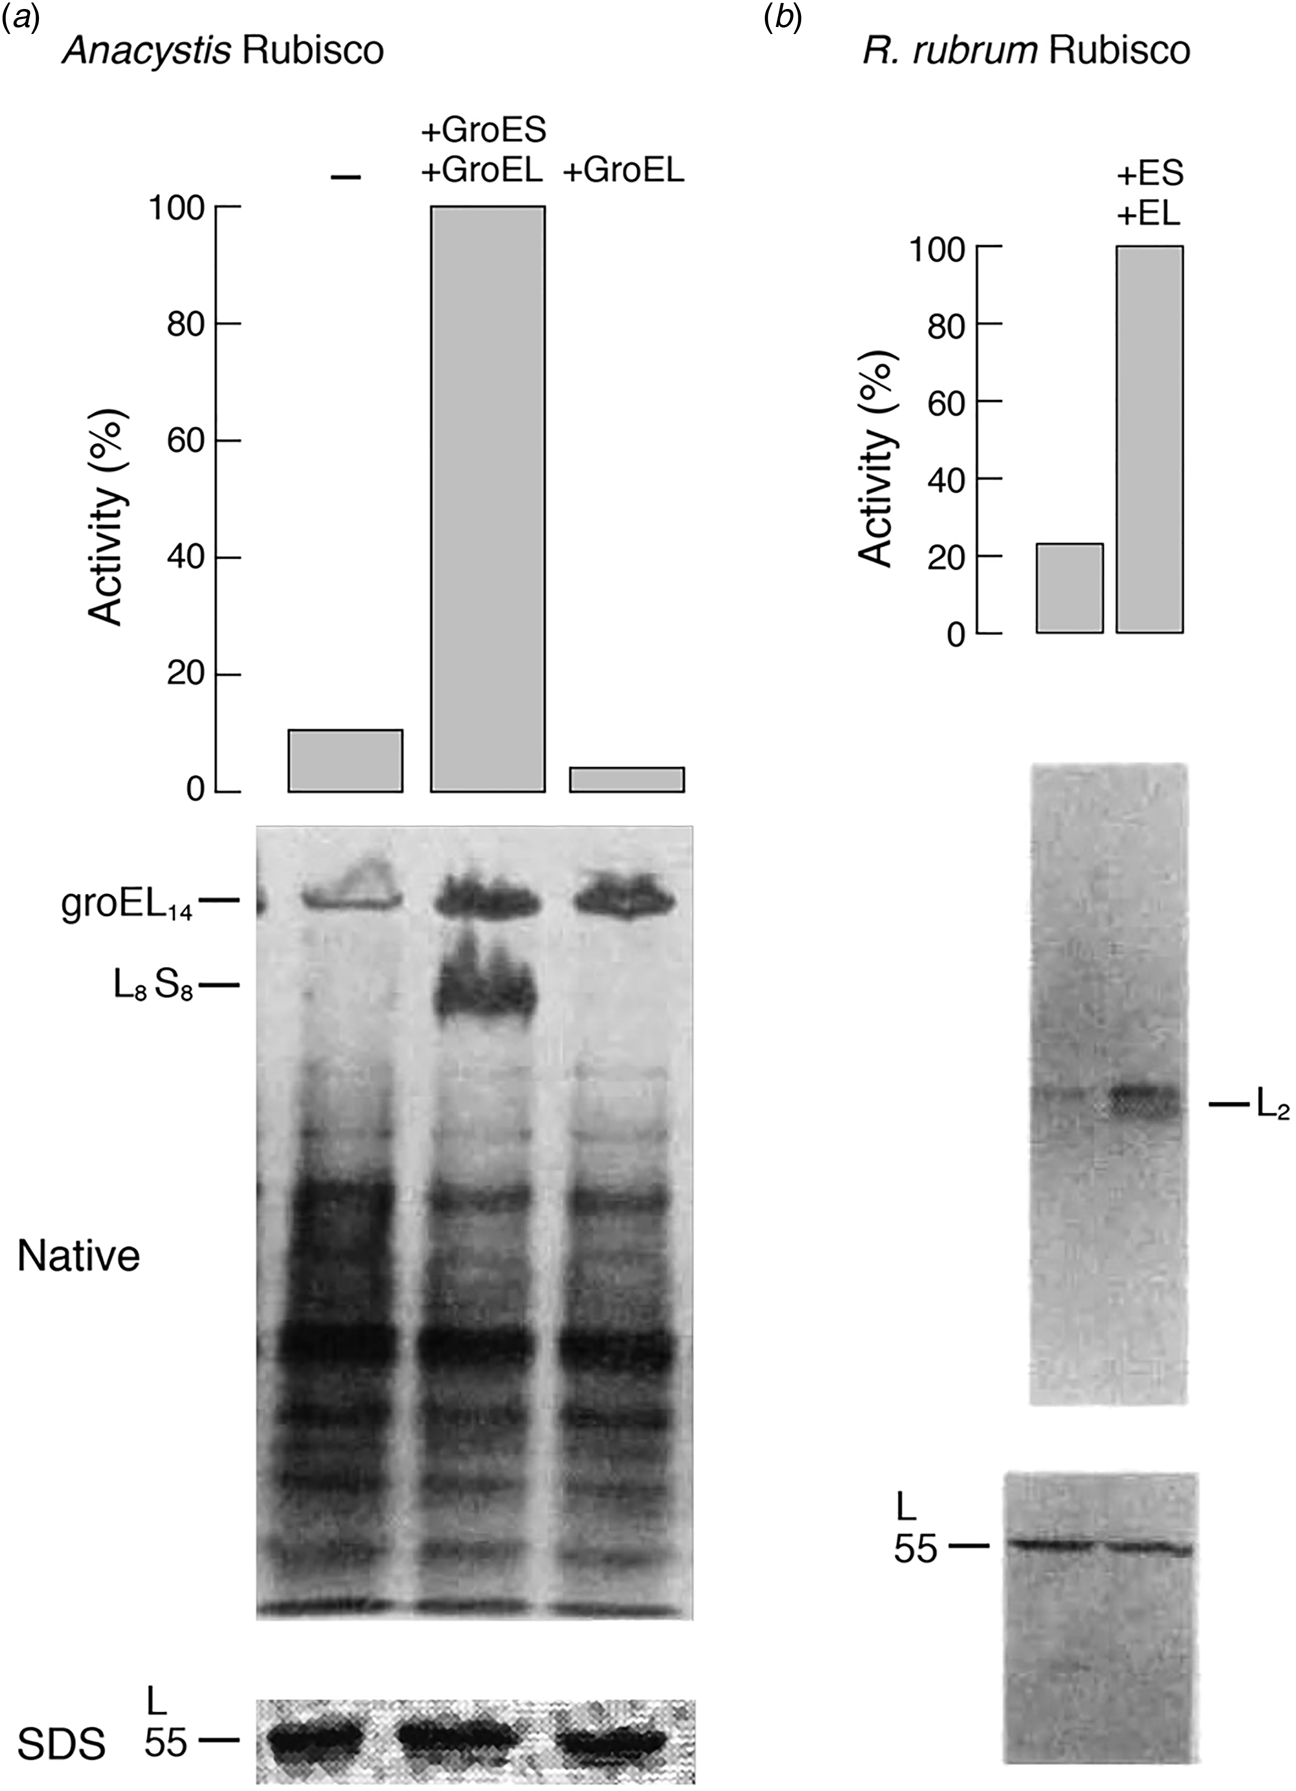
Because the L8 core of L8S8 Rubisco is formed of four dimers that resemble the R. rubrum dimer, R. rubrum was studied in the same fashion using a dual plasmid expression system. Here, a low level of activity was observed in a GroES-deficient strain and was increased fivefold by the overexpression of GroES–GroEL (Fig. 13b), corresponding to an increased level of assembled L2 in the presence of equal levels of the synthesized subunit. This suggested that the groE proteins were acting at the stage of (L2) dimer formation. This was speculated to possibly represent a minimal step of action of groE proteins, although it was discussed that neither a role in folding L or S subunits nor a role at later steps of assembly could be excluded. It was commented that involvement in the assembly of S subunits with L8 seemed unlikely, given a spontaneous association of S with L8 observed in vitro (Andrews and Ballment, Reference Andrews and Ballment1983). A conclusion was presented that ‘the primary structure of some oligomeric proteins is insufficient to specify spontaneous assembly into a biologically active form in vivo.’
VIII. The mitochondrial double-ring chaperonin, Hsp60, mediates folding of proteins imported into mitochondria
Yeast mutant affecting folding/assembly of proteins imported to the mitochondrial matrix
Imported mitochondrial proteins are translocated in an unfolded state; could there be assistance inside mitochondria to refolding imported mitochondrial proteins to their native forms?
In February 1989, Cheng et al. (Reference Cheng, Hartl, Martin, Pollock, Kalousek, Neupert, Hallberg, Hallberg and Horwich1989) presented studies of a mutant of yeast in which proteins imported into the mitochondrial matrix failed to reach the native form. These studies were prompted by the earlier observation from Eilers and Schatz (Reference Eilers and Schatz1986) that proteins translocating into mitochondria are required to occupy an unfolded state in order to traverse the membranes. In particular, Eilers and Schatz observed that a fusion protein joining an N-terminal mitochondrial targeting sequence (from yeast COX IV) with mouse DHFR could not translocate into mitochondria in the presence of the DHFR ligand MTX, which stabilizes the native form of DHFR, but could readily translocate in the absence of such a ligand, e.g. following dilution from denaturant. This conclusion raised a major question (as illustrated in Fig. 14): Are the unfolded proteins entering the mitochondrial matrix able to spontaneously refold to native form or are they assisted by a protein component to reach the native state?
Scheme of mitochondrial protein import to the matrix space and two possibilities concerning protein folding in the matrix space. Illustration shows that cytosolically translated precursor proteins are targeted to mitochondria by N-terminal cleavable peptides and, as shown by Eilers and Schatz (Reference Eilers and Schatz1986), occupy an unfolded state in order to cross the membranes. The question, circa 1987, was whether the mature size proteins fold to native form spontaneously in the matrix compartment, or whether they require assistance from a machine.

To address this question, Cheng, Pollock, and Horwich turned to a library of yeast mitochondrial import mutants they had been screening.
Production and screening of a library of temperature-sensitive yeast mutants for mutants affecting mitochondrial protein import
Design of a library of mitochondrial import mutants
The library was based on an assumption and on the use of a mitochondrial matrix-targeted reporter protein:
Assumption. The assumption was that a block of import or maturation of mitochondrial matrix proteins would block cell growth because no new mitochondria could be generated from the pre-existent ones. The route of generation of new mitochondria from pre-existent ones was considered the only route of formation, because de novo production of mitochondria had been excluded by earlier experiments (e.g. Luck, Reference Luck1965). Thus, within a collective of yeast temperature-sensitive ‘lethal’ mutants, which halt growth upon the shift from 23 to 37 °C, there would potentially be a group of mitochondrial protein import mutants.
Reporter. The reporter was a mitochondrial matrix protein whose precursor was programmed for inducible expression after the shift to 37 °C. It could indicate the step of import that is blocked, putatively involving such steps as recognition by a mitochondrial membrane ‘receptor’, translocation across the membranes, or proteolytic cleavage of the N-terminal signal peptide.
For the reporter enzyme, the investigators selected a human mitochondrial matrix enzyme, the homotrimeric hepatic urea cycle enzyme ornithine transcarbamylase (OTC). The normal homotrimeric yeast OTC enzyme (encoded by the ARG3 gene) is cytosolic and dispensable to cell growth so long as arginine is supplied in the medium. It was disabled in the starting strain by crossing in an arg3 mutant allele, thus ensuring that the only OTC enzyme activity expressed in the resulting yeast strain would derive from induced human OTC precursor (preOTC) reaching the mitochondrial matrix, being proteolytically processed to its mature form, and assembling into the homotrimer. Notably, neither non-cleaved preOTC nor unassembled mature-sized subunit is enzymatically active (Kalousek et al., Reference Kalousek, Orsulak and Rosenberg1984). The preOTC (subunit precursor) was programmed for inducibility by joining the encoding cDNA with a yeast GAL1 operon promoter and inserting the fusion into the yeast genome. The GAL1 promoter enabled the repression of preOTC expression when cells were grown in glucose (or ethanol–glycerol) and induction by galactose. Expression of OTC by this system in an arg3 yeast strain had been examined by Cheng et al., observing that galactose induction produced human preOTC that was translocated into mitochondria, underwent proteolytic removal of its signal peptide, and assumed the same native active homotrimeric state as in liver mitochondria (Cheng et al., Reference Cheng, Pollock, Hendrick and Horwich1987).
Screen and initial mitochondrial import mutants
The screen for mitochondrial import mutants was carried out following ENU mutagenesis of the GAL-preOTC arg3 strain. Temperature-sensitive (ts) mutants were identified by replica plating colonies at 23 and 37 °C and selecting ones that failed to grow at 37 °C. These were then screened in the temperature shift assay, simultaneously shifting to 37 °C and inducing preOTC by transfer into galactose-containing medium, then assaying extracts after 2 h for the production of OTC enzymatic activity as a determinant of whether mitochondrial import was the step affected. Lysates from those ts strains that failed to produce OTC enzyme activity (~10% of the ts strains) were then Western blotted for the production of the OTC subunit (excluding OTC null mutants, which could putatively affect transcription or translation steps), examining whether the OTC subunit had been cleaved to mature form. The initial screen identified a number of mutants that failed to produce the activity and displayed only preOTC in Western blot analysis. These mutants were subsequently shown, with collaborative assistance from Neupert and coworkers, to affect the mitochondrial processing peptidase (MPP) (the large and catalytically active subunit of the heterodimeric protease, 52 kDa; and the smaller activity-enhancing subunit, 48 kDa, known as the processing enhancing protein, that is structurally related; Pollock et al., Reference Pollock, Hartl, Cheng, Ostermann, Horwich and Neupert1988; see also Jensen and Yaffe, Reference Jensen and Yaffe1988). Particularly reassuring in the study of the MPP mutant was that its gene was found to be essential for cell viability (i.e. a gene knockout could not grow), fulfilling the assumption originally made that import mutants would be growth-arrested (lethal).
Mutant affecting refolding/assembly of OTC imported into the mitochondrial matrix
During further library screening, the question arose as to whether there could be a mitochondrial import mutant that affected the refolding of proteins translocated to the matrix compartment (Fall, 1987). Here, one would predict that there would be no OTC enzyme activity achieved, despite the translocation of the polypeptide into the matrix space and despite conversion to a mature form by removal of the signal peptide. Further examining the mutant library, one mutant had produced a strong immunoblot signal of mature OTC subunit in the face of no enzymatic activity. This was the 143rd tested temperature-sensitive mutant (called α143, α designating mating type). This mutant ultimately became known as the mif4 mutant, or mitochondrial import function 4.
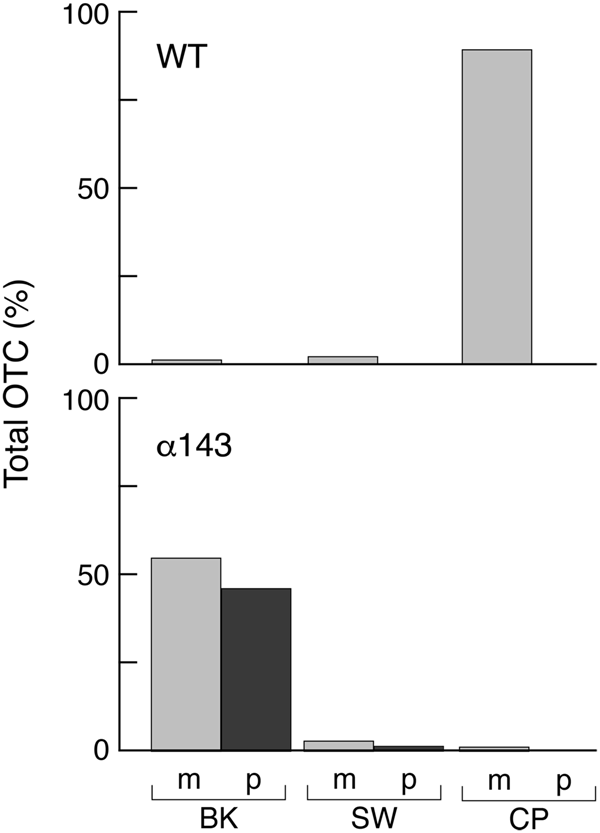
To directly assess the assembly state of OTC subunits in the mutant, an extract was applied to a substrate affinity column containing PALO, δ-N-phosphono-L-ornithine (Kalousek et al., Reference Kalousek, Orsulak and Rosenberg1984). This column quantitatively binds OTC enzyme from mammalian liver extracts and likewise quantitatively bound OTC from the non-mutagenized GAL-preOTC induced parental yeast strain. After a salt wash, the bound OTC was eluted by application of the substrate carbamyl phosphate (Fig. 15). In contrast, when the mif4 extract was applied to the PALO column, the OTC subunits failed to be retained, eluting in the flow-through fraction. Thus, as might be expected if imported monomeric subunits had failed to fold, they failed to assemble into the active homotrimer.
α143 yeast cells (mif4) shifted to 37 °C fail to assemble expressed OTC into native homotrimer that can be captured by a PALO substrate analogue affinity column. The OTC subunits were identified by Western blotting. In WT yeast cells (top), the expressed and imported OTC subunits are quantitatively bound by PALO and elute with the substrate carbamyl phosphate (CP). In α143 cells (bottom), the subunits fail to bind and elute in the breakthrough (BK) fraction. SW, salt wash fraction. From Cheng et al. (Reference Cheng, Hartl, Martin, Pollock, Kalousek, Neupert, Hallberg, Hallberg and Horwich1989).
mif4 mutant affects folding/assembly of endogenous yeast F1β subunit and folding of Rieske iron-sulfur protein
F1β subunit
To assess an endogenous protein, its synthesis/maturation after temperature shift would need to be studied, for example, marking it by addition of 35S-methionine after temperature shift, thus distinguishing the newly-made radiolabeled protein produced at the non-permissive temperature from the pre-existing, normally folded, protein produced at the permissive temperature. One such protein examined was the β subunit of the F1ATPase, evaluated using chloroform extraction of the mitochondrial fraction (Beechey et al., Reference Beechey, Hubbaard, Linnett, Mitchell and Munn1975). In wild-type cells, 35S methionine-radiolabeled subunit produced after temperature shift assembled into the F1ATPase and partitioned to a significant extent to the aqueous phase of the extraction mixture, as detected by immunoprecipitation. Consistent with failure to fold and assemble in mif4 cells at the non-permissive temperature, no radiolabeled F1β subunit could be detected in the aqueous fraction after temperature shift of mif4.
Additional studies of imported mitochondrial proteins were carried out in collaboration with Hartl and Neupert, employing translation of radiolabeled precursors in reticulocyte lysate followed by incubation with mitochondria prepared from wild-type or mif4 yeast strains that had been shifted to 37 °C. Here, once again, F1β subunit reached its mature form and could incorporate into the aqueous phase of a chloroform extract of wild-type but not mif4 mitochondria (Fig. 16a).
Assembly/folding of two other mitochondrial matrix proteins is affected when the in vitro translated 35S-labeled precursors are imported into α143 mitochondria isolated from 37 °C-shifted cells. (a) The β-subunit of F1ATPase fails to be extracted into the aqueous phase (A) upon chloroform extraction – all of the F1β is recovered in the chloroform phase (C). (b) Rieske iron–sulfur protein precursor, a monomer during its lifetime in the matrix space, fails to reach mature form (m) in α143 cells as compared with WT, despite translocation to a proteinase K-protected matrix location. The precursor imported into α143 cells remains either uncleaved (p) or once-cleaved to an intermediate form (i). From Cheng et al. (Reference Cheng, Hartl, Martin, Pollock, Kalousek, Neupert, Hallberg, Hallberg and Horwich1989).

Rieske Fe/S protein
Further informative were studies of the Rieske Fe/S protein, a component of the cytochrome bc1 complex of the mitochondrial inner membrane (complex III). The precursor of this protein had been shown to translocate first to the matrix space, where proteolytic maturation involved two steps, before inserting into the inner membrane (Hartl et al., Reference Hartl, Schmidt, Wachter, Weiss and Neupert1986). First, the N-terminal portion of its presequence is cleaved by the matrix-localized MPP, producing an intermediate species that is matrix-localized. This intermediate then undergoes a second cleavage step mediated by a second matrix-localized mitochondrial intermediate peptidase, which removes the last eight residues of the presequence. Most importantly, as concerns this maturation pathway, the intermediate species is soluble and an apparent monomer (Hartl et al., Reference Hartl, Schmidt, Wachter, Weiss and Neupert1986). Thus, misbehavior in mif4 would potentially identify an effect on polypeptide chain folding. When the radiolabeled Rieske protein precursor was imported into wild-type mitochondria, it underwent both processing events to form a mature species (Fig. 16b). (A portion was detected in intermediate size, apparently undergoing only the first step of processing.) However, when the Rieske protein precursor was imported into mif4 mitochondria, no mature species was observed, only precursor and the once-cleaved intermediate species. This suggested that the imported species could not maintain conformation necessary to undergo steps of proteolytic maturation. The investigators concluded that a component ‘conferring conformational competence’ was affected in the mif4 strain.
mif4 mutation does not affect the translocation of precursors to the matrix compartment
Notably, the experiments with isolated mitochondria excluded a defect of protein translocation into mitochondria in the mif4 mutant. That is, if precursor proteins were becoming trapped in an import site, the N-terminal presequence entering the matrix might undergo cleavage but the subsequent sequence might remain in the translocation site. The C-terminal region would thus still be exposed in the cytosol where it would be susceptible to degradation by exogenously added proteinase K (PK). This possibility was excluded, however, by observation of full protection from protease added after import reactions into mif4 mitochondria, resembling that with wild-type mitochondria. That is, the mature form of F1β as well as the precursor and intermediate forms of Rieske Fe/S protein were fully protected from the exogenous protease, indicating that translocation had been completed.
Identification of a mitochondrial matrix heat shock protein of ~60 kDa as the component affected in mif4 yeast
To identify the gene affected in mif4 yeast, the strain was transformed with a library of plasmids containing yeast genomic DNA segments and a centromere (CEN) segment to maintain a single copy. A single recurring genomic DNA insert produced rescue and was sequenced. The open reading frame predicted an ~60 kDa protein, and it hybridized to a 2–3-fold heat-inducible yeast RNA of ~1800 nucleotides in Northern blot analysis. Both the size of the predicted protein and the heat inducibility of its message suggested that this might correspond to a mitochondrial heat shock protein that had been reported by McMullen and Hallberg (Reference McMullen and Hallberg1987, Reference McMullen and Hallberg1988).
Preceding identification of a heat shock protein in mitochondria
In the 1987 study, McMullen and Hallberg identified a 58 kDa protein in the ciliated protozoan, Tetrahymena thermophila, whose abundance was increased 2–3-fold by heat shock (42 °C). In purifying this protein, it was observed to sediment as a larger molecular weight homooligomer of 20–25 S, from extracts of both normal cells and heat-shocked ones. The species excised from an SDS gel was employed to produce antibodies, which revealed by immunoblot analysis that there was a substantial level of the protein present even in the absence of heat shock (estimated at 0.1% total cell protein). Immunofluorescence analysis indicated that, both before and after heat shock, the protein exhibited a mitochondrial pattern, and it cofractionated in isopycnic sucrose gradients with mitochondria. In a further report in 1988, the anti-hsp58 antibody identified a similar-sized protein in yeast (S. cerevisiae), Xenopus laevis, maize, lung carcinoma cells, and E. coli. The bacterial species was observed to be at least fivefold heat induced, and it sedimented as a larger molecular mass complex at 20 S, properties noted to resemble those of GroEL. To support such an assignment, 20 S particles from both T. thermophila and yeast mitochondria were examined in EM and revealed the same double-ring tetradecamer architecture that had been observed for GroEL (Hendrix, Reference Hendrix1979; Hohn et al., Reference Hohn, Hohn, Engel, Wurtz and Smith1979). McMullen and Hallberg discussed that the role for this mitochondrial protein at elevated temperature might resemble that described by Pelham for Hsp70 (reversing incipient protein aggregation), but that the function under normal conditions remained unknown.
Yeast gene rescuing mif4 and the gene encoding the yeast mitochondrial heat shock protein homologue are identical
Cheng thus proceeded (Summer, 1988), with the sequence of the yeast gene rescuing mif4 cells in hand, to contact Hallberg to compare her sequence with the one he was obtaining from clones identified by screening a λgt11 yeast library with the anti-hsp58 antiserum. An exact match of the coding sequence was obtained. Thus, the altered yeast gene affecting the folding of imported non-native mitochondrial proteins encoded the chaperonin ring assembly of mitochondria identified by McMullen and Hallberg. The collective of investigators dubbed the component Hsp60.
Sequence analysis of the entire open reading frame of the yeast protein revealed 572 codons (Cheng et al., Reference Cheng, Hartl, Martin, Pollock, Kalousek, Neupert, Hallberg, Hallberg and Horwich1989; Reading et al., Reference Reading, Hallberg and Myers1989). Beginning with codon Lys25, there was homology with Rubisco binding protein and with GroEL, amounting to 43% and 54% amino acid identity, respectively (allowing for a few small insertions/deletions), with the non-identical sequences showing a considerable similarity of amino acids. The predicted initial amino acids of Hsp60 were unique and were readily identified as exhibiting features of a mitochondrial matrix targeting peptide, containing six arginine residues, no acidic residues, and four ser/thr residues, typical features of a matrix targeting sequence (von Heijne, Reference von Heijne1986). Amino terminal sequence analysis of mature-sized Hsp60 from yeast mitochondria indicated cleavage of the presequence by MPP after residue 21. Thus an ~60 kDa mature-sized product was predicted. At the predicted C-terminus, yeast Hsp60 contained the same repeating GGM motif observed in GroEL.
Hsp60 essential under all conditions (and, similarly, GroE proteins)
Deletion of the yeast Hsp60 gene by both Cheng et al. (Reference Cheng, Hartl, Martin, Pollock, Kalousek, Neupert, Hallberg, Hallberg and Horwich1989) and Reading et al. (Reference Reading, Hallberg and Myers1989) showed the gene to be essential at all temperatures. Thus the Hsp moniker was somewhat misleading, because it is apparent that the kinetic assistance to the folding of imported proteins provided by Hsp60 is required even under normal conditions. Correspondingly, a month after the Cheng et al. publication appeared, a publication from Fayet et al. showed that GroES and GroEL are both essential for bacterial growth at all temperatures (Fayet et al., Reference Fayet, Ziegelhoffer and Georgopoulos1989; see footnote 7 regarding deletion construction in yeast and E. coli).Footnote 7
Effect of mif4 mutation on Hsp60
The effect of the mif4 mutation on the behavior of mitochondrial Hsp60 was investigated by Cheng et al. (Reference Cheng, Hartl, Martin, Pollock, Kalousek, Neupert, Hallberg, Hallberg and Horwich1989), and it was observed that within 2 h of temperature shift, the Hsp60 complex itself became completely insoluble, pelleting from cell extracts at 15 000 × g × 15 min, as opposed to remaining entirely in the soluble supernatant of extracts from mif4 cells growing at 25 °C. The mutation in the coding region of mif4 Hsp60 was identified by cloning and sequencing, altering Gly 298 to Asp (M Cheng, S Caplan, AH (1990), unpublished; Dubaquié et al., Reference Dubaquié, Looser, Fünfschilling, Jenö and Rospert1998). This lies in a motif, LTGGTV, that is shared with bacterial GroEL (aa295–300) and proved, upon determination of the GroEL crystal structure (Braig et al., Reference Braig, Otwinowski, Hegde, Boisvert, Joachimiak, Horwich and Sigler1994), to lie in a long loop segment (aa296–320 in GroEL sequence) at the very distal aspect of the apical domains of the subunits near the cavity inlet. How this alteration of a single amino acid mediates insolubility of the entire pre-existent 840 kDa Hsp60 complex in the mitochondrial matrix remains a mystery. There seems to be an absence of other examples of large assemblies such as ribosomes or multimeric enzymes behaving in this temperature conditional fashion in response to a single residue substitution.
IX. Complex formation of several imported proteins with Hsp60 in Neurospora mitochondria and ATP-directed release
Folding of imported DHFR, measured by protease resistance, is ATP-dependent
In September 1989, Ostermann et al. (Reference Ostermann, Horwich, Neupert and Hartl1989) reported studies of a number of mitochondrial precursors imported into isolated N. crassa mitochondria. A first experiment involved the import of a fusion protein joining the 69 residue N-terminal targeting peptide of F0 subunit 9 with mouse DHFR (Su9-DHFR). The precursor was translated in reticulocyte lysate in 35S methionine, unfolded in urea, and then diluted into a mixture containing isolated N. crassa mitochondria. The import reaction was carried out for various times, and the reaction was quenched, by both collapsing the mitochondrial electrochemical gradient (adding antimycin A and oligomycin) and dropping the temperature by addition of a cold dilution buffer. PK (25 µg ml−1) treatment then removed any precursor that had not been imported into the organelles. Following inactivation of PK with PMSF, mitochondria were recovered by centrifugation, digitonin-treated to permeabilize them, and the sample was split. Half was directly analyzed, indicating the amount of DHFR imported into the organelles, and half was further treated with PK (10 µg ml−1) to determine the extent to which DHFR had folded to native form by its resistance to PK. The fusion protein was observed to be rapidly translocated (90% in 45 s). At that time point, however, only ~30% of the imported DHFR was PK-resistant. By 180 s, however, ~70% of the imported protein reached the resistant state. While lowering the temperature of the import reaction to 10 °C had little effect on translocation, it significantly slowed the rate of refolding. Addition of apyrase to the import mixture also did not interfere with import but abolished acquisition of protease resistance of the imported protein, indicating that the folding step was ATP-dependent. The addition of non-hydrolyzable analogue AMP-PNP likewise only weakly supported folding.
Imported DHFR, Rieske Fe/S protein, and F1β subunit co-fractionate with Hsp60
When the imported Su9-DHFR in the digitonin extracts was examined in S300 gel filtration chromatography, it was observed that the extracts from apyrase- and AMP-PNP-treated import mixtures exhibited significant percentages of the protein in high molecular weight fractions that corresponded to the position of Hsp60 by immunoblotting, and that the Su9-DHFR in these fractions was more sensitive to PK digestion as compared with Su9-DHFR in the lower molecular weight fractions (Fig. 17, –ATP). This suggested that the fraction of imported Su9-DHFR that did not reach a protease-protected form in the absence of ATP was bound to Hsp60. Similarly, when the Rieske Fe/S protein precursor or pre-F1β was imported in apyrase-treated import mixtures, they also were found in high molecular weight fractions of digitonin extracts that contained Hsp60. In the case of Fe/S protein, immunoprecipitation with anti-Hsp60 brought down ~45% of the Fe/S protein imported in the absence of ATP, directly supporting the physical association.
ATP-dependent release of imported 35S-labeled Su9-DHFR from mitochondrial Hsp60 in digitonin extracts of N. crassa mitochondria. After import, matrix-containing digitonin extracts were prepared and incubated in the absence (left) or presence (right) of ATP, then chromatographed on an S300 gel filtration column. Half of each fraction was treated with proteinase K to assess for the native state by protection, then analyzed by SDS-PAGE. Hsp60 elutes in fractions 2–4, mature Su9-DHFR in fractions 5–7. Note that Hsp60-associated Su9-DHFR (left panel) is sensitive to proteinase K, reflecting a non-native state, but upon ATP-driven release, it becomes proteinase K resistant. Taken from Ostermann et al. (Reference Ostermann, Horwich, Neupert and Hartl1989).
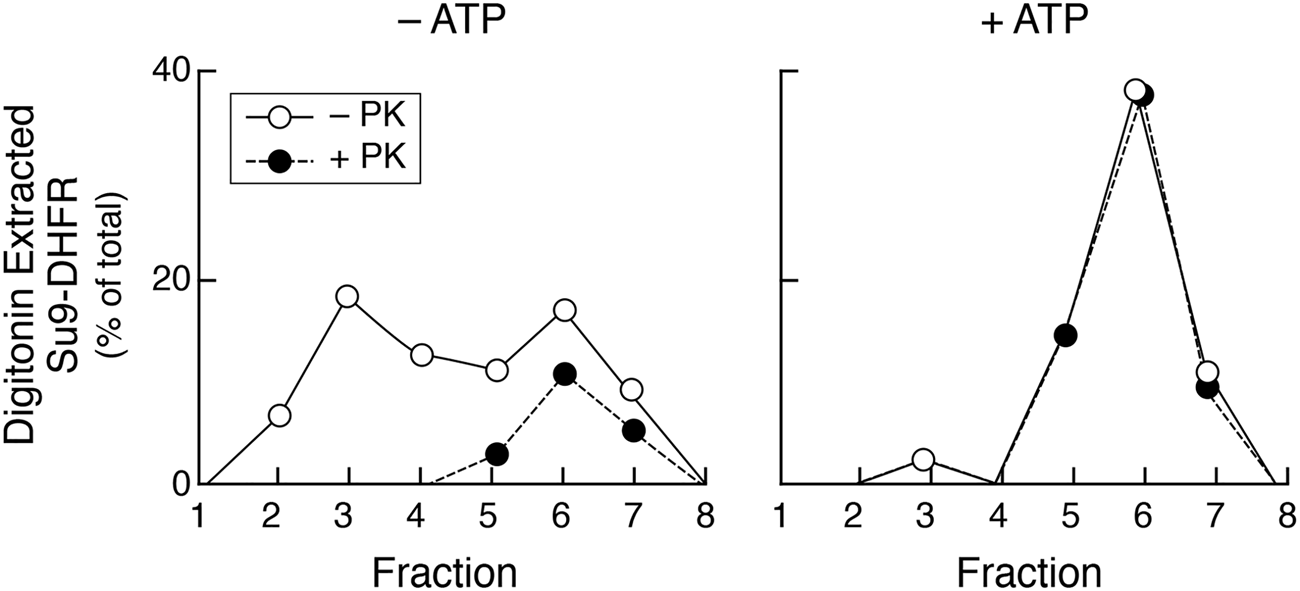
The Su9-DHFR species present in the high molecular weight fraction of the digitonin extract of apyrase-treated import mixtures could be released from the apparent association with Hsp60 by addition of ATP to the extract, such that the protein now migrated as a lower molecular weight species that had acquired full protease resistance (Fig. 17, +ATP). Neither AMP-PNP nor GTP could support such release/folding. This further supported an ATP-dependent folding process mediated by Hsp60.
In the discussion, the investigators stated that ‘ATP hydrolysis allows folding and release from Hsp60.’ Concerning the specific folding action of Hsp60, the investigators amplified the statements from Cheng et al. (Reference Cheng, Hartl, Martin, Pollock, Kalousek, Neupert, Hallberg, Hallberg and Horwich1989) that Hsp60 mediates de novo polypeptide chain folding, here observed with monomeric DHFR, distinguishing folding from the steps of oligomeric protein assembly, which was conjectured to potentially occur spontaneously following the release of folded subunits from Hsp60. Finally, the extrapolation was drawn from a de novo folding function in mitochondria by Hsp60, involving imported proteins, to a similar function by GroEL in the bacterial cytoplasm, involving newly-translated proteins.
X. Reconstitution of active dimeric Rubisco in vitro from unfolded subunits by GroEL, GroES, and MgATP
In December 1989, Lorimer and coworkers reported on the reconstitution of the activity of homodimeric R. rubrum Rubisco from unfolded subunits using purified GroEL, GroES, and MgATP (Goloubinoff et al., Reference Goloubinoff, Christeller, Gatenby and Lorimer1989b). This was in followup to the early 1989 paper from Lorimer and coworkers, referred to above, that implicated a facilitating action of overexpression of GroEL and GroES in cells on recovery of active dimeric Rubisco at a point in the pathway of biogenesis lying somewhere between the unfolded state and the formation of the folded L2 dimer, nominally either the folding of the subunit or the step of dimerization.
Unfolded Rubisco as substrate, and recovery of activity by GroEL/GroES/MgATP
To test the role of purified GroEL/GroES in vitro, unfolded forms of R. rubrum L subunit were prepared as a substrate. Either 8 M urea or 6 M guanidine-HCl was able to completely unfold Rubisco L subunits as shown by far UV CD analysis, whereas acid (0.1 M glycine, pH 3) produced partial unfolding (residual far UV signals). Various attempts to spontaneously recover Rubisco activity directly from any of these mixtures (at 25 °C) were unsuccessful, whereas their dilution into solutions containing GroEL, GroES, and MgATP produced recovery of up to 80% activity in the case of the chemical denaturant-unfolded Rubisco and 40% in the case of the acid-unfolded, with a half-time for recovery from all of the denaturants of ~5 min (Fig. 18a). The refolding mixture contained 70 nM Rubisco, ~300 nM GroEL tetradecamer, and ~1000 nM GroES heptamer, in 2 mM ATP, 12 mM MgCl2, at 25 °C. Both GroEL and GroES were required for recovery, as was MgATP [the reaction was quenched by addition of hexokinase (HK)/glucose]. Because the rate constants for recovery from both the chemical and acid denaturants were the same, the investigators argued that the chemically-unfolded Rubisco was being rapidly converted upon removal of denaturant to an intermediate state with a secondary structure resembling the acid-unfolded form, prior to the reaction with GroEL/GroES. They also observed a lag phase to the chaperonin-mediated recovery of Rubisco enzyme activity (~40 s; Fig. 18b), and suggested that, because the reaction involved a concentration-independent step of L subunit folding followed by a concentration-dependent one of dimerization of folded L subunit monomers, the lag phase would be due to the assembly process, requiring the build-up of folded monomers. With apparent input of unfolded monomers and a requirement for the build-up of folded monomers before production of active dimers, this placed the likely action of GroEL/GroES at the level of polypeptide chain folding.
(a) Time-course of recovery of native active Rubisco after unfolding in different denaturants and dilution into mixtures containing GroEL/GroES/MgATP at 25 °C. (No spontaneous recovery of Rubisco activity occurs under these conditions, and GroEL, GroES, and MgATP were all required.) Despite the lower yield from acid, the rates of all three reactions are the same, supporting the presence of a common intermediate that precedes the same chaperonin-dependent rate-limiting step. (b) A lag phase is seen in the recovery of activity from refolding of 250 nM Rubisco, reflecting that chaperonin-refolded monomers must subsequently dimerize to form active Rubisco. Adapted from Goloubinoff et al. (Reference Goloubinoff, Christeller, Gatenby and Lorimer1989b), by permission from Springer Nature, copyright 1989.

GroEL/Rubisco binary complex formation – competition with off-pathway aggregation
In studies of concentration-dependence, optimal recovery was achieved when GroEL and GroES were approximately equimolar, with higher concentrations of GroEL relative to GroES producing diminished extent of recovery (in a 1 h reaction at 25 °C). When varying the concentration of input unfolded Rubisco, at low concentration (3 nM subunit) recovery was limited, likely due to the low concentration of folded subunits available for assembly. It seemed that the optimal molar ratio for efficient recovery was ~3–4:1 GroEL14:Rubisco L monomer (here, specifically ~200 nM GroEL14 and 50 nM Rubisco). At a higher relative concentration of Rubisco there was also reduced recovery, explained by the investigators as most likely related to the inability of GroEL to efficiently capture the unstable intermediate(s) formed upon dilution from denaturant, i.e. failure of GroEL binding to successfully compete with off-pathway aggregation. This was elegantly shown by a ‘delay’ experiment in which Rubisco was first diluted from guanidine denaturant into a buffer mixture and incubated for varying times (5–60 s; 25 °C), after which GroEL was then added. Recovery was subsequently measured by addition of GroES (with MgATP already present) (Fig. 19). For three different concentrations of Rubisco, it was observed that the longer the Rubisco was incubated before adding GroEL, the lower the recovery of activity upon adding GroES and MgATP, with essentially zero recovery if incubation was carried out for a minute with the two highest concentrations of Rubisco. This supported a model of competition between binding to GroEL (lying on an ultimately productive pathway) and irreversible aggregation of Rubisco subunits.
Delay experiment showing that, following dilution of Rubisco from denaturant, there is a competition between binding to GroEL, attended by productive folding (when ATP/GroES are subsequently added), and irreversible aggregation. The greater the concentration of Rubisco subunits, the less recovery is observed for a given delay time, reflecting the concentration-dependence of the aggregation process. Adapted by permission from Springer Nature from Goloubinoff et al. (Reference Goloubinoff, Christeller, Gatenby and Lorimer1989b), copyright 1989.

GroES/MgATP-mediated discharge
The delay experiment, because GroES had been added at a later time relative to the addition of GroEL, supported that the binary complex formed between GroEL and the Rubisco intermediate was stable and apparently latent (GroEL/Rubisco did not produce Rubisco activity until MgATP/GroES were added). The stable complex was directly observed by native gel analysis, applying binary complex and probing the native gel in Western analysis with anti-Rubisco antibody and anti-GroEL antibody (Fig. 20). A discrete species near the top of the gel was identified as the binary complex by reactivity with both antibodies. When GroES and MgATP had been added to the binary complex, Rubisco subunit no longer migrated to the position of GroEL but was now found at the position of the native L2 dimer (lane 7 of Fig. 20). This further demonstrated the productivity of the binary complex. Notably, neither GroES alone nor MgATP alone could support such discharge of Rubisco from the binary complex. The investigators concluded that the chaperonin reaction was ordered as observed in vitro, with binary complex formation followed by ‘the MgATP and cpn10-dependent discharge of folded and stable, but catalytically inactive, monomers, which subsequently assemble into active dimers.’ While any released folded monomer was not detected in this study, the inference of such a product seemed reasonable from the lag phase in the recovery of active Rubisco dimer.
GroES/ATP-mediated discharge/folding of Rubisco from the binary complex with GroEL. As shown in (a), lane 7, addition of GroES/MgATP produces Rubisco activity, and (b, c) this is associated with the release of Rubisco from the binary complex with GroEL. [Compare lane 3 (binary complex) or 6 (no MgATP) with 7 (complete reaction)]. Reprinted by permission from Springer Nature from Goloubinoff et al. (Reference Goloubinoff, Christeller, Gatenby and Lorimer1989b), copyright 1989.

In the discussion, the investigators commented on the ability of the GroEL/GroES system to support folding, here under conditions (25 °C) that were not at all supportive of spontaneous recovery. They further commented that GroEL from E. coli does not normally act on Rubisco, because that protein is absent from E. coli, and thus GroEL/GroES would not have specificity for Rubisco; there must be some property of the non-native state that would be recognized that is absent from the native state, the latter of which is not recognized by GroEL.
XI. Chaperonins in all three kingdoms – identification of chaperonins in the cytoplasm of archaebacteria and a related component in the cytosol of eukaryotes
The studies of the closely-related seven-membered stacked ring components, GroEL, Hsp60, and Rubisco binding protein, in the endosymbiotically related compartments of the bacterial cytoplasm, mitochondrial matrix, and chloroplast stroma, respectively, had revealed their apparent essential role in assisting protein folding to the native state. The question remained open as to whether chaperonins were also present in other cellular compartments, and, especially as concerns folding of newly-translated proteins, whether newly-translated proteins in the cytosol of archaebacteria and eukaryotes could be assisted by such assemblies.
Identification of a stacked double-ring particle in thermophilic archaebacteria
In July 1991, Phipps et al. (Reference Phipps, Hoffmann, Stetter and Baumeister1991) reported a stacked ring complex purified from membrane-free lysates of an extreme thermophilic archaebacterium that can grow at 100 °C, Pyrodictium occultum. In end views in negative stain EM, the complex exhibited eight-member rings of ~160 Å diameter with a central cavity of ~50 Å diameter. Side views of the similar complex from Pyrodictium brockii revealed the familiar chaperonin pattern of four striations and a height of ~150 Å (Fig. 21). Here, the striations (domains) at the waistline of the cylinder were particularly dense, making clear that the two rings were placed back-to-back, an arrangement already under consideration for GroEL (see Zwickl et al., Reference Zwickl, Pfeifer, Lottspeich, Kopp, Dahlmann and Baumeister1990). The investigators also isolated similar complexes from Thermoplasma acidophilum and Archaeglobus fulgidus, both thermophilic archaea. The purified P. occultum complex exhibited ATPase activity that was optimal and stable at 100 °C, corresponding to the growth maximum of the organism. The complex was composed of two subunit species of 56 and 59 kDa, and these were suggested to alternate within the rings (later demonstrated by Nitsch et al., Reference Nitsch, Klumpp, Lupas and Baumeister1997 and Ditzel et al., Reference Ditzel, Löwe, Stock, Stetter, Huber, Huber and Steinbacher1998). When the P. occultum cells were elevated to temperatures above 100 °C, effectively subjecting them to a heat shock, the two subunits became the two major proteins observed in lysates of the cells (see also Trent et al., Reference Trent, Osipiuk and Pinkau1990, referred to below). The investigators postulated that ‘the ATPase complex may represent a novel type of chaperonin related to members of the groEL/hsp60 family…’
Averaged negative stain EM images of the chaperonin isolated from Pyrodictium brockii. Eightfold symmetry with two strong central bands and two weaker terminal bands, suggesting back-to-back rings. Adapted with permission from Phipps et al. (Reference Phipps, Hoffmann, Stetter and Baumeister1991), copyright EMBO, 1991.
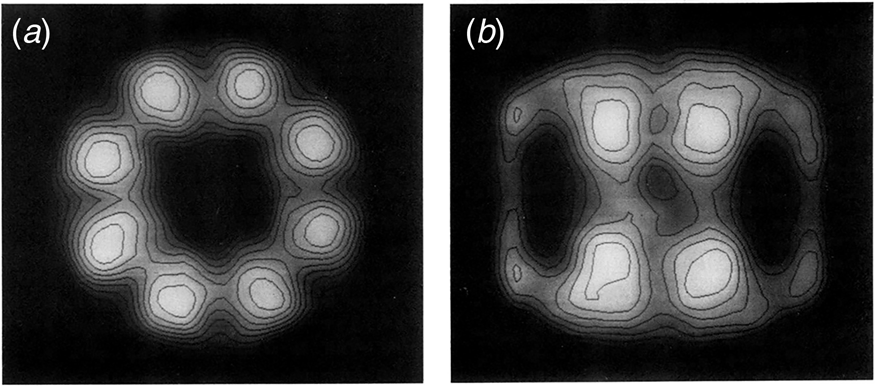
A further thermophilic archaebacterial particle and primary structural relationship to TCP-1, a conserved protein of the eukaryotic cytosol implicated in microtubule biology by yeast studies
In December 1991, Trent et al. (Reference Trent, Nimmesgern, Wall, Hartl and Horwich1991) reported on an additional archaebacterial complex from Sulfolobus shibatae, with similar architecture to the assemblies observed by Phipps et al., but with nine-membered rings. A single major heat-inducible 55 kDa subunit had been observed earlier by Trent et al. (Reference Trent, Osipiuk and Pinkau1990; two closely-related subunits were later observed by Knapp et al. (Reference Knapp, Schmidt-Krey, Hebert, Bergman, Jörnvall and Ladenstein1994), and a third in at least some Sulfolobus species by Archibald et al. (Reference Archibald, Logsdon and Doolittle1999), raising questions about the arrangement of the distinct subunits, either within a complex or as separate homooligomeric complexes). Induction of the S. shibatae subunit(s) appeared able to confer thermotolerance, because when Sulfolobus was grown at the near-lethal temperature of 88 °C, the subunit was virtually the only protein synthesized, and its overproduction correlated with the ability to survive following subsequent shift to an otherwise lethal temperature of 92 °C (Trent et al., Reference Trent, Osipiuk and Pinkau1990). The purified so-called thermophilic factor 55 (TF55) complex also exhibited ATPase activity and could selectively bind non-native mesophilic proteins (Trent et al., Reference Trent, Nimmesgern, Wall, Hartl and Horwich1991). Most significantly, when the coding sequence of the subunit was analyzed, it predicted a protein related along its entire length to a eukaryotic cytosolic 57 kDa protein known as tailless-complex polypeptide-1 (TCP-1). This protein was known to be particularly abundant in developing mammalian sperm but also to be present in other mammalian cell types (Willison et al., Reference Willison, Dudley and Potter1986, refs therein),Footnote 8 and had been more recently identified in Drosophila (Ursic and Ganetzky, Reference Ursic and Ganetzky1988), and in S. cerevisiae (Ursic and Culbertson, Reference Ursic and Culbertson1991).
The predicted yeast TCP-1 protein exhibited 61% identity to the predicted Drosophila and mouse products (Ursic and Culbertson, Reference Ursic and Culbertson1991). It was shown to be an essential gene – yeast were unable to grow when it was deleted. To observe the defects in the absence of TCP-1 function, a conditional cold-sensitive mutant form of TCP-1 was isolated, able to grow at 30 °C but arrested at 15 °C. The downshifted cells exhibited a large-budded appearance reminiscent of cells treated with the microtubule inhibitor, nocodazole. Indeed, segregation of the chromosomal DNA was disturbed, with the appearance of large multinucleate cells as well as anucleate buds. These findings were consistent with the disturbance of the microtubule apparatus of the spindle, and this was supported directly by a ‘frayed’ and ‘more extensive’ appearance of anti-α tubulin staining structures. In agreement with the disturbed microtubule behavior, the cold-sensitive mutant was hypersensitive to the microtubule agent benomyl. Thus it appeared that TCP-1 played a role in microtubule biogenesis or stability.
The Sulfolobus study (Trent et al., Reference Trent, Nimmesgern, Wall, Hartl and Horwich1991) provided a structural relationship of the subunit of an apparent archaebacterial chaperonin TF55, to the TCP-1 subunit – there was 40% identity and 62% similarity. The primary structural relationship and the functional intimations from the earlier yeast study supported the idea that TCP-1 could belong to a chaperonin of the eukaryotic cytosol. Three reports in the middle of 1992 provided confirmation of this conclusion.
TCP-1 is a subunit of a heteromeric double-ring chaperonin complex in the eukaryotic cytosol shown to assist folding of actin and tubulin
Heteromeric TCP-1-containing cytosolic chaperonin folds actin
In June 1992, Gao et al. (Reference Gao, Thomas, Chow, Lee and Cowan1992) reported the purification of a heteromeric double-ring assembly from reticulocyte lysate that could mediate the folding of radiolabeled denatured actin that had been expressed in E. coli and purified from inclusion bodies. Denatured, radiolabeled, chicken β-actin became associated with a large complex, as observed in native gel analysis, and was released by addition of MgATP to a form migrating rapidly in the native gel, confirmed as native actin monomer by the ability to bind to DNase I-Sepharose resin and by the ability to copolymerize with mouse brain actin. The native gel assay was used to monitor steps of purification of the complex, including MonoQ chromatography, an ATP agarose step, and Superose 6 gel filtration, resulting in a purified ~800 kDa particle (Fig. 22). In EM analysis, in the absence of MgATP, only end-views were observed, showing what appeared to be eight-membered rings, whereas in the presence of MgATP, only side views were observed, with four striations. In SDS-PAGE analysis of the complex, a cluster of bands between 55 and 62 kDa was observed, one of which was reactive with anti-TCP-1 antibody in Western blot.
Purification of a complex mediating β-actin-folding from rabbit reticulocyte lysate. SDS-PAGE of fractions from Superose 6 gel filtration chromatography of a partially purified chaperonin-containing fraction from reticulocyte lysate, stained with Coomassie (top). Note multiple bands in the 55–62 kDa range. Same Superose fractions used in a refolding assay with 35S-labeled β-actin, with products displayed in a non-denaturing gel, visualized by autoradiography. Folded β-actin is present in the reactions using the chaperonin-containing fractions. Adapted from Gao et al. (Reference Gao, Thomas, Chow, Lee and Cowan1992), with permission from Elsevier, copyright 1992.

Heteromeric TCP-1-containing chaperonin folds tubulin subunits
Likewise, in July 1992, Yaffe et al. (Reference Yaffe, Farr, Miklos, Horwich, Sternlicht and Sternlicht1992) reported that the TCP-1 complex could mediate the folding of chicken α and β-tubulin to native forms able to assemble into the physiologic tubulin heterodimer. Here, translation was carried out in reticulocyte lysate, and the fate of newly-translated radiolabeled tubulin subunits was followed in the lysate by pulse chase analyses. At an early time after translation, newly-made tubulin subunits entered an early-eluting MonoQ fraction (I) that corresponded upon gel filtration to an ~900 kDa complex. Tubulin subunits associating with this complex exhibited high sensitivity to protease digestion. With chase incubation, the tubulin subunits were released in an ATP-dependent fashion (blocked by apyrase) into two later-eluting MonoQ fractions (II and III), where native-like protease resistance was acquired. Fraction II proved to be released, folded, monomer, whereas Fraction III was shown, by addition of microtubule protein to the reaction mix, to be assembled α–β tubulin heterodimer. The ~900 kDa chaperonin complex was purified from a translation reaction by gel filtration followed by anion exchange. When the purified complex was subjected to SDS-PAGE, a ladder of bands was observed in the 55–60 kDa region, and here also there was reactivity with anti-TCP-1 antibody of an ~58 kDa species. These data were consistent with the observations of Ursic and Culbertson that TCP-1 has a role in tubulin metabolism, here indicated as the folding of newly-translated tubulin polypeptide chains.
Cofactors involved with post-chaperonin assembly of tubulin heterodimer, and a pre-chaperonin delivery complex, prefoldin
A study presented by Cowan and coworkers in 1993 indicated that, in order for tubulin monomers released from TCP-1 complex to reach heterodimeric form, there was a requirement for GTP (bound by the α and β subunits released from TCP-1 complex and turned over at the step of heterodimer formation) as well as several protein cofactors [Gao et al., Reference Gao, Vainberg, Chow and Cowan1993; see Lewis et al. (Reference Lewis, Tian and Cowan1997) for review of the pathway of cofactor interactions]. As summarized in Lewis et al., the role of cofactors in the post-chaperonin folding pathways is to bring α and β subunits together in a supercomplex so that they can achieve the native heterodimer conformation. A further study identified a 200 kDa complex in reticulocyte lysate that associated with newly-translated actin or with actin diluted from denaturant (Vainberg et al., Reference Vainberg, Lewis, Rommelaere, Ampe, Vandekerckhove, Klein and Cowan1998; see also a preceding yeast genetic study, Geissler et al., Reference Geissler, Siegers and Schiebel1998). This complex, in both the eukaryotic and archaeal cytosol (Leroux et al., Reference Leroux, Fändrich, Klunker, Siegers, Lupas, Brown, Schiebel, Dobson and Hartl1999), was shown to be composed of six subunits, 14–23 kDa in molecular mass, two α-class and four β-class, and to occupy the topology of a jellyfish (Siegert et al., Reference Siegert, Leroux, Scheuffler, Hartl and Moarefi2000; a β-barrel platform gives rise to six α helical coiled coil ‘tentacles’ with tips that are hydrophobic at the inner aspect that can form associations with non-native proteins). The complex purified from bovine testis was shown to efficiently and selectively bind to TCP-1 complex (coupled to agarose versus no binding to GroEL-agarose) and to transfer bound radiolabeled non-native actin (or tubulin subunit) to TCP-1 complex in the absence of nucleotide. A recent cryoEM study has identified sites of contact of the tips of prefoldin tentacles with the terminal (apical) domains of TCP-1 complex that surround the open chamber (Gestaut et al., Reference Gestaut, Roh, Ma, Pintilie, Joachimiak, Leitner, Walzthoeni, Aebersold, Chiu and Frydman2019).
Further observations of TCP-1 complex – subunits are related to each other, an ATP site is likely shared with all chaperonins, and monomeric luciferase can serve as a substrate in vitro
A third report, from Lewis et al. (Reference Lewis, Hynes, Zheng, Saibil and Willison1992), further confirmed the heteromeric nature of the TCP-1 complex, suggesting eight or nine subunits per ring. Overall, both at the primary and quaternary structure levels, it was suggested that the TCP-1 complex bore more resemblance to the archaeal chaperonins than to the endosymbiotically related family of tetradecamers. However, at the primary structural level, a weak similarity of the proximal and distal sequences of TCP-1 to the corresponding regions of all of the other chaperonins, including absolute conservation of a sequence, GDGTT, a Walker-related motif, in the proximal sequence stretch of all of them, identified that this would likely be part of a structurally conserved ATP-binding domain present in all chaperonins. In late 1992, Frydman et al. (Reference Frydman, Nimmesgern, Erdjument-Bromage, Wall, Tempst and Hartl1992) reported similar observations on the heteromeric nature of a TCP-1 complex from testis, observing a relatedness of several of the subunits from which amino acid sequencing of peptides had been carried out. The purified complex bound several non-native proteins including denaturant-unfolded firefly luciferase, a monomeric protein, and refolding was observed following the addition of ATP. Finally, the composition of the eight related subunits in a TCP-1 complex was established by HPLC separation of subunits and extensive amino acid sequencing (Rommelaere et al., Reference Rommelaere, van Troys, Gao, Melki, Cowan, Vandekerckhove and Ampe1993).
XII. Early physiologic studies of GroEL
Overproduction of GroEL and GroES suppresses a number of diverse amino acid-substituted mutants of metabolic enzymes of Salmonella, indicating that such altered proteins can become GroEL substrates
In late 1989, Van Dyk et al. (Reference Van Dyk, Gatenby and LaRossa1989) reported that selective mutations in two multimeric enzymes of the isoleucine/valine synthetic pathway and three multimeric enzymes of the histidine synthesis pathway of Salmonella were rescued from auxotrophic behavior by overexpression of GroEL/GroES. Most of the mutations involved temperature-sensitive alleles, indicating that a protein was being translated and rescued at non-permissive temperature by overproduction of GroEL/GroES at the level of folding/assembly. Indeed, in the case of histidinol dehydrogenase, activity was shown to be undetectable in the absence of overexpression and to reach a level of 3% wild-type with GroEL/GroES overexpression. Suppression was also tested for a structural protein, the trimeric tailspike protein of Salmonella phage P22; a number of mutant alleles were rescued. One SecA and one SecY mutant of E. coli were also rescued. When the various mutant alleles were sequenced, a variety of substitutions were observed, indicating that suppression by GroEL/GroES occurred over a broad range of amino acid changes (consistent with the broad nature of changes producing protein misfolding). For several mutants that were further tested, neither GroEL alone nor GroES alone could rescue the growth phenotype – both appeared to be generally required.Footnote 9
Temperature-sensitive mutant of GroEL that halts growth at 37 °C exhibits aggregation of a subset of newly-translated cytoplasmic proteins
Most of the early mutants of GroEL isolated by their defects in λ phage biogenesis exhibited growth arrest only after shift to 42 °C, comprising a heat shock to E. coli. Mutants that halt growth at 37 °C were desirable.
Isolation of a mutant ts for GroEL function at 37 °C, E461K
To isolate new GroEL ts mutants, Horwich et al. (Reference Horwich, Low, Fenton, Hirshfield and Furtak1993) first rendered the expression of the chromosomal GroES–GroEL coding sequences lac promoter-dependent. This was accomplished by transforming a rec-minus E. coli strain (recBrecCsbcB) with a linear DNA fragment bearing, in order, sequences upstream from the groE promoter, a chloramphenicol drug resistance marker, a lac promoter, and the GroES–GroEL coding region. After isolating a correct double recombinant that homologously placed the linear segment into the bacterial chromosome (thus replacing the groE promoter with a lac promoter), the entire region was moved from the rec-minus strain into a wild-type E. coli strain via P1 transduction (with selection for the chloramphenicol resistance marker). It was observed that, in the absence of IPTG, the lac-inserted strain (LG6) was unable to produce colonies on solid media. This strain was then transformed with a single copy hydroxylamine-mutagenized plasmid bearing the groE operon (including the natural promoter), and temperature-sensitive clones were selected, of which a strain called ts2 exhibited the strongest temperature sensitivity. Plasmid DNA from the mutant strain revealed a single GroEL codon alteration, E461K, affecting a residue shown later to lie at the ring–ring interface.Footnote 10
Physiological study of E461K mutant
The E461K mutation was inserted into a fresh copy of the single copy groESL plasmid, and the mutation-containing plasmid transformed back into the LG6 strain containing lac-regulated groE. The product ts2R strain grew normally at 23 °C on the solid and liquid media (in the absence of IPTG), but at 37 °C was unable to form colonies, and in the liquid medium after temperature shift could grow for ~1 h but then failed to advance into log phase. When a lambda phage infection was initiated an hour after temperature shift, no new phage were produced. Two test proteins failed to reach the native state after expression in the temperature-shifted mutant cells, human OTC expressed as mature subunit, and the mature domain of monomeric maltose binding protein (MBP). In the case of OTC, pulse-labeled OTC subunits from wild-type cells bound to a PALO substrate affinity column, whereas the subunits translated in the mutant cells failed to bind. In the case of MBP induced after temperature shift, the monomeric protein induced in wild-type cells became bound to an amylose affinity resin whereas MBP induced after temperature shift of mutant cells failed to bind. In a more general experiment, cells were pulse-radiolabeled at 2 h after temperature shift. Translation was still observed, albeit at a rate about one-third that of wild-type cells, but when Triton X100-soluble proteins were examined in 2D gel analysis (adjusted to load equal amounts of newly-translated, 35S-radiolabeled, protein), approximately 100 discrete species were observed in wild-type cells, of which 15 were selectively absent from the soluble fraction of the GroEL-deficient cells. These were presumed to be aggregated, and when urea extraction of insoluble pellets was carried out, many of these species were now detected. Overall, one could conclude that not only test proteins, but also a subset of endogenously translated cytosolic proteins were subject to misfolding and aggregation in the absence of GroEL function. Later studies indeed assayed solubility in the context of groE depletion as a means of identifying groE substrates (see pages 87–88; McLennan and Masters Reference McLennan and Masters1998; Fujiwara et al., Reference Fujiwara, Ishihama, Nakahigashi, Soga and Taguchi2010), and supported the conclusion that there is a specific set of proteins that is dependent on GroEL/GroES.
XIII. Early physiologic studies of Hsp60
Folding and assembly of newly imported Hsp60 is dependent on pre-existent Hsp60
In November of 1990, Cheng et al. (Reference Cheng, Hartl and Horwich1990) reported that pre-existent soluble functional Hsp60 is required for the folding and assembly of newly-imported Hsp60 subunits, in order to form new Hsp60 complexes. The GAL-1 promoter was joined to the nuclear coding sequence for the wild-type Hsp60 precursor in a high-copy plasmid, allowing for regulated (strong) expression. When wild-type Hsp60 was induced in mif4 cells at the permissive temperature, before temperature shift, it allowed the cells to grow after temperature shift. In SDS gel analysis of Triton X100-solubilized mitochondrial fractions from the shifted cells, wild-type Hsp60 was entirely soluble, whereas mif4 Hsp60 (distinguishable by slower migration of subunits in SDS-PAGE) was entirely insoluble, reflecting that wild-type and mif4 mutant complexes apparently assemble independently and indicating that the mutant complexes had become insoluble after temperature shift (as had been observed in Cheng et al., Reference Cheng, Hartl, Martin, Pollock, Kalousek, Neupert, Hallberg, Hallberg and Horwich1989). (Such independent assembly behavior was also supported by the observation that diploid cells heterozygous for wild-type and mif4 Hsp60, when shifted to 37 °C, likewise exhibited segregation of wild-type subunits to the soluble fraction and mif4 subunits to the insoluble mitochondrial fraction.) In contrast with the foregoing results, when wild-type Hsp60 was induced after a temperature shift of mif4 cells, it did not rescue cell growth. In this context, the wild-type Hsp60 subunits were found, along with mif4 subunits, in the insoluble fraction of the mitochondrial extract. They had apparently misfolded in this context (see below). These observations supported that already-existing functional Hsp60 was needed in order to fold/assemble newly-made and imported wild-type Hsp60 subunits. This appeared to reflect more generally on mitochondrial biogenesis: mitochondria are not self-assembled but rather are generated from pre-existing ones by fission (Luck, Reference Luck1965); apparently, component parts of the organelle such as Hsp60 also are not self-assembled but depend on the pre-existing component.Footnote 11
Identification of a GroES-like cochaperonin partner of Hsp60 in mitochondria, Hsp10
Hsp10 in mammalian liver mitochondria
In the in vitro reconstitution study of Goloubinoff et al. (Reference Goloubinoff, Christeller, Gatenby and Lorimer1989b) where native active R. rubrum Rubisco was reconstituted in vitro with purified GroEL and GroES, the investigators also observed that they could recover native R. rubrum Rubisco when they substituted the related chaperonins, yeast mitochondrial Hsp60 or the Rubisco binding protein from chloroplasts. These chaperonins could also bind unfolded Rubisco, but all of the binary complexes required the addition of GroES for the step of discharge of native Rubisco. This implied that organellar GroES homologues are likely to cooperate with the organellar chaperonins. To identify a mitochondrial version of GroES, the ability of S300 fractions of mammalian liver mitochondrial extract to mediate discharge of active Rubisco from GroEL was examined (Fig. 23; Lubben et al., Reference Lubben, Gatenby, Donaldson, Lorimer and Viitanen1990). Indeed a peak of activity was identified at ~45 kDa, and further enriched by MonoQ chromatography and HPLC gel filtration. In SDS-PAGE of the enriched fractions, a 9 kDa subunit was observed. Supporting the behavior of the liver component as a GroES-like complex, when this so-called Hsp10 complex was incubated with GroEL in the presence of MgATP, it now comigrated with GroEL as an ~900 kDa complex in gel filtration. The investigators discussed that ATP-dependent association of GroES with GroEL, and Hsp10 with Hsp60, must relate to the functional requirement for the respective cochaperonin components as regards folding/release of chaperonin-bound substrate proteins.
Presence of GroES-like activity in mammalian mitochondria. Rubisco refolding assays using GroEL (bacterial chaperonin 60, b-cpn60) and either GroES (b-cpn10) (lane B) or fractions (~45 kDa in size) from S300 chromatography of extract of bovine liver mitochondria (lane D), both in the presence of ATP. The material in the ~45 kDa fractions clearly substitutes for GroES to support Rubisco refolding. From Lubben et al. (Reference Lubben, Gatenby, Donaldson, Lorimer and Viitanen1990).

Hsp10 in S. cerevisiae mitochondria – yeast gene predicts protein related to GroES and is essential, and mutation affects folding of several imported precursors
A similar assay was used by Rospert et al. (Reference Rospert, Glick, Jenö, Schatz, Todd, Lorimer and Viitanen1993) to identify a yeast Hsp10 protein, involving productive release by yeast mitochondrial matrix extracts of Rubisco from GroEL. The component was substantially enriched by Sepharose S chromatography, consistent with the chromatographic behavior of the GroES protein and homologues that had been studied. As with mammalian Hsp10, the yeast component exhibited an association with GroEL in the presence of MgATP. (Notably, in the converse incubation, bacterial GroES could not associate with yeast Hsp60, nor could it promote productive folding by it.)
The ability of various cochaperonins to associate with GroEL was used by Höhfeld and Hartl (Reference Höhfeld and Hartl1994) to capture Hsp10 in a single step from a yeast mitochondrial matrix extract. Both their study and that of Rospert et al. sequenced tryptic (and chymotryptic) peptides from yeast Hsp10, observing relatedness to GroES and liver-derived Hsp10. The Höhfeld study used peptide data to derive degenerate primers, producing a radiolabeled PCR probe that identified the yeast Hsp10 gene from a library of single copy genomic clones. The gene was shown to be essential under normal growth conditions and its promoter, fused to β-galactosidase, was shown to be twofold heat-inducible, exactly corresponding to the essential behavior and twofold heat shock induction of yeast Hsp60. The predicted amino acid sequence of yeast Hsp10 was 36% identical to GroES and 43% identical to rat Hsp10. The first 10 residues of both yeast and rat Hsp10 were rich in basic residues and hydroxylated ones, reflecting apparent N-terminal mitochondrial targeting peptides (followed by a sequence with identities to GroES). Two temperature-sensitive Hsp10 alleles were generated by Höhfeld and Hartl, and one, P36S, in what was later shown to be a mobile loop region in GroES that interacts with GroEL, was expressed in yeast. When the mutant Hsp10 was examined in mitochondrial extracts for the ability to interact with added GroEL, it was selectively unable to form an Hsp10/GroEL complex at 37 °C. Mitochondria from the P36S mutant strain were also tested with imported substrate proteins. This revealed a block at the non-permissive temperature of maturation of matrix processing peptidase, human OTC, and the Rieske Fe/S protein, indicating a requirement by these substrates for both Hsp60 (based on earlier studies) and Hsp10 for proper folding.
Mammalian mitochondrial Hsp60 is isolated as a single ring that can associate with mammalian Hsp10 in vitro, and the two can mediate Rubisco folding in vitro – a minimal fully folding-active chaperonin
In May and July of 1989, Gupta and coworkers reported the molecular cloning of cDNAs encoding, respectively, human (Jindal et al., Reference Jindal, Dudani, Singh, Harley and Gupta1989) and CHO (Picketts et al., Reference Picketts, Mayanil and Gupta1989) mitochondrial Hsp60, via screening of λgt11 libraries with antibodies that had been prepared against an abundant 60 kDa mitochondrial protein (excised from gels) that the investigators had thought to be involved in microtubule metabolism. Sequence analysis of the two mammalian cDNAs predicted Hsp60s that were 97% identical to each other and 42–60% identical to GroEL, yeast Hsp60, and plant Rubisco binding protein. In the second study, the investigators subjected both CHO extract and rat liver mitochondrial matrix extract to gel filtration and Western analysis with their antibody, and observed the respective Hsp60 proteins eluting at ~400 kDa, suggesting that mammalian mitochondrial Hsp60s might be (naturally-occurring) seven-membered single rings. Subsequently, in work with Viitanen et al. (Reference Viitanen, Lorimer, Seetharam, Gupta, Oppenheim, Thomas and Cowan1992a), this was further supported by bacterial expression of the CHO coding sequence (Fig. 24).Footnote 12
Negative stain EM images of E. coli-expressed cDNA encoding mature form of mammalian mitochondrial Hsp60. Top images show usual sevenfold symmetry while side views show only two ‘stripes’ rather than the four seen with GroEL, suggesting that mammalian mitochondrial Hsp60 is a single-ring complex. Reprinted with permission from Viitanen et al. (Reference Viitanen, Lorimer, Seetharam, Gupta, Oppenheim, Thomas and Cowan1992a); copyright ASBMB, 1992.

Functional testing with the purified single-ring product was carried out in vitro. Acid-unfolded R. rubrum Rubisco formed a binary complex with the mammalian single-ring Hsp60, detectable by comigration in gel filtration, and was productively discharged by addition of purified beef liver Hsp10 and MgATP. This experiment supported that a minimal folding-active version of a chaperonin might be a single ring and the partner cochaperonin.Footnote 13
Additional substrates of Hsp60 identified by further studies of mif4 strain: a number of other imported proteins do not require Hsp60 to reach native form
Imported matrix proteins identified as insoluble when examined after pulse-radiolabeling mif4 cells at non-permissive temperature
In 1992, Glick et al. (Reference Glick, Brandt, Cunningham, Müller, Hallberg and Schatz1992) reported that when mif4 cells were shifted to 37 °C and 35S-methionine pulse-radiolabeled, the subunits of F1β ATPase, ketoglutarate dehydrogenase, and lipoamide dehydrogenase were Triton-insoluble, compared with Triton-soluble behavior in wild-type cells. Importantly, in the mif4 cells, pre-existing ketoglutarate dehydrogenase and lipoamide dehydrogenase proteins, which were present prior to a temperature shift, remained soluble at 37 °C. This indicated that lack of Hsp60 function affects newly-imported proteins as opposed to causing general precipitation of mitochondrial matrix proteins.Footnote 14
In 1998, a more general survey of Triton-X100-insoluble proteins in mif4 mitochondria as well as in the Hsp10 temperature-sensitive mutant P36H was presented by Rospert and coworkers (Dubaquié et al., Reference Dubaquié, Looser, Fünfschilling, Jenö and Rospert1998). Here, total yeast RNA was translated in a yeast lysate to produce radiolabeled proteins (including mitochondrial precursors), and the mixture was incubated with wild-type, mif4, or Hsp10 mutant mitochondria. The mitochondria were then extracted, and the proteins selectively insoluble in mif4 and mutant Hsp10 mitochondria were identified by 2D-gel analysis and mass spectrometry. Identified proteins were further evaluated by translating their subunits individually in vitro and importing them. Overall, a similar pattern of insoluble proteins was observed from the Hsp60 and Hsp10 mutant strains. Among proteins affected were metabolic enzymes, Ilv3, IDH1, and aconitase, but also, consistent with the 1989 study of Cheng et al. (Reference Cheng, Hartl, Martin, Pollock, Kalousek, Neupert, Hallberg, Hallberg and Horwich1989), Hsp60 itself. The first two proteins were more affected by Hsp60 deficiency than Hsp10 deficiency, whereas the latter were equally affected.
Other imported proteins do not exhibit dependence on Hsp60
Interestingly, neither yeast rhodanese nor yeast MDH were affected by either the Hsp60 or Hsp10 mutations, exhibiting normal assumption of active form and, further, failing to form any detectable complexes with Hsp60 in experiments importing the two yeast precursors into wild-type mitochondria (Dubaquié et al., Reference Dubaquié, Looser, Fünfschilling, Jenö and Rospert1998). This contrasts with the stringent need by imported bovine rhodanese for Hsp60 in yeast mitochondria (Rospert et al., Reference Rospert, Looser, Dubaquié, Matouschek, Glick and Schatz1996; see below) and pig heart mitochondrial MDH for GroEL/GroES in in vitro refolding studies (Miller et al., Reference Miller, Maghlaoui, Albanese, Kleinjan and Smith1993; Schmidt et al., Reference Schmidt, Buchner, Todd, Lorimer and Viitanen1994; Peralta et al., Reference Peralta, Hartman, Hoogenraad and Høj1994). Sequence conservation between the yeast and cow rhodanese species is relatively low (32% identity; 60% similarity) and between the yeast and pig MDH species is higher (54% identity; 76% similarity). Given present-day understanding, the differences in sequence likely dictate differences in the kinetic behavior of the folding species. Yet it remains unknown exactly what evolutionary forces have resulted in the efficient folding of the two yeast sequences that do not require chaperonin assistance, while the related mammalian sequences retain or developed a stringent need. It seems clear that even a small number of amino acid changes can have large effects on the need for kinetic assistance. This is illustrated by a study of the T4 major capsid protein (gp23) which is dependent on GroEL during T4 infection of E. coli for its folding and subsequent assembly into new phage particles. Andreadis and Black showed that four single residue substitutions could additively lead to complete bypass by gp23 of a GroEL requirement, allowing apparently spontaneous folding and productive T4 phage biogenesis (Reference Andreadis and Black1998). Conversely, as shown early by Van Dyk et al. (Reference Van Dyk, Gatenby and LaRossa1989) and later by Ishimoto et al. (Reference Ishimoto, Fujiwara, Niwa and Taguchi2014), even single amino acid substitutions into GroE-independent proteins often render them GroE-dependent for their folding, correlating in the latter study with the aggregation of the substituted proteins.
Folding of additional proteins imported into mif4 mitochondria monitored by protease susceptibility – rhodanese exhibits Hsp60-dependence, but several other proteins are independent
In 1996, Rospert et al. (Reference Rospert, Looser, Dubaquié, Matouschek, Glick and Schatz1996) reported studies of a further set of proteins imported into mif4 mitochondria. Here, the folded state was assessed by the acquisition of protease resistance. When bovine rhodanese was imported into wild-type mitochondria, it slowly acquired protease resistance (t 1/2~15 min), whereas it remained PK sensitive in mif4 mitochondria. By comparison, Su9-DHFR, identical to the fusion imported earlier into Neurospora mitochondria by Ostermann et al. (Reference Ostermann, Horwich, Neupert and Hartl1989), exhibited the same kinetics of acquisition of resistance in mif4 mitochondria as in wild-type yeast mitochondria, suggesting that, in yeast mitochondria, folding of imported DHFR might not be dependent on Hsp60. ATP depletion from yeast mitochondria by apyrase and oligomycin/efrapeptin treatment resulted in the accumulation of a translocation intermediate of Su9-DHFR in both mif4 and wild-type, and re-addition of ATP resulted in the completion of import and folding at the same rate in wild-type and mif4 mitochondria. Rospert et al. also tested for physical association of imported proteins in yeast mitochondria with Hsp60 by co-immunoprecipitation, observing that, whereas rhodanese imported into wild-type yeast mitochondria became associated with Hsp60, Su9-DHFR did not, instead co-immunoprecipitating with mitochondrial Hsp70, in contrast to the Neurospora study. One potential explanation was provided by an experiment with purified components, showing that denatured DHFR refolded in the presence of yeast Hsp60, albeit more slowly than in its absence (or with Hsp60/Hsp10/ATP), while DHFR folding was completely prevented by the same amount of E. coli GroEL. This result would suggest that different Hsp60 homologues might have different affinities for DHFR.
The study of the small proteins barnase (12 kDa; programmed with a Su9 mitochondrial targeting peptide) and mitochondrial cyclophilin (Cpr3; 17.5 kDa) revealed the same rapid acquisition of protease resistance in both wild-type and mif4 mitochondria and neither protein formed detectable association with Hsp60, reflecting that rapidly-folding proteins, lacking kinetic complication during the folding process, do not require chaperonin assistance.
XIV. Cooperation of Hsp70 class chaperones with the GroEL/Hsp60 chaperonins in bacteria, mitochondrial matrix, and in vitro
Cooperation in bacteria
In 1988, Zhou et al. (Reference Zhou, Kusukawa, Erickson, Gross and Yura1988) reported on the effect of deleting the σ32 heat shock subunit of RNA polymerase from E. coli (by deleting its encoding gene, rpoH). They observed that deleted cells could grow only at temperatures below 20 °C, and that, at a higher temperature, there was no induction of transcription of the two major heat shock operons, DnaKJ (Hsp70 system) and GroESL (Hsp60 system). In a further examination of a rpoH null allele (rpoH165), Gragerov et al. (Reference Gragerov, Martin, Krupenko, Kashlev and Nikiforov1991) noted a high level of insoluble proteins as compared to wild-type or pRpoH-rescued strains. The pattern of molecular masses in an SDS gel of a sonicated/centrifuged lysate paralleled that of the soluble proteins, reflecting wholesale aggregation. The presence of insoluble proteins was associated with a morphologic observation of inclusion bodies in the rpoH165 cells incubated at 42 °C. Gragerov et al. (Reference Gragerov, Nudler, Komissarova, Gaitanaris, Gottesman and Nikiforov1992) further reported on the action of introduced DnaKJ and/or GroESL operons in abolishing aggregation in the rpoH strain. They observed that overexpression of either operon could prevent the wholesale aggregation observed at 42 °C (Fig. 25).
Overexpression of dnaKJ or groESL prevents aggregation in rpoH (σ32 heat shock factor-deficient) E. coli. Plasmids expressing DnaK/DnaJ (pKJ) or GroES/GroEL (pSL) under lac promoter control were transformed into rpoH165 cells and induced (IPTG), or not (glucose), at 30 °C, then shifted to 42 °C for 1 h. Soluble (S) and insoluble (I) fractions were produced without detergent, then subjected to SDS-PAGE with Coomassie staining. The insoluble fraction was much reduced with overexpression of either chaperone pair. From Gragerov et al. (Reference Gragerov, Nudler, Komissarova, Gaitanaris, Gottesman and Nikiforov1992).

With the expression of the two operons at normal levels, however, neither operon alone could prevent aggregation, and the two together were required. The investigators discussed that the two operons act in the same pathway, rather than in parallel pathways. Considering that the two systems could act together at normal levels to forestall aggregation, the investigators suggested a ‘stoichiometric’ versus ‘catalytic’ action by the two systems. This is consistent, in the case of GroEL, with the stoichiometric binding of non-native Rubisco in the early in vitro reconstitution experiment (Goloubinoff et al., Reference Goloubinoff, Christeller, Gatenby and Lorimer1989b). In retrospect, this study reflects well on the situation of heat shock at 42 °C, where a large host of pre-existent proteins, as well as newly-translated ones, are subject to unfolding, misfolding, and aggregation, with the two major chaperone systems induced and recruited to handle a global effect. The study might also have been extrapolated to indicate that a global action of the two systems is involved under normal conditions, but current understanding would reflect that there is more of a sequential and, in the case of GroESL, selective requirement, with only a set of cytosolic proteins requiring the chaperonin system (see page 86 and Fujiwara et al., Reference Fujiwara, Ishihama, Nakahigashi, Soga and Taguchi2010). It appears that DnaK acts on many nascent polypeptides during or immediately following translation (e.g. Deuerling et al., Reference Deuerling, Schulze-Specking, Tomoyasu, Mogk and Bukau1999; Teter et al., Reference Teter, Houry, Ang, Tradler, Rockabrand, Fischer, Blum, Georgopoulos and Hartl1999), whereas the GroESL system acts post-translationally on a selective set of proteins (Horwich et al., Reference Horwich, Low, Fenton, Hirshfield and Furtak1993; Ewalt et al., Reference Ewalt, Hendrick, Houry and Hartl1997; Kerner et al., Reference Kerner, Naylor, Ishihama, Maier, Chang, Stines, Georgopoulos, Frishman, Hayer-Hartl, Mann and Hartl2005; Fujiwara et al., Reference Fujiwara, Ishihama, Nakahigashi, Soga and Taguchi2010) to assist their final folding to the native state.Footnote 15
Sequential action of Hsp70 and Hsp60 in mitochondria
In 1990, Kang et al. (Reference Kang, Ostermann, Shilling, Neupert, Craig and Pfanner1990) reported the isolation and study of a temperature-sensitive allele affecting an essential yeast mitochondrial matrix Hsp70 family member (called SSC1 or mitochondrial Hsp70), revealing requirement for its action in the import of mitochondrial precursor proteins (Kang et al., Reference Kang, Ostermann, Shilling, Neupert, Craig and Pfanner1990). This was shown to involve direct physical interaction with the translocating polypeptide (see also Scherer et al., Reference Scherer, Krieg, Hwang, Vestweber and Schatz1990). This suggested cooperation between Hsp70 (SSA) action outside mitochondria to maintain a precursor in an unfolded state, and an Hsp70 (SSC1) inside the mitochondrial matrix compartment, which could either direct ATP-mediated forceful pulling and/or could provide binding (ratchet) action that biases the direction of translocation (Wiedemann and Pfanner, Reference Wiedemann and Pfanner2017). The observation of direct involvement of matrix-localized Hsp70 action in translocation of extended conformations of polypeptide served to place this action before that of Hsp60. This was further supported by temporal studies of Manning-Krieg et al. (Reference Manning-Krieg, Scherer and Schatz1991), observing in studies of import into isolated mitochondria of the radiolabeled precursor of either MPP or Hsp60, monitored by immunoprecipitation with anti-chaperone antibodies, that the precursors were first bound by mitochondrial Hsp70, released by ATP, then associated with Hsp60. In retrospect, this direction of interaction is at least in part enforced by a mitochondrial inner membrane-localized complex including both Tim44 and two DnaJ proteins (PAM16 and PAM18) that physically bind mitochondrial Hsp70 (Fig. 26; Wiedemann and Pfanner, Reference Wiedemann and Pfanner2017). Yet beyond the membrane-localized action of mitochondrial Hsp70 in protein translocation, a further action of a soluble matrix-localized fraction of mitochondrial Hsp70 in a complex together with a mitochondrial DnaJ protein (mDj1) and the mitochondrial nucleotide exchange factor (mGrpE) has been recognized that appears to support productive folding (Horst et al., Reference Horst, Oppliger, Rospert, Schönfeld, Schatz and Azem1997). The early Manning-Krieg time course study would place this action also as lying upstream of Hsp60 and, given our current understanding of the selective need for Hsp60 in final folding, many if not a majority of translocated proteins may be released from the mitochondrial Hsp70 system to achieve native form without further assistance.
The import/folding pathway for protein precursors entering the mitochondrial matrix involves both mitochondrial Hsp70 with DnaJ-like (PAM16,18) and GrpE-like (Mge1) cochaperones and Hsp60/Hsp10. Adapted from Wiedemann and Pfanner (Reference Wiedemann and Pfanner2017), under a CCA 4.0 license.
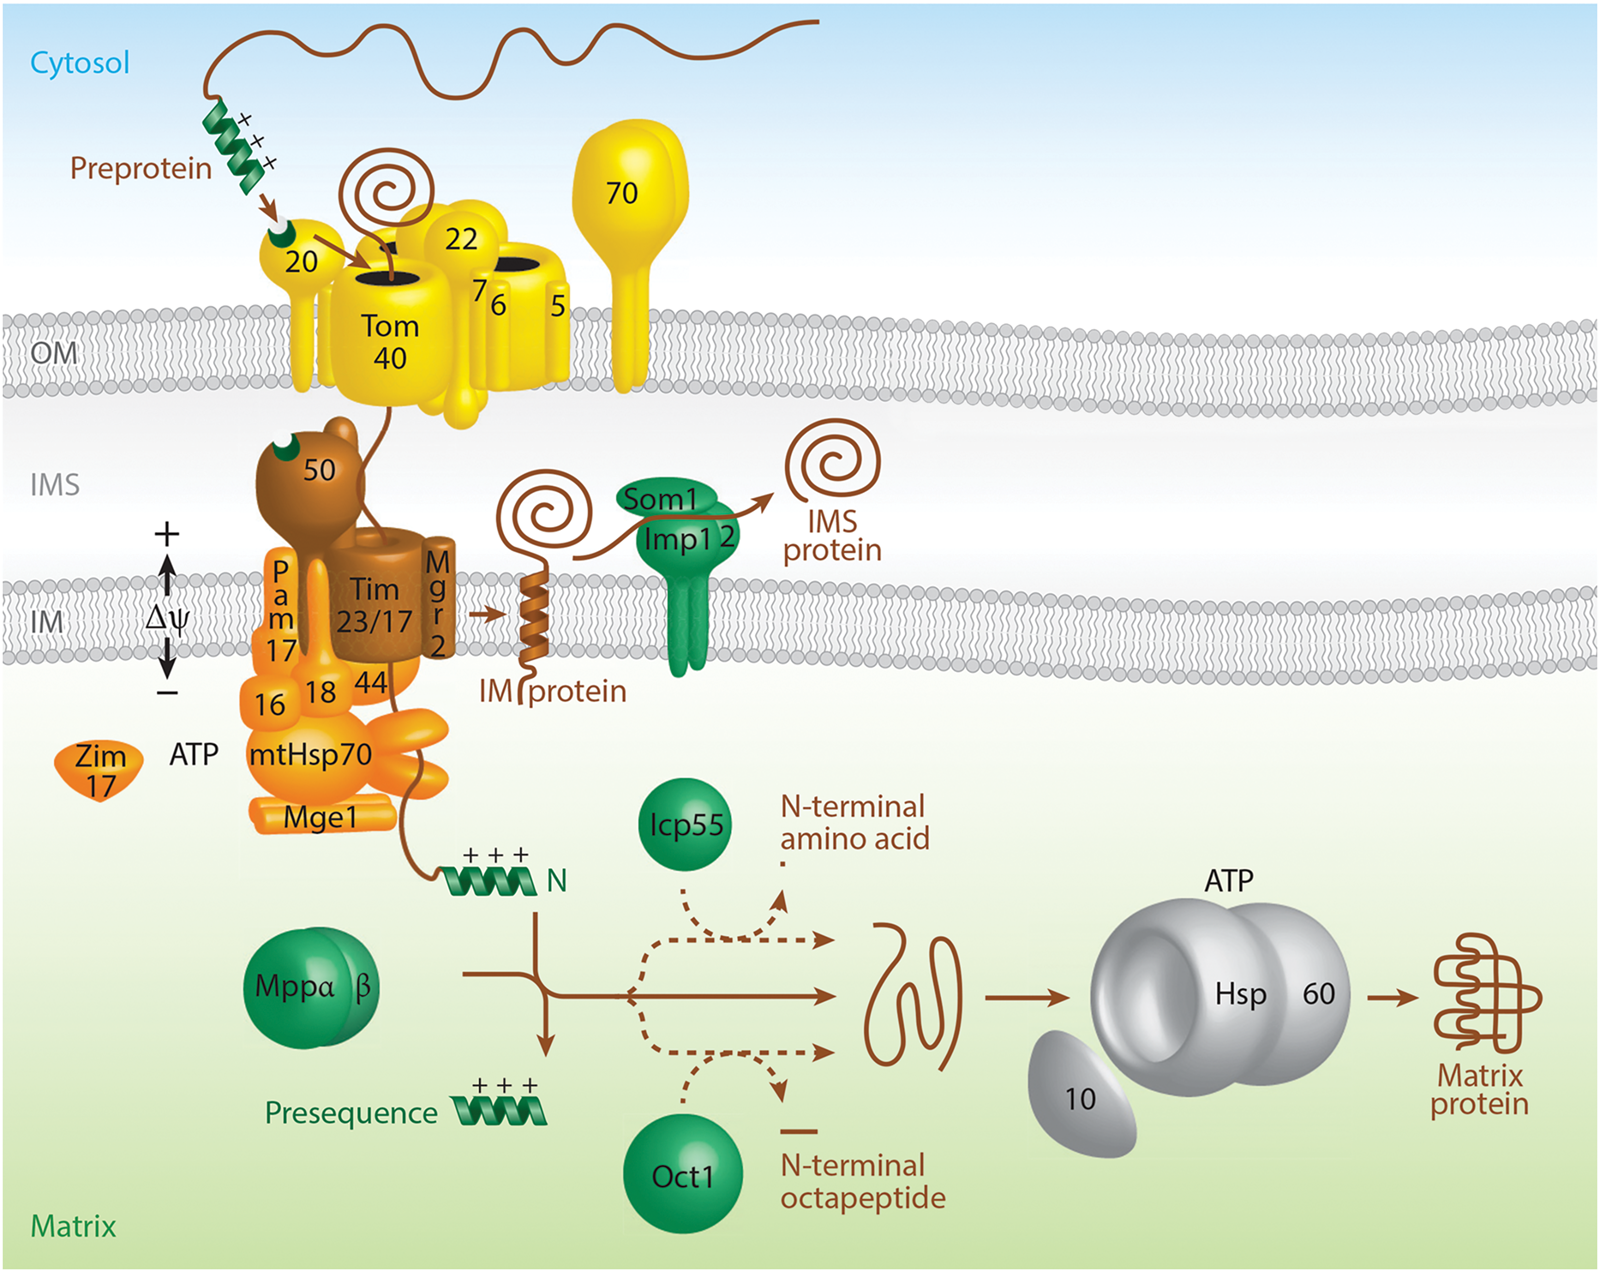
Successive actions of bacterial DnaK (Hsp70) and GroEL (Hsp60) systems in an in vitro refolding reaction
The aforementioned studies in mitochondria, particularly those of Kang et al. (Reference Kang, Ostermann, Shilling, Neupert, Craig and Pfanner1990), Scherer et al. (Reference Scherer, Krieg, Hwang, Vestweber and Schatz1990), and Manning-Krieg et al. (Reference Manning-Krieg, Scherer and Schatz1991), raised the possibility that there could be a sequence of chaperone interactions, such that Hsp70s could recognize extended conformations vectorially emerging from ribosomes or the matrix aspect of mitochondrial membranes, as well as full-length chains in relatively extended states, while Hsp60s would recognize full length polypeptide chains that have collapsed into non-native forms following release from Hsp70s. In April 1992, a series of in vitro tests reported by Langer et al. (Reference Langer, Lu, Echols, Flanagan, Hayer and Hartl1992a) with purified DnaK/DnaJ/GrpE and GroEL/GroES supported such behavior. The K/J/E trio had been recognized by Georgopoulos and coworkers to cooperate in the context of λ DNA replication (Liberek et al., Reference Liberek, Georgopoulos and Zylicz1988, Reference Liberek, Marszalek, Ang and Georgopoulos1991; Zylicz et al., Reference Zylicz, Ang, Liberek and Georgopoulos1989), while the GroEL/GroES pair had been recognized as cooperating as early as 1982 (Tilly and Georgopoulos, Reference Tilly and Georgopoulos1982). The monomeric substrate protein, bovine rhodanese, which had been demonstrated to be refolded in vitro by GroEL/GroES, was employed (see Martin et al., Reference Martin, Langer, Boteva, Schramel, Horwich and Hartl1991; Mendoza et al., Reference Mendoza, Rogers, Lorimer and Horowitz1991; and page 38). Rhodanese had been recognized to misfold and aggregate following dilution from denaturant (in the absence of chaperones), and here it was observed that a high relative molar ratio of DnaK (20:1) could partially suppress aggregation, while a lower ratio of DnaJ (5:1) could completely suppress aggregation. Likewise, a combination of chaperones, J:K:rhodanese at 2:5:1, could also completely suppress aggregation. In the latter case, rhodanese was identified in an ~200 kDa complex with the chaperones upon gel filtration. Addition of ATP to the various complexes was unable to renature rhodanese, nor was there renaturation when GroEL/GroES was also added (versus rhodanese renaturation upon dilution directly from denaturant into GroEL/GroES/ATP). However, the addition of the nucleotide exchanger for the DnaK/DnaJ system, GrpE, as a fifth component, produced full renaturation of rhodanese over a period of a few minutes (Fig. 27). GrpE was already known to act as an accelerant of nucleotide exchange at DnaK from the ADP-bound to ATP-bound state (Liberek et al., Reference Liberek, Marszalek, Ang and Georgopoulos1991), recognized as converting DnaK from a state with high affinity for substrate protein to one with low affinity (Palleros et al., Reference Palleros, Welch and Fink1991). Thus, the KJ system could stabilize rhodanese diluted from denaturant in a latent state that was competent for recognition by GroEL/GroES upon release directed by GrpE-stimulated nucleotide exchange.
Cooperation of the DnaK/DnaJ/GrpE system with GroEL/GroES in refolding of rhodanese. Rhodanese activity is not recovered when denaturant-unfolded rhodanese is incubated either with DnaK/DnaJ alone or with GroEL/GroES in the presence of MgATP (1), but the activity was rapidly recovered when GrpE was added to K/J/EL/ES (2) or when GroEL/GroES was added to K/J/E-stabilized rhodanese (3). Adapted from Langer et al. (Reference Langer, Lu, Echols, Flanagan, Hayer and Hartl1992a), by permission from Springer Nature, copyright 1992.

Interestingly, multiple cycles of turnover by the GroEL/GroES system could be demonstrated in this system by first forming rhodanese complexes with DnaJ:K (2:5:1 = J:K:rho) in the presence of GrpE and ATP, then adding substoichiometric GroEL/GroES (0.1:0.2). Rhodanese was completely renatured across 90 min involving, necessarily, multiple rounds of recruitment of rhodanese to GroEL/GroES to carry out refolding. Notably, while the investigators emphasized that repeated cycles of GroEL action were operative in this last experiment, it would seem apparent that rhodanese released from the JK complex by GrpE in this experiment must have been rebound by it and thus stabilized against aggregating, because only ~10% of the substrate could be accepted by GroEL in any given round of the chaperonin reaction. Thus, a kinetic partitioning must have been operative here, where non-native protein could either be bound by GroEL or be rebound and stabilized by DnaK/DnaJ. Nevertheless, productive folding of rhodanese was promoted by what appears to be the physiologically ‘downstream’ system and not the ‘upstream’ one. As was discussed, many other proteins could be productively folded by the KJE system alone.
XV. Early mechanistic studies of GroEL/GroES
Topology studies
Back-to-back arrangement of the two GroEL rings
In 1990, Zwickl et al. (Reference Zwickl, Pfeifer, Lottspeich, Kopp, Dahlmann and Baumeister1990) reported EM analysis of a GroEL derived from a β-proteobacterium, Comomonas acidovorans (distinct from E. coli and relatives, which are γ-proteobacteria; see Yarza et al., Reference Yarza, Yilmaz, Pruesse, Glöckner, Ludwig, Schleifer, Whitman, Euzéby, Amann and Rossellö-Möra2014 for taxonomy). In negative stain EM analysis, the usual sevenfold symmetry was observed in end views. For side views, eigenvector–eigenvalue data analysis decomposed the data into six more homogeneous classes, for each of which the averaged image revealed four masses (stripes), and for each, the inner two stripes were more massive in density than the outer stripes, leading to the conclusion that the rings are arranged back-to-back.
Coaxial binding of GroES to GroEL
In September 1991, Saibil et al. (Reference Saibil, Dong, Wood and auf der Mauer1991) presented the first images of GroEL/GroES complexes prepared by incubating the two purified proteins with MgATP and analyzed by negative stain EM (Fig. 28a). [Recall that Chandrasekhar et al. (Reference Chandrasekhar, Tilly, Woolford, Hendrix and Georgopoulos1986) had shown that GroES co-sedimented with GroEL in the presence of ATP.] In side views, the four-stripe pattern usually observed for GroEL was ‘markedly perturbed by the binding of GroES’. One of the outer stripes (at one end of the double ring) was bowed out, indicating a structural change of the terminal domains of one of the two rings [see Hutchinson et al. (Reference Hutchinson, Tichelaar, Hofhaus, Weiss and Leonard1989) for interpretation of the four stripes as two major domains of the collective of subunits within each of two rings]. Notably, in the presented images, the other three stripes did not exhibit a different appearance from standalone GroEL, and end views did not exhibit an obvious difference with standalone GroEL. It was not stated at the time, but one inferred that the asymmetric appearance of these complexes was indicating that GroES was probably coaxially bound to the ring exhibiting the bowed out domains, coaxial binding inferred considering the matching sevenfold rotational symmetry of both GroEL and GroES.
Early negative stain EM images of GroEL/GroES complexes. (a) E. coli GroEL (left) and GroEL/GroES complexes in ATP. Reprinted from Saibil et al. (Reference Saibil, Dong, Wood and auf der Mauer1991), by permission from Springer Nature, copyright 1991; (b) Asymmetric GroEL/GroES chaperonin complexes directly isolated from Thermus thermophilus. Reprinted with permission from Taguchi et al. (Reference Taguchi, Konishi, Ishii and Yoshida1991), copyright ASBMB, 1991; (c) GroEL/GroES complexes from T. thermophilus linked by anti-GroES antibodies through the rounded ends of the bullet-shaped asymmetric particles, confirming the position of GroES at the rounded end of the bullet-shaped complexes, from Ishii et al. (Reference Ishii, Taguchi, Sumi and Yoshida1992), with permission, copyright FEBS, 1991; (d) Structural classes of EM images of GroEL/GroES complexes, showing GroES as a distinct ‘keystone’ at the rounded end of the complexes, adapted from Langer et al. (Reference Langer, Pfeifer, Martin, Baumeister and Hartl1992b), with permission, copyright EMBO, 1992; (e) Averaged end views of negative stain EM images of unliganded GroEL (left) and a GroEL–rhodanese complex (right), the latter with stain-excluding mass in the central cavity. Adapted from Langer et al. (Reference Langer, Pfeifer, Martin, Baumeister and Hartl1992b), with permission, copyright EMBO, 1992.

In November 1991, Taguchi et al. (Reference Taguchi, Konishi, Ishii and Yoshida1991) reported on a chaperonin isolated from the thermophilic bacterium, Thermus thermophilus, which grows normally at ~70 °C. Inspection by negative staining in this case revealed in side views (Fig. 28b) the same asymmetric ‘bullet’ images as had been observed by Saibil and coworkers, implying that the T. thermophilus GroES was stably associated with the thermophilic GroEL complex through the steps of purification (carried out at low temperature, where nucleotide may have remained trapped, thus maintaining the complex). This was confirmed by SDS gel analysis, displaying the 10 kDa GroES subunit, and by N-terminal sequencing, revealing two N-termini, homologous to either E. coli GroEL or GroES.
Interestingly, the asymmetric thermophilic GroEL/GroES complexes could bind a number of subunits of thermophilic enzymes following dilution from urea or GuHCl denaturant (e.g. IPMDH subunit, 37 kDa, homodimer in the native form). Efficient binding of IPMDH subunit occurred with a 2:1 molar ratio of the chaperonin complex to IPMDH subunit, even at relatively low temperature (50 °C or below), where binding prevented spontaneous refolding that occurred in the absence of chaperonin. (In retrospect, such substrate binding likely involved the association of the IPMDH subunit with the open, so-called trans ring of the GroEL/GroES complex, opposite the ring bound by GroES). At a temperature below 25 °C, the T. thermophilus chaperonin did not exhibit ATP turnover, and, correspondingly, could not mediate refolding/release of IPMDH that was bound at this temperature. However, following the elevation of an IPMDH/chaperonin complex to a temperature of 68 °C (where spontaneous folding does not occur), the addition of ATP led to the recovery of enzyme activity measured over a time-course of ~10 min. In the discussion, the investigators mention that the order of addition of the original Rubisco reconstitution experiment (Goloubinoff et al., Reference Goloubinoff, Christeller, Gatenby and Lorimer1989b) is not preserved in the T. thermophilus refolding experiments – that is, instead of substrate/GroEL binary complex formation being followed by ATP/GroES-triggered folding/release, in the case of T. thermophilus, GroES is already bound to GroEL, and substrate is added thereafter, with ATP serving as the proximate trigger of productive folding/release. (At that point in history, even with topological information concerning apparent coaxial GroES association with GroEL, substrate had not as yet been localized, and the machinations of ATP/GroES binding, substrate encapsulation, and action of ATP hydrolysis to advance the reaction cycle could not be divined.)
In March 1992, Ishii et al. (Reference Ishii, Taguchi, Sumi and Yoshida1992) further resolved that GroES was present at the rounded aspect of ‘bullet’ complexes by incubating antibodies prepared against T. thermophilus GroES with the chaperonin complexes and carrying out negative stain EM (Fig. 28c). This led to ‘head-to-head’ interconnection of pairs of asymmetric chaperonin complexes via (bivalent) antibody interaction with their rounded ends.
In December 1992, Langer et al. (Reference Langer, Pfeifer, Martin, Baumeister and Hartl1992b) reported further negative stain EM analyses of asymmetric complexes of E. coli GroEL/GroES, formed here from the purified components in ADP. The observations in side views (Fig. 28d) were similar to those of Ishii et al. (Reference Ishii, Taguchi, Sumi and Yoshida1992) with the directly purified complex from T. thermophilus, but here the investigators could resolve density at the rounded end of the asymmetric complex to be the body of GroES, as a distinct keystone in the central position of the rounded end.
Polypeptide substrate binds in the GroEL cavity
Negative stain EM
In a further topology experiment in Langer et al. (Reference Langer, Pfeifer, Martin, Baumeister and Hartl1992b), binary complexes were formed between GroEL and rhodanese diluted from denaturant. In averaged end views, a stain-excluding density could be seen aligning with the central ‘hole’ of GroEL (which had measured ~60 Å diameter; Fig. 28e, right image). No such mass had been observable in standalone GroEL (Fig. 28e, left image). Side views of these complexes failed to identify the position of the density within or outside the cylindrical particle. The investigators concluded that ‘bound rhodanese…is apparently enclosed within the cavity…’ In a third experiment, MgADP and GroES were added to the GroEL/rhodanese binary complex and the ternary complexes examined in negative stain EM. Here also, an axial mass, likely corresponding to rhodanese, was observed in end views, but in side views, once again, the site of the bound rhodanese could not be determined. Thus, the location of polypeptide, either within or outside the GroEL cavity of the open trans ring, or underneath GroES in the cis ring, was not resolved.
Scanning transmission EM
A further level of resolution to the foregoing localization questions was reported in May 1993, by Braig, Horwich, and their collaborators at Brookhaven National Lab, Jim Hainfeld and Joe Wall, using scanning transmission EM of a complex formed between GroEL and non-native chicken DHFR bearing a nanogold cluster (Braig et al., Reference Braig, Simon, Furuya, Hainfeld and Horwich1993). The gold cluster (composed of a 14 Å dia. core of 67 gold atoms surrounded by an organic shell, summing to 27 Å dia.) was iodoacetamide derivatized (through amino groups of the shell) allowing for attack by the single cysteine of chicken DHFR (aa 11), producing covalent derivatives of DHFR that were slower migrating in SDS gels. Native derivatives were purified by substrate affinity chromatography on MTX agarose, producing a single species migrating more slowly than unmodified DHFR in SDS-PAGE. The recovered species (AuDHFR) could be unfolded with 6 M GuHCl, and its native state was fully recovered by spontaneous refolding after dilution from denaturant, as observed by complete recovery on MTX agarose. To form a binary complex with GroEL, the AuDHFR species was diluted from GuHCl into a mixture with GroEL, and the unbound AuDHFR was removed by ultrafiltration. The AuDHFR/GroEL complex was applied to a thin carbon-coated grid, freeze-dried, and examined in the STEM. In end views, a gold cluster was typically observed directly aligned with the central ‘hole’ (Fig. 29, top), agreeing with the end views of Langer et al. (Reference Langer, Pfeifer, Martin, Baumeister and Hartl1992b). In side views, gold clusters were observed within the end third of the cylinders aligning roughly with the sevenfold axis of symmetry (Fig. 29, side). With observations taken at 90° angles to each other, this positioned the substrate protein within the central cavity of the terminal stripe (apical domains) of GroEL. In the side views, some particles contained a gold cluster in both terminal cavities, suggesting that DHFR might be simultaneously bound to both rings. Considering the evidence for binding of non-native polypeptide within the limited volume of the GroEL central cavity, the investigators discussed the likely requirement for binding of collapsed conformations of polypeptide (as opposed to extended ones), the possibility of multivalent binding by the surrounding subunits, and the likely limit to the size of a polypeptide or portion thereof that could be accommodated within the cavity.
Scanning transmission EM images of gold-labeled unfolded chicken DHFR in complex with GroEL. Top panels: End views of complexes, showing gold density in the center of individual particles and statistics of localization at right. Lower panels: Side views showing gold densities near one or both termini of the complex in the axial position, with statistics at right. Taken from Braig et al. (Reference Braig, Simon, Furuya, Hainfeld and Horwich1993).

Overall, by this point, if one had taken the observations concerning substrate binding within a chaperonin cavity with coaxial binding of GroES to GroEL, and considered the findings of Viitanen et al. (Reference Viitanen, Lorimer, Seetharam, Gupta, Oppenheim, Thomas and Cowan1992a) concerning Hsp10-driven folding of Rubisco by a single-ring mammalian mitochondrial Hsp60 in the presence of MgATP, one would have been able to conclude that cis complexes, where substrate protein lies in the cavity underneath GroES, were mediating productive folding. This was commented on by Braig et al. in their DHFR study. There was, however, considerable skepticism in the field about whether the single-ring mammalian Hsp60 remained single ring throughout its active cycle. Because all other chaperonins in three kingdoms of life were observed as double-ring assemblies, there was the presumption that this version of Hsp60 must become a double ring at some point during its reaction cycle. This complicated making any immediate conclusion about the folding-active state.
The two major domains of each GroEL subunit are interconnected by a ‘hinge’ at the outer aspect of the cylinder, the central cavity is blocked at the equatorial level of each ring, and density potentially corresponding to bound substrate polypeptide appears in the terminal aspect of the central cavity of open rings
Also in May of 1993, Saibil et al. (Reference Saibil, Zheng, Roseman, Hunter, Watson, Chen, auf der Mauer, O'Hara, Wood, Mann, Barnett and Ellis1993) reported a negative stain EM study with tilt reconstruction of GroEL purified from unmodified Rhodobacter spheroides, a purple bacterium (α-proteobacterium) that is active in both photosynthesis and nitrogen fixation. Both a tilt series and the use of sevenfold rotational symmetry allowed the production of 3D reconstructions (Fig. 30). The two major domains of the subunits of each of the two rings (recognized as comprising the four stripes in other studies) were readily resolved, the back-to-back orientation of the two rings across the equatorial plane was confirmed (by equivalence of the inner and outer major domains to each other), and a connection between the two major domains was observed at the outer aspect of the cylinder at the intermediate level in each ring. Most interesting, however, were densities along the sevenfold axis of symmetry within the central cavity. At the outer (apical) domain level of the rings, there were masses at the center of the cavity, more intense in one ring than the other. These were suspected to represent a composite of bound R. spheroides substrate proteins. Consistently, the masses were reduced in intensity following ATP treatment in vitro.
3D reconstruction of GroEL from R. sphaeroides using tilt views of single particles in negative stain EM. (a) Cutaway view showing axial masses in the central cavity at apical and equatorial levels. (b) Exterior view. Adapted from Saibil et al. (Reference Saibil, Zheng, Roseman, Hunter, Watson, Chen, auf der Mauer, O'Hara, Wood, Mann, Barnett and Ellis1993), with permission from Elsevier, copyright 1993.

There were also axial masses at the equatorial level, one in each ring, found to be invariant across various conditions and preparations and believed to be part of the chaperonin structure. The investigators did not speculate on their origin, but the earlier study of Langer et al. (Reference Langer, Pfeifer, Martin, Baumeister and Hartl1992b) had indicated that proteolytic treatment of GroEL caused C-terminal truncations to occur, cleaving at minimum a GGM repeat motif (comprising the 13 C-terminal aa's) that was likely to be disordered and protease susceptible. Such cleavage was noted in that study to be without effect on sevenfold symmetry or the four-striped pattern of GroEL. Thus, this left it possible that the axial equatorial masses were comprised by the collective of C-termini of each ring (>10 kDa of mass per ring). This possibility was verified ultimately by the GroEL crystal structure which resolved all residues of the subunit within the two major domains and interconnecting region (intermediate domain) but not the C-terminal 25 aa's. Indeed, the last residues in density (β strand aa519–523) pointed directly into the central cavity at the equatorial level (see page 51).
CryoEM reveals terminal (apical) domains of GroES-bound GroEL ring are elevated by 60° and polypeptide can be detected in the ring opposite bound GroES
In September 1994, Chen et al. (Reference Chen, Roseman, Hunter, Wood, Burston, Ranson, Clarke and Saibil1994) reported on cryoEM images of E. coli GroEL in a number of states: after addition of unfolded porcine mitochondrial malate dehydrogenase (MDH), after addition of ATP, after addition of ATP/GroES, or after addition of MDH and then ATP/GroES. CryoEM side and end views were used with symmetry averaging to derive 3D reconstructions of the various complexes at ~25 Å resolution. As in the R. spheroides study, the density for bound MDH localized in the central cavity at the level of the outer (apical) domains, supported by difference maps with unliganded GroEL (Fig. 31a). In this study, as compared with the densities seen in both terminal cavity regions of R. spheroides, MDH localized to only one ring, suggesting the possibility of a negative cooperative effect on the opposite ring. When GroEL was incubated with ATP, the terminal apical domains of at least one ring appeared to elevate/open slightly, contradicting inward tilting movement of subunits that had been reported in the R. spheroides study.
CryoEM analysis of substrate (MDH)-bound GroEL and GroEL/GroES/ATP complexes. (a) Difference maps subtracting the density of unliganded GroEL from MDH-bound complexes, revealing MDH density as a black mass in a central cavity in end view and showing a ‘champagne cork’ extension of density from the cavity of the occupied ring in side view. (b) GroEL/GroES complex formed in ATP shows GroES atop elevated apical domains of the bound GroEL ring. Right-hand image is cavity-displaying section of the map at left, showing a large dome-shaped cavity underneath GroES. This had a major implication that there might be sufficient volume within a GroES-bound GroEL ring for folding to occur within. Adapted from Chen et al. (Reference Chen, Roseman, Hunter, Wood, Burston, Ranson, Clarke and Saibil1994), by permission from Springer Nature, copyright 1994.

When MgATP/GroES was added to GroEL and the samples were frozen after 15–30 s, asymmetric GroEL/GroES complexes were observed (Fig. 31b). Here, the density for the body of GroES and that of the terminal apical domains could be distinguished, and the apical domains of the GroES-bound ring were observed to have elevated 60°. This revealed a considerable enlargement of the cavity inside the encapsulated (cis) ring, as compared with the relatively closed cavity of the opposite ring, and it was commented that ‘an enclosed, dome-shaped volume of maximum height 65 Å and maximum width 80 Å is formed by GroES binding and the hinge opening.’ (Note that ‘hinge opening’ here refers to opening about a horizontal axis at the intermediate level of the subunit, with respect to relatively stable inner equatorial domains.)
In a third analysis, when GroES/ATP was added to GroEL/MDH and freezing conducted 15 s thereafter, density for MDH was observed in the ring opposite GroES. Because of the order of addition here, polypeptide then GroES, one would be left to infer that GroES could not bind to a polypeptide-occupied ring since it was not observed in a GroES-bound ring, and it was commented explicitly that ‘substrate is not seen in the GroES-encapsulated cavity’. In retrospect, the EM images of ternary complexes captured the physiologic acceptor state for the non-native polypeptide. This was supported by a preceding study of Ishii et al. (Reference Ishii, Taguchi, Sasabe and Yoshida1994; Fig. 32). They had observed in negative stain EM with antibody to IPMDH that the IPMDH subunit diluted from 8 M urea became bound to the open (trans) ring of the isolated T. thermophilus asymmetric GroEL/GroES complex [in the absence of added nucleotide; their isolated complex contained stably bound ADP as reported in Yoshida et al. (Reference Yoshida, Ishii, Muneyuki, Taguchi, Ellis, Laskey and Lorimer1993)]. Yet why were Chen et al. (Reference Chen, Roseman, Hunter, Wood, Burston, Ranson, Clarke and Saibil1994) not able to resolve the presence of cis ternary complexes, with a polypeptide in the GroES-bound ring of GroEL, after GroES/ATP incubation with GroEL/MDH? Even had their reaction turned over to some extent, there were surely cis complexes present (as revealed by later studies). It seems likely in retrospect that the density of folding conformations of MDH polypeptide released from the cavity wall and diffusely localized in the cis chamber was simply not sufficient for detection, as compared with a polypeptide in an open GroEL ring bound more locally on the apical domains. In the latter case, the trapped trans apical domain-bound state could apparently even survive sevenfold averaging to appear as density. Cis topology was thus left for resolution via biochemical experiments reported in the following year.Footnote 16
Substrate polypeptide bound to open ring of the asymmetric GroEL/GroES complex from T. thermophilus. IPMDH was observed to bind to the open ring (opposite that bound by GroES) of the asymmetric GroEL/GroES/ADP complex purified from T. thermophilus, detected by incubation with anti-IPMDH antibody and negative stain EM. Adapted from Ishii et al. (Reference Ishii, Taguchi, Sasabe and Yoshida1994), with permission from Elsevier, copyright 1994.

GroES contacts GroEL via a mobile loop domain visible in NMR
In July 1993, Landry et al. (Reference Landry, Zeilstra-Ryalls, Fayet, Georgopoulos and Gierasch1993) reported on a mobile region in GroES that makes contact with GroEL. Their study was initiated by the unexpected observation that, when purified GroES was examined by one-dimensional proton NMR, a set of sharp peaks was observed (Fig. 33), not at all expected for a 70 kDa protein that should produce broad peaks as a result of its relatively slow tumbling (long rotational correlation time). This indicated that there must be a region(s) with high mobility. Remarkably, these peaks broadened upon ATP-directed association of GroES with GroEL, suggesting that this region is involved in the physical association of GroES with GroEL. To map the mobile region, 2D TOCSY (total correlated) and NOESY (nuclear Overhauser effect) spectra were obtained, exhibiting well-resolved cross-peaks. Sequential assignment identified residues 17–32 (of the 97 aa GroES polypeptide chain) as being mobile. No secondary structure could be observed from the spectra (with the similarity of all of the αH chemical shifts). The investigators recognized that, of the 17 originally-isolated groE mutations that block λ phage propagation (Georgopoulos et al., Reference Georgopoulos, Hendrix, Casjens and Kaiser1973), the seven mutations that map within GroES all map into this GroES mobile loop, the alterations presumably abrogating complex formation with GroEL. Notably also, the primary sequence of this region was observed to be conserved in mammalian Hsp10 (Lubben et al., Reference Lubben, Gatenby, Donaldson, Lorimer and Viitanen1990) and in the chloroplast equivalent. [Interestingly, the plant Hsp10 coding sequence contains a tandem duplication of two GroES-related sequences (Bertsch et al., Reference Bertsch, Soll, Seetharam and Viitanen1992).].
1H resonances of a mobile region of purified GroES (70 kDa), particularly at 1.22 ppm, arrow in (a), that broaden upon the association with GroEL in ATP, panel (c). Reprinted from Landry et al. (Reference Landry, Zeilstra-Ryalls, Fayet, Georgopoulos and Gierasch1993), by permission from Springer Nature, copyright 1993.
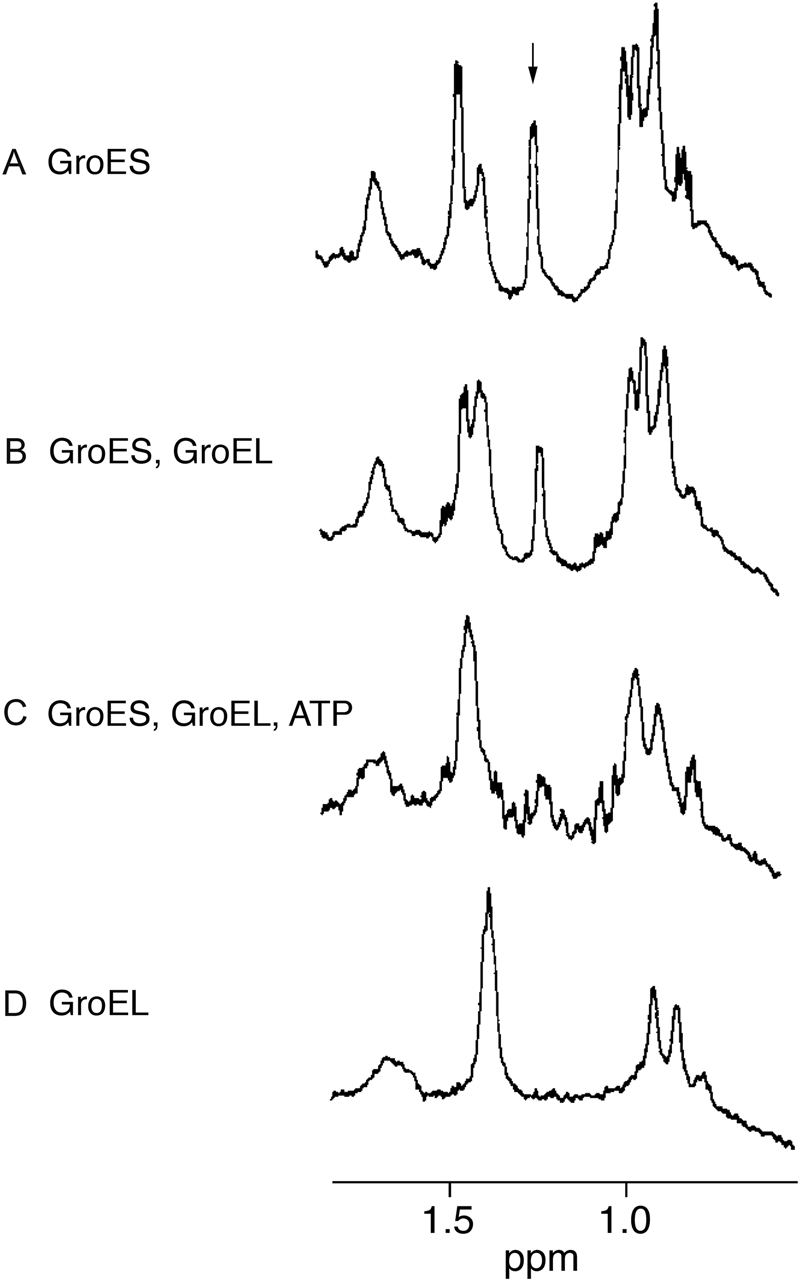
A synthetic peptide bearing the GroES sequence 12–31 was shown to be able to exhibit transferred NOEs upon incubation with GroEL, most prominent around an IVL sequence in the distal sequence of the loop (aa 25–27). This suggested that hydrophobic contact with GroEL might be occurring, indeed subsequently validated by the crystal structure of GroEL/GroES/ADP7 (Xu et al., Reference Xu, Horwich and Sigler1997). Landry et al. suggested that the mobile loop takes up a hairpin conformation upon binding to GroEL, considering the observation of transferred-NOEs between 20Hα/26Hα and 21Hβ/27Hδ in the synthetic mobile loop peptide.Footnote 17 The investigators discussed that concomitant binding of seven GroES mobile loops to seven GroEL subunits might ‘…release substrate from all GroEL sites simultaneously’, a conclusion that was subsequently supported.
Polypeptide binding by GroEL in vitro
Stoichiometry of binding
In September 1989, preceding the December report of GroEL/GroES-mediated reconstitution of Rubisco folding by Goloubinoff et al., a report by Lecker et al. (Reference Lecker, Lill, Ziegelhoffer, Georgopoulos, Bassford, Kumamoto and Wickner1989) examined binding in vitro of the secretory precursor of the outer membrane porin, proOmpA, by purified GroEL as well as by the purified bacterial components trigger factor and SecB. When proOmpA was diluted from 8 M urea, it formed stable complexes with any of the three purified chaperone components as demonstrated by sedimentation through linear sucrose gradients. A 1:1 stoichiometry of binding by the components was supported because a twofold molar excess of proOmpA over the components had been supplied, and ~50% of the proOmpA was recovered with each component. Binding to GroEL was observed to be reversible (in the absence of nucleotide) because incubation of gradient-isolated proOmpA/GroEL complex with SecB led to the transfer of proOmpA to SecB.
A 1:1 stoichiometry of binding by GroEL was also reported by Laminet et al. (Reference Laminet, Ziegelhoffer, Georgopoulos and Plückthun1990), examining the ability of purified GroEL to block spontaneous renaturation of pre-β-lactamase following dilution from 8 M urea into a buffer containing increasing amounts of chaperonin – at 1:1 stoichiometry, the activity failed to be recovered. In a further test, it was observed that when enzymatically active pre-β-lactamase was incubated with GroEL, it gradually lost its enzymatic activity, suggesting that it became unfolded and associated with the chaperonin. Apparent association with GroEL was associated with a shift from a relatively trypsin-resistant native form to a form that was much more sensitive to the protease, reflecting the sensitivity of an unfolded state and resembling the pre-β-lactamase directly bound to GroEL following dilution from denaturant. Consistent with the binding of non-native forms coming either from denaturant or from the native state to GroEL, the addition of MgATP and GroES led to the recovery of activity.
Kinetic competition – binding by GroEL competes against aggregation of substrate protein
In February 1991, Buchner et al. (Reference Buchner, Schmidt, Fuchs, Jaenicke, Rudloph, Schmid and Kiefhaber1991) reported that, after dilution of denatured pig heart citrate synthase (CS) from 6 M GuHCl, binding of the subunit (42 kDa) by GroEL competed against aggregation. First, in the absence of GroEL, the investigators observed that aggregation, measured here directly by light scattering, competed with spontaneous refolding/assembly of the native state in a concentration-dependent manner (Fig. 34). In particular, at 100 nM concentration of subunit, there was a maximum recovery of enzymatic activity (Fig. 34a) with the absence of light scattering (Fig. 34b); at 200 nM, there were intermediate levels of both recovery and light scattering; while at 300 nM and greater, there was no recovery of activity but increasingly rapid and higher amplitude light scattering (t ½ <15 s). Strikingly, when CS was diluted to 300 nM concentration in a buffer containing a twofold or sixfold molar excess of GroEL, light scattering was completely suppressed. If GroES and MgATP were also present, the activity was recovered to a level resembling the spontaneous recovery observed at low (100 nM) concentration of subunit.
Competition in solution between folding to native form and aggregation. (a) Decreased spontaneous refolding at 25 °C of citrate synthase (CS) with increased concentration after dilution from denaturant to the concentrations indicated. (b) Decreased recovery with increasing concentration correlates with the development of light scattering at 500 nm as a measure of aggregation. Adapted with permission from Buchner et al. (Reference Buchner, Schmidt, Fuchs, Jaenicke, Rudloph, Schmid and Kiefhaber1991). Copyright (1991) American Chemical Society.
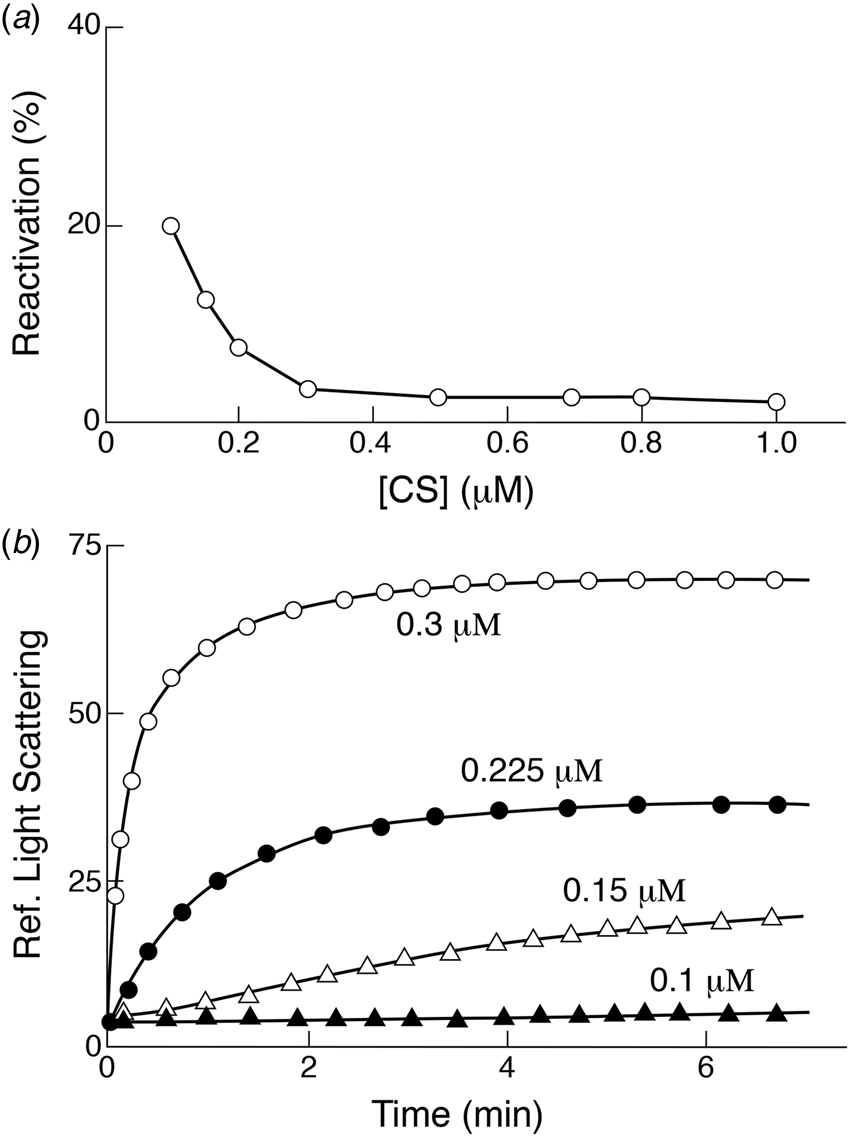
The investigators commented on the different timescales of the competing reactions, seconds for aggregation (see Fig. 34b), a higher order and very fast process, versus minutes for spontaneous folding, reflecting that aggregation occurred well before the rate-limiting step of folding. In the presence of GroEL, the kinetic competition must thus be taking place between binding a critical early folding intermediate and aggregation.
In a final experiment, when GroEL was added to spontaneous refolding reactions that were already aggregating (e.g. 30 s after dilution from denaturant), it could halt further light scattering but could not reverse aggregation which had already developed. This directly supported the implied aggregation behavior of the earlier Rubisco renaturation study (Goloubinoff et al., Reference Goloubinoff, Christeller, Gatenby and Lorimer1989b). There, when GroEL had been added at later times (5–60 s) after dilution of Rubisco from denaturant (under conditions where no spontaneous recovery occurred), reduced recovery of active Rubisco (upon subsequent addition of ATP/GroES) was observed relative to that when GroEL was present at the time of dilution from denaturant (Fig. 19). Thus, as measured both indirectly with Rubisco and directly with CS, GroEL cannot bind/rescue already-aggregated protein.
Binding by GroEL competes also against thermally-induced aggregation
In December 1991, Höll-Neugebauer et al. (Reference Höll-Neugebauer, Rudolph, Schmidt and Buchner1991) showed that GroEL could also block thermally-induced aggregation, studying the enzyme α-glucosidase. They observed that the purified enzyme is inactivated by exposure to temperatures above 42 °C, with aggregation following in roughly the same time window. The presence of GroEL during heat treatment did not affect inactivation but blocked aggregation. When the reaction mixture was cooled to 25°, the addition of ATP or ATP/GroES then led to the recovery of activity. If either addition was performed at the high temperature, the α-glucosidase was released and aggregated, with ATP/GroES promoting a more rapid release/aggregation than ATP. Thus, GroEL could apparently recognize one or more intermediates formed either following dilution from chemical denaturant or following thermally-induced unfolding. Similar protection by GroEL was also reported thereafter for the enzyme rhodanese (Mendoza et al., Reference Mendoza, Lorimer and Horowitz1992; see also Zahn and Plückthun, Reference Zahn and Plückthun1994).
MgATP and non-hydrolyzable Mg-AMP-PNP reduce the affinity of GroEL for substrate protein; proposal of a distinction between ATP-binding-mediated substrate protein release and ATP hydrolysis-mediated reset
In May 1991, Badcoe et al. (Reference Badcoe, Smith, Wood, Halsall, Holbrook, Lund and Clarke1991) reported on spontaneous refolding/assembly of a thermophilic B. stearothermophilus LDH (dimeric) enzyme and on interaction with GroEL. First, the enzyme was studied by equilibrium denaturation at a range of GuHCl concentrations from 2.0 to 4.0 M followed by 100-fold dilution and recovery of activity in enzyme assay buffer (measured continuously by NADH absorbance). The data fit a scheme that entailed sequential conversion of the random coil monomer to two successive monomeric intermediates and active dimer. Even at high concentration, where dimerization should not be rate-limiting, there was still a lag phase to recovery, supporting the presence of at least two unimolecular steps. With a single Trp substituted into the LDH (at aa147), a broad decrease of fluorescence intensity was observed between 2.0 and 4.0 M GuHCl, which might be consistent with the population of the three monomeric states (whose changes in population were correspondingly plotted). Across the concentration range, these were assigned as: a molten-globule state (for 2.0 M, but, in retrospect, a later-folded monomer seems also possible); a relatively unstable intermediate populated only at intermediate GuHCl concentration; and a random coil monomer.
As in the β-lactamase study, the presence of GroEL in dilution buffer blocked refolding of LDH from 4.0 M GuHCl, with a binding stoichiometry of 1:1. By contrast, when diluted from 2.0 M GuHCl, where a late monomeric state is populated, there was no inhibition of spontaneous recovery. This suggested that GroEL binds the earliest intermediates populated along the LDH refolding pathway.
Most interesting was the effect of nucleotide on the binding step (Fig. 35). If GroEL was preincubated in Mg/ATP or Mg/AMP-PNP, the suppression of refolding no longer occurred and refolding ensued, but with a lag phase substantially longer than in spontaneous refolding, suggesting that interaction does still occur. (GroES was apparently not required here as compared with the Rubisco refolding reaction.) This prompted the investigators to suggest that ATP or analogue binding changes the conformation of the chaperonin and leads to polypeptide (at least LDH) release. ATP hydrolysis could then reset GroEL to a conformation with high affinity for the substrate. The notion proposed here of a high affinity state of unliganded GroEL for substrate and a nucleotide binding-directed low affinity state was prescient. The investigators also noted that nucleotide-driven release of LDH prompted refolding at the same rate as the spontaneous reaction. GroEL thus did not appear to act as a catalyst, consistent with the observation that it binds the earliest folding states of LDH, preventing them from aggregating, as opposed to binding later transition states between folding intermediates to accelerate the (slower) rate-limiting steps of folding. This agreed well with the conclusions of Buchner et al., Reference Buchner, Schmidt, Fuchs, Jaenicke, Rudloph, Schmid and Kiefhaber1991.
High- and low-affinity states of GroEL indicated by LDH refolding studies. LDH from B. stearothermophilus diluted from GuHCl into buffer folds spontaneously, but when GroEL is present, folding is arrested, presumably by binding. Pre-incubation of the chaperonin with MgATP or MgAMP-PNP prior to diluting LDH into the mixture allowed refolding to occur, albeit with an extended lag before reaching the same refolding rate as spontaneous. The lag likely reflects the relatively high affinity (K d~1 µM or less) of GroEL for the LDH folding intermediates even in the presence of nucleotide, coupled with a 20-fold excess of chaperonin. The release of folding inhibition supported the idea of a switch of GroEL conformation from a high-affinity state to low-affinity state for polypeptide directed by nucleotide. Reprinted with permission from Badcoe et al. (Reference Badcoe, Smith, Wood, Halsall, Holbrook, Lund and Clarke1991). Copyright (1991) American Chemical Society.
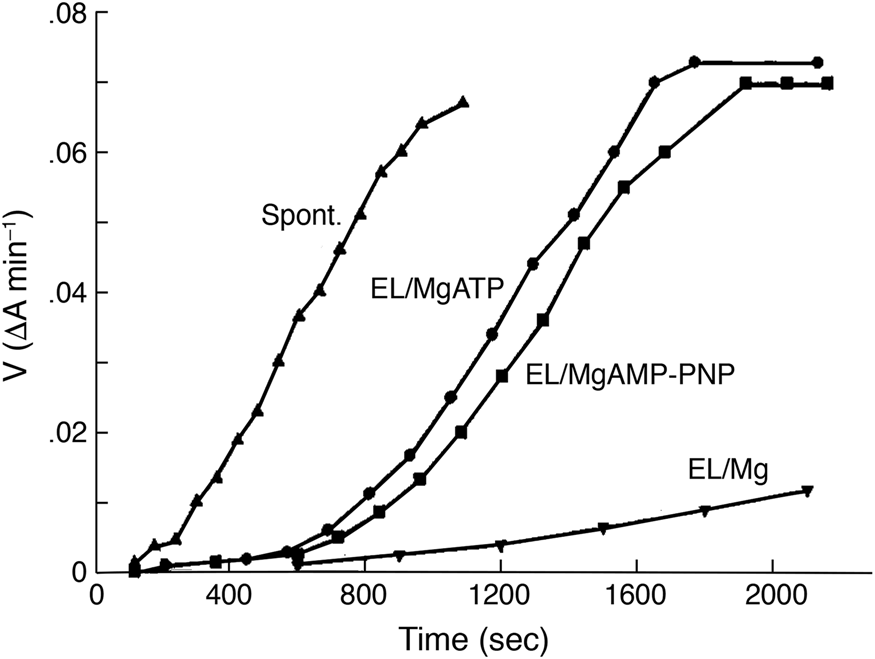
GroEL mimics the effect of a non-ionic detergent that prevents hydrophobic surfaces of a folding intermediate(s) of the substrate protein rhodanese from aggregating
In July 1991, Mendoza et al. (Reference Mendoza, Rogers, Lorimer and Horowitz1991), as well as Martin et al. (Reference Martin, Langer, Boteva, Schramel, Horwich and Hartl1991) (see below), reported on GroEL/GroES-mediated folding of bovine rhodanese, a monomeric thiosulfate:cyanide sulfurtransferase of 33 kDa, following dilution from 8 M urea. As in the original Rubisco reconstitution study of Lorimer and coworkers, refolding was observed to occur in two separable steps: binary complex formation with GroEL, followed by ATP/GroES-directed folding/release. Here, in the additional presence of reductant and thiosulfate (to avoid oxidation of the active site cysteine of rhodanese), nearly complete recovery of rhodanese activity was achieved. Taken with the preceding in vitro studies of renaturation of rhodanese by Horowitz and coworkers (see below), the investigators advanced the idea that hydrophobic interactions were likely to be involved in substrate binding.
The recovery of rhodanese activity after chemical denaturation was first observed by Horowitz and Simon (Reference Horowitz and Simon1986) when they diluted rhodanese from urea to low final concentrations, <1 µg ml−1 (0.03 µM), recovering ~10% activity. Shortly thereafter, in Horowitz and Criscimagna (Reference Horowitz and Criscimagna1986), it was observed that incubating rhodanese (at 200 µg ml−1) in concentrations of GuHCl ranging from 0.5 to 1.5 M produced turbid solutions, and that the rhodanese pelleted from these solutions was readily soluble in 2 M GuHCl and migrated in gel filtration as a monomer regardless of the presence of reductant. This indicated that non-covalent aggregates had been formed. It was conjectured that apolar interactions were involved in the formation of the aggregates and that the non-ionic detergent lauryl maltoside might prevent the formation of such aggregates. Indeed, the presence of this detergent completely prevented the quantitative aggregation/precipitation that otherwise occurred upon dilution into 1.5 M GuHCl (Fig. 36a; Horowitz and Criscimagna, Reference Horowitz and Criscimagna1986). The result was interpreted in respect to the crystal structure of rhodanese, which had revealed two similar parallel β-sheet domains (N and C), interconnected by a short segment, with the active site tucked in between them in a hydrophobic interface (Ploegman et al., Reference Ploegman, Drent, Kalk, Hol, Heinrikson, Keim, Weng and Russell1978; PDB 1RHD). It was speculated that the 1.5 M GuHCl concentration might separate the two domains, exposing the hydrophobic surfaces of the interface to produce intermolecular contacts and aggregation. Lauryl maltoside was presumed to stabilize the exposed hydrophobic surfaces, forestalling aggregation. Subsequently, a renaturation experiment was carried out employing dilution of rhodanese from 6 M GuHCl into a buffer containing lauryl maltoside, to a substantial final protein concentration of 50 µg ml−1 (1.5 µM; Tandon and Horowitz, Reference Tandon and Horowitz1986). Reactivation increased from zero, in the absence of the detergent, to a maximum of ~20% with 1–5 mg ml−1 detergent (Fig. 36b). In later studies including lauryl maltoside and also reducing agent and thiosulfate substrate to block intramolecular oxidation, recovery from 6 M GuHCl was nearly complete (Tandon and Horowitz, Reference Tandon and Horowitz1989). Equilibrium unfolding at various concentrations of GuHCl, monitored by enzymatic activity, Trp fluorescence, and CD, were then carried out and supported the presence of an intermediate in which activity is completely lost, the tryptophan residues (perhaps from the interface region) are exposed, but secondary structure is retained.
(a) Lauryl maltoside (LM) detergent (0.4 mg ml−1) blocks GuHCl-induced precipitation of 0.2 mg ml−1 rhodanese, which occurs maximally at ~1.5 M GuHCl. (b) Recovery of rhodanese activity after dilution from 6 M GuHCl as a function of lauryl maltoside concentration. Denatured rhodanese was diluted to 50 µg ml−1 in folding buffer containing the indicated concentrations of lauryl maltoside, and incubated for 90 min to allow refolding. Then single 20 min time-point assays were used to follow the recovery of enzyme activity. Adapted with permission from Horowitz and Criscimagna (Reference Horowitz and Criscimagna1986), copyright ASBMB, 1986; and Tandon and Horowitz (Reference Tandon and Horowitz1986), copyright ASBMB, 1986.
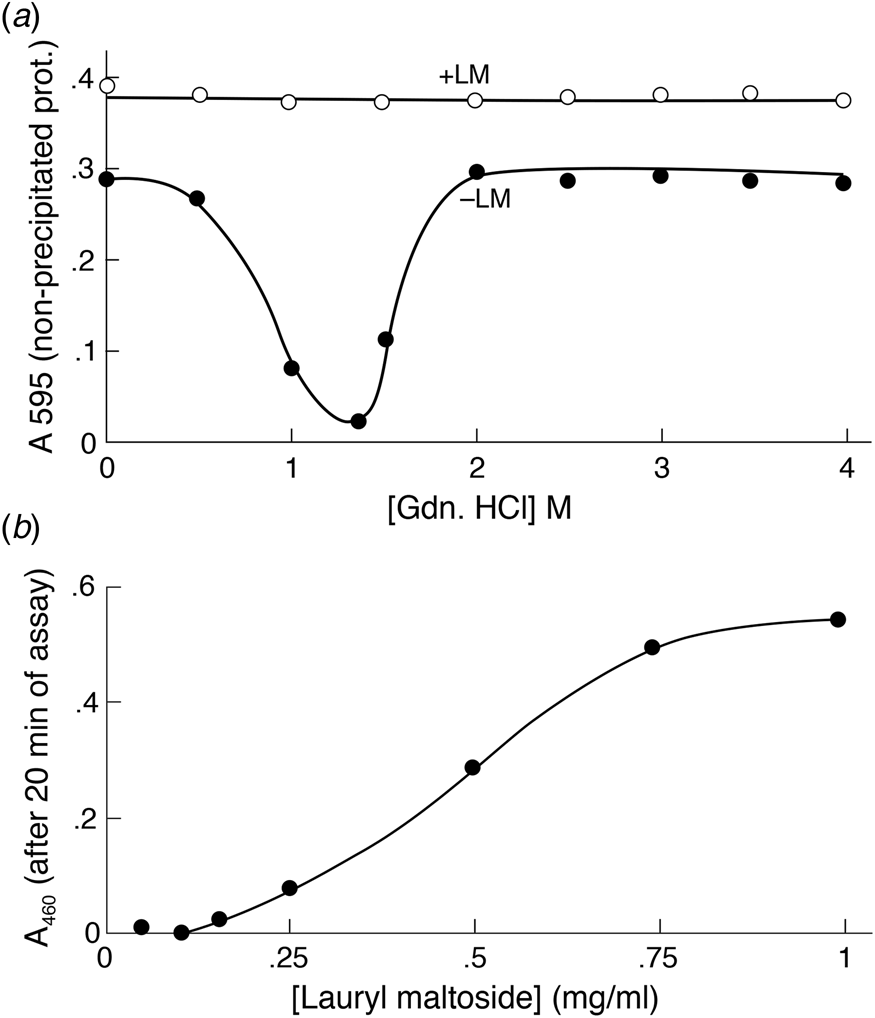
Thus overall, an early intermediate(s) of rhodanese exposing hydrophobic surface, perhaps from the domain interface, was observed to be subject to irreversible aggregation, explaining the lack of recovery of activity after dilution from denaturant. The aggregation could be prevented by the presence of the detergent lauryl maltoside, which could compete against this process, allowing rhodanese monomers to fold to the native state. These studies thus led these investigators, Mendoza et al. (Reference Mendoza, Rogers, Lorimer and Horowitz1991), as well as Martin et al. (Reference Martin, Langer, Boteva, Schramel, Horwich and Hartl1991; see below), to inspect the action of GroEL/GroES as countering aggregation of rhodanese. The ability of the GroEL/GroES system to efficiently refold rhodanese was taken as evidence that binary complex formation was masking hydrophobic surfaces of aggregation-prone intermediates. Consistently, a similar delay experiment to those made earlier with Rubisco (Goloubinoff et al., Reference Goloubinoff, Christeller, Gatenby and Lorimer1989b) and CS (Buchner et al., Reference Buchner, Schmidt, Fuchs, Jaenicke, Rudloph, Schmid and Kiefhaber1991) showed reduced recovery when the chaperonin system was supplied after dilution from denaturant (Fig. 37a). An additional test of ANS binding by GroEL alone was also carried out, as an assessment of its proffered hydrophobicity, showing a significant signal with GroEL, which was reduced when ATP/GroES was added (Fig. 37b). A Scatchard plot indicated 2.8 sites on GroEL, reduced to 1.5 in the presence of ATP/GroES. (The reduction, in retrospect, potentially reflects asymmetric binding behavior, displacing the hydrophobic apical sites of one ring of GroEL at a time by GroES.) Mendoza et al. presciently speculated that a hydrophobic binding site might lie within the central cavity of GroEL and that binding of GroEL/rhodanese binary complexes by ATP/GroES would weaken the hydrophobic interactions between rhodanese and GroEL, releasing rhodanese.Footnote 18
(a) Loss of rhodanese recovery with a time delay (x axis) before the addition of GroEL and GroES following dilution from 6 M GuHCl, for two final concentrations of rhodanese. (b) Signal of bis-ANS bound to GroEL is reduced by the addition of GroES/MgATP. An ~50% reduction was observed, consistent with an asymmetric displacement of a hydrophobic protein-binding surface in one of the two rings at a time by GroES/ATP binding. Adapted with permission from Mendoza et al. (Reference Mendoza, Rogers, Lorimer and Horowitz1991), copyright ASBMB, 1991.
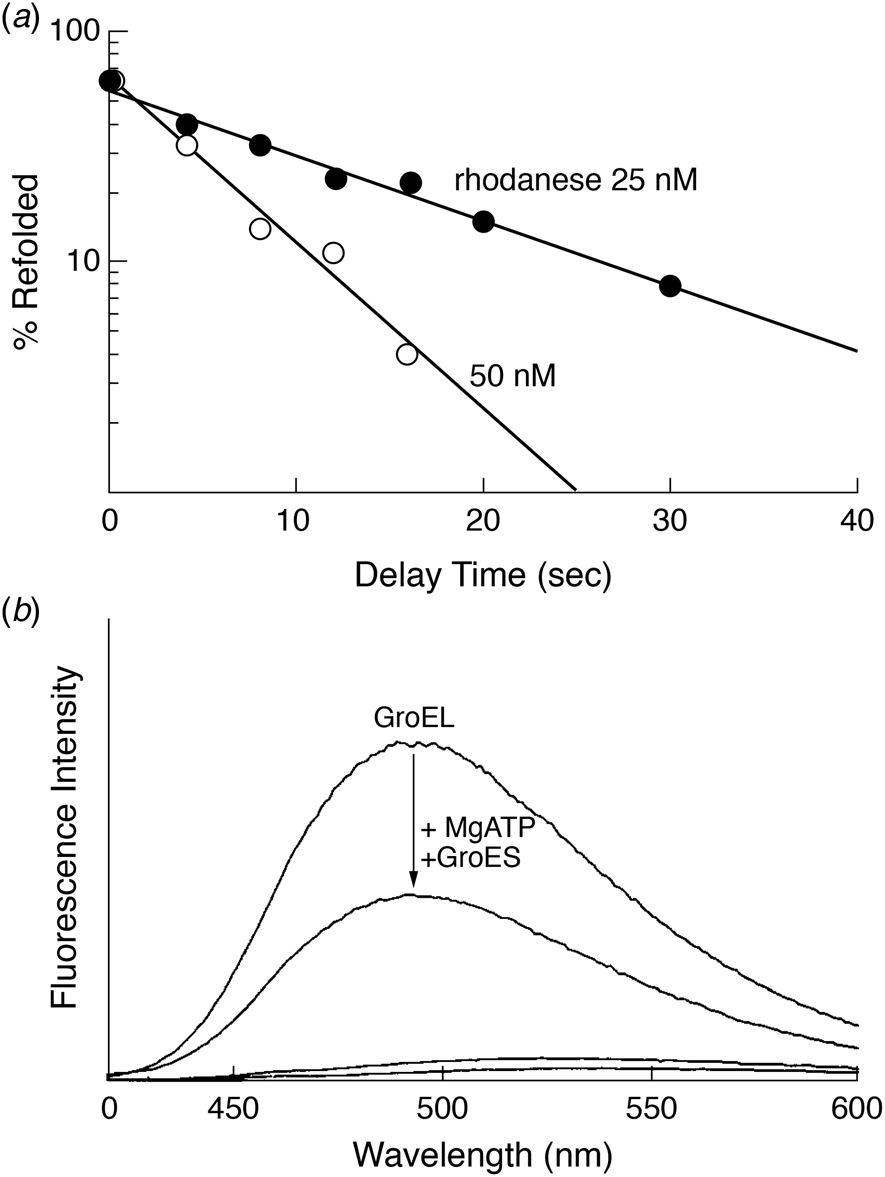
Intermediate conformations of two GroEL-bound proteins
Also in July 1991, Martin et al. (Reference Martin, Langer, Boteva, Schramel, Horwich and Hartl1991) reported on GroEL/GroES-mediated folding of bovine rhodanese, as well as chicken DHFR (21 kDa). As part of this study, the conformations of the two substrate proteins while bound to GroEL were examined. First, both were very susceptible to PK relative to the native state. Second, tryptophan fluorescence measurements (Fig. 38), availing of the fact that neither GroEL nor GroES contains tryptophan, revealed intermediate emission maxima, ~345 nm, midway between native (~330 nm) and unfolded (~355 nm) states of the two proteins, with the intensity of the intermediate maxima similar to that of the unfolded state, suggesting that one or more tryptophans were exposed to solvent (3 Trp in DHFR; 8 Trp in rhodanese). Finally, both substrate/GroEL binary complexes produced strong fluorescence in the presence of ANS (1-anilino naphthalene 8-sulfonate), compared with GroEL alone or with native or unfolded states of the two substrate proteins. The ANS signal was presumed to indicate that the bound proteins occupied early intermediate forms that exhibited solvated hydrophobic core regions. The intermediates were likened to ‘molten globule’ intermediates, collapsed early intermediate forms observed during in vitro refolding of a number of proteins. These had been proposed to be a possibly universal intermediate and found to exhibit a dynamic tertiary structure but already-formed native secondary structure (e.g. Kuwajima, Reference Kuwajima1989; Ptitsyn et al., Reference Ptitsyn, Pain, Semisotnov, Zerovnik and Razgulyaev1990). Notably, however, subsequent studies of α-lactalbumin binding by GroEL (Hayer-Hartl et al., Reference Hayer-Hartl, Ewbank, Creighton and Hartl1994; Okazaki et al., Reference Okazaki, Ikura, Nikkaido and Kuwajima1994; see page 42) and hydrogen–deuterium exchange of a form bound to GroEL (Robinson et al., Reference Robinson, Groβ, Eyles, Ewbank, Mayhew, Hartl, Dobson and Radford1994; see page 42) did not support the presence of a native-like secondary structure as would be present in a molten globule species. Quite the opposite, the study of Zahn et al. (Reference Zahn, Spitzfaden, Ottiger, Wüthrich and Plückthun1994) observed a complete loss of secondary structure upon the association of cyclophilin with GroEL (see page 42). Also, later solution NMR studies examining DHFR and rhodanese in complex with GroEL (Horst et al., Reference Horst, Bertelsen, Fiaux, Wider, Horwich and Wüthrich2005; Koculi et al., Reference Koculi, Horst, Horwich and Wüthrich2011) failed to observe any stable secondary structure of GroEL-bound substrate proteins (see page 97).
Tryptophan fluorescence emission spectrum of rhodanese bound to GroEL (Int.EL), i.e. intermediate complexed with GroEL, has an emission maximum at a wavelength between those of native rhodanese (N) or refolded rhodanese (Int.EL + ES/ATP) and unfolded (U) rhodanese. Taken from Martin et al. (Reference Martin, Langer, Boteva, Schramel, Horwich and Hartl1991).

This said, Martin et al. commented that ‘the structural features of unfolded proteins recognized by GroEL are so far unknown. The molten globule…is thought to expose hydrophobic patches, resulting in the tendency to aggregate. It is unclear whether GroEL interacts with contiguous sequences…or perhaps with structural elements produced by the spatial arrangement of an early folding intermediate. In any case, it has to be assumed that these bound elements are buried within the folding structure on Mg-ATP-dependent release from GroEL.’
DHFR in the absence of a ligand can associate with GroEL
In October 1991, Viitanen et al. (Reference Viitanen, Donaldson, Lorimer, Lubben and Gatenby1991) reported that native mouse DHFR incubated with GroEL could become bound to it on a timescale of 15 min. Notably, if a DHFR ligand such as dihydrofolate was present, binding did not occur. This suggested that, in the absence of ligand stabilizing the native state of DHFR, it could slowly spontaneously unfold and could populate a state(s) recognized by GroEL.
Binding in vitro to GroEL of a large fraction of soluble E. coli protein species upon dilution from denaturant
In March 1992, Viitanen et al. (Reference Viitanen, Gatenby and Lorimer1992b) reported that, following denaturation of soluble in vivo-radiolabeled E. coli proteins in 5 M GuHCl, approximately half of the species associated with GroEL following dilution from denaturant, with molecular masses ranging from ~20 kDa up to 150 kDa. By contrast, the collective of native proteins (not incubated with GuHCl) did not exhibit any association with GroEL (nor did native Rubisco dimer), suggesting that the instability observed for unliganded DHFR was not likely to be a general property. The binary complexes with E. coli proteins were found to be stable to rechromatography, suggesting a slow off-rate; based on a diffusion-limited on-rate and a conservative off-rate with halftime of 30 min, an affinity of subnanomolar for substrates was estimated. A delay experiment was also conducted, as in the studies of Rubisco, CS, and rhodanese, producing, as expected, reduced association with GroEL at later times (here, 4 °C was employed, prior to room temperature gel filtration; at the first time-point at half hour, association was reduced by nearly 50%). Overall, it seemed clear that a feature present in many or most soluble E. coli species, presumably in early intermediate forms produced following dilution from GuHCl, can be recognized by GroEL in vitro. The study of Mendoza et al. (Reference Mendoza, Rogers, Lorimer and Horowitz1991), discussed above, supported that the feature could be hydrophobic side chains that become exposed in early folding intermediates (buried in the native state) that direct multimolecular aggregation (see also Brems et al., Reference Brems, Plaisted, Kauffman and Havel1986; Mitraki et al., Reference Mitraki, Betton, Desmadril and Yon1987; Mitraki and King, Reference Mitraki and King1989).
Properties of a Rubisco early intermediate recognized by GroEL
In April 1992, van der Vies et al. (Reference van der Vies, Viitanen, Gatenby, Lorimer and Jaenicke1992) reported on the features of the early aggregation-prone intermediate of Rubisco and on its recognition by GroEL. They availed of observations reported by Viitanen et al. (Reference Viitanen, Lubben, Reed, Goloubinoff, O'Keefe and Lorimer1990), that Rubisco could efficiently spontaneously refold following dilution from GuHCl denaturant at temperatures of ~20 °C or below (Fig. 39). (It was not commented on, but note that, in relation to exposed hydrophobic surfaces driving aggregation of early intermediates, as proposed by Horowitz and coworkers, such action of hydrophobicity is reduced at lower temperatures.Footnote 19) In the case here of Rubisco, it was observed that up to 160 nM Rubisco could spontaneously refold at 4 °C (t ½ = 5 h) without significant aggregation. If higher concentration was employed, the amount above 160 nM rapidly aggregated (<5 min). If GroEL was present, it quantitatively bound Rubisco upon dilution from denaturant, blocking spontaneous refolding to the active form. Later addition (at 25 °C) of GroES and ATP to the mixture then produced the recovery of Rubisco activity. Thus, considering the results parsimoniously, the ‘early intermediate’ that is accessible to GroEL can also fold spontaneously to native form at 4 °C.
Temperature-dependence of spontaneous refolding of Rubisco following dilution from GuHCl denaturant. Recovery is sharply increased below 20 °C. This reflects on the original reconstitution studies of Goloubinoff et al. (Reference Goloubinoff, Christeller, Gatenby and Lorimer1989b) where no spontaneous refolding occurred at 25 °C. It also reflects on more general observations that multimolecular aggregation is reduced at a lower temperature, and thus at a lower temperature, there is a reduced competition of this process with productive folding (see text). Reprinted with permission from Viitanen et al. (Reference Viitanen, Lubben, Reed, Goloubinoff, O'Keefe and Lorimer1990). Copyright (1990) American Chemical Society.

Because the early Rubisco intermediate is populated upon dilution from denaturant within apparently seconds (Trp fluorescence data), but reaches native form spontaneously only after hours, a period of a half hour was employed to take physical measurements. CD studies revealed a helix content about two-thirds that of the native state; ANS binding was appreciable (but less than for acid unfolded states); and Trp fluorescence exhibited the same intermediate emission max between unfolded and native as had been observed for DHFR and rhodanese while they were associated with GroEL (Martin et al., Reference Martin, Langer, Boteva, Schramel, Horwich and Hartl1991). Yet the observation of secondary structure in the unbound intermediate in this experiment (by far UV CD) does not accurately reflect the general lack of secondary structure observed in bound proteins (see studies below).
Complete loss of secondary structure of cyclophilin upon binding to GroEL
In March 1994, Zahn et al. (Reference Zahn, Spitzfaden, Ottiger, Wüthrich and Plückthun1994) reported the complete destabilization of the secondary structure of the small β-barrel protein human cyclophilin (163 aa) upon binding to GroEL. They observed that when GroEL is added at an increasing concentration to native cyclophilin at pH 6 and 30 °C, the PPIase activity of cyclophilin becomes progressively lost, reaching ~50% at equimolar and ~30% at 2:1 GroEL:cyclophilin stoichiometry. This was the basis to a hydrogen–deuterium exchange experiment incubating equimolar GroEL and cyclophilin under the pH 6/30 °C condition in D2O for 8 h, followed by cooling to 6 °C for 14 h to dissociate cyclophilin from GroEL (allowing refolding to native form), then repeating this cycle two additional times to assure that all of the cyclophilin in the mixture had undergone association with GroEL. Remarkably, the 2D-COSY spectrum of the recovered (native) cyclophilin was completely blank – all of the amide protons had been replaced by deuterium. That the recovered cyclophilin was indeed native was then demonstrated by incubating it in H2O at 26 °C for 2 weeks and collecting another spectrum, which now appeared like that of native cyclophilin, except that the amide protons known to be most slowly exchanging in native cyclophilin exhibited very weak signals, as expected for exchange of the native deuterated protein. If the cycling experiment was carried out in the absence of GroEL, much of the cyclophilin was exchanged but now the most slowly exchanging amide protons were not exchanged to any significant extent, thus implicating association with GroEL as having mediated exchange of these amide protons (for deuterons). Thus GroEL appeared to destabilize the entire cyclophilin secondary structure, and the investigators suggested that ‘the chaperone may interact with interior side-chains to shift the equilibrium towards an unfolded state.’Footnote 20
Molten globule form of α-lactalbumin is not recognized by GroEL whereas more unfolded intermediates are bound
In July 1994, two groups, Okazaki et al. (Reference Okazaki, Ikura, Nikkaido and Kuwajima1994) and Hayer-Hartl et al. (Reference Hayer-Hartl, Ewbank, Creighton and Hartl1994), reported on the recognition by GroEL of various forms of α-lactalbumin, a 123-amino acid secretory protein containing 4 disulfides and a bound Ca2+ in its native state. This protein, while not normally located in reducing compartments with chaperonins, was nonetheless informative because it could be manipulated to populate various structural states whose recognition by GroEL in vitro could be analyzed. First, both groups stripped the protein of its Ca+2 ion by EGTA treatment. The apo (oxidized) species produced had been recognized to occupy a molten globule state and, consistent with this, Okazaki et al. showed that the apo state in free solution in the absence of KCl exhibited significant secondary structure in far UV CD but lacked tertiary structure in near UV CD. Neither group could detect any binding of this state by GroEL using gel filtration, and Okazaki et al. could also not observe any effect of GroEL in a more sensitive hydrogen exchange kinetic experiment. By contrast, in the hands of both groups, reduced (and EGTA-chelated) forms of α-lactalbumin were readily bound to GroEL. The reduction was associated with diminished secondary structure, and both groups commented that the population of a more flexible exposed structure would further expose hydrophobic surfaces. In the Hayer-Hartl et al. study, various partially reduced forms (in some cases alkylated) were compared with the fully reduced form. A three-disulfide rearranged form was bound by GroEL approximately as well as the fully reduced form.
Hydrogen–deuterium exchange experiment on GroEL-bound α-lactalbumin
In December 1994, Robinson et al. (Reference Robinson, Groβ, Eyles, Ewbank, Mayhew, Hartl, Dobson and Radford1994) reported on a hydrogen–deuterium exchange experiment carried out on a binary complex of deuterated three-disulfide-rearranged α-lactalbumin (chelated, with reduced 6–120 disulfide and a set of three-disulfide bond intermediates) and GroEL, analyzing the deuterium–hydrogen exchange reaction by direct electrospray ionization mass spectrometry. After 20 min in H2O at 4 °C, only 20 deuterons remained in α-lactalbumin, and after 20 min at 20 °C, only six deuterons remained. This indicated low protection factors relative to the similarly exchanged free native holoprotein (protection factor is the ratio of the intrinsic rate of exchange for a given amino acid in a random coil structure to the observed rate of exchange). The interpretation admitted to ignoring the possibility of hydrogen bonding of substrate protein to the GroEL cavity wall as a source of exchange protection.
Hydrogen–deuterium exchange studies on other proteins in binary complexes
Additional exchange studies on larger substrate proteins, human DHFR (20 kDa) and MDH (33 kDa), in binary complex with GroEL were reported later, but here also observed very low protection of the GroEL-bound state (Groβ et al., Reference Groβ, Robinson, Mayhew, Hartl and Radford1996; Goldberg et al., Reference Goldberg, Zhang, Sondek, Matthews, Fox and Horwich1997; Chen et al., Reference Chen, Walter, Horwich and Smith2001). For example, GroEL-bound human DHFR exhibited protection factors determined for its 182 amino acids ranging from 0 to 50 (determined by NMR; see FootnoteFootnote 21 concerning protocol), while the same residues in native DHFR ranged in protection from 16 000 to 330 million. Further informative is the later direct inspection by NMR of isotopically labeled substrate proteins (DHFR and rhodanese) while bound to (perdeuterated) GroEL, unable to detect any stable secondary structure (see page 97; Horst et al., Reference Horst, Bertelsen, Fiaux, Wider, Horwich and Wüthrich2005; Koculi et al., Reference Koculi, Horst, Horwich and Wüthrich2011).
Brief summary of early studies of recognition by GroEL
From the foregoing early studies, by 1994, it seemed overall that folding intermediates exposing hydrophobic surfaces are recognized and bound by GroEL. A preference for hydrophobic surfaces was supported by the lauryl maltoside studies of rhodanese and by ANS binding and Trp fluorescence measurements on a number of bound non-native protein species. Bound proteins appeared to exhibit a weakly structured state, evidenced by protease accessibility, by the preference of GroEL for α-lactalbumin in a reduced form, and by low protection of a number of bound proteins from hydrogen–deuterium exchange. Whereas a significant amount of secondary structure was observed in some intermediate states while free in solution (far UV CD of Rubisco, e.g.), when such intermediates or ones in equilibrium with them became bound by GroEL, secondary structure was generally minimal or absent as indicated by the exchange study of cyclophilin and by the low protection from hydrogen–deuterium exchange of bound proteins [see also the later NMR study, Horst et al. (Reference Horst, Bertelsen, Fiaux, Wider, Horwich and Wüthrich2005), observing bound substrate, page 97]. Thus, from an ensemble of non-native intermediate states in equilibrium with each other in solution, it seems likely that GroEL prefers to bind, or convert initially-bound states, to relatively unstructured ones that expose a maximum of contiguous hydrophobic surface (see page 92 and Wang et al., Reference Wang, Feng, Landry, Maxwell and Gierasch1999). These would correspond to features of what would be considered ‘early’ folding intermediates. Binding to GroEL could thus shift the equilibrium of an ensemble of non-native species in the direction of ‘early intermediate’ states (see page 91; Ranson et al., Reference Ranson, Dunster, Burston and Clarke1995; Walter et al., Reference Walter, Lorimer and Schmid1996).
Binding and hydrolysis of ATP by GroEL
ATP turnover and recovery of active Rubisco from a binary complex require millimolar concentration of K+ ion, and GroES inhibits ATP turnover
In June 1990, Viitanen et al. (Reference Viitanen, Lubben, Reed, Goloubinoff, O'Keefe and Lorimer1990) reported an essential role of K+ ion in GroEL-associated ATP turnover and in the recovery of active Rubisco in the presence of GroEL, GroES, and MgATP. Prompted by variability from preparation to preparation of both ATP turnover rates of GroEL and recovery of Rubisco activity from chaperonin reactions, the investigators identified the levels of monovalent cation as responsible. When monovalent cations were excluded, e.g. by extensive dialysis of the GroEL and GroES preparations, neither ATPase activity nor recovery of Rubisco activity was observed. When 1 mM K+ was added back to such an inhibited assay, there was an initiation of ATP turnover by GroEL standalone and recovery of Rubisco activity from an otherwise complete refolding mixture (i.e. from Rubisco/GroEL that one could infer to have already formed in the presence of MgATP and GroES). In an additional incubation, the presence of a molar excess of GroES nearly completely inhibited the K+-dependent ATP turnover by GroEL. Yet, importantly, a stable complex between GroES and GroEL, isolable by gel filtration, could be formed by ATP in the absence of K+. Considering these findings, it was proposed by the investigators that GroES somehow ‘couples’ the K+-dependent hydrolysis of ATP to the productive release of folded protein from GroEL.Footnote 22
Cooperative ATP hydrolysis by GroEL
In November 1991, Gray and Fersht (Reference Gray and Fersht1991) reported measurements of ATP hydrolysis by GroEL. A sigmoidal relationship of initial velocity to ATP concentration suggested cooperativity (Fig. 40) and led them to fit the Hill equation, giving a coefficient of ~1.8. In the presence of GroES, the initial velocity curves were again sigmoidal and gave a Hill coefficient of ~3.0. As in the Viitanen et al. study, there was an inhibition of ATP turnover by GroES, maximally 60% at molar excess. The data (minus or plus GroES) were fit to a Monod–Wyman–Changeux (MWC, a concerted model of cooperativity) equation (see eq. 4 therein; ATP binding was taken as exclusively to the R state). Calculations using values of 7 or 14 for the number of ATP-binding sites produced values for the allosteric constant L (=[T]/[R]) of 10 and 27, respectively (absent GroES). Subsequent experiments and analysis indicated that the ATP hydrolysis data were better fit to a nested cooperativity model, with intra-ring positive cooperativity following MWC, while inter-ring negative cooperativity followed a Koshland–Nemethy–Filmer (KNF, sequential) model (see page 65). Regardless of the model, the observation of cooperativity implies that structural changes in GroEL occur during ATP binding and/or hydrolysis.
Initial rates of GroEL ATPase activity as a function of ATP concentration, showing sigmoidal dependence indicative of cooperativity. The inset is a Hill plot of the same data, giving a Hill coefficient of 1.86. Reprinted from Gray and Fersht (Reference Gray and Fersht1991), with permission, copyright FEBS, 1991.

Conformational change of GroEL driven by ATP binding; GroES inhibits ATP turnover and forms a stable asymmetric GroEL/GroES/ADP complex; effects of substrate protein
In March 1993, Jackson et al. (Reference Jackson, Staniforth, Halsall, Atkinson, Holbrook, Clarke and Burston1993) reported on conformational changes of GroEL upon binding ATP and on the formation of GroEL/GroES complexes.
Conformational change of GroEL in the presence of ATP
Pyrene maleimide was reacted with GroEL, covalently attaching the fluorophore to one of the cysteines (at residues 138, 458, and 519; in retrospect, attachment occurred most likely to 138 at an exposed aspect of the intermediate domain), with on average one pyrene molecule per GroEL 14mer. They observed that the addition of ATP to the pyrene-labeled GroEL produced an increase of fluorescence emission (375 nm) of ~60%. In equilibrium binding studies (Fig. 41a), a plot of emission enhancement versus ATP concentration was sigmoidal (reflecting positive cooperativity of ATP binding), with K½ of fluorescent change of 10 µM (and Hill coefficient of ~4). [In the presence of a molar excess of GroES, K½ was 6 µM (Hill coefficient, n ~6).]
(a) Equilibrium binding of ATP to pyrenyl-GroEL as a function of ATP concentration, measured as the extent of the fluorescence enhancement within the first seconds of mixing and showing positive cooperativity. Fitting the data to a Hill equation gave a Hill coefficient of 4. (b) Stopped-flow analysis of ATP binding, showing the first-order rate constants of the increase in fluorescence of pyrenyl-GroEL upon mixing with MgATP. Note the very rapid maximal rate (180 s−1) of the reported conformational change. Adapted with permission from Jackson et al. (Reference Jackson, Staniforth, Halsall, Atkinson, Holbrook, Clarke and Burston1993). Copyright (1993) American Chemical Society.

In stopped-flow analysis (Fig. 41b), the rate constant for a rise in pyrene fluorescence increased hyperbolically with MgATP concentration to a maximum of ~180 s−1. The half-maximal rate was achieved at 4 mM, a concentration ~400 times that of half-saturation of GroEL with ATP under equilibrium conditions (~10 µM). This suggested that the initial rapidly formed collision state underwent a somewhat slower conformational change of GroEL to the state that bound ATP 400 times more tightly. Much slower than this conformational change in GroEL was the steady-state rate of hydrolysis of ATP at GroEL (0.04 s−1).
GroEL/GroES/ADP complexes
Jackson et al. observed that, in contrast with MgATP, MgADP bound only weakly to GroEL with K½ = 2.3 mM. The additional presence of orthophosphate did not affect the fluorescence enhancement. Stunningly, however, the inclusion of GroES increased the binding affinity for ADP by >33 000-fold, such that half saturation was now at ~70 nM. In kinetic studies, ADP plus GroES complexes formed very slowly, with k = 0.014 s−1 (in saturating MgADP). In a titration study, GroES saturated GroEL in ADP at equimolar GroES to GroEL, indicating asymmetric binding (to one ring of GroEL). In agreement, the inhibition of steady-state ATP turnover by the addition of increasing amounts of GroES also was maximal at 1:1 stoichiometry. The binding affinity for GroES in the GroEL/ADP/GroES complexes was estimated at 0.5–3 nM. Because of the slow formation of the GroEL/ADP/GroES complexes, it was concluded that such complexes were likely to be formed in the physiologic setting by the hydrolysis of an initial GroEL/ATP/GroES complex. This was supported by an earlier study of Bochkareva et al. (Reference Bochkareva, Lissin, Flynn, Rothman and Girshovich1992) observing 14C-ADP as the only stable nucleotide in GroEL/GroES complexes formed in 14C-ATP. Likewise, the asymmetric GroEL/GroES complex isolated from T. thermophilus by Yoshida and coworkers (Reference Yoshida, Ishii, Muneyuki, Taguchi, Ellis, Laskey and Lorimer1993) was shown to contain ADP.
In single turnover studies, the rate of turnover by GroEL alone, 0.04 s−1, was the same as at steady-state, indicating that it is the rate of hydrolysis itself and not release of products that is rate-limiting. In the presence of GroES, hydrolysis occurred in two phases, a fast phase at 0.04 s−1 and a slow phase at 0.004 s−1. This was interpreted at the time as inhibition by GroES of turnover of one of the GroEL rings, but further studies (e.g. Todd et al., Reference Todd, Viitanen and Lorimer1993; Yifrach and Horovitz, Reference Yifrach and Horovitz1995) made clear that GroES has allosteric effects on ATP turnover of both the bound (cis) ring and the opposite (trans) ring.
Substrate effects on ATP turnover
With respect to a substrate protein, Jackson et al. observed that non-native LDH could stimulate the rate of ATP turnover by up to 20-fold for 20–30 s after addition to an ongoing steady-state reaction. When GroES was present, the rate increases were approximately half. Despite the transient increase in ATP hydrolysis, only the yield, and not the rate of recovery, of LDH was increased by either GroEL/MgATP or GroEL/GroES/MgATP. This interplay between unfolded substrate protein and ATP turnover was interpreted in terms of a two-state model for GroEL – a T state with high affinity for unfolded substrate and low affinity for ATP and an R state with the relative affinities reversed, recycled by ATP hydrolysis to drive the substrate binding/release (i.e. folding cycle) forward. The clear implication was that ATP binding is central to effective chaperonin action by allosterically forcing a conformational change that ultimately drives substrate protein release.
Effects of potassium and GroES on ATP binding/hydrolysis
In August 1993, Todd et al. (Reference Todd, Viitanen and Lorimer1993) also examined ATP binding/hydrolysis by GroEL and the effects of GroES. Potassium ion concentration was studied as a modulator of the kinetic and allosteric parameters of GroEL. Hill coefficients varied from ~3 in low potassium (1 mM) to ~2 in high potassium (150 mM). In the presence of GroES, ATP hydrolysis exhibited two transitions. First, GroEL was converted to an asymmetric complex by binding of ATP and GroES to one ring; then, hydrolysis produced a relatively stable asymmetric GroEL/GroES/MgADP7 complex, in which bound radiolabeled ADP could not exchange with added unlabeled ADP and occupied the sites of the GroES-bound ring (Fig. 42). In low potassium (1 mM), this complex did not turn over ATP, whereas in higher potassium (100 mM), this complex exhibited a half-of-sites rate of hydrolyzing ATP; that is, turnover occurred at a rate that would correspond to half of that achieved by GroEL alone (as if only one of the rings was active). The basis to the apparent half-of-sites behavior reflects allosteric effects of binding of GroES, but, as shown by further studies, this is exerted upon both the GroES-bound (cis) ring and the opposite (trans) ring.Footnote 23
Quantitation of stable ADP binding to GroEL as a function of GroES:GroEL ratio. ATPase reactions were performed with [α-32P]ATP and varying amounts of GroES and a fixed amount of GroEL. Aliquots were subjected to gel filtration in assay buffer with ADP instead of ATP, and radioactivity in GroEL/GroES complex fractions was measured and used to calculate the ADP per GroEL oligomer value. Note that the maximum number of ADPs per GroEL (~5) was recovered at a 1:1 GroES:GroEL ratio. Reprinted with permission from Todd et al. (Reference Todd, Viitanen and Lorimer1993). Copyright (1993) American Chemical Society.

GroES commits and ‘quantizes’ hydrolysis of seven ATPs, and ATP in a ring in trans triggers rapid release of GroES and ADP
Following from the studies of Jackson et al. (Reference Jackson, Staniforth, Halsall, Atkinson, Holbrook, Clarke and Burston1993) and the foregoing study, Todd et al. (Reference Todd, Viitanen and Lorimer1994) further reported in July 1994 on the fate of the relatively stable asymmetric GroEL/GroES/ADP complex. First, they assessed its ability to bind and hydrolyze ATP in the unoccupied ring in the presence of γ32P-labeled ATP and GroES (Fig. 43). They brought the solution to high potassium to activate ATP hydrolysis and, after a few seconds, added two different types of ‘quencher’, either ADP (to 5 mM), which prevents further GroEL-mediated ATP hydrolysis by a presumed product inhibition, or unlabeled ATP, to dilute the specific activity of the γ32P-labeled ATP. They observed that, despite the addition of quenchers, the amount of free 32Pi released corresponded to one ring of ATP turning over. Thus, with even brief reactivation of the GroEL ATPase in the presence of GroES, there was a commitment of a ring's worth of bound ATP (i.e. seven molecules) to a single round of ‘quantized’ hydrolysis. Binding of GroES to the newly ATP-bound ring was inferred to enforce such quantized and apparently synchronous hydrolysis.
‘Quantized’ turnover of ATP. Commitment of one ring of seven ATPs to turnover, in the presence of GroES. [γ-32P]ATP was mixed with GroEL and GroES in low potassium buffer, resulting in the reaction stalling after one ring's worth of ATP was hydrolyzed, producing an asymmetric GroEL/GroES/ADP7 complex (black box symbol at 0.5 min). At arrow 1, hydrolysis was reactivated by adding another aliquot of labeled ATP in high potassium buffer, and 5 s later (arrow 2), a non-denaturing quench with ADP (solid circles, going off to right) or unlabeled ATP (asterisks) was added to some aliquots, while the reaction was allowed to continue in others (solid squares). Note that ATP hydrolysis continues after the non-denaturing quenches (beyond arrow 2) until about one ring's worth (0.5 mole mole−1 subunit) of [32Pi] has been produced, indicating that the newly-bound ATP in the asymmetric complex is committed by GroES (binding) to a round of hydrolysis. (Arrow 3 indicates a denaturing HClO4 quench. Closed diamonds show the low potassium reaction without any reactivation addition, open circles indicate a reaction in which the non-denaturing ADP quench was added before reactivation.) Adapted from Todd et al. (Reference Todd, Viitanen and Lorimer1994); reprinted with permission from AAAS.

The fate of the ligands of the relatively stable asymmetric GroEL/GroES/ADP complex, ADP and GroES, was next addressed. In the case of ADP (whose release would already imply release of GroES), this was determined by forming the asymmetric complex using α 32P-labeled ATP, gel filtering the asymmetric GroEL/GroES/α 32P-ADP complex, then adding potassium and various nucleotides and following whether α 32P-ADP was released by gel filtering the mixture (Fig. 44) (in some cases, for ‘single turnover conditions’, adding quenching ADP within 15 s). With the addition of ATP, the labeled ADP was nearly completely dissociated in <5 s. By contrast, neither AMP-PNP nor ATPγS (nor ADP) could dissociate the labeled ADP. This was interpreted to indicate that hydrolysis of ATP by the ring in trans to GroES was required to trigger the release of GroES and ADP. Later studies showed that, in fact, it is the step of ATP binding that is sufficient to trigger release. For example, an ATP hydrolysis-defective ring bearing a mutation that affects the hydrolysis-activating residue, D398A, could nevertheless trigger the rapid release of GroES upon addition of ATP (Rye et al., Reference Rye, Burston, Fenton, Beechem, Xu, Sigler and Horwich1997; see page 83). Later studies also indicated that, more generally, neither AMP-PNP nor ATPγS, while able to bind to GroEL, could promote the activities that ATP binding promotes, i.e. in cis, only binding of ATP along with GroES directs the action of substrate release into the GroES-bound ring, and in trans, only binding of ATP triggers the rapid release of the cis ligands, as here, for α 32P-ADP and 35S-GroES.
Dissociation of [α-P32]ADP from asymmetric GroEL/GroES/ADP complexes under various nucleotide and ionic conditions. The complex is remarkably stable except in the presence of ATP or EDTA. From Todd et al. (Reference Todd, Viitanen and Lorimer1994); reprinted with permission from AAAS.

Folding by GroEL/MgATP and by GroEL/GroES/MgATP
Rubisco refolds spontaneously at low temperature, in a K+ independent manner; spontaneous refolding is blocked by the presence of GroEL; and refolding of Rubisco at low temperature is accelerated by GroEL/GroES/MgATP
In the original reconstitution study of Goloubinoff et al. (Reference Goloubinoff, Christeller, Gatenby and Lorimer1989b), denaturant-unfolded Rubisco diluted into buffer was unable to refold to active form spontaneously at 25 °C but was efficiently refolded by GroEL/GroES/MgATP. In a further report from Viitanen et al. (Reference Viitanen, Lubben, Reed, Goloubinoff, O'Keefe and Lorimer1990), it was observed that, just below 25 °C, there was now observable spontaneous recovery of activity, with nearly 100% yield at 17.5 °C and below. The spontaneous recovery did not require K+, unlike its requirement for ATPase activity of GroEL and for recovery of Rubisco by GroEL/GroES/MgATP (see page 22). The investigators commented that ‘it would appear that the principal requirement for spontaneous folding is to minimize the formation of biologically unproductive aggregates. Presumably, intermolecular aggregation is suppressed at lower temperatures, enabling proper intramolecular folding reactions to predominate.’ As commented above and supported by the studies of Horowitz and coworkers (see page 38), such a reduction of aggregation at lower temperature is consistent with the reduction of hydrophobic interaction, disfavoring multi-molecular aggregation occurring through such exposed surfaces of non-native forms. Yet consistent with a degree of exposure of such surfaces even at lower temperature, Viitanen et al. (Reference Viitanen, Lubben, Reed, Goloubinoff, O'Keefe and Lorimer1990) observed that the presence of a molar excess of GroEL blocked spontaneous recovery of Rubisco activity, with GroEL apparently able to quantitatively recruit the non-native Rubisco intermediate species subsequently described by them with their collaborators in van der Vies et al. (Reference van der Vies, Viitanen, Gatenby, Lorimer and Jaenicke1992; see page 41). Binary complex formation at 15 °C was productive, because the addition of GroES/MgATP (at 15 °C), even up to 16 h later, led to a rapid recovery of active Rubisco. Notably, the rate of recovery from a GroEL/GroES/MgATP reaction at 15 °C was 10-fold greater than that from a side-by-side spontaneous reaction, and the extent of recovery was also about twofold greater. The investigators commented that ‘although the rate enhancement is not large, it is perhaps what one might expect if Rubisco, while bound to cpn60 (GroEL), is restrained from exploring biologically unproductive folding pathways.’ Indeed, this accurately delineates what is generally the likely reason for such relative acceleration of recovery of the native state by GroEL/GroES/(MgATP) at low temperature: that is, considering spontaneous refolding in free solution, even at low temperature, there are nonetheless competing off-pathway multi-molecular interactions occurring (and in some cases, more simply, kinetically-trapped monomers – see page 101), but they are reversible, ultimately allowing the polypeptide, despite the various time-consuming detours, to quantitatively reach the native form. The advantage at GroEL/GroES (as shown later) is that the polypeptide is essentially a monomer during its folding in a chamber and is, as such, not subject to the off-pathway kinetic detours caused by multi-molecular interactions that often can occur in the bulk solution (see page 101 for consideration of data indicating the effects of the GroEL/GroES cis cavity on the folding free energy landscape of some substrates).
GroES appears to physically ‘couple’ the folding of substrate protein to GroEL
In July 1991, Martin et al. (Reference Martin, Langer, Boteva, Schramel, Horwich and Hartl1991) reported on GroEL-mediated refolding of two monomeric proteins diluted from GuHCl denaturant, chicken DHFR (20 kDa) and bovine rhodanese (33 kDa). Under the conditions of these studies (25 °C), the two substrates exhibited distinctly different behaviors, but a very significant common feature emerged. First, DHFR could refold spontaneously with a half-time of ~2 min (with the enzyme's ligands DHF and NADPH present in the dilution mixture to enable real-time assay of activity, with, as in the Viitanen et al. (1991) study, the ligands stabilizing the native state). When equimolar GroEL alone was present in the dilution mixture, it reduced recovery to ~20%, resembling the effect of GroEL observed previously to block spontaneous refolding of LDH (Badcoe et al., Reference Badcoe, Smith, Wood, Halsall, Holbrook, Lund and Clarke1991). This was verified as being associated with the binding of DHFR by GroEL by S300 gel filtration. Subsequent addition of MgATP then produced refolding of DHFR, at a rate somewhat slower than spontaneous refolding. When the concentration of GroEL was progressively increased, the rate of MgATP-dependent recovery was progressively slowed. This suggested that DHFR was refolding during cycles of binding and ATP-triggered release from GroEL, with recapture by increased levels of GroEL associated with slowing of recovery. Consistent with this (and with folding in free solution following release from GroEL), the addition of a GroEL-associating protein, α s1-casein, as a competitor for DHFR rebinding increased the rate of DHFR recovery in the presence of GroEL/MgATP. Most remarkable, however, when the cochaperonin GroES was present at levels equimolar to the various (increasing) concentrations of GroEL (absent casein), increasing GroEL was no longer able to slow the rate of recovery of the native state (Fig. 45). It seemed that the presence of GroES somehow ‘coupled’ folding to GroEL. Thus, overall, while DHFR did not have an absolute requirement for the presence of GroES to achieve the native form (as did Rubisco, CS, and rhodanese), the presence of GroES fundamentally changed the nature of recovery of native DHFR. This was a foundational observation that would eventually find a structural explanation, encapsulation of substrate protein underneath GroES (Weissman et al., Reference Weissman, Hohl, Kovalenko, Kashi, Chen, Braig, Saibil, Fenton and Horwich1995).
GroES ‘couples’ refolding of DHFR to GroEL. The reactivation rates of GroEL-bound unfolded chicken DHFR were measured as a function of [GroEL]. In the absence of GroES, reactivation half-time is increased with increasing [GroEL], suggesting that refolding of DHFR in free solution competes with rebinding to GroEL. In the presence of GroES (equimolar to GroEL), however, the half-time for folding is unaffected by increasing [GroEL], indicating a coupled reaction. From Martin et al. (Reference Martin, Langer, Boteva, Schramel, Horwich and Hartl1991).

Rhodanese refolding, in contrast with DHFR, required GroEL/GroES/MgATP, observed both in Martin et al. (Reference Martin, Langer, Boteva, Schramel, Horwich and Hartl1991) and simultaneously in Mendoza et al. (Reference Mendoza, Rogers, Lorimer and Horowitz1991, see page 38). In the absence of chaperonin, Martin et al. observed that rhodanese underwent wholesale aggregation upon dilution from denaturant. This was suppressed by the presence of equimolar GroEL. Addition of MgATP to binary complex did not produce any recovery of rhodanese enzyme activity, but it was apparently associated with release of non-native rhodanese (and rebinding), because if casein competitor was added, rhodanese proceeded to aggregate. But here also, the presence of GroES appeared to couple folding to GroEL (Fig. 46): casein could not affect the kinetics of renaturation of rhodanese by GroEL/GroES/MgATP. The investigators interpreted these data to indicate that ‘a single round of interaction between rhodanese and GroEL is sufficient for folding’. This was a new concept but only partially correct insofar as only ~5% of rhodanese can reach the native form in a given round of folding at GroEL/GroES, whereas the other molecules released into the bulk solution are still non-native [see Weissman et al. (Reference Weissman, Kashi, Fenton and Horwich1994) and page 49, where, during GroEL/GroES-mediated folding of rhodanese, multiple rounds of release of non-native substrate from the GroEL/GroES cavity into the bulk solution were observed followed by rebinding to GroEL]. The notion, however, that folding occurs during periods of coupling (involving GroES encapsulation) was subsequently supported.
GroES also ‘couples’ refolding of the stringent (GroES-requiring) substrate rhodanese to GroEL. Coupling was demonstrated by the addition of a competing GroEL-binding protein, casein. Folding reactions were carried out starting with GroEL/rhodanese binary complexes, initiating folding by addition of MgATP (‘start’). If GroES was present in the mixture at the time of commencing the reaction, the kinetics of folding were the same with or without the casein competitor present (filled circles and open circles). However, if GroES was added after the start of a reaction containing casein, at 15 or 120 s, then there was a strong reduction in recovery (open squares and closed triangles, respectively). In this latter order of addition, casein competed with rhodanese for the occupation of GroEL, allowing rhodanese to aggregate in free solution, whereas the presence of GroES at the beginning ‘coupled’ rhodanese folding to GroEL (by, as later learned, encapsulating it in the cis cavity). From Martin et al. (Reference Martin, Langer, Boteva, Schramel, Horwich and Hartl1991).
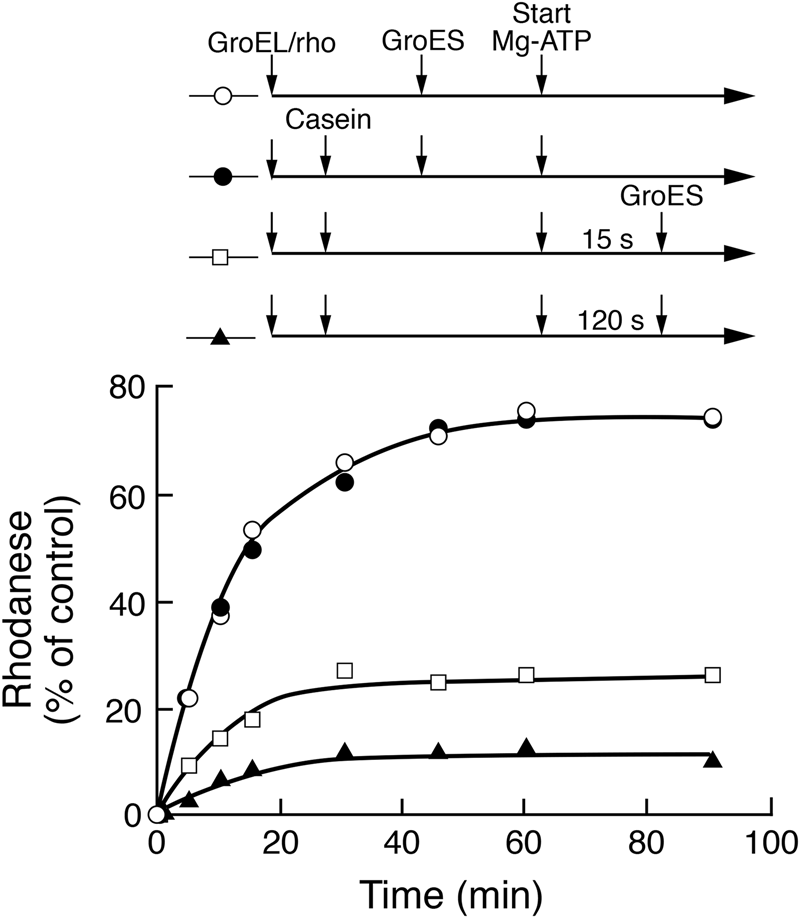
Overall, the investigators aligned with others in thinking (incorrectly) that GroES coordinated ‘stepwise release’ from GroEL. Subsequent studies made clear that release of bound polypeptide from multiple surrounding apical domains of GroEL is a concerted process orchestrated by ATP/GroES binding, mediated by simultaneous rigid body movements of all seven subunits of a GroEL ring that eject substrate polypeptide at once into the GroES-encapsulated central cavity (see page 73 and particularly page 78).
GroES is required for GroEL-mediated folding under ‘non-permissive’ conditions, i.e. temperature or ionic conditions where spontaneous refolding of a substrate protein free in solution cannot occur
In April 1994, Schmidt et al. (Reference Schmidt, Buchner, Todd, Lorimer and Viitanen1994) presented refolding studies of three different substrate proteins that indicated that alteration of ‘environment’, either temperature (in two cases) or ionic conditions (in one case), could determine whether the substrate protein could refold spontaneously upon dilution from denaturant (or upon ATP-mediated release from GroEL into the bulk solution) versus being unable to refold spontaneously and requiring ATP/GroES for productive folding by GroEL. Where conditions were ‘non-permissive’, such that a substrate protein could not reach the native state spontaneously in solution, GroES was required along with ATP for productive folding by GroEL. Where conditions were ‘permissive’, such that a substrate could fold spontaneously upon dilution from denaturant, GroEL/ATP were sufficient to support refolding, although refolding after ATP-mediated release into the solution was generally slower than with the additional presence of GroES.
CS
One substrate studied was (porcine) CS (Fig. 47). It was observed that, at 35 °C, CS could not refold spontaneously, instead forming aggregates. Here, as in the earlier study of Buchner et al. (Reference Buchner, Schmidt, Fuchs, Jaenicke, Rudloph, Schmid and Kiefhaber1991), the complete GroEL/GroES/MgATP system, but not GroEL/ATP, mediated the recovery of CS activity. In contrast, CS could refold spontaneously at 20 °C. In the presence of GroEL alone at 20 °C, no refolding occurred due presumably to binary complex formation. Recovery of activity then occurred with the subsequent addition of ATP, albeit at a slower rate than the rapid recovery observed with either spontaneous or GroEL/GroES/MgATP reactions. The investigators commented that ‘the species of citrate synthase that are released from the binary complex (by ATP alone) are not necessarily committed to the native state. Their fate still depends on the folding environment.’ These results thus made clear that the need for GroES in GroEL-mediated refolding is not an ‘immutable property’ of the substrate protein itself, as might have been inferred from the studies to that point.
Folding of citrate synthase (CS) under non-permissive and permissive conditions. Folding of CS from a binary complex with GroEL at 35 °C (top), a non-permissive condition, requires the complete chaperonin system, that is, GroES and MgATP; under this condition, there is also no spontaneous recovery after dilution from denaturant. Folding of CS from a binary complex with GroEL at 20 °C (bottom), permissive condition, where spontaneous recovery occurs with the same kinetics as with the complete chaperonin system. Binary complex shows no recovery, but adding ATP to it achieves recovery, indicating that GroES is not necessary under these conditions, albeit more slowly (after release into free solution, with GroEL competing for rebinding). Adapted with permission from Schmidt et al. (Reference Schmidt, Buchner, Todd, Lorimer and Viitanen1994), copyright ASBMB, 1994.

MDH
Very similar results with respect to temperature were obtained with malate dehydrogenase refolding. In this case, however, at permissive temperature (20 °C), a degree of release and recovery of activity occurred with simple addition of casein, indicating that MDH is not bound so tightly to GroEL as to require ATP for release, but that its rate of rebinding to GroEL is greater than that of undergoing commitment to refolding to native form.
Rubisco
In the third case, Rubisco was studied with respect to ionic conditions (Fig. 48). Here, in the absence of chloride anion, spontaneous refolding of Rubisco was abolished, as was GroEL/ATP-mediated refolding (in the absence of GroES), yet the complete GroEL/GroES/ATP system mediated efficient recovery of native Rubisco. Thus, the absence of chloride comprises a non-permissive environment for Rubisco refolding. In chloride-containing solutions (permissive conditions), the kinetics of GroEL/ATP-mediated refolding was considerably slower than with the complete chaperonin system (300-fold slower at 250 mM NaCl), as if ATP-mediated release of Rubisco into free solution exposed it to an environment where Rubisco is ‘not committed to the native state’ as compared with the presence of GroES, which was associated with commitment. In a test of these conclusions, the fate of ATP-released radiolabeled Rubisco in the absence of chloride was investigated by gel filtration, and, in agreement, it was found to lodge in large aggregates. By comparison, Rubisco released by ATP/GroES in the absence of chloride migrated to the position of the native dimer.
Folding of Rubisco under non-permissive and permissive conditions. In the absence of chloride at 25 °C, a non-permissive condition, Rubisco/GroEL binary complex challenged with MgATP cannot produce the native state. (Likewise, Rubisco cannot spontaneously refold at 25 °C in the absence of chloride.) Under this condition, however, the addition of GroES and MgATP to GroEL/Rubisco binary complex enables the nearly complete recovery of the native state. When chloride concentration is increased, a permissive condition is attained, and the ATP-challenged binary complex becomes increasingly productive and, likewise (not shown here), spontaneous refolding of Rubisco becomes increasingly productive. Thus, the presence of chloride allows permissive behavior. However, note that the extent of recovery is reduced relative to GroEL/GroES/ATP, indicating that folding in free solution under these conditions is not efficient, presumably because of competing aggregation. Adapted with permission from Schmidt et al. (Reference Schmidt, Buchner, Todd, Lorimer and Viitanen1994), copyright ASBMB, 1994.

GroES allows productive folding to occur in a ‘non-permissive’ environment
Schmidt et al. discussed their results as related to the release of polypeptide from GroEL into the environment of free solution by ATP alone, productive under permissive conditions, and in relation to possible physical coupling of folding to GroEL in the presence of GroES as had been observed by Martin et al. (Reference Martin, Langer, Boteva, Schramel, Horwich and Hartl1991), committing folding to reaching native form under both permissive and non-permissive conditions. They suggested that ‘it is possible that the role of groES is to coordinate the simultaneous release of all bound segments of the target protein, thus allowing it to momentarily fold unhindered in free solution.’ This was the first deviation from the idea of a ‘stepwise release’, although the meaning of ‘free solution’ seems unclear. Schmidt et al. further speculated ‘In this scenario, groES also plays an important role as a timing device that regulates the interconversion of groEL between two or more conformers that have drastically different affinities for nonnative proteins…some folding events may occur in a protected environment within the central cavity of the groEL double doughnut.’ The last statement cited the various topology studies. The investigators summarized: ‘…we have shown that the need for groES during a chaperonin-assisted folding reaction is not a fixed property of a target protein. Simply through manipulation of the folding environment, it was possible to transform three different groES-dependent folding reactions into ones that no longer required the co-chaperonin. Our results indicate that the role of groES becomes more important as the environment becomes less favorable for spontaneous folding. If, however, the target protein is released from the binary complex into a permissive environment, it can potentially fold to its native state regardless of whether or not groES is present. In this case, by definition, there is no need for the protein to achieve a committed state prior to its release from groEL.’ Given what we know now about release and folding within the GroEL/GroES chamber prior to release into the bulk solution, this study correctly understood the nature of the folding reaction, i.e. that commitment to the native state occurs at GroEL in the presence of GroES.Footnote 24, Footnote 25, Footnote 26
Release of non-native polypeptide into the bulk solution during a GroEL/GroES/ATP-mediated folding reaction – rounds of release and rebinding associated with productive folding
Isotope dilution experiment
In July 1994, Todd et al. (Reference Todd, Viitanen and Lorimer1994) reported an isotope dilution experiment testing for the release of non-native 35S-Rubisco from complexes with either GroEL alone or asymmetric GroEL/GroES/ADP, when challenged with ATP/GroES and a non-radioactive Rubisco folding intermediate (Rubisco-I) that is stable in chloride-free solution (i.e. does not aggregate and remains able to be bound by GroEL) (Fig. 49). If 35S-Rubisco remained at GroEL during ATP/GroES-mediated folding, i.e. if it was committed to reaching the native state before release into the bulk solution, one would expect the amount of 35S-Rubisco cofractionating with GroEL in gel filtration to remain relatively constant at early times and to exhibit a kinetics of release roughly corresponding to recovery of active enzyme (adjusting for dimer assembly). If, however, 35S-Rubisco was regularly released into solution with each round of the ATP/GroES-driven cycle, whether having reached native form or not, then the Rubisco recovered with GroEL in gel filtration would be isotopically diluted by the Rubisco-I present in solution at a 10-fold excess. It was observed that the amount of bound 35S-Rubisco dropped to ~40% within 1 min, indicating that rapid release was occurring (Fig. 49). By contrast, an hour was required to achieve the corresponding amount of recovery of Rubisco enzyme activity. The investigators discussed that it seemed likely that non-native protein is released and transferred intermolecularly at each turnover of GroEL.
Isotope dilution experiment showing the rapid departure of bound non-native 35S-Rubisco from a binary complex with GroEL upon addition of GroES/ATP in the presence of a non-radioactive metastable intermediate of Rubisco (Rubisco-I) present in the chloride-free solution that is competent to bind to GroEL (present in 10X excess). GroEL was recovered by gel filtration at various times after initiating the reaction and associated 35S-Rubisco counts remaining (i.e. the degree of isotopic dilution of Rubisco) were determined. Note that in 1 min in ATP/GroES/Rubisco-I, the level of 35S-Rubisco dropped to 44%, indicating the rapid release of the non-native substrate protein (an hour would be required to produce this amount of native protein). Similar release was also observed from an asymmetric complex with GroES/ADP associated with one GroEL ring and 35S-Rubisco with the other. From Todd et al. (Reference Todd, Viitanen and Lorimer1994); reprinted with permission from AAAS.

GroEL trap experiment
In August 1994, Weissman et al. (Reference Weissman, Kashi, Fenton and Horwich1994) presented an independent experiment indicating a rapid release of the substrate proteins OTC and rhodanese into the bulk solution during GroEL/GroES-mediated folding. Here the investigators used ‘trap’ versions of GroEL, mutant forms of GroEL able to bind non-native substrate protein but unable to release it in the presence of ATP and GroES. Three such mutants were studied (N265A, D87K, and G337S-I339E), identified during structure–function analysis of GroEL (Fenton et al., Reference Fenton, Kashi, Furtak and Horwich1994). Folding reactions were initiated starting with a binary complex of substrate protein and wild-type GroEL, to which was added either additional wild-type GroEL or trap mutant, followed by addition of ATP/GroES. If the reaction was committed to reaching native form before release of substrate into the bulk solution, then one would expect no interference by the presence of trap molecule. If, however, non-native forms were being released during refolding, a molar excess of trap mutant would capture such species and prevent them from reaching the native form. Indeed, the trap mutants strongly inhibited refolding of both OTC and rhodanese. In particular, a fourfold molar excess of 265A or 337S/349E reduced recovery to 20%. The rate of transfer to trap mutant could be assessed for the 337/349 mutant because it was separable from wild-type GroEL by anion exchange chromatography. Within 0.5 min, 50% of the rhodanese molecules were transferred to trap, in good agreement with the rate of Rubisco release in the isotope dilution study. For rhodanese, this rate of release is ~10-fold faster than the rate of recovery of native active enzyme mediated by wild-type GroEL/GroES. It was observed that the trap mutants could be added at times after initiation of folding and would effectively halt further folding to native form, indicating that release occurred not only at the initial round of the reaction but throughout.
Interestingly, in both isotope dilution and trap studies, release was observed with ATP alone but there was no recovery of the native state. The trap study noted that the rate of transfer to 337/349 was ~3-fold slower for ATP alone than for ATP/GroES, agreeing with the previous studies on the rates of refolding (release) under permissive conditions. A possible action of GroES to ‘synchronize’ release was suggested.
Transfer of substrate protein could also be observed (without use of a trap) by using a C-terminally proteolytically (tail-) clipped version of GroEL as an ‘acceptor’ and a version of rhodanese that contained a radioiodinated hit-and-run photocrosslinker (APDP) attached to one of its cysteines (enabling transfer of a radio-iodine moiety in the azido crosslinker to a GroEL ring proximate to it by photoactivation followed by reduction; see Fig. 57a). Starting with a binary complex of crosslinker-bearing rhodanese and wild-type GroEL, the reaction was triggered with GroES/ATP, and, after several minutes, photocrosslinking was carried out, followed by reduction. Both the full-length wild-type subunits (from donor complex) and the clipped subunits (from ‘acceptor’ complex) were observed to be radioiodine-labeled in an SDS gel.
Finally, the conformation of non-native rhodanese after transfer from wild-type to 337/349 trap was examined and found to be the same, as judged by both protease sensitivity (monitoring 35S-radiolabeled rhodanese) and tryptophan fluorescence analysis (showing the same maxima between unfolded and native forms at ~340 nm). This suggested an all-or-none reaction occurring for each round of release/folding of substrate polypeptide, with the restoration of the same non-native state upon each round of rebinding to GroEL.
An immediate conclusion as related to folding in the cellular context emerged from observation of non-native forms of polypeptide being released from GroEL at each round of the reaction cycle, namely that non-native forms would likely be kinetically partitioned between various chaperone components within the same compartment as a chaperonin. That is, binding of a released form by any given component would be determined by the concentration of that component and its affinity for the particular conformation of the non-native protein(s) released from GroEL. Thus, for example, another chaperone like DnaK (Hsp70) could potentially bind a protein released from GroEL if that species occupied a more extended state (see Buchberger et al., Reference Buchberger, Schröder, Hesterkamp, Schönfeld and Bukau1996), or a component such as ClpAP could bind and degrade a terminally damaged conformation that cannot reach native form (Kandror et al., Reference Kandror, Busconi, Sherman and Goldberg1994). The latter action would prevent clogging of GroEL and other chaperones with non-native forms that could not correctly fold.Footnote 27, Footnote 28
XVI. Crystal structure of E. coli GroEL at 2.8 Å resolution and functional studies
In October 1994, Braig et al. (Reference Braig, Otwinowski, Hegde, Boisvert, Joachimiak, Horwich and Sigler1994) reported a crystal structure of E. coli GroEL at 2.8 Å resolution (PDB:1GRL).
Expression and crystallization
A range of GroEL molecules purified from various species, including a number of thermophilic bacterial strains, had been set up in crystallization trials over a 3-year period without obtaining well-diffracting crystals. Joachimiak and Horwich massively overproduced the E. coli version of GroEL by inserting the PCR-amplified GroES–GroEL coding portion of the groE operon next to a trc promoter in a plasmid vector (pTrc99). Following a 2 h IPTG induction of the transformed cells, the cleared lysate exhibited a single band of massive intensity in a Coomassie-stained SDS gel, corresponding in size to the GroEL subunit (with GroES, much less stainable, migrating at the dye front). A single step of anion exchange chromatography was carried out, separating away nucleic acids and minor contaminating proteins. A number of designed GroEL variants with single amino acid substitutions in highly conserved residues were also prepared with the idea of using substituted molecules in a search for adjustments that might favor the formation of well-diffracting crystals. However, both Braig and Boisvert (Horwich lab) obtained crystals with the starting molecule that had been considered to be ‘wild-type’, but proved, upon sequencing the coding DNA, to contain two codon alterations, R6G and A126V, both in what became recognized as the equatorial ATP-binding domain of the GroEL subunit. (The alterations presumably arose during the original PCR amplification.) The substitutions did not interfere with overall folding function in vivo or in vitro, but abolished negative cooperativity between rings for ATP binding and turnover (Aharoni and Horovitz, Reference Aharoni and Horovitz1996; see also page 68).
Braig obtained an ammonium sulfate orthorhombic crystal with a C2221 space group and a large unit cell measuring 178 × 204 × 278 Å. The volume of the asymmetric unit could accommodate one ring of GroEL. The initial crystal diffracted to 3.4 Å on a Xentronics area detector in the Sigler laboratory and then another (stabilized and propane frozen) at the CHESS F1 beamline diffracted isotropically to 2.8 Å. A full native data set (90°) was collected from that crystal using 0.2° oscillations, requiring nearly 24 h. With the native data set, a self-rotation function was carried out, revealing the sevenfold axis lying nearly parallel to the crystallographic c axis and perpendicular to a dyad, indicating that rings were back-to-back and twofold (crystallographic) symmetry-related.
Phasing and real-space non-crystallographic symmetry averaging
Crystals soaked in ethylmercuric chloride provided an isomorphous replacement that was used for phasing. The ethylmercury occupied all three cysteines of the GroEL subunit (21 sites in the a.u.). Confronted with a very large number of isomorphous difference Patterson peaks, Otwinowski carried out a six-parameter search that maximized the correlation between the heavy atom-induced intensity differences ΔFH2 and calculated heavy atom structure factors |FHC|2. The parameters were: position of the sevenfold symmetry axis in the x-y plane (two parameters, restricted by the intersection of a lattice dyad); position of the heavy atom in the reference subunit (three parameters), expanded to seven sites by seven-fold rotational symmetry; and angle of the sevenfold axis relative to the c axis (one parameter, expected to be small). When a first site was identified, the search was repeated to find a second and then the third. The initial SIR map was uninterpretable, with no boundary resolvable for GroEL. However, the mercury positions could be used to define non-crystallographic sevenfold matrices for NCS averaging (in real space). A first round of sevenfold NCS averaging was carried out at 6 Å without a solvent boundary (using the amplitude data and random phases). An envelope of the GroEL assembly now became visible. Successive rounds of NCS averaging were then carried out, commencing with amplitude data at 6 Å and proceeding to 2.7 Å through 400 cycles of phase extension/improvement with the envelope updated every 20 cycles. This produced a map of sufficient quality to trace the main chain through the equatorial and intermediate domains. The terminal apical domains, however, remained poorly resolved. Improved maps were obtained using additional synchrotron data and using the RAVE software package (Kleywegt and Jones, Reference Kleywegt and Jones1999) to re-refine NCS matrices. Ultimately, refinement methods that took into account the natural rigid body motion of the apical domains greatly improved resolution of the apical domains (see below).
Second crystal form
Boisvert et al. obtained a PEG monoclinic crystal of the same GroEL double mutant variant with a P21 space group and unit cell measuring 135.6 × 260.1 × 150.2 Å (PDB:1DER; Boisvert et al., Reference Boisvert, Wang, Otwinowski, Horwich and Sigler1996). These crystals, with one tetradecamer in the a.u., diffracted to better than 2.4 Å, but exhibited high mosaicity and tendency to frank twinning. In contrast to the ammonium sulfate conditions, in which wild-type GroEL would not produce crystals, the PEG conditions permitted the growth of crystals of wild-type GroEL, producing the same lattice. The monoclinic structure was solved by isomorphous replacement using the orthorhombic model, defining a molecular envelope. Then, to produce an unbiased model, the same procedure as earlier was used, starting with an envelope, amplitude data at 6 Å, and random phases, here with 14-fold NCS averaging and phase extension at increasing resolution (with periodic updating of the matrices), to produce a 2.4 Å model. This agreed well with the orthorhombic model. Both models suffered from high B factors in the apical domains.
The monoclinic crystal form was used for imaging nucleotide in the ‘pocket’ that had been observed in the top of the equatorial domain of standalone GroEL structures, growing the PEG crystal form in the presence of the non-hydrolyzable analogue, ATPγS. The same P21 space group and unit-cell dimensions were obtained, with full occupancy by ATPγS of the nucleotide pocket of all 14 subunits (discussed below).
Refinement
Initial steps of refinement were carried out in XPLOR, including positional refinement, B factor refinement, and simulated annealing (Braig et al., Reference Braig, Otwinowski, Hegde, Boisvert, Joachimiak, Horwich and Sigler1994). While this brought R factors to the low-to-mid 30s, the problems with resolving the apical domains remained.
A working idea was that the apical domains, observed in the crystallographic models to form minimal contacts with each other, were subject to rigid body motion such that they did not obey exact sevenfold symmetry, and that thus the sevenfold symmetry averaging operations would diminish the resolution. With the development locally at Yale of torsion angle dynamics refinement strategies by Rice and Brunger, Braig et al. carried out such a refinement with Brunger, relaxing the sevenfold structural identity of the apical domains (PDB:1OEL; Braig et al., Reference Braig, Adams and Brünger1995). This markedly improved the model of the apical domain, e.g. resolving an extended segment at the top of the apical domain (aa296–320) that had been difficult to trace. A further reckoning with domain motion came some years later with the application by Chaudhry et al. (Reference Chaudhry, Horwich, Brunger and Adams2004) of TLS (translation–libration–screw) refinement methods to deal with anisotropic motions of groups of atoms, including those of a domain, against a fixed axis. TLS motions are fitted to diffraction data such that correlated anisotropic displacements are incorporated into nine parameters per body during refinement. TLS further improved the R factors for GroEL and informed that the directions of motion of the apical domains were best described as lying along the pathway of elevation and rotation associated with forming the complex with GroES (see PDB:1SS8, 1SVT; and Chaudhry et al., Reference Chaudhry, Horwich, Brunger and Adams2004).
Architecture of GroEL
The model of GroEL revealed a cylinder 145 Å in height and 135 Å in diameter with a central cavity ~45 Å in diameter (Fig. 50). The two rings are positioned back-to-back, with seven subunits per ring exhibiting sevenfold rotational symmetry. There are seven molecular dyads in the equatorial plane between the two rings, each producing a twofold relationship between a subunit in one ring and a subunit in the opposite ring.
Architecture of GroEL. Top panels: Side (left) and end (right) views of the model of GroEL in space-filling representation with two subunits in the upper ring colored by domain: apical, purple and blue; intermediate, gold and red; equatorial, green and yellow, respectively. End view shows the 45 Å dia. central cavity. Note that it is closed at the equatorial levels of each ring by the collective of the crystallographically-disordered C-termini of the subunits, which amount to 20 kDa of mass per ring that were visible by EM (see Fig. 30a). Middle panels: Ribbon diagrams of the model, with each subunit in the upper ring colored differently and the bottom ring colored gold. Bottom left: Ribbon diagram with the domains of one subunit colored red (apical), green (intermediate), and blue (equatorial), showing overall dimensions of the complex and the diameter of the central cavity. Bottom right: Space-filling model of GroEL with two front subunits removed to reveal the interior surface of the assembly. Hydrophobic residues (mostly facing the cavity at its terminal apical aspects) are colored yellow; polar residues are colored blue. PDB:1OEL, Braig et al. (Reference Braig, Otwinowski, Hegde, Boisvert, Joachimiak, Horwich and Sigler1994, Reference Braig, Adams and Brünger1995).

Each subunit is folded into three domains. The equatorial domains, composed of near-horizontal long α-helices, make tight side-by-side contacts within the rings, the major inter-subunit contacts within a ring, and they form all of the contacts between the two rings (Fig. 50). Each equatorial domain makes two cross-ring contacts, one with each of the two adjacent subunits in the opposite ring (Fig. 51). The staggered contacts produce a rotational offset between rings of approximately a half subunit width. The contacts provide the allosteric signaling route between rings. Overall, the collective of equatorial domains forms the waistline of the GroEL cylinder, and this serves as a relatively stable ‘base’ of the assembly from which movements of the upper two domains are directed by the actions of cooperative ATP binding in the pockets in the top inside surface of each equatorial domain (see Fig. 54). The intermediate domains are slender covalent connections between equatorial and apical domains formed by up- and down-going α-helical structures topped at the apical aspect by a three-stranded β-sheet ‘roof’ (Fig. 50, Fig. 52). The intermediate domains are positioned at the outside wall of the cylinder, with hinge points at their top and bottom aspects to allow for rigid body movements (see page 69 on GroEL/GroES complexes and Fig. 76). Thus, the intermediate domain can make downward rotational movement around the lower hinge in relation to the equatorial domain, and the apical domain can make elevation and twisting rigid body movements around the upper hinge in relation to the intermediate domain. The apical domains roughly overlie the equatorial domains and are composed of a central β-sheet flanked by horizontal α-helices. The apical domains make minimal contacts, one apical-to-apical salt bridge and one apical-to-intermediate domain salt bridge (Fig. 55), and the minimal intersubunit contacts offer an explanation for individual domain motions that made the crystallographic resolution of these domains so difficult.
Cartoon of GroEL showing one subunit in the upper ring and two in the lower ring to illustrate the inter-ring sites of contact, circled to emphasize the 1:2 staggered arrangement of contacts between subunits in the two opposing rings. That is, each subunit has two major sites of contact positioned at the base of its equatorial domain, which, as can be seen, form homotypic contacts with the same sites from two staggered adjacent subunits of the opposite ring.

Cα chain trace of a GroEL subunit from the refined model, colored from blue at N-terminus through to red at C-terminus. N corresponds to the first resolvable residue, aa4, and C to the last resolvable residue, aa 523 (note that 25 C-terminal residues of flexible tail projecting into the central cavity are not resolved). The chain forms a number of the equatorial domain α-helices, then ascends through the intermediate domain, forms the apical domain, then descends through the intermediate domain to form several additional equatorial helices and terminate density at the cavity wall. α-carbon trace from PDB:1OEL.

GroEL subunit and disordered C-terminus
The subunit polypeptide (Fig. 52) commences in density at residue 6 lying at the cavity wall in the equatorial domains, forms one part of the equatorial domain, ascends through the slender intermediate domain to form the apical domain, and then descends through the intermediate domain to form the remainder of the equatorial domain, ending in density at residue 523 near the N-terminus at the cavity wall. Residues 518–521 form a short β-strand, and the main chain and that of two residues beyond the strand point into the cavity (Fig. 53). Beyond Asp523, the last 25 residues, including a repeating motif, GGM, constituting the last 13 residues, are not crystallographically resolved, with the collective of seven such 25-residue tails of a ring accounting for ~20 kDa of mass. This mass had been visible in EM studies as a density lying within the central cavity at the level of the equatorial domains, one mass in each ring (Saibil et al., Reference Saibil, Zheng, Roseman, Hunter, Watson, Chen, auf der Mauer, O'Hara, Wood, Mann, Barnett and Ellis1993; Chen et al., Reference Chen, Roseman, Hunter, Wood, Burston, Ranson, Clarke and Saibil1994).
β-sheet formed at the cavity aspect of the ring, composed of the N-terminal and C-terminal β-strands of adjacent subunits in contact with each other and a stem-loop segment that reaches over from the neighboring equatorial domain (see end view for topology). From PDB:1OEL and adapted from Braig et al. (Reference Braig, Otwinowski, Hegde, Boisvert, Joachimiak, Horwich and Sigler1994).

The C-terminal tails of the GroEL subunit were shown to be dispensable to the function of GroEL – the coding sequence beyond Val521 could be deleted from the chromosomal copy without effect on the growth of E. coli in either rich or minimal media (Burnett et al., Reference Burnett, Horwich and Low1994). Deletion including Val521 or more proximally in the coding sequence produced inviability and, in short-term expression experiments, failure to assemble the deleted GroEL subunits. This was consistent with the participation of the C-terminal β-strand (518–521) in a four-stranded sheet structure formed at the cavity aspect between two neighboring subunits (see Fig. 53; see also McLennan et al. (Reference McLennan, McAteer and Masters1994), where plasmids encoding similarly C-terminally deleted forms of GroEL were tested for complementation of a chromosomal GroEL deletion, producing similar conclusions). While the C-terminal tails are not essential to GroEL function, interestingly, they are highly conserved in bacterial GroELs and in mitochondrial Hsp60s, acting as a ‘floor’ to the cavity in each ring, as a surface interacting with the substrate protein, and affecting chaperonin cycling/ATPase activity (see Appendix 1).
Equatorial domains and ATP-binding site
The equatorial domains (aa 6–133 and aa 409–523, totaling 243 residues) are composed mainly of long nearly horizontal α-helices, and the domain is well-ordered. A β-hairpin stem-loop from each equatorial domain (aa 34–52) reaches over to form a parallel contact with the C terminal β-strand of its neighbor (519–522), forming a four-stranded β-sheet (see Fig. 53). Additional contacts at the ‘seam’ between subunits involve mostly hydrophobic side chain contacts between the neighboring subunits. The side-by-side contacts bury ~1000 Å2 of surface per subunit, while the cross-ring contacts bury ~400 Å2 per subunit.
The initial inspection of a GroEL model revealed a sizable pocket in the upper surface of the equatorial domain, with a conserved GDGTT sequence (aa 86–90) that had been recognized to be present in all chaperonin sequences, thought to be a Walker-type nucleotide-binding motif, in a turn (between two α-helices) facing the pocket. Consistent with this being an ATP-binding pocket, the mutation D87K abolished ATPase activity, and the mutant GroES/GroEL coding sequence fused to a trc promoter (producing low-level expression in the absence of induction) could not support the growth of a GroEL-depleted strain (LG6), whereas the same trc-expressed wild-type GroES/GroEL sequence could efficiently rescue (Fenton et al., Reference Fenton, Kashi, Furtak and Horwich1994).
The stereochemistry of ATP binding was resolved by incubating GroEL with ATPγS and carrying out crystallizations using the conditions for growing monoclinic crystals (Boisvert et al., Reference Boisvert, Wang, Otwinowski, Horwich and Sigler1996; PDB:1DER). Nucleotide was readily visible with 14-subunit occupancy in the equatorial pockets of the model. This localized the GDGTT sequence within the phosphate binding (P) loop, composed, as mentioned, of a helix-loop-helix (instead of a strand-loop-helix present in many other NTP-hydrolyzing proteins). Phosphate oxygen-coordinating metals were also observed (Fig. 54), both a Mg+2 (octahedrally coordinated by non-bridging phosphate oxygens, by the carboxylate of D87, and by waters), and a second coordinating metal, later identified as a K+ ion (Kiser et al., Reference Kiser, Lorimer and Palczewski2009; PDB:3E76), which had been observed to be critical to ATP hydrolysis (Viitanen et al., Reference Viitanen, Lubben, Reed, Goloubinoff, O'Keefe and Lorimer1990).
Equatorial ATP-binding pocket, showing views of ATPγS-bound crystallographic model PDB:1DER, Boisvert et al. (Reference Boisvert, Wang, Otwinowski, Horwich and Sigler1996). Left: Ribbons trace showing colored domains of one subunit: apical, yellow; intermediate, red; equatorial, green. Middle, view of the same subunit in isolation, showing residues involved in equatorial–apical salt bridge (D83–K327) and overall position of ATP pocket in the top aspect of the equatorial domain. Right: View into the ATP pocket, showing ATPγS in yellow, base at left and triphosphate moiety to the right, with Mg+2 (orange), K+ (purple), and side chains -D-TT of the GDGTT Walker motif in magenta, coordinating phosphate oxygens.

The equatorial domains make two critical contacts with the other domains of GroEL. One is with the intermediate domain, which downwardly rotates and thus brings a long descending α-helix down across the ATP site in the presence of ATP (or ADP) and GroES [page 69 and Fig. 77], placing, in the case of ADP–AlFx, the carboxyl side chain of Asp398 into contact with a water in-line with, effectively, the γ-phosphate [see Chaudhry et al., Reference Chaudhry, Farr, Todd, Rye, Brunger, Adams, Horwich and Sigler2003; PDB:1PCQ, 1SVT; page 69, and Fig. 81 for GroEL/GroES/ADP–AlFx]. The second contact is a salt bridge between D83 lying in the top surface of the equatorial domain and K327 lying in the inferior aspect of the apical domain (Fig. 82). When these two amino acids were altered to cysteine and oxidation carried out, they formed a covalent connection between the two domains and locked GroEL into a substrate protein-accepting state (Murai et al., Reference Murai, Makino and Yoshida1996; see page 73 below).
Apical domains form the terminal ends of the central cavity and contain a hydrophobic polypeptide binding surface at the cavity-facing aspect – structure/function analysis
The apical domains (aa 191–376, totaling 186 aa) collectively form the terminal ends of the cylinder and make only two inter-subunit contacts, an inter-apical salt bridge, K207-E255 and an apical-to-intermediate salt bridge R197-E386 (see Fig. 55). The apical domains thus appear relatively free to move independently of each other, explaining the high crystallographic B factors. The domain is composed of a central β-sheet (see Fig. 52). The strands are inter-connected by the two α-helices and underlying extended segment that make up the cavity-facing polypeptide binding surface, as well as by an α-helix (helix J) that sits behind the binding surface on top of the apical domain. The sheet is followed by two long anti-parallel α-helices at the back of the apical domain.
Apical domain salt bridges. (a) Two adjacent subunits viewed from the central cavity, showing an apical–apical (E255–K207) contact and an apical–intermediate one (R197–E386). (b) End view of the same two subunits and the two salt bridges, with central cavity below them. Ribbons trace from PDB:1OEL.
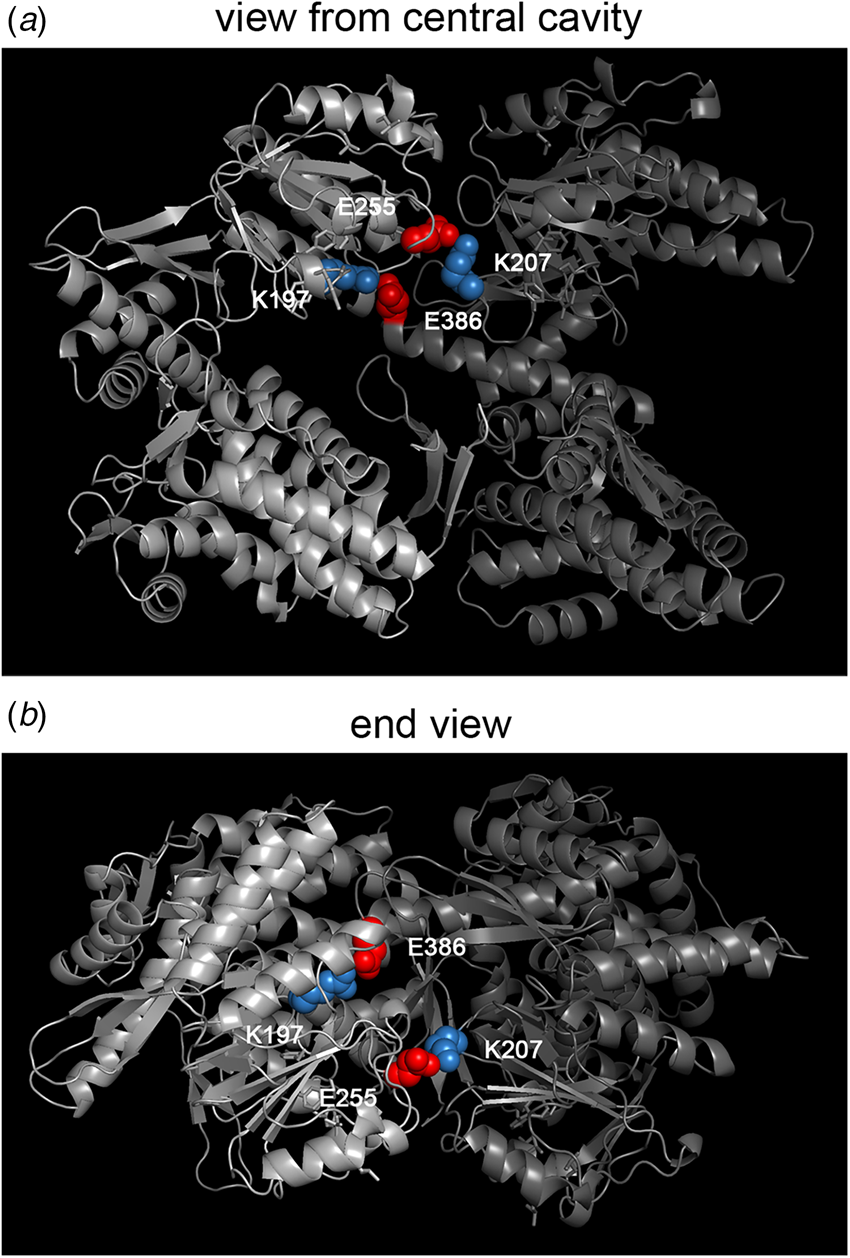
The polypeptide binding surface was initially searched for by a mutational screen, altering hydrophobic amino acids to electrostatic at various points inside the GroEL cavity, inspecting simply for lethality of GroEL-depleted E. coli (LG6 strain) in the setting of expression of the mutant GroEL. Mutation in regions underneath the apical domain did not exhibit a phenotype. Review of Saibil et al.'s (1993) unliganded R. spheroides images reminded that she had seen density in the central cavity at the level of the apical domains. Upon inspection of the apical domain faces, it became clear that there were solvent-exposed hydrophobic side chains on a tier of three horizontal secondary structures, helix H, helix I, and an underlying segment (top to bottom; see Fig. 56). Single mutations L234E and L237E (helix H), L259S, V263S, V264S (helix I), and Y199E, Y203E, F204E (underlying) were produced (Fenton et al., Reference Fenton, Kashi, Furtak and Horwich1994). When the individual mutant-expressing plasmids were transformed into the GroEL-deficient strain (LG6), none of the mutants could produce colonies (versus a wild-type control) – all were inviable. When the mutant GroELs were overproduced and purified, none could bind OTC diluted from 6 M GuHCl, judged by failure of cofractionation of OTC subunit with GroEL in sucrose gradients (Fenton et al., Reference Fenton, Kashi, Furtak and Horwich1994). That is, whereas OTC diluted from denaturant into a mixture with wild-type GroEL would quantitatively comigrate with the GroEL (at ~20 S), after incubation with any of the mutant GroELs, OTC was found at the bottom of the gradient tube as an apparent aggregate.
Apical polypeptide binding surface. View from the central cavity of the apical domain of a subunit. A tier of three secondary structures, helix H, helix I, and an underlying extended segment, present hydrophobic side chains. Alteration of any one of the hydrophobic side chains (shown as yellow sticks) to electrostatic character abolished polypeptide binding by GroEL and the mutants were inviable (Fenton et al., Reference Fenton, Kashi, Furtak and Horwich1994). Note aliphatic side chains in the two helical segments and aromatic ones in the underlying extended segment. From Horwich et al. (Reference Horwich, Fenton, Chapman and Farr2007), and PDB:1OEL.
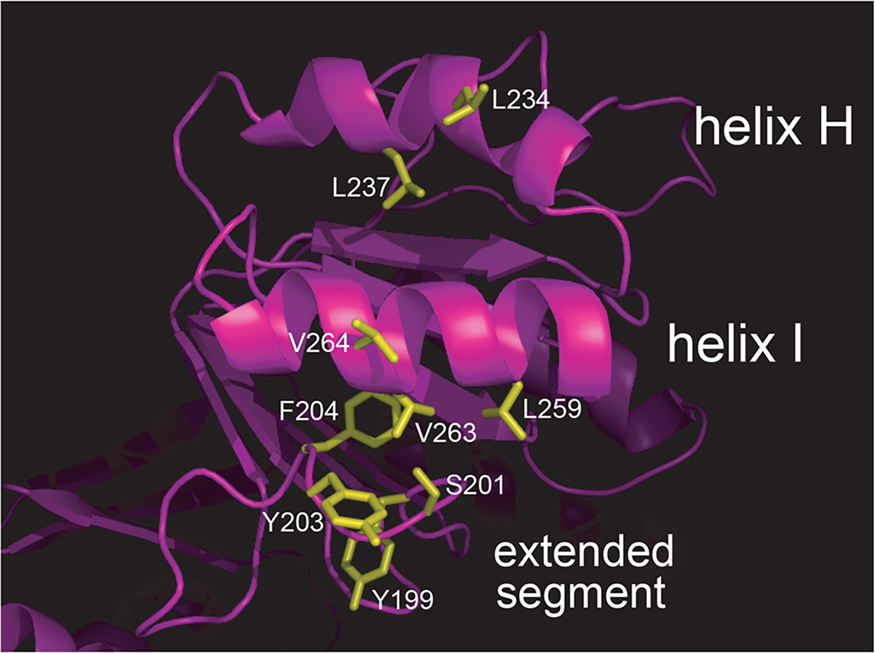
The involvement of a hydrophobic apical surface of GroEL in binding non-native proteins within the central cavity had obvious implications as related to its ability to prevent multi-molecular protein aggregation. Horowitz had implicated hydrophobic surfaces of non-native proteins as being subject to aggregation, and here, in support of his early observations and proposals suggesting that GroEL must proffer a hydrophobic surface that makes contact with such surfaces in non-native proteins, was near-atomic visualization of the chaperonin aspect of such interaction. This further offered explanation of why GroEL has essentially no affinity for native polypeptides, namely that their hydrophobic surfaces are buried to the interior and not accessible to the apical binding surface even though the polypeptide could diffuse into the GroEL cavity.Footnote 29
The size of the central cavity suggested that it could harbor a protein of ~15–20 kDa within the confines of a ring. Yet obviously there would be no size limit if a polypeptide could be partially present in the bulk solution outside the open ring. Thus, proteins like aconitase (80 kDa), too large to fit entirely inside the GroEL cavity, are nonetheless efficiently bound, perhaps via a specific misfolded domain. Indeed, even for the smaller protein rhodanese (33 kDa), small-angle neutron scattering indicated a ‘champagne cork’ topology while bound to GroEL, with one portion in the cavity and another outside in the bulk solution (Thiyagarajan et al., Reference Thiyagarajan, Henderson and Joachimiak1996).
Interestingly, the same apical mutations of GroEL affecting hydrophobics, observed to abolish polypeptide binding, were also observed to abolish GroES binding, measured in vitro either as failure to inhibit ATP turnover by GroEL (wild-type GroEL is inhibited by ~50%) or more directly by gel filtration inspection for cofractionation of 35S-labeled GroES with GroEL (in ADP). This suggested that the same hydrophobic surface that is involved with polypeptide binding is also involved with the recruitment of GroES in the presence of ATP or ADP. Both cryoEM studies (Roseman et al., Reference Roseman, Chen, White, Braig and Saibil1996) and the crystal structure of GroEL/GroES/ADP7 (Xu et al., Reference Xu, Horwich and Sigler1997) supported that, indeed, the elevation and rotational movement of the apical domain in the presence of ATP or ADP brings its hydrophobic binding surface to a point in space where the mobile loops of GroES (each with a hydrophobic IVL ‘edge’) can contact a portion of the hydrophobic surface. Whether the mobile loops of GroES can actually compete for the hydrophobic binding surface to which polypeptide is bound (during initial collision of GroES and subsequent apical movement), potentially displacing polypeptide (e.g. downward) on the binding surface before its complete release, is unknown (see Clare et al., Reference Clare, Vasishtan, Stagg, Quispe, Farr, Topf, Horwich and Saibil2012 and page 73).
Intermediate domains
The intermediate domain (aa 134–190 and 377–408) is a slender anti-parallel structure that covalently connects the equatorial domain to the apical domain of each subunit at the outer aspect of the cylinder (see Figs. 50 and 52). It is composed of long angled α-helices and a three-stranded β-sheet ‘roof’ and it exhibits ‘hinges’ at its points of connection to the equatorial domain (P137, G410) and apical domain (G192, G375)(see also Fig. 76). This allows for rigid body movements about the lower and upper hinges. Rigid body tilting of the intermediate domain about the lower hinge brings it down onto the nucleotide pocket in the top of the equatorial domain, carrying the long descending helix M and its constituent residue Asp 398 into the nucleotide pocket to activate a water for an in-line attack on the γ-phosphate of ATP (Figs. 77, 80, and 81). Associated rigid body elevation and rotation of the apical domain about the top hinge in the presence of equatorial-bound ATP allows for the association of the apical binding surface with GroES and is followed by further movements that release bound polypeptide [Figs. 75, 76, 78 and see pages 69 and 73 below].
There are side ‘holes’ in the GroEL cylinder at the level of the intermediate domains, ~20 × 10 Å, framed by an equatorial domain at the lower aspect, intermediate domain at the top and one side, and apical domain at the other side (Fig. 50). These holes provide ready access to solvent, ions, and nucleotide.
XVII. Topology of substrate protein bound to asymmetric GroEL/GroES/ADP complexes – non-native polypeptide binds to an open ring in trans to a ring bound by GroES, can be encapsulated underneath GroES in cis, and productive folding triggered by ATP commences from cis ternary but not trans ternary complexes
In November 1995, Weissman et al. (Reference Weissman, Hohl, Kovalenko, Kashi, Chen, Braig, Saibil, Fenton and Horwich1995) reported on the topology of two substrate proteins, OTC and rhodanese, in relation to GroES, in complexes formed by an alternate order of addition to GroEL, either GroES(/ADP) before polypeptide or polypeptide before GroES(/ADP). They observed that both cis and trans ternary GroEL/GroES/polypeptide asymmetric complexes can be formed, i.e. complexes with a polypeptide in the same ring as GroES versus ones with a polypeptide in the ring opposite GroES, respectively. They then measured the productivity of the respective OTC ternary complexes upon challenge with ATP, observing that cis but not trans complexes were productive.
Substrate can localize at GroEL in cis, underneath GroES, or in trans, in the opposite ring to GroES, as determined by hit-and-run crosslinking
Topology was first analyzed in asymmetric GroEL/GroES complexes by using a hit-and-run iodinated photoactivatable crosslinker, 125I-APDP (see Fig. 57a). The radio-iodinated crosslinker was placed on urea-unfolded OTC or rhodanese via an air-oxidized disulfide linkage. The substrate protein was then incubated with either a preformed asymmetric GroEL/GroES (ADP) complex or with GroEL alone, to which GroES was subsequently added (in the presence of ADP). UV irradiation then produced crosslinking (via the azido group of the crosslinker) to the GroEL ring to which substrate protein was bound. After reductive release of the iodinated crosslinker from the substrate protein by DTT, the radio-iodinated crosslinker-bearing GroEL ring could be identified as positioned in cis or trans to GroES via PK ‘marking’ of the GroEL rings (Figs. 57b and 58). The marking took advantage of susceptibility of the C-terminal tails of the subunits of an open GroEL ring to PK digestion, but their relative resistance to PK in a GroES-bound ring (Langer et al., Reference Langer, Pfeifer, Martin, Baumeister and Hartl1992b). ‘Clipped’ versus ‘unclipped’ subunits migrate distinctly in an SDS gel [16 amino acids are removed by clipping (Martin et al., Reference Martin, Mayhew, Langer and Hartl1993b), amounting to ~2 kDa], and autoradiography determined which ring received the iodinated crosslinker and thus contained the polypeptide.
Hit-and-run crosslinking strategy to identify the topology of substrate protein at GroEL. (a) Structure of a heterobifunctional cleavable crosslinker, APDP, labeled with 125I, and a scheme for labeling GroEL subunits via crosslinker-modified substrate protein. (b) Scheme for proteinase K (PK) digestion of C-terminal tails of the open trans ring of an asymmetric GroEL/GroES complex. At right, SDS-PAGE analysis of GroEL after PK digestion of an asymmetric complex. From Weissman et al. (Reference Weissman, Hohl, Kovalenko, Kashi, Chen, Braig, Saibil, Fenton and Horwich1995).
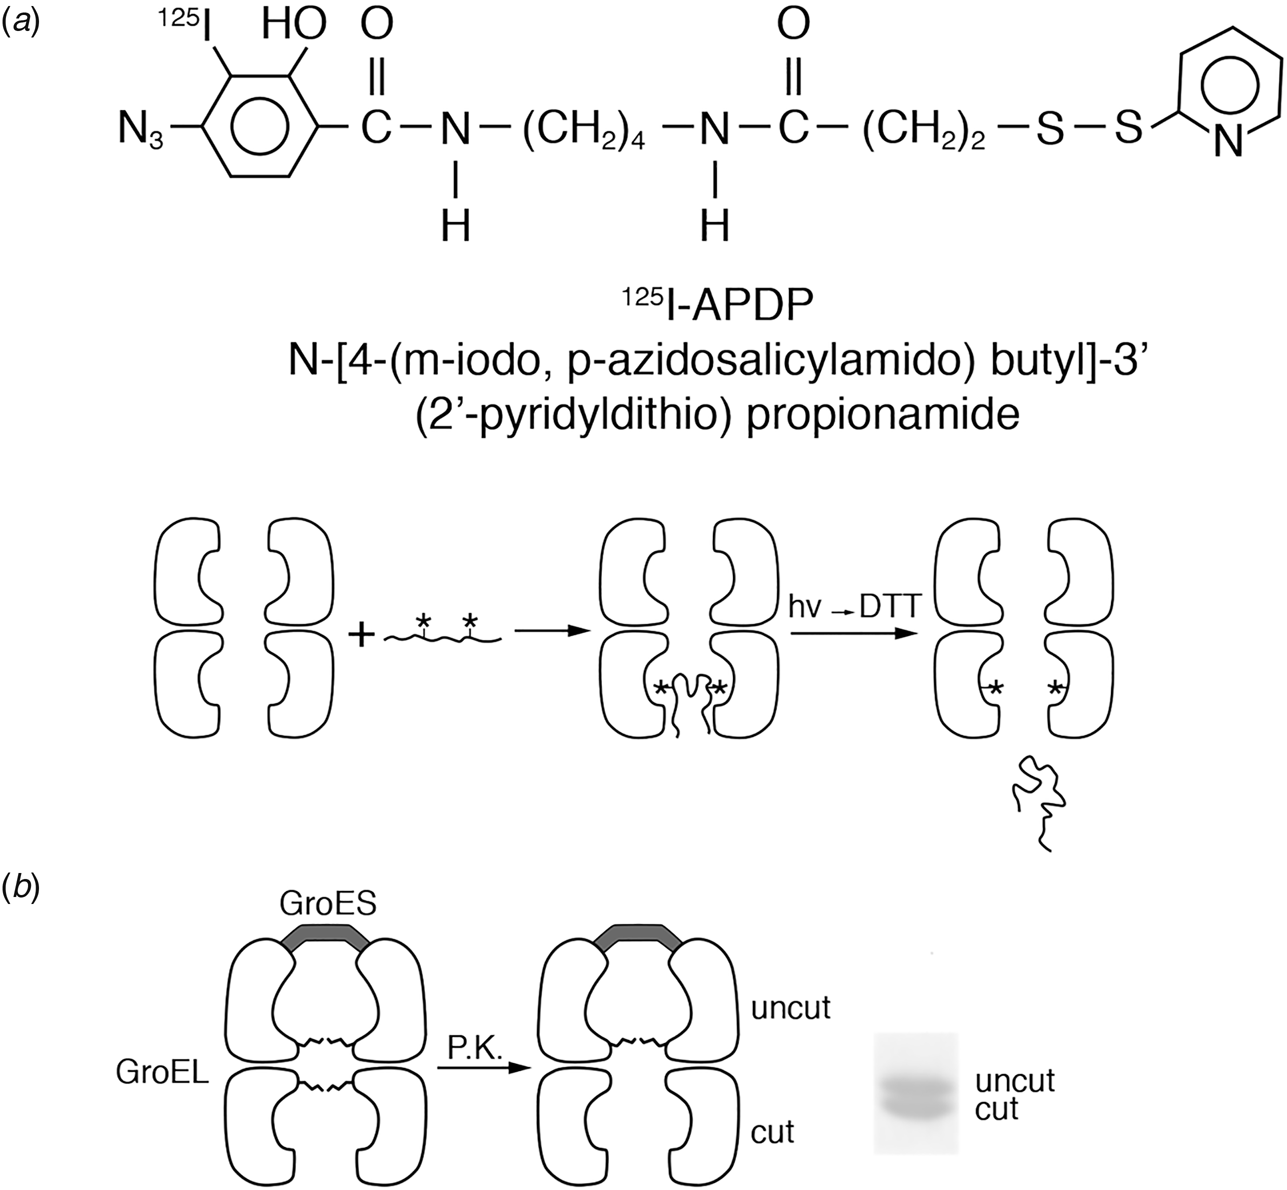
Hit-and-run crosslinking study with either OTC or rhodanese reveals that substrate protein can bind in an open trans ring of a pre-formed asymmetric GroEL/GroES complex, or if substrate is pre-bound to a ring of GroEL, added GroES can bind at random, to either the opposite ring as substrate protein or to the same ring as substrate protein, in the latter case encapsulating the substrate protein in cis underneath GroES. (a) With GroES bound first to GroEL to form an asymmetric complex, subsequently added polypeptide can only be bound in the open opposite (trans) ring. This is manifest as a photocrosslinked ring whose subunit C-termini can be PK-clipped. (b) With substrate protein bound first to GroEL to form a GroEL/substrate binary complex, subsequently added GroES can bind, in principle, either cis or trans to the polypeptide-bound ring. This would be manifest as crosslinked rings whose subunit C-termini would be, respectively, resistant to (because of bound GroES) or sensitive to (in the absence of GroES) PK-clipping. Strikingly, the experiment reveals roughly equal levels of both clipped and unclipped GroEL subunits, indicating that either cis or trans topology can be populated, i.e. GroES binds essentially randomly. Thus, where polypeptide could not be observed in EM to occupy a cis location underneath GroES, the hit-and-run crosslinker experiment showed clearly that substrate protein could be encapsulated in the cis cavity underneath GroES. From Weissman et al. (Reference Weissman, Hohl, Kovalenko, Kashi, Chen, Braig, Saibil, Fenton and Horwich1995).
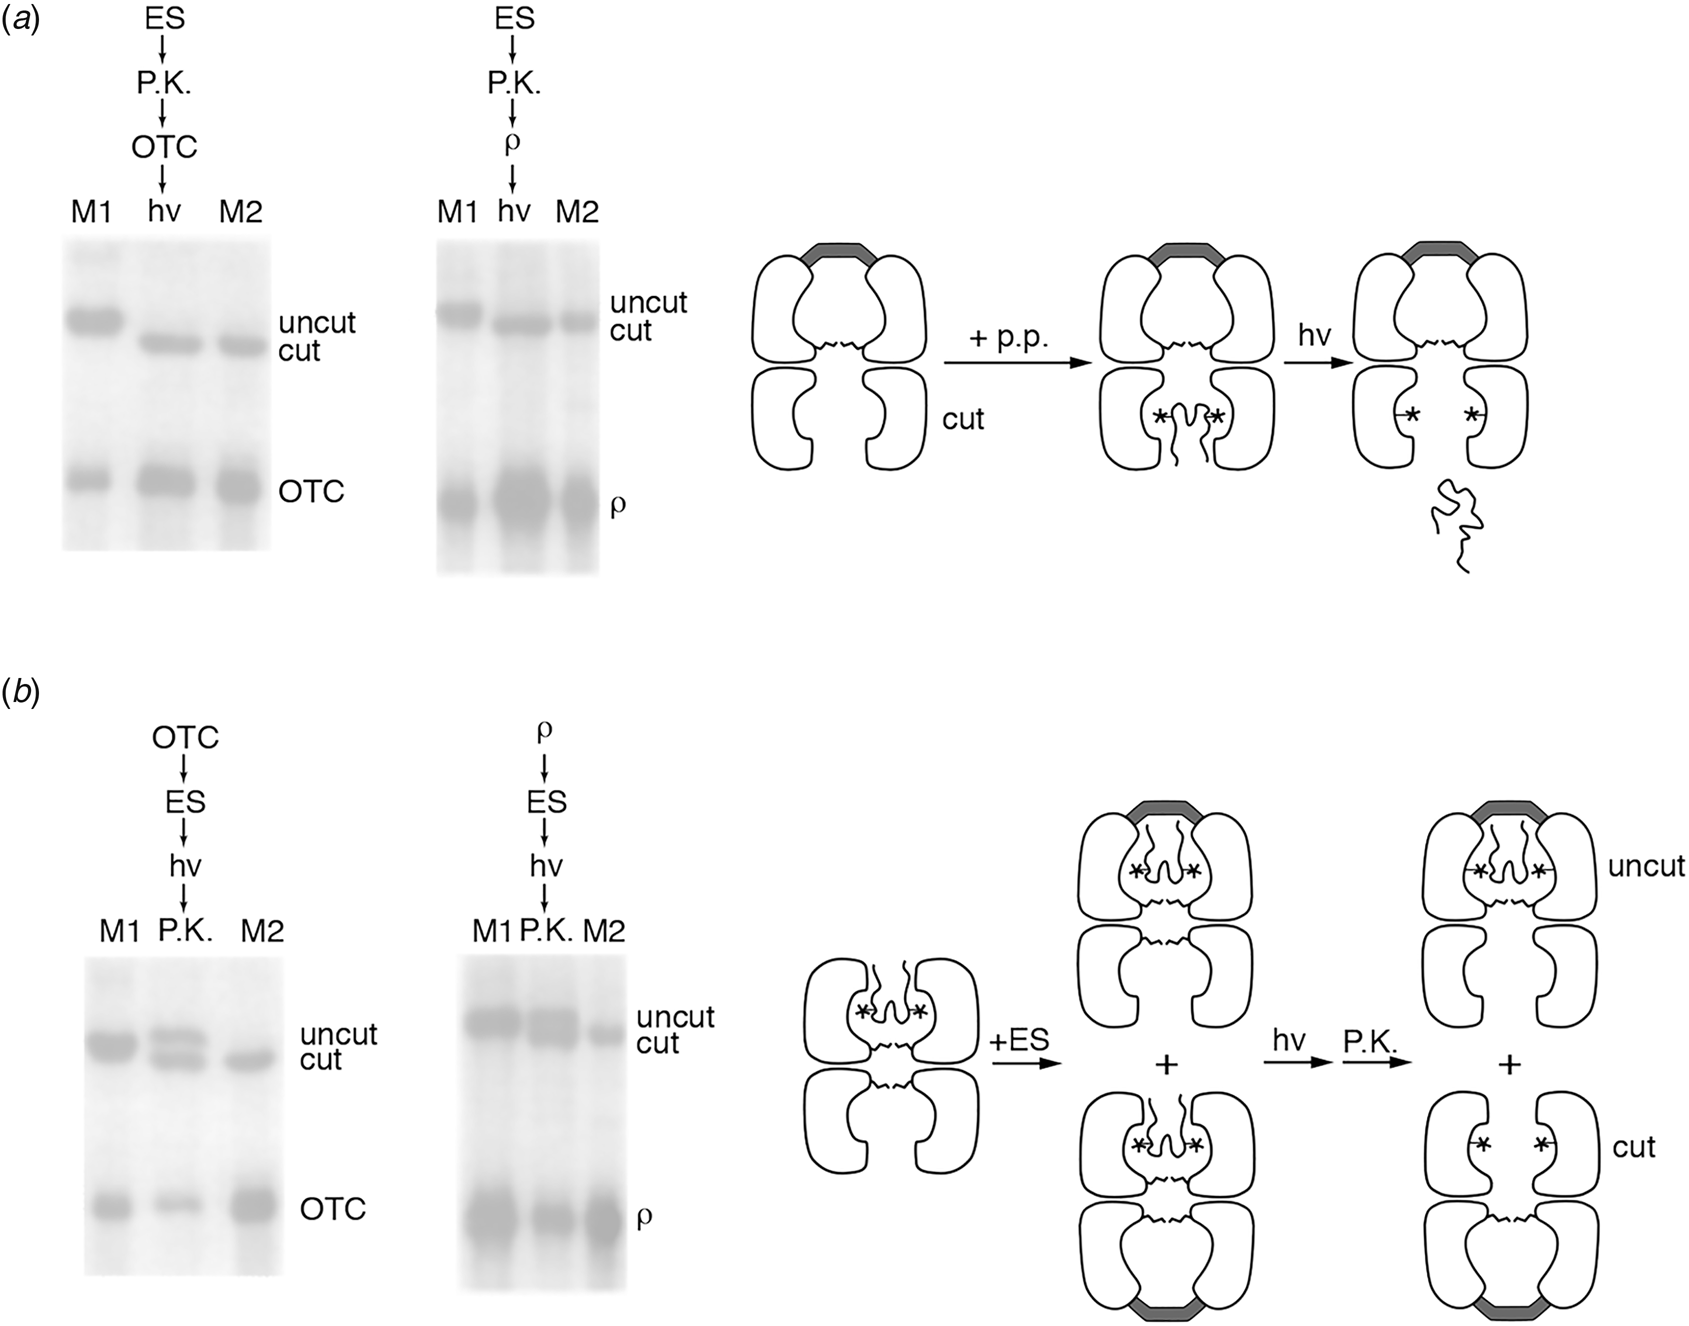
When an asymmetric complex with a clipped open ring was incubated with OTC or rhodanese bearing the crosslinker and then photocrosslinked and reduced, only the clipped trans ring exhibited the radioiodine (Fig. 58a). When a reversed order of addition was carried out, adding first polypeptide bearing the crosslinker, and then GroES, followed by photocrosslinking, reduction, and PK digestion, both clipped and unclipped rings labeled equally, indicating that binding of GroES could occur either to the same ring as polypeptide (cis) or to the opposite ring (trans; Fig. 58b).
Proteinase K protection of substrate protein inside the cis ring
To further measure the protection of polypeptide in putative cis ternary GroEL/GroES complexes, PK protection was followed quantitatively using 35S-radiolabeled substrate proteins (without crosslinker), measuring the resistance of full-length rhodanese to protease over a time course, with either order of addition. With rhodanese added to pre-formed GroEL/GroES complexes (ES→ρ), complete digestion was observed within 3 min (Fig. 59a), whereas with the addition of substrate first before GroES (ρ→ES), ~30–40% of the substrate protein was stably protected (Fig. 59a). This supported that GroES could bind approximately randomly, either to a substrate protein-bound GroEL ring or to the opposite unoccupied GroEL ring, with, in the former case, binding of GroES encapsulating the polypeptide in a PK-protected location in the central cavity underneath GroES (in cis; see Fig. 59c for topology models). As a negative control, the large protein, methylmalonyl CoA mutase (79 kDa), too large to be encapsulated underneath GroES, was observed to be completely digested with either order of addition (Fig. 59b). Thus, the order-of-addition/proteolysis experiment supported the observations from the hit-and-run crosslinking experiment that GroES could bind to the same ring as a polypeptide, encapsulating the substrate in the GroEL cavity underneath GroES.
Order-of-addition proteolysis experiment complements hit-and-run crosslinker results (Fig. 58) to show that substrate can occupy the cis cavity underneath GroES. (a) Time-course of digestion of non-native 35S-labeled rhodanese added to GroEL before GroES (ρ→ES) or after GroES (ES→ρ). When rhodanese is added before ES, about half of the rhodanese species are protected, suggesting that GroES binds randomly in either cis or trans to rhodanese, panel (c), bottom scheme; when rhodanese is added after ES, none is protected, reflecting that it can only bind in trans, panel (c), top scheme. (b) Similar experiment using non-native 35S-labeled methylmalonyl-CoA mutase, an 80 kDa protein, as substrate. It is too large to be encapsulated and is not protected with either order of addition. From Weissman et al. (Reference Weissman, Hohl, Kovalenko, Kashi, Chen, Braig, Saibil, Fenton and Horwich1995).
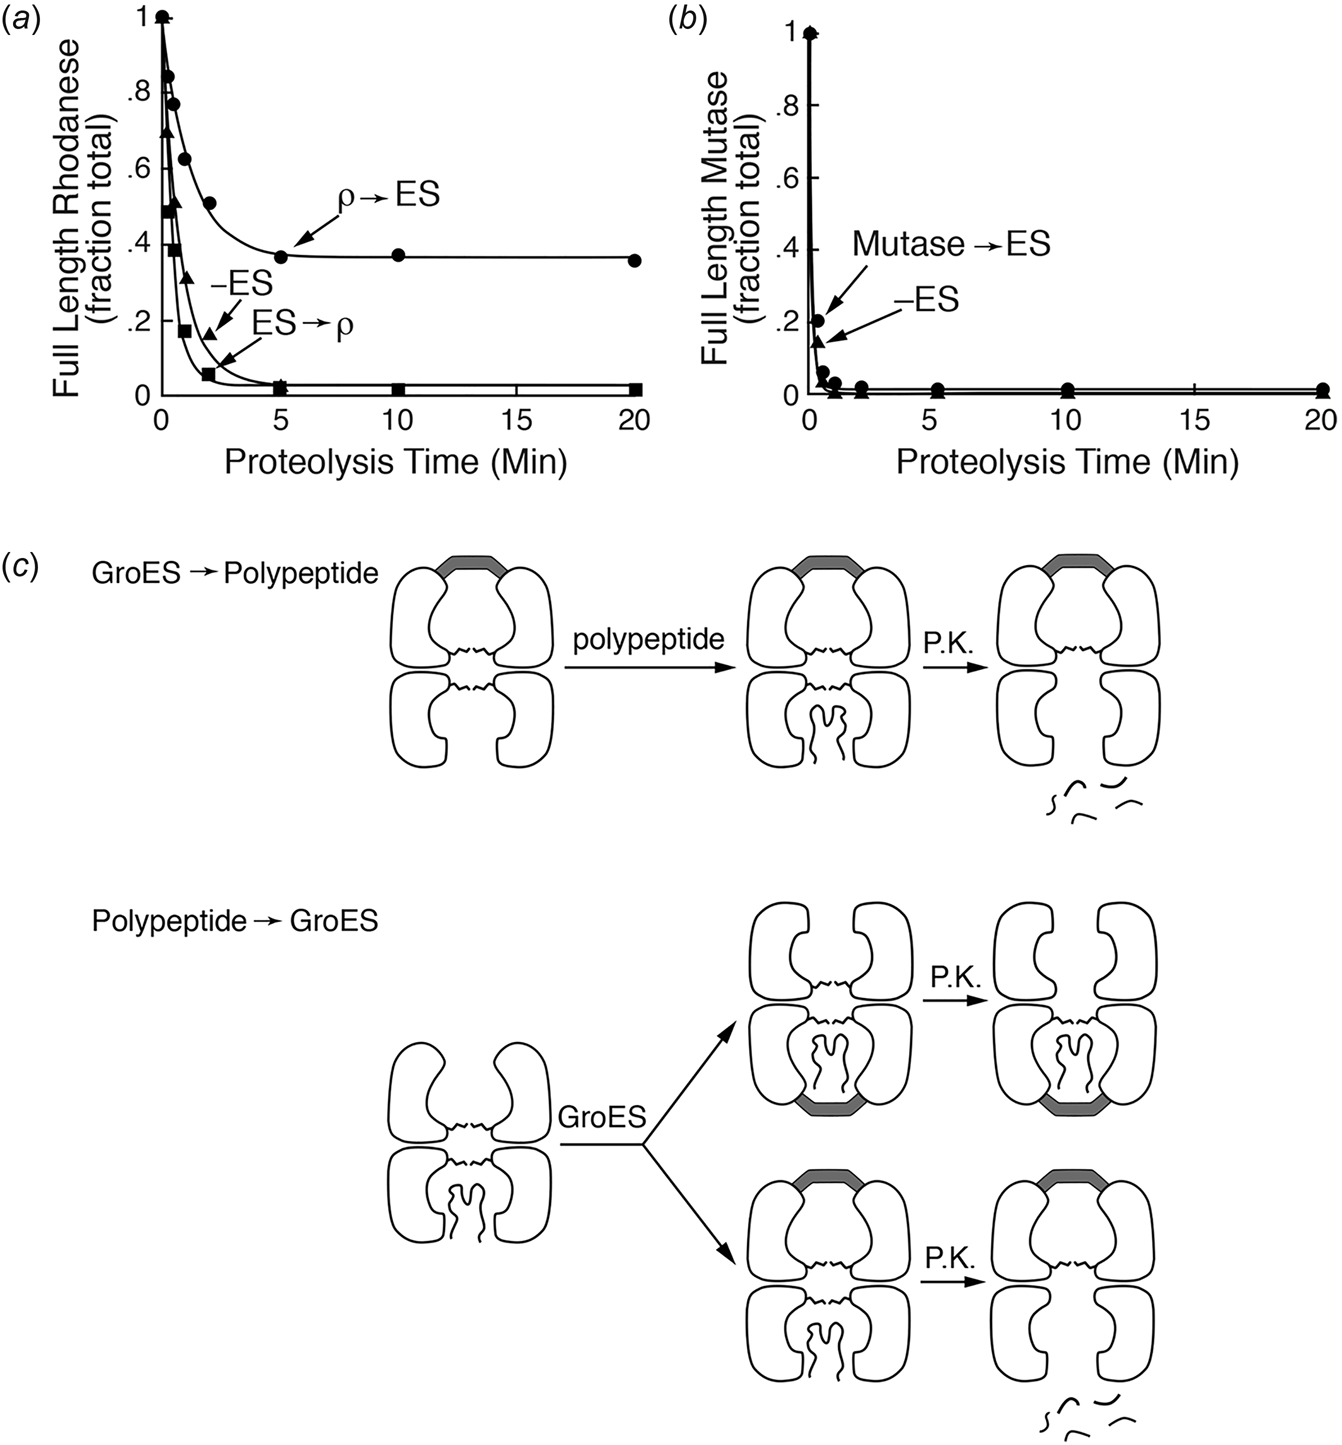
Production of the native state from cis but not trans ternary complexes
Homogeneous cis and trans ternary complexes could be produced, the former enabled by PK removal of trans-bound substrate protein from complexes formed by the addition of polypeptide before GroES, and the latter produced by simply binding non-native protein to a pre-formed asymmetric GroEL/GroES complex. It was thus possible to carry out functional testing by challenging the respective ternary complexes with ATP. OTC was used for these studies, favored by rapid recovery of its native form upon addition of ATP/GroES to OTC/GroEL binary complexes (at 37 °C; Zheng et al., Reference Zheng, Rosenberg, Kalousek and Fenton1993). Single turnover conditions were designed, aimed at allowing GroES to be released from the ternary complexes only once, without the ability to rebind to GroEL. This was accomplished by adding a threefold molar excess of a ‘trap’ version of GroEL, a single-ring mutant called SR1, able to bind GroES but not able to release it even in the presence of ATP.
Single-ring version of GroEL as a ‘trap’ of GroES
The design of SR1 was based on an understanding from the study of Todd et al. (Reference Todd, Viitanen and Lorimer1994) that the normal eviction signal for GroES (from an asymmetric GroEL/GroES/ADP complex) comes allosterically from ATP in the opposite ring of GroEL. The idea of SR1 was simply to remove that ring altogether, abrogating any signal from the opposite ring. Thus GroES could be stably captured by SR1 in the presence of ATP but not released, preventing it, in a folding reaction initiated at cis or trans ternary complexes, from rebinding to wild-type GroEL double ring and promoting any further cycles of folding. To produce SR1, four residues at the equatorial base of the GroEL subunit that form cross-ring contacts (at the right-hand site of contact) were simultaneously altered, with the mutations R452E, E461A, S463A, V464A (see Fig. 60). When these subunits were overexpressed in E. coli, a single-ring version of GroEL was correspondingly overproduced, as observed by gel filtration and EM. When SR1 was purified and incubated with GroES and ATP, GroES remained stably associated with SR1 in ATP for as long as 5 h (versus release from wild-type GroEL with t ½ < 0.5 min).
Single-ring version of GroEL, SR1. Left: Four amino acids at the ‘right-hand’ site of the ring–ring contact at the base of the equatorial domain were simultaneously altered, R452 to glutamate and the three others, E461, S463, and V464, to alanine. When expressed in E. coli, a single-ring version of GroEL was produced, shown at right in EM, with only two stripes in side view standalone (top panel) and a domed chamber in side view in the presence of ATP/GroES (bottom panel). From Weissman et al. (Reference Weissman, Hohl, Kovalenko, Kashi, Chen, Braig, Saibil, Fenton and Horwich1995).

Cis but not trans ternary complexes are productive
SR1 was added in molar excess to mixtures containing cis or trans ternary GroEL/GroES/OTC complexes formed in ADP, and ATP was then added. Under these conditions, cis complexes produced nearly complete recovery of OTC enzyme activity within 15–30 s whereas trans complexes produced only a few percent recovery over 5 min (Fig. 61). In a further test carried out in the absence of SR1, GroEL/GroES/OTC complexes were allowed to recycle in the presence of ATP, allowing substrate protein to undergo further rounds of attempted folding. Yet even under these conditions, the recovery from trans complexes was relatively slower than cis (Fig. 61b, trans, –SR1), relating most likely to the need for recycling to a cis complex in order to enable productive folding.Footnote 30
Folding of OTC from pre-formed cis and trans ternary complexes in the presence of a molar excess of SR1 as a ‘trap’ for GroES, in order to confine the reaction to a single round of cis folding (such that GroES is captured by SR1 upon release from GroEL and cannot release from it, preventing a further GroEL cis complex from being formed). (a) A pre-formed GroEL/OTC/GroES cis asymmetric complex is rapidly productive of OTC activity upon addition of ATP (in the presence of SR1), while (b) a preformed trans complex is not productive in the presence of SR1, indicating that folding must at least commence in cis. Note that folding from pre-formed trans is relatively slow even in the absence of SR1, suggesting a requirement for the release of GroES and reformation of a cis complex at a subsequent round of substrate/GroES binding before productive folding can occur. From Weissman et al. (Reference Weissman, Hohl, Kovalenko, Kashi, Chen, Braig, Saibil, Fenton and Horwich1995).
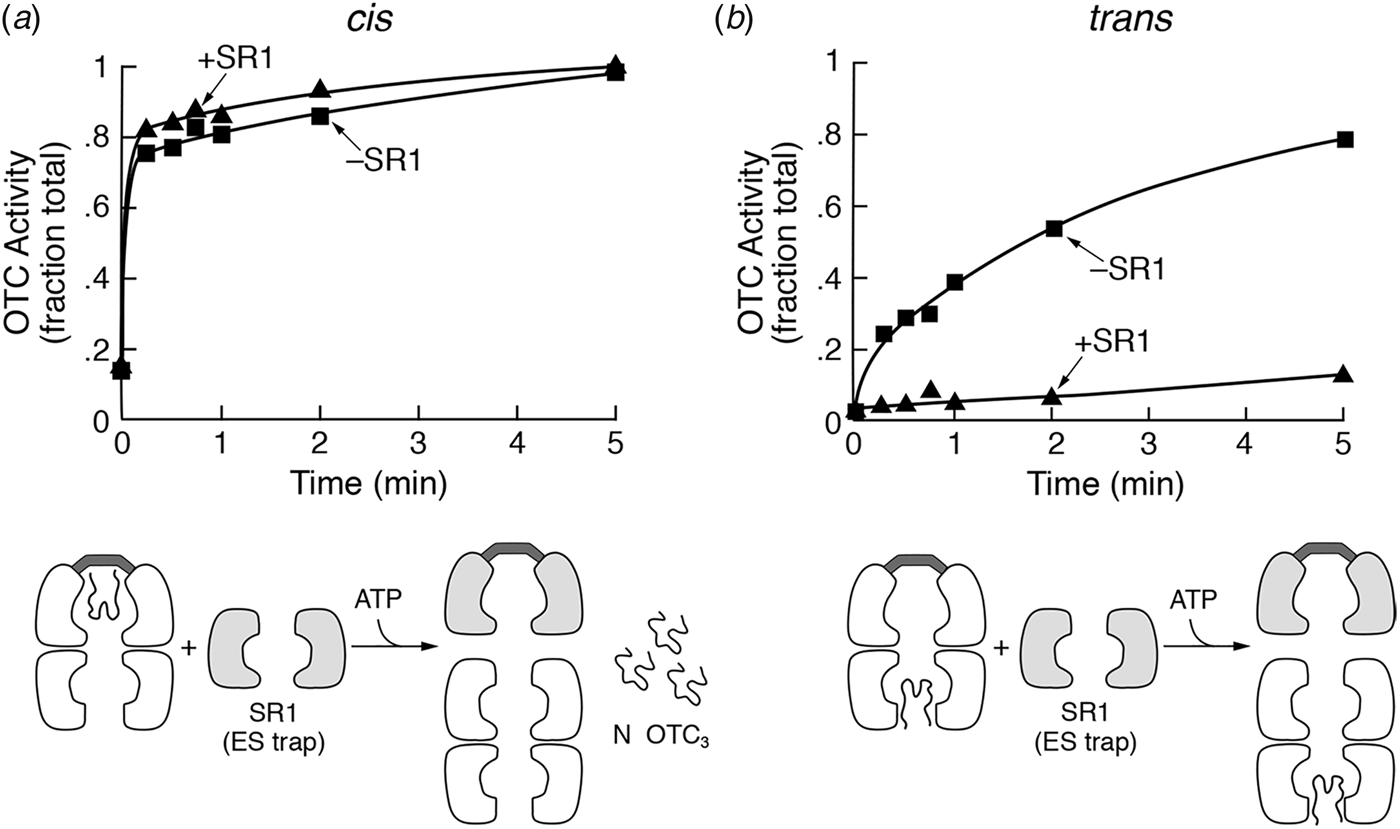
The observations of topology and productivity supported a model in which polypeptide is initially bound in an open ring of a GroEL/GroES asymmetric complex. As the result of dynamic GroES binding and release [with the binding of GroES occurring to an ATP-bound ring (Jackson et al., Reference Jackson, Staniforth, Halsall, Atkinson, Holbrook, Clarke and Burston1993; Todd et al., Reference Todd, Viitanen and Lorimer1993) and release directed by ATP in the GroEL ring in trans (Todd et al., Reference Todd, Viitanen and Lorimer1994)], the protein initially bound in an open ring can become encapsulated in a cis ternary complex. Productive polypeptide folding was suggested to at least commence from this complex in the presence of ATP.
XVIII. Substrate polypeptide can reach the native state inside of the cis GroEL/GroES chamber
In early February 1996, two studies, one from Weissman et al. (Reference Weissman, Rye, Fenton, Beechem and Horwich1996) and one from Mayhew et al. (Reference Mayhew, da Silva, Martin, Erdjument-Bromage, Tempst and Hartl1996), indicated that productive folding to the native state could be completed in a cis chamber. The former study made clear that ATP/GroES binding is critical to the efficient release of a GroEL/GroES/ATP-dependent polypeptide (monomeric rhodanese) from the GroEL cavity walls into the chamber, enabling the virtually complete recovery of the native state when inside a stable (SR1/GroES) chamber. The latter study used monomeric DHFR, a substrate not requiring GroES and able to refold in free solution, but it showed, significantly, that a fraction of non-native DHFR in an initial binary complex with GroEL could be recovered in native form either when crosslinked to the GroEL apical polypeptide binding surface and challenged with ATP/GroES or, absent crosslinking, when challenged with ADP/GroES.
Rapid drop of fluorescence anisotropy upon addition of GroES/ATP to SR1/pyrene-rhodanese
The study of Weissman et al. employed the single-ring SR1 version of GroEL, in this case to form obligate (cis-only) long-lived ternary complexes by adding either ATP/GroES or ADP/GroES to rhodanese/SR1 binary complexes.Footnote 31
Using stopped flow mixing and measuring fluorescence anisotropy of rhodanese labeled with pyrene maleimide (coupled covalently through one or more of its four cysteine residues), early changes in the flexibility of rhodanese could be measured in real time. Upon adding ATP and GroES to either GroEL/pyrene-rhodanese or SR1/pyrene-rhodanese binary complexes, there was a substantial drop of fluorescence anisotropy with a t ½ of ~2 s (Fig. 62). By contrast, no such change occurred when ADP/GroES was added to either binary complex, according exactly with the inability of ADP/GroES to support refolding of rhodanese to the native state. The drop of anisotropy indicated that there is a rapid increase of conformational flexibility of rhodanese in the cis ring upon the formation of a cis ternary GroEL or SR1 complex in ATP. Because this is associated with productive folding, it implied that polypeptide was released from the cavity wall upon binding of ATP/GroES and commenced folding.
Addition of ATP/GroES to SR1/pyrene-rhodanese produces a rapid drop of fluorescence anisotropy, indicating the commencement of folding in the (herein) obligately-formed cis chamber. Neither ATP alone nor ADP/GroES produce a change of anisotropy. Time-course of anisotropy of pyrene-labeled rhodanese in a binary complex with (a) wild-type GroEL or (b) SR1, upon nucleotide/GroES addition. From Weissman et al. (Reference Weissman, Rye, Fenton, Beechem and Horwich1996).
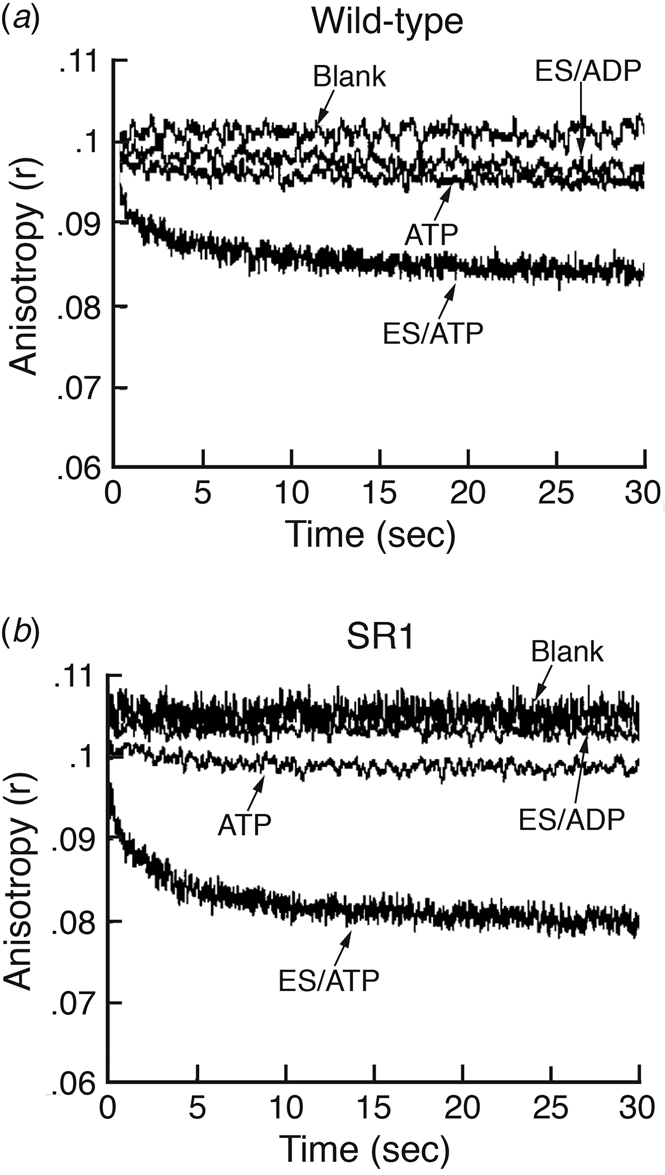
Additional gel filtration studies with 35S-radiolabeled rhodanese indicated that it migrated with the stable SR1/GroES/ATP complex (~400 kDa), and a Hummel–Dreyer-type experiment, applying SR1 to a gel filtration column equilibrated in 35S-GroES and ATP, indicated that only a single GroES heptamer was bound to SR1 and that no GroEL double rings were formed. Additional studies indicated that SR1 undergoes a single round of ATP hydrolysis and is then locked in a stable ADP-bound state (with stability favored by low salt conditions).
Rhodanese folds to native active form inside stable SR1/GroES complexes formed by the addition of GroES/ATP to SR1/rhodanese binary complex
At longer times, stable SR1/GroES/rhodanese ternary complexes could also be assayed for whether the rhodanese monomer apparently released within them could reach the native active form inside the cis chamber, by measuring rhodanese enzymatic activity. The kinetics of recovery of activity from a cis ternary SR1/GroES/rhodanese reaction mixture in ATP were the same as those for a cycling wild-type GroEL/GroES/rhodanese/ATP reaction (Fig. 63a). This most likely reflected that, in the cycling reaction, released non-native forms are rapidly rebound by open GroEL rings, with polypeptide spending the vast majority of its time at GroEL (until reaching native form). Most striking, when the SR1/GroES/rhodanese reaction mixture was rapidly gel filtered at various time points and the 400 kDa SR1-containing fraction taken, the recovered rhodanese activity was present in this fraction, recovering with the same kinetics as observed for the unfractionated reaction mixture (Fig. 63b). This indicated that rhodanese could reach the native state inside the cis cavity.
Recovery of rhodanese enzyme activity inside stable SR1/GroES/rhodanese cis ternary complexes in the presence of ATP, showing the same kinetics as a wild-type GroEL/GroES/ATP reaction. (a) Time-course of recovery of activity from wild-type (WT) or SR1 complexes, with a requirement for ATP/GroES at either GroEL or SR1. (b) Rhodanese activity is recovered with the 400 kDa SR1/GroES/rhodanese ternary complex after gel filtration of the refolding mixture at various times. From Weissman et al. (Reference Weissman, Rye, Fenton, Beechem and Horwich1996).

To exclude that refolding in the cis cavity was somehow unique to SR1, a GroEL reaction was carried out in the non-hydrolyzable ATP analogue AMP-PNP, which had been shown to be unable to discharge GroES from an asymmetric GroEL/GroES/ADP complex (Todd et al., Reference Todd, Viitanen and Lorimer1994). GroES and AMP-PNP were added to a GroEL/rhodanese binary complex and triggered the recovery over 45 min of 40% of input rhodanese, roughly consistent with this analogue's (inefficient) ability to promote refolding in cis ternary complexes. The refolded rhodanese migrated with ternary complexes in gel filtration, and its activity was resistant to PK treatment. This further implied that, in a cycling reaction, polypeptide likely reaches a committed state in the cis chamber prior to the step of trans ATP-triggered release from it.Footnote 32
Longer rotational correlation time of GFP inside SR1/GroES
Finally, Weissman et al. observed that when non-native GFP complexed with SR1 was challenged with GroES/ATP, it was discharged into the cis cavity and assumed its fluorescent native state. Fluorescence anisotropy decay studies showed that the refolded GFP was not tumbling freely, however; its rotational correlation time had increased from 13 ns in free solution to 54 ns in cis, reflecting tumbling as if it were a 120 kDa protein. Thus, there are apparently translational collisions of the refolded protein with the nearby cavity wall (see page 101 for further consideration of the cis cavity).
Mouse DHFR bound to GroEL crosslinks to the apical underlying segment and can bind radiolabeled methotrexate following the addition of ATP/GroES
In the parallel Mayhew et al. (Reference Mayhew, da Silva, Martin, Erdjument-Bromage, Tempst and Hartl1996) study, mouse DHFR was investigated for its locus of binding at GroEL and for ability to fold in cis in the presence of GroES. First, DHFR was extended at the coding sequence level at its C-terminus with a peptide including a tryptic cleavage site and a unique cysteine. A photoactivatable crosslinker (ASIB) was then attached. After binding of the modified DHFR to GroEL, UV crosslinking followed by trypsin treatment and MS analysis revealed a major crosslink to Y203, in the underlying segment of the apical peptide binding region (see Fig. 56). Notably, the mutation Y203E had been shown to abolish polypeptide binding (Fenton et al., Reference Fenton, Kashi, Furtak and Horwich1994). Thus, the C-terminus of bound DHFR could be crosslinked to the deepest aspect of the hydrophobic apical face. The DHFR positioned there was inactive, as indicated by its failure to bind 3H-MTX. Presumably, the unfolded protein lay across one or two apical domains of a GroEL ring, forming hydrophobic contacts with them (see Farr et al., Reference Farr, Furtak, Rowland, Ranson, Saibil, Kirchhausen and Horwich2000; page 94). Addition of MgATP alone did not produce MTX binding. When MgATP and GroES were added, however, there was ~10% recovery of the crosslinked DHFR in the native state as measured by 3H-MTX binding. The inefficiency of recovery in ATP seemed understandable, insofar as ATP-triggered departure of GroES could allow the apical domains to recover a binding proficient position that would rebind the tethered enzyme in the absence of the enzyme's ligands [resembling the early ‘native’ DHFR binding study of Viitanen et al. (Reference Viitanen, Donaldson, Lorimer, Lubben and Gatenby1991)].
Mouse DHFR reaches native form in the absence of crosslinking upon addition of ADP/GroES to GroEL/DHFR binary complex, with native DHFR contained within the GroES-bound GroEL ring
It was assumed that ADP/GroES binding to DHFR/GroEL binary complexes, absent any DHFR crosslinking to GroEL, would produce a stable cis ternary complex (as in Weissman et al., Reference Weissman, Hohl, Kovalenko, Kashi, Chen, Braig, Saibil, Fenton and Horwich1995), and that DHFR might be able to reach the native form. Indeed, upon addition of GroES/ADP, ~15–20% of GroEL–DHFR reached a form that could bind 3H-MTX (Fig. 64). Because ~50% of the bound DHFR would likely be present in trans and thus not be able to reach the native form, this value suggests that ~30–40% of the available cis molecules reached the native form. The native molecules bearing 3H-MTX remained stable both to PK treatment and gel filtration, supporting their presence in cis. Similar results were obtained measuring DHFR enzymatic activity.
Folding of DHFR in a cis ternary GroEL/GroES/DHFR complex formed in ADP. Ability to bind 3H-methotrexate (MTX) was used as a measure of DHFR reaching the native form, with gel filtration fractions assessed for such binding (open-circle traces). GroEL/DHFR binary complex did not bind 3H-MTX (top). With added GroES and ADP, 3H-MTX binding was observed at the elution position of the GroEL–DHFR complex in gel filtration (middle). When proteinase K was added after GroES and ADP, there was no change in the amount of 3H-MTX binding to the DHFR in the chaperonin complex (bottom), indicating the encapsulation of DHFR in the cis chamber. Reprinted from Mayhew et al. (Reference Mayhew, da Silva, Martin, Erdjument-Bromage, Tempst and Hartl1996), by permission from Springer Nature copyright 1996.

The investigators concluded, as did Weissman et al., that GroES binding could displace substrate protein from the binding sites of GroEL, allowing released polypeptide to fold in the cis cavity. The less efficient recovery in ADP/GroES remained unexplained, albeit that a later study showed that ADP/GroES binding produces a slower and presumably less forceful opening of the apical domains as compared to ATP/GroES, with apparently inability to efficiently discharge non-native polypeptide off of the apical binding sites (Motojima et al., Reference Motojima, Chaudhry, Fenton, Farr and Horwich2004; see page 75). Nevertheless, it seemed clear that ADP/GroES binding could release some fraction of bound DHFR into the cis cavity, allowing it to reach native form in this sequestered location.
Both native and non-native forms are released from the cis cavity during a cycling reaction
A question was raised about whether the cis folding chamber in particular releases both native and non-native forms during a cycling reaction. That is, while the earlier studies of Todd et al. (Reference Todd, Viitanen and Lorimer1994) and Weissman et al. (Reference Weissman, Kashi, Fenton and Horwich1994) had shown that non-native forms are released during the cycling reaction, it had not been directly shown that they emerge from the cis folding chamber. To address the question, Burston et al. (Reference Burston, Weissman, Farr, Fenton and Horwich1996) produced a ‘cis-only’ GroEL that binds and releases substrate protein and GroES from only one of the two rings, by forming a mixed GroEL ring complex called MR1 (Fig. 65), with one ring wild-type, able to bind polypeptide and ATP/GroES to form a cis chamber, and the opposite ring a mutant one unable to bind polypeptide or GroES by virtue of a Y203E substitution, but competent to bind and hydrolyze ATP, thus supporting the reaction cycle. The mutant ring also contained a double mutation, G337S/I349E, that had rendered the parental tetradecamer physically separable from wild-type GroEL in anion exchange chromatography (Weissman et al., Reference Weissman, Kashi, Fenton and Horwich1994). After heating a mixture of the parent wild-type GroEL and the so-called 3-7-9 tetradecamers to 42 °C in 5 mM MgATP for 45 min, anion exchange chromatography revealed an intermediate double-ring assembly (confirmed by gel filtration) eluting between the two parents, with equal amounts of the two parental subunits identified by their distinct migration in SDS-PAGE (the mutant migrating more slowly). MR1 was indeed capable of binding rhodanese only in its wild-type ring as shown by hit-and-run photocrosslinking (as in Weissman et al., Reference Weissman, Hohl, Kovalenko, Kashi, Chen, Braig, Saibil, Fenton and Horwich1995). Functional studies with isolated MR1 revealed the same kinetics of refolding of rhodanese as with wild-type GroEL upon adding ATP/GroES to the respective binary complexes. Most significantly, when a substrate protein ‘trap’ molecule (337/349 tetradecamer) was added to the reaction mixture prior to addition of ATP/GroES, it inhibited the recovery of native rhodanese from MR1. For example, with a twofold molar excess of the 337/349 trap, the recovery of rhodanese from the MR1 reaction was reduced to ~20%. This indicated clearly that non-native forms were being released from the cis-only cavity of MR1 during cycling in ATP/GroES. That is, polypeptide is discharged from the cis cavity as governed by the ATP-driven reaction cycle, whether it has reached the native state or not.
Diagram of a mixed-ring complex, MR1, that can only bind substrate polypeptide and GroES on one ring, thus addressing the issue of whether folding-active cis ternary complexes release both folded and non-native protein substrate at each round of the reaction cycle. Mutations at the indicated residues in the mutant ring prevent binding of either substrate polypeptide or GroES. From Burston et al. (Reference Burston, Weissman, Farr, Fenton and Horwich1996).
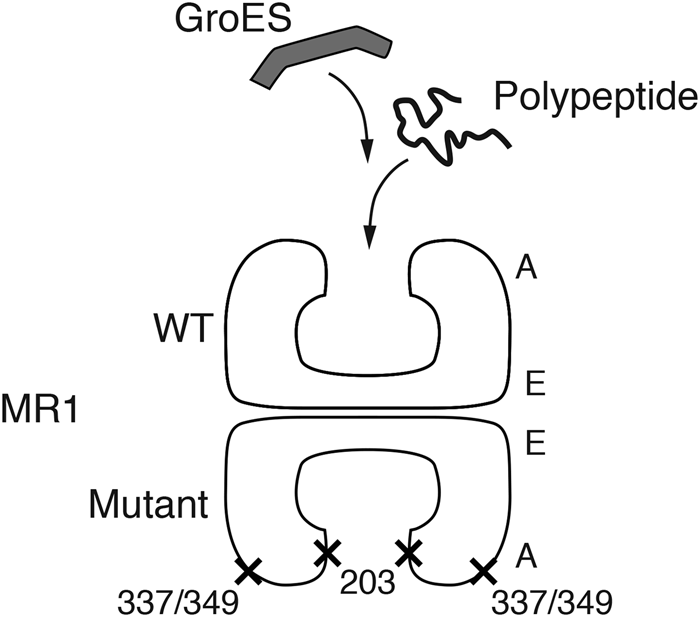
XIX. Crystal structure of GroES
Crystallization and structure determination
In Janurary 1996, Hunt et al. (Reference Hunt, Weaver, Landry, Gierasch and Deisenhofer1996) reported the crystal structure of E. coli GroES at 2.8 Å resolution, and Mande et al. (Reference Mande, Mehra, Bloom and Hol1996) presented the structure of GroES from M. leprae at 3.5 Å. In the former case, orthorhombic P212121 crystals were obtained from a PEG400 mixture, with one GroES heptamer in the asymmetric unit. Two heavy atom derivatives, one with good occupancy but spatially diffuse, the other with poor occupancy, did not produce an interpretable map but provided sufficient information to locate the sevenfold axis, and non-crystallographic symmetry averaging within a real space envelope was employed. The extended phases enabled a segmented polyalanine model to be built for most of the residues outside the GroES mobile loop. The combination of the NCS and polyAla-generated phases produced a connected backbone and, coupled with data from a selenomethionine derivative (aa 86), this allowed the calculation of a map that included side chains. The mobile loop (aa17-32) was resolvable in only one subunit of the heptamer, where it made a crystal packing contact. For this subunit, the entire 97 residue chain could be traced.
In the study of M. leprae GroES, a PEG400 orthorhombic crystal was also obtained (C2221) and a single ‘poor’ heavy atom derivative enabled the construction of a molecular envelope, allowing phase extension/sevenfold NCS averaging. The mobile loop region (17–33) presented discontinuous electron density.
Structural features
The models of GroES revealed a dome-shaped molecule of ~75 Å diameter and ~30 Å height with an inside cavity of ~30 Å diameter and ~20 Å height [see Fig. 66 which is GroES derived from the GroEL/GroES/ADP7 structure (Xu et al., Reference Xu, Horwich and Sigler1997), where all of the mobile loops are resolved while in complex with the GroEL apical domains; the views are side in top panel and from below in bottom panel]. Considering the EM structure of GroEL/GroES presented earlier by Chen et al. (Reference Chen, Roseman, Hunter, Wood, Burston, Ranson, Clarke and Saibil1994), it appeared that the lid-like structure of GroES when bound to GroEL would extend the central cavity of GroEL into the cavity present in GroES. The body of the GroES subunit is composed of a nine-stranded antiparallel β-barrel from which two structures are extended, one a β-hairpin (aa 45–57, including β4 and β5) at the top interior aspect, the collective of which forms a ‘roof’ over the central space (visible in the ribbon side view of Fig. 66), and a second, the mobile loop (aa 17–32, between β2 and β3), previously identified by the NMR study of Landry et al. (Reference Landry, Zeilstra-Ryalls, Fayet, Georgopoulos and Gierasch1993), at the lower outer aspect (Fig. 66 ribbon side view, but recall that this is the position of the mobile loops when they are ordered, in the complex with GroEL). A conclusion that the mobile loops of GroES would be directed downward and outward to form 1:1 contacts with GroEL subunits was supported both by the position of the one ordered loop in the Hunt et al. structure and by the topology of GroES with respect to GroEL in the earlier EM study of GroEL/GroES complexes (in ATP) by Chen et al. (Reference Chen, Roseman, Hunter, Wood, Burston, Ranson, Clarke and Saibil1994). The topology was directly observed (as shown in Fig. 66) in the subsequent crystal structure of GroEL/GroES/ADP7 (Xu et al., Reference Xu, Horwich and Sigler1997).
Architecture of GroES, as taken from the GroEL/GroES/ADP7 crystallographic model of Xu et al. (Reference Xu, Horwich and Sigler1997) (PDB:1AON), enabling resolution of the mobile loops. [See text for description of earlier crystallographic studies of GroES standalone by Hunt et al. (Reference Hunt, Weaver, Landry, Gierasch and Deisenhofer1996) and Mande et al. (Reference Mande, Mehra, Bloom and Hol1996).] Left panels: Ribbon diagrams of GroES, side and underside views, with each subunit colored differently. Side view shows that the mobile loops, when interacting with the GroEL apical domains, are directed downward and outward from the bottom aspect of the GroES subunits. Right: Space-filling models corresponding to the views at the left, with hydrophobic residues colored yellow, polar ones blue. Note that inside of the GroES dome is polar except for the ring of tyrosines 71 at the base of the dome.
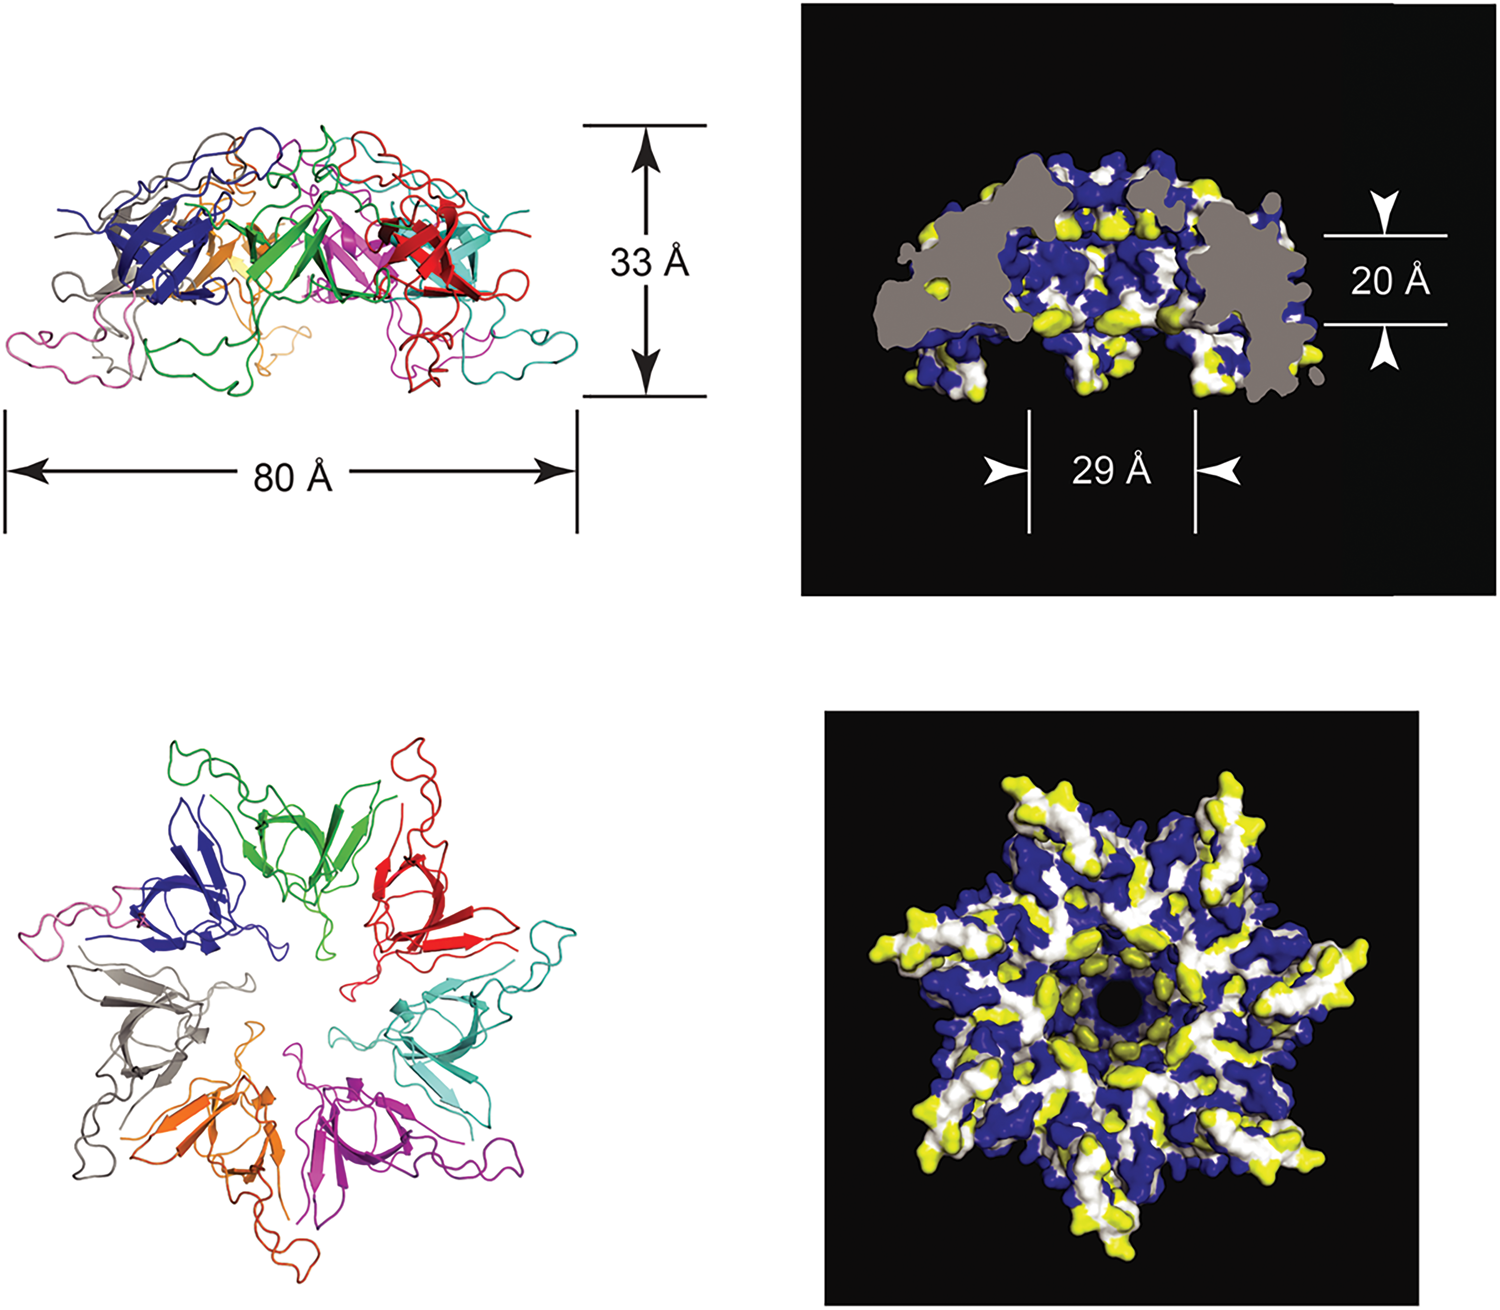
The inter-subunit contacts in GroES, formed between the β-barrel bodies of the GroES subunits, involve a principal interaction between the first β-strand of each subunit and the last β-strand of the adjacent subunit, forming a number of main chain hydrogen bonds (see Fig. 66 bottom panel ribbons for the side-by-side strands; the view is from below looking into the dome; the ring of tyrosines 71 protruding into the cavity at the bottom aspect of the dome is evident).
In addition to the hydrogen bonding between strands, there is also a complementary hydrophobic surface formed at the GroES subunit–subunit interface involving conserved residues on each side of the interface, and near the bottom of the subunits, a number of electrostatics cross the subunit–subunit interface, forming polar contacts. A total of ~630 Å2 was reported to be buried in the interface between a pair of neighboring subunits of E. coli GroES. Despite these contacts, the subunits of E. coli GroES were found to significantly deviate from a perfect sevenfold symmetry. Insofar as the β-barrel bodies of the subunits were superposable, this reflected that the subunit–subunit interface is apparently flexible.
Consistent with the instability of the flexible E. coli GroES interface, below ~1 µM GroES concentration (of total subunits) in vitro, GroES was found only as a monomer (Zondlo et al., Reference Zondlo, Fisher, Lin, Ducote and Eisenstein1995). In urea and thermal denaturation studies, GroES heptamer was shown to reversibly produce unfolded monomers in a single two-state transition (Seale et al., Reference Seale, Gorovits, Ybarra and Horowitz1996; Boudker et al., Reference Boudker, Todd and Freire1997). The GroES monomer appears to exhibit low stability. The question of whether the reversible dissociation of GroES has importance to GroES action in the chaperonin reaction remains open. Perhaps, as commented, it reflects on a need for the plasticity of GroES, at the level of the subunit interfaces, for example, in binding to GroEL/substrate complexes. Concerning the quaternary state favored in vivo, a macromolecular crowding study from Aguilar et al. (Reference Aguilar, Weise, Sparrman, Wolf-Watz and Wittung-Stafshede2011) indicates that, in the presence of a crowding agent (Ficoll 70), there is favoring of heptamer. This appeared to be a function of greater stabilization of component monomers than of the interfaces.
XX. Role of ATP and allostery
Nested cooperativity
Mutant R197A exhibits loss of positive cooperativity at low concentration of ATP and exhibits negative cooperativity in higher concentration – possibility of ‘nested’ cooperativity, positive within a ring and negative between rings
In 1994, Yifrach and Horovitz (Reference Yifrach and Horovitz1994) reported on the cooperativity behavior of a GroEL substitution mutant, R197A. They observed a loss of positive cooperativity when plotting initial rates of ATP turnover at ATP concentrations below 5 µM. Strikingly, they also observed negative cooperativity at ATP concentrations above 5 µM, with rates of turnover diminishing as the concentration was increased (Fig. 67). They concluded that intra-ring positive cooperativity was abolished by this mutation because subunits of one ring already occupied an R state – that is, the GroEL rings in the mutant were T7R7 instead of T7T7. The mutation also affected ring–ring communication such that at the higher ATP concentrations, ATP could bring about changes in the second ring, lowering the overall activity. The presence of GroES relieved the negative cooperativity and partially restored the positive cooperativity (Fig. 67). The investigators suggested that this effect resulted from GroES binding to and stabilizing the TR (T7R7) state, such that ATP binding to the second ring to produce an R state could now be observed. Overall, the investigators concluded that the observations supported a model for GroEL cooperativity that involved two lines of allosteric interaction, one within a ring that gave rise to positive cooperativity and a second between the two rings that was the source of the negative cooperativity. They presented a scheme for these interactions, involving an MWC mode for intra-ring cooperativity and a KNF model for inter-ring changes, and suggested wild-type GroEL would also exhibit ‘nested cooperativity’.Footnote 33
First indication of the presence of negative cooperativity of ATP binding/hydrolysis at GroEL, in the study of a mutant, R197A. Initial velocity of ATP hydrolysis by the mutant as a function of ATP concentration, showing positive cooperativity at low ATP concentration and negative cooperativity, reduced rate of turnover, above ~10 µM ATP. Note that the effect is abolished when GroES is present. Reprinted from Yifrach and Horovitz (Reference Yifrach and Horovitz1994), with permission from Elsevier, copyright 1994.

Nested cooperativity of wild-type GroEL
In 1995, Yifrach and Horovitz (Reference Yifrach and Horovitz1995) demonstrated negative cooperativity in wild-type GroEL. By examining the initial rates of ATP turnover across higher ATP concentrations than previously used (up to 0.8 mM), clear kinetic evidence for negative cooperativity was adduced at ATP concentrations above ~150 µM, produced a curve of ATPase rate versus [ATP] with strong substrate inhibition resembling that of R197A, but shifted to higher ATP concentration (Fig. 68). The investigators could fit a nested cooperativity model (Fig. 69) of MWC transitions within the seven subunits of a GroEL ring (T→R) and KNF transitions between the two rings (TT→TR→RR) to the ATPase data to produce values for the various constants.Footnote 34 It was also possible to estimate that the Hill coefficient for the negative cooperativity between the rings for wild-type GroEL was 0.003; it was 0.07 for the R197A mutant. (Values <1 reflect negative cooperativity, and the higher value for the mutant indicated that its negative cooperativity was reduced.)
Negative cooperativity also observed at wild-type GroEL, giving rise to the proposed model of ‘nested’ cooperativity (see Fig. 69 and text). Initial velocity of ATP hydrolysis by wild-type GroEL as a function of ATP concentration. Note the appearance of negative cooperativity at much higher ATP concentration than with the R197A mutant. Values of the allosteric constants are given. Reprinted with permission from Yifrach and Horovitz (Reference Yifrach and Horovitz1995). Copyright (1995) American Chemical Society.
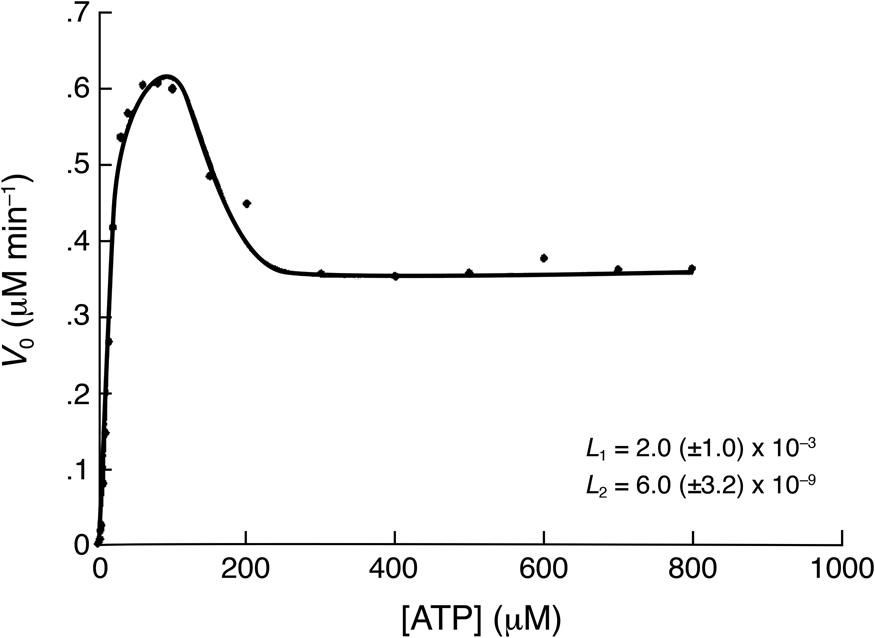
Scheme for nested cooperativity of GroEL in ATP binding/hydrolysis, combining the MWC and KNF models. MWC (concerted) proposed to be operative within a ring, and KNF (sequential) between rings. Adapted with permission from Yifrach and Horovitz (Reference Yifrach and Horovitz1995). Copyright (1995) American Chemical Society.

GroES effects on ATP turnover and production of a conformational change of GroEL
Given the demonstration that ATP binding by GroEL alone led to half-of-sites reactivity, the role of GroES in further modulating the ATPase activity was investigated by Burston et al. (Reference Burston, Ranson and Clarke1995). A hydrolysis reaction by GroEL in the presence of ATP and GroES proceeded in two phases. The first phase, a pre-steady-state phase with a rate constant of 0.13 s−1, corresponded to the turnover of one ring of seven ATPs and was evident before a linear phase with a steady-state rate of 0.042 s−1. These rates were interpreted to indicate that the rate-determining step in the GroES-containing steady-state reaction occurred after ATP hydrolysis on the GroES-bound ring. To rule out the possibility that ATP hydrolysis on one ring was required before GroES association, a rapid mixing fluorescence experiment was carried out with pyrenyl-GroEL at low [ATP], where GroES binding could be followed by an additional increase in fluorescence. In the absence of GroES, the rate of change in fluorescence was 2.8 s−1. In the presence of equimolar GroES complex, two rates of about equal amplitude were observed, 2.8 and 16 s−1. Thus the presence of GroES added an additional phase to the kinetic process that was faster than the rate of ATP hydrolysis, firmly establishing that GroES binding preceded ATP hydrolysis in the overall cycle. Because GroES binding was accompanied by an additional increase in pyrene fluorescence beyond that produced by ATP alone, the investigators concluded that such binding resulted in additional conformational changes in GroEL.
Allosteric effect of substrate binding on ATP turnover
In 1996, Yifrach and Horovitz (Reference Yifrach and Horovitz1996) examined the effects of unfolded substrate protein on the cooperativity of ATP hydrolysis by GroEL. The investigators used reduced calcium-free α-lactalbumin as a stably unfolded substrate protein for the measurement of effects on ATP turnover [see earlier studies of Okazaki et al. (Reference Okazaki, Ikura, Nikkaido and Kuwajima1994) and Hayer-Hartl et al. (Reference Hayer-Hartl, Ewbank, Creighton and Hartl1994)]. Rates of turnover were measured across a range of α-lactalbumin concentrations up to 1000-fold greater than GroEL in the presence of fixed concentrations of ATP. At low ATP concentration (100 µM), where only positive cooperativity would be expected, binding of α-lactalbumin stimulated the hydrolysis rate in a sigmoidal fashion (by up to threefold versus folded α-lactalbumin), with a Hill coefficient of 1.6. This supported earlier observations that non-native protein can stimulate the GroEL ATPase. The sigmoidal behavior supports that different conformations of GroEL have different affinities for non-native protein. This was further supported by the observation at 500 µM ATP concentration (where negative cooperativity for ATP turnover occurs in the absence of substrate protein), that inhibition occurs with higher concentrations of α-lactalbumin (i.e. negative cooperativity is observed). The observations supported the idea from allosteric theory that if one ligand affects the cooperative binding of another ligand, then the converse will also be true, because the same allosteric states are involved via coupled equilibria. Plots of the TT to TR and of the TR to RR transitions (100 and 500 µM ATP, respectively) in relation to α-lactalbumin concentrations and interpretation in respect to the nested cooperativity model led to a conclusion of preferential binding of non-folded substrate protein to T rings. Such binding would act to shift the overall conformational equilibrium toward TT and TR states at the expense of the less substrate binding-active RR state.
CryoEM studies of ATP-directed allosteric switching and movement during the GroEL/GroES reaction cycle
A series of cryoEM studies from Saibil and coworkers provided insights into the ATP binding and hydrolysis-directed allosteric movements in GroEL that direct substrate protein and GroES binding and release. These studies were helped by the crystal structure studies emerging in parallel, which on one hand indicated that GroEL action involved rigid body domain movements (proceeding from GroEL to GroEL/GroES), and on the other provided high-resolution models of the domains that could allow for fitting into EM maps during reconstructions.
In Roseman et al. (Reference Roseman, Chen, White, Braig and Saibil1996), the elevation and major clockwise rotation of the apical domains in ATP/GroES-bound GroEL rings were identified (Fig. 70). It could already be suggested, ahead of the GroEL/GroES crystal structure reported in 1997, that the cavity face of the apical domain in GroEL standalone, known to be involved with substrate protein binding, was being displaced upon GroES binding. The study also reported that the inter-ring connection between K105 and E434, at one of the two sites of inter-ring contact, became unresolved in GroEL/ATP as compared with GroEL/ADP, and it was proposed that the equatorial helix D, extending from the phosphate binding loop in the ATP pocket in the top of the equatorial domain (from T89 down to K105; see Fig. 70 schematic) could be involved with the allosteric transmission of negative cooperativity between rings. It was proposed that the loss of negative charge with hydrolysis/release of the γ-phosphate could affect a helix dipole that coordinates with that of the D helix in the opposing subunit across the ring–ring interface, mediating ATP signaling across the interface.
Top panel: Cryo-EM reconstruction of the GroEL/GroES/ADP complex, with positions of a subunit outlined as it would be positioned in GroEL, GroEL–ATP, or GroEL–GroES–ATP to emphasize the movement of the apical domains in these states. ATP alone produces mostly elevation of the apical domains as shown here, later indicated (Clare et al., Reference Clare, Vasishtan, Stagg, Quispe, Farr, Topf, Horwich and Saibil2012) to be both elevation and counterclockwise twist. ATP/GroES produces the same domed end-state as is produced by ADP/GroES addition, that stable asymmetric state shown by the surface view here, with nucleotide/GroES binding producing a large clockwise rotation of the apical domain that brings it to a point of contact with a downgoing narrow mass from GroES that comprises a mobile loop. Lower panel: Cartoon suggesting the route of transmission of allosteric signals from the equatorial ATP pocket via helix D through the equatorial domain to the ‘left’ site (numbered 1) at the ring–ring interface to homotypically contact a subunit from the opposite ring at the bottom of its helix D, exerting negative cooperativity for ATP binding/turnover between rings. Adapted from Roseman et al. (Reference Roseman, Chen, White, Braig and Saibil1996), with permission from Elsevier, copyright 1996.

In Ranson et al. (Reference Ranson, Farr, Roseman, Gowen, Fenton, Horwich and Saibil2001), the ATP hydrolysis-defective mutant D398A was examined after brief exposure to ATP (250 µM), followed by rapid freezing, to assess the effects of ATP binding (EMDB 1047). Importantly, D398A/GroES cis ternary complexes formed in ATP are productive, able to efficiently refold monomeric GFP or rhodanese in the stable cis cavity, indicating that the ATP-directed movements of D398A lead to productive cis complex formation (in the absence of ATP hydrolysis). Upon exposure to ATP, standalone D398A assumed an asymmetric appearance, with one ring isomorphous to GroEL standalone (see bottom subunit in schematic in Fig. 71) and the other (that binds ATP) exhibiting altered domain orientations that featured a downward rotation of the intermediate domains about the lower hinge (see Fig. 77 for global view of intermediate tilt; and see top two subunits in schematic in Fig. 71, transitioning from T state to R upon ATP binding). The transition upon ATP binding was associated with an obvious loss of the inter-subunit electrostatic contact between E386 at the elbow of the intermediate domain and R197 of the neighboring apical domain. As a result of tilting downward, the region of E386 now came in contact with the top of the equatorial domain of the neighboring subunit, potentially forming a salt bridge with K80 (models in lower panels in Fig. 71). In addition to the observed downward tilt of the intermediate domains, an apical counterclockwise rotation was observed (~25°). This twist was judged to somewhat weaken the substrate contact with the apical domains. Indeed, in a test for weakened affinity, when an SR1/35S-Rubisco binary complex was briefly exposed to ATP (for 4 s) in the presence of a D87K trap version of GroEL, approximately 20% of the bound 35S-Rubisco could be observed to transfer to D87K by gel filtration (versus no transfer with exposure to ADP). If GroES was present prior to the addition of ATP, no transfer to D87K was observed, indicating that GroES ‘caged’ releasing polypeptide before it could reach the bulk solution.
Salt bridge broken and a potential new one formed going from unliganded T state of a GroEL ring to the ATP-bound R state. Schematic illustrations at the top showing two subunits in one ring, unliganded (T) state at the left, which become ATP-bound at right, opposite one contacting subunit from the opposite ring. The electrostatics are colored to indicate charge (red, negative; blue, positive). The intermediate-to-apical contact between E386 (at N-terminus of helix M; see model below) and R197 [near N-terminus of extended apical polypeptide binding segment (199–203)] becomes broken by the downward tilt of the intermediate domains in the ATP-bound R state, and a new electrostatic contact between E386 and the top of the neighboring equatorial domain, e.g. K80, may be formed. From Ranson et al. (Reference Ranson, Farr, Roseman, Gowen, Fenton, Horwich and Saibil2001); EMDB 1047.

Effects of GroES on GroEL cooperativity
In 1997, Inbar and Horovitz (Reference Inbar and Horovitz1997) reported further on cooperativity induced by GroES, focusing the analysis on the range of ATP concentrations where positive cooperativity was observed (below 100 µM) to avoid potential complications from negative cooperativity. Examination of curves of the initial velocity of hydrolysis versus [ATP] at various GroES concentrations showed that the data at low ATP (<20 µM) could not be fit to the Hill equation without unacceptable residuals. It was concluded that this reflected that another ATP-dependent allosteric transition was occurring, TRES→R'RES (Fig. 72). Because this transition was coupled to the TT→TR→RR set, a more complex mathematical treatment was required, extending a partition function previously used for ATP binding alone (Yifrach and Horovitz, Reference Yifrach and Horovitz1995). The initial velocity data could then be fit by the resulting equation and produced values for the allosteric constant for the TRES→R'RES transition (L2′ = 4 × 10⁻⁵) and binding constants for GroES to TR and R'R rings. Comparison of L2′ with L2 (2 × 10⁻⁹), the allosteric constant for the TR→RR transition, showed that GroES binding promotes the T to R transition of the opposite ring, reducing cooperativity in ATP hydrolysis in this ring.Footnote 35
Additional transition of the ring opposite the GroES-bound one from a T to an R’ state is required in order to fit ATP hydrolysis data in the presence of GroES (see text). Reprinted with permission from Inbar and Horovitz (Reference Inbar and Horovitz1997). Copyright (1997) American Chemical Society.

Non-competitive inhibition of ATP turnover by ADP, and commitment of ATP to hydrolysis
In 1998, Kad et al. (Reference Kad, Ranson, Cliff and Clarke1998) reported on alternate cycling of GroEL rings. They employed pyrenated GroEL in stopped-flow kinetic studies where a rise in fluorescence reported on ATP binding (a binding-induced conformational change) and a fall reported on hydrolysis. The presence of ADP substantially inhibited ATP hydrolysis without affecting ATP binding (Fig. 73a). When rate constants for ATP turnover were plotted as a function of [ADP], there was a substantial inhibition appreciable, but it did not vary in respect to [ATP] (Fig. 73b). This indicated a non-competitive mode of inhibition by ADP, in which binding to one GroEL ring could inhibit turnover by the opposite ring. Thus, ADP must dissociate before ATP can hydrolyze, enforcing an alternating behavior of the rings. In further tests, ATP bound to an open ring could be shown to be able to exit, producing a relaxation of the fluorescence in the presence of ATP-hydrolyzing HK/glucose, indicating that it was not committed to GroEL-mediated turnover. In contrast, in the presence of GroES, GroEL/ATP is committed to cis hydrolysis (hydrolyzing ATP in the 50% of rings bound by ATP/GroES). Thus for GroEL alone the progression was proposed: ATP:GroEL→ADP:GroEL→ADP:GroEL:ATP→GroEL:ATP→GroEL:ADP→ATP:GroEL:ADP→(ATP:GroEL)… and for GroEL/GroES, as in vivo, a progression was proposed as GroEL:ATP:GroES→GroEL:ADP:GroES→ATP:GroEL:ADP:GroES→ATP:GroEL:ADP→GroES:ATP:GroEL:ADP (→GroES:ATP:GroEL→GroES:ADP:GroEL→GroES:ADP:GroEL:ATP→ADP:GroEL:ATP:GroES) with conversion of either GroES:ATP:GroEL:ADP or ADP:GroEL:ATP:GroES being the rate-determining step in a cycling reaction. This latter complex has relevance for the rate of cycling of GroEL/GroES/substrate complexes as shown in Grason et al. (Reference Grason, Gresham, Widjaja, Wehri and Lorimer2008a, Reference Grason, Gresham and Lorimer2008b) (see page 85).
(a) Inhibitory effect of ADP (concentration shown next to each plot) on ATP hydrolysis under single turnover conditions (limiting ATP) of standalone GroEL, reported by a reduced rate of decay of fluorescence of pyrenyl GroEL with increasing ADP concentration. (Note that the rise of fluorescence is due to ATP binding, unaffected by the presence of ADP). (b) Rates from upper panel (up to 1000 µM) plotted versus [ADP], at four different concentrations of ATP, to determine K i. Note that the plots are virtually superposable, indicating no influence of ATP concentration on the inhibition of turnover by ADP, suggesting non-competitive inhibition. Inset: K i values plotted versus [ATP] indicate non-competitive inhibition. Adapted from Kad et al. (Reference Kad, Ranson, Cliff and Clarke1998), with permission from Elsevier, copyright 1998.

Transient kinetic analysis of ATP binding by GroEL
In 1998/1999, transient kinetic analyses of ATP binding were carried out by Yifrach and Horovitz (Reference Yifrach and Horovitz1998) and Cliff et al. (Reference Cliff, Kad, Hay, Lund, Webb, Burston and Clarke1999), respectively, arriving at similar results. Both groups employed tryptophan-substituted forms of GroEL to provide fluorescent reports of binding, in the first case F44W, on the stem loop that reaches from one subunit over to the neighbor at the equatorial level, and in the second case Y485W, which lies in the equatorial domain near the binding site for the base of ATP and the ring–ring interface. The first study observed three phases (and the second study four phases) following stopped-flow mixing of ATP across a range of concentrations. In the case of the Yifrach and Horovitz study, a rapid quenching phase of sizable amplitude was observed followed by two slower low amplitude rising phases. The first phase (correspondent to the second of Cliff et al.) showed bi-sigmoidal dependence on ATP concentration (Fig. 74) and could be fit by a scheme with two transitions induced by ATP binding to one or both rings using sequential Hill equations. The first change exhibited a Hill coefficient of 2.85, resembling that from steady-state studies. This suggested that the quenching phase reflected a conformational rearrangement accompanying ATP binding. The rate for this transition was 80 s−1 and the apparent dissociation constant was 113 µM. The Hill coefficient from the second equation was ~7 with a rate constant 207 s−1 and a dissociation constant 671 µM. The rising second phase in the transients was independent of ATP concentration and assigned to ATP hydrolysis, because omission of K+ abolished this phase. The third phase was also concentration independent and assigned to the release of residual contaminants from GroEL.Footnote 36
Rate constants of the fast kinetic phase of fluorescence change upon ATP binding to fluorescent-reporting GroEL F44W as a function of ATP concentration. There is bi-sigmoidal dependence on ATP concentration, reflecting two transitions, which were modeled with sequential Hill equations. The first produced a Hill coefficient (here, for ATP binding) of 2.85, in agreement with steady-state ATP hydrolysis data (see text for additional detail). Reprinted with permission from Yifrach and Horovitz (Reference Yifrach and Horovitz1998). Copyright (1998) American Chemical Society.

Effect of GroEL cooperativity mutants on bacterial growth, susceptibility to phage, and bioluminescence produced from the V. fischeri lux operon
In 2000, Fridmann et al. (Reference Fridmann, Ulitzur and Horovitz2000) reported on the effects of cooperativity mutants in vivo. Several mutants were expressed from an ara promoter on a medium copy plasmid in the background of GroEL deletion, such that the only GroEL in the cell corresponded to the cooperativity mutant form. In a first test, when cells were shifted from 25 to 42 °C, the mutant R197A, with strongly reduced intra-ring cooperativity, was unable to grow. It was noted to accumulate inclusion bodies. It was also resistant to λ phage infection at both 25 and 37 °C, but was sensitive to T4 infection at both temperatures and generated bioluminescence. In contrast, the mutant R13G/A126V, which abolished negative cooperativity, grew normally but was only weakly bioluminescent. The need for specific allosteric properties was thus concluded to depend on the substrate involved.
XXI. Crystal structure of GroEL/GroES/ADP7 and of GroEL/GroES/(ADP–AlF3)7
In August 1997, Xu et al. (Reference Xu, Horwich and Sigler1997) reported a crystal structure of the asymmetric GroEL/GroES/ADP7 complex at ~3.0 Å resolution (PDB:1AON).
Crystallization, structure determination, and refinement
Gel filtration-purified asymmetric complexes formed crystals in PEG3000/sodium glutamate that were microseeded to produce single crystals. These diffracted readily when mounted at room temperature but lost diffraction with usual approaches of propane or liquid nitrogen freezing. Xu systematically tested a large number of conditions for freezing and was able to retain diffraction by swishing loop-captured crystals through an ethylene glycol solution and immediately freezing in a liquid nitrogen stream; the crystals then were able to be preserved by conventional freezing in propane. Crystals were orthorhombic with space group P21212, containing one GroEL/GroES/ADP7 complex in the asymmetric unit. The structure was solved by molecular replacement using unliganded GroEL tetradecamer as the search model. With the sevenfold symmetry axis located nearly parallel to the crystallographic c axis, it was noticed that the vertical dimension of the complex was equal to that of the dimension of c. A cylindrical envelope was constructed of this length, with a radius equal to that of a GroEL ring, and density within the envelope was averaged around the sevenfold axis with phases starting with those from the 4.5 Å molecular replacement and extending to 3.5 Å by 20 cycles of NCS averaging. This produced a map with connected main chain density and outline of the subunits.
To avoid any model bias, random phases were used starting with 12 Å data and with an envelope placed around one wedge of density including a GroES subunit, a contiguous cis GroEL subunit, and a trans GroEL subunit. Phase extension was then carried out to 3.0 Å with cycles of NCS sevenfold averaging and periodic updating of the envelope (using the program RAVE, Kleywegt and Jones (Reference Kleywegt and Jones1999)). This produced a map recognizable as the ‘bullet’ form of the asymmetric GroEL/GroES complex, as observed in EM studies of GroEL/GroES/ADP complexes. Fitting with the models of GroES and domains of GroEL allowed the production of a more accurate envelope, and the phase extension procedure was repeated, producing a map that could be fully traced. Here, as with GroEL standalone, the apical domains presented difficulty, with poor side chain density. As before, relaxing strict sevenfold constraints improved the maps.
Architecture
Space-filling views of the ‘bullet’ complex revealed a GroES heptamer at one end, its seven mobile loops resolved as radial outward and downward extensions contacting subunits of the cis GroEL ring through its apical domains, which had undergone en bloc elevation and twist from the unliganded position to form 1:1 contacts with the loops (Fig. 75). As such, the height of the cis ring had increased from ~70 to ~80 Å. By contrast, the trans ring was essentially isomorphous to a ring of standalone GroEL. Cutaway views revealed a dome-shaped chamber of the cis ring, ~80 Å in maximum diameter and height, its walls composed of the elevated cis ring apical domains that were smoothly contiguous with the cavity of the GroES ‘cap’ that forms the roof. This space was estimated at ~175 000 Å3, able to accommodate an expanded-volume intermediate of ~50–60 kDa.
Architecture of the GroEL/GroES/ADP7 complex. Top panels: Side (left) and end (right) views of the crystallographic model of GroES/GroEL/ADP7 in space-filling representation, with GroES colored gold, the GroES-bound (cis) ring colored green, and the opposite open ring (trans) colored red. The dimensions show the increased height of the cis ring, occurring upon GroES association. The end view shows that the entrance to the central cavity is effectively closed by the GroES dome. Middle panels: Ribbon diagrams of side and end views of the crystallographic model, with each subunit in the upper ring colored differently, the bottom ring colored gold, and GroES colored yellow. Bottom left: Ribbon diagram with the domains of one subunit colored red (apical), green (intermediate), and blue (equatorial). Bottom right: Space-filling model of the complex in a cutaway view to show the central cavity. Hydrophobic residues are colored yellow, polar ones blue. Note the difference between the trans ring, where apical hydrophobic residues that are involved in binding non-native substrate protein are noticeable and the cis ring, where polar, mainly electrostatic, side chains line the cavity. From Xu et al. (Reference Xu, Horwich and Sigler1997); PDB:1AON.

Rigid body movements in the cis ring and apical contacts with the GroES mobile loops
The overall rigid body movements in the GroES-bound cis GroEL ring relative to GroEL standalone involve both the intermediate and apical domains (Fig. 76). Overall, the intermediate domain is rotated 25° downward around the ‘hinge’ at its lower aspect (Pro137/Gly410), bringing its long helix M (aa 386–408) down into the nucleotide pocket in the upper surface of the equatorial domain (Fig. 77). Helix M forms a set of contacts with the equatorial domain and the stem loop (aa 38–50) of the same subunit, but also makes several contacts with helix C in the top surface of the neighboring equatorial domain (Fig. 77 and see Fig. 4b in Xu et al., Reference Xu, Horwich and Sigler1997). The contacts within the subunit effectively ‘lock’ ADP into the cis ring of the (stable) ADP asymmetric complex, such that it can only be released during a further step of the reaction cycle when allosteric signaling from ATP binding in the trans ring produces dissociation of the cis ligands (Rye et al., Reference Rye, Burston, Fenton, Beechem, Xu, Sigler and Horwich1997; see page 81). The apical domain is also rotated around the ‘hinge’ at the top aspect of the intermediate domain (Gly192/Gly375; Figs 75 and 76), producing an overall 60° elevation and 90° clockwise twist. This rigid body movement removes the hydrophobic binding surface of the apical domain from facing the central cavity (Fig. 78), with one part (helix H, L234 and L237, and helix I, V264) forming hydrophobic contacts with the IVL ‘edge’ in the GroES mobile loop and the other part (helix I, L259 and V263, and the underlying segment Y199, Y203, F204) forming one side of an interface between neighboring apical domains.
Schematic diagram of the three domains of a GroEL subunit in an unliganded ring, arrowing the overall movements that occur in reaching the GroES-bound state in the GroEL/GroES/ADP7 complex. The movements are rigid body domain movements occurring about ‘hinges’ at the top (Gly-Gly) and bottom (Pro-Gly) of the intermediate domain (I). Overall, in reaching the GroES-bound state, the intermediate domain has made a downward rotation of ~25° onto the equatorial domain, locking in the nucleotide bound in the pocket at the top aspect, and the apical domain has elevated 60° and made a clockwise turn of 90°. Redrawn from Xu et al. (Reference Xu, Horwich and Sigler1997).

Movement, going from unliganded GroEL to the GroES/ADP7-bound state, of the long intermediate domain α-helix M (aa 388–408) down onto the nucleotide pocket to lock in bound nucleotide. As shown, helix M makes contact with the stem-loop in the same subunit and helix C in the adjacent subunit, effectively closing in the nucleotide and bringing constituent Asp398 into the nucleotide pocket to catalyze hydrolysis (see ADP7(AlF3)7 state in Figs. 80 and 81). Two neighboring subunits are shown from the unliganded model (PDB:1OEL) and GroES/ADP7-liganded model (PDB:1AON), viewed identically (relative to the equatorial domains) from inside the cavity. Redrawn from Xu et al. (Reference Xu, Horwich and Sigler1997).

Displacement of the hydrophobic apical binding surface away from facing the central cavity upon binding ADP/GroES, with the formation of new contacts. As the result of overall 60° elevation and 90° clockwise twist of the apical domains, the hydrophobic surface comes into contact in part with the GroES mobile loop, via hydrophobic side chains of L234, L237, V264, and in part forms an interface with the neighboring apical domain via side chains of V259, V263 as well as Y199, S201, Y203, F204. Views are from the central cavity of pairs of subunits, left, GroEL, right, the elevated and twisted apical domain of the GroES-domed complex, showing two adjacent GroES subunits in cyan extending their mobile loops downward to contact (1:1) part of the mobilized apical binding surface. Cyan side chains (sticks) contact GroES, and yellow side chains (sticks) are buried in the inter-apical interface. Redrawn from Xu et al. (Reference Xu, Horwich and Sigler1997) (PDB:1AON).

Cis cavity – hydrophilic character
The domed cis cavity exhibits an inside surface that is polar in character, predominantly electrostatic (Fig. 75 lower right panel and Fig. 79). Cavity-facing residues include D224, K226, S228, E252, D253, E255, D283, R284, E304, K327, D328, D359, and E363. There is a net-negative charge (189 negatively-charged versus 129 positively-charged side chains), which could act to repel incipiently folding E. coli proteins, a majority of which exhibit pIs below 7. Only three hydrophobic side chains face the cis cavity, L309, F281, and Y360 – mutation of all three simultaneously to electrostatic did not interfere with folding function or ability to rescue groEL-deficient E. coli (Farr et al., Reference Farr, Fenton and Horwich2007). The inner surface of GroES extends smoothly from that of GroEL and is also electrostatic in overall character, but there is a ‘ridge’ of protruding tyrosine side chains (Tyr71) at the lower aspect (Fig. 79).
Electrostatic surface of the cis folding chamber. Cutaway view of the cis cavity in space-filling representation, with exposed side chains colored. Positively charged basics, blue; negatively charged acidics, red; polar side chains, green; hydrophobic side chains, yellow. The collective from one subunit is labeled at right in white lettering (see text). From Farr et al. (Reference Farr, Fenton and Horwich2007), and PDB:1AON.

Cis ring nucleotide pocket and crystal structures of thermosome/ADP–AlF3 and GroEL/GroES/ADP–AlF3
The structure of the ADP asymmetric complex intimated concerning the mechanism of ATP hydrolysis during the GroEL/GroES reaction cycle. With helix M rotated onto the nucleotide pocket (Fig. 77), the side chain of Asp398 entered the pocket, becoming an immediate candidate for acting as the general base to activate a water to attack the γ-phosphate. Indeed, when Asp398 was mutated to alanine, the steady-state rate of ATP turnover by standalone GroEL was reduced to ~2% of wild-type (without effect on ATP binding; see Rye et al., Reference Rye, Burston, Fenton, Beechem, Xu, Sigler and Horwich1997). This afforded the chance to distinguish the roles of ATP binding from hydrolysis in both cis and trans rings of GroEL/GroES complexes (see page 81).
The stereochemistry of an ATP-bound equatorial domain came first from a crystal structure of the archaebacterial (T. acidophilum) thermosome, reported by Ditzel et al. (Reference Ditzel, Löwe, Stock, Stetter, Huber, Huber and Steinbacher1998) (PDB:1A6D). The apparently closed state of the thermosome (supported by later EM studies) was analogous to a GroES-bound GroEL ring, and the behavior of the isomorphous intermediate and equatorial domains of the thermosome was analogous to those domains of a cis GroEL ring. In particular, the intermediate domain rotated down onto the equatorial domain and nucleotide pocket, bringing the long ‘helix M’ equivalent and Asp390 (equivalent to GroEL Asp398) into the nucleotide pocket. When ADP–AlFx was soaked into these crystals (PDB:1A6E), the AlFx moiety was observed (Fig. 80) in the pocket at a position that would correspond to the γ-phosphate, and the oxygen of a water was observed at the apex of the trigonal bipyramid, the water fixed by hydrogen bonds to side chain oxygens of both Asp390 from the intermediate domain and Asp63 from the equatorial domain (Fig. 80a, b). The aluminum lay in-line for the water-mediated attack. Fluorines were stabilized by both the Mg+2 ion and by T96 and T97 OHs from the P-loop sequence GDGTT. Subsequently, in 2003, such a mechanism for GroEL/GroES was indicated by a crystal structure at 2.8 Å of GroEL/GroES/(ADP–AlF3)7 by Chaudhry et al. (Reference Chaudhry, Farr, Todd, Rye, Brunger, Adams, Horwich and Sigler2003) (PDB:1PCQ). The architecture observed for the overall GroEL/GroES/(ADP–AlF3)7 asymmetric complex was isomorphous to that of GroEL/GroES/ADP7, but the arrangement in the cis nucleotide pocket (Fig. 81) was analogous to that observed in the thermosome, albeit the density for the in-line water was much weaker. The conclusion in both cases, however, was that, during the respective reaction cycles, the intermediate domain locks down on the nucleotide pocket and ‘commits’ cis ATP to turnover.
Mechanism of ATP hydrolysis deduced from crystals of the T. acidophilum thermosome soaked with ADP–AlFx. (a) Stereochemistry of the active site. A water molecule hydrogen-bonded to Asp390 carboxylate (from intermediate domain) and Asp63 carboxylate (equatorial) in line for attack on the Al within a trigonal AlF3 molecule at the γ-phosphate position. Fluorines of the AlF3 are bonded to OHs of Thr96 and Thr97 side chains as well as a coordinated Mg+2. (b) Schematic drawing of the active site. (c) Proposed mechanism for ATP hydrolysis, involving activation of the bound water by the two aspartates to catalyze its attack on the γ-phosphate. Adapted from Ditzel et al. (Reference Ditzel, Löwe, Stock, Stetter, Huber, Huber and Steinbacher1998), with permission from Elsevier, copyright 1998, and PDB:1A6D.

Stereochemistry at the nucleotide pocket from the crystal structure of GroES/GroEL/(ADP–AlF3)7 complex, analogous to that from the thermosome (Fig. 80). Inset view shows the similar arrangement of ADP (gray), AlF3 (gold Al with green fluorides), and Mg+2 (red), as well as similar interacting carboxylates, here of intermediate domain D398 and equatorial D52. A second coordinated metal density, below, was shown later to be a K+ ion (Kiser et al., Reference Kiser, Lorimer and Palczewski2009). Taken from Chaudhry et al. (Reference Chaudhry, Farr, Todd, Rye, Brunger, Adams, Horwich and Sigler2003) (PDB:1PCQ).

XXII. Formation of the folding-active GroEL/GroES/ATP cis complex
Locking underside of apical domain to top surface of equatorial domain blocks cis complex formation as well as ATP turnover
In November 1996, Murai et al. (Reference Murai, Makino and Yoshida1996) reported on the effect of blocking apical domain movement by forming an oxidative disulfide crosslink between position 327 at the underside of the apical domain and position 83 in the top of the equatorial domain, effectively ‘locking’ GroEL subunits in the position of apo (unliganded) GroEL (Fig. 82). The earlier cryoEM study of Chen et al. (Reference Chen, Roseman, Hunter, Wood, Burston, Ranson, Clarke and Saibil1994) had observed the substantial elevation of the apical domains in GroES-bound cis rings, and with the ‘locked’ GroEL, the investigators could thus assess the effect of blocking such movement. In unliganded GroEL, the Cα carbons of K327 and D83 lie within 9.2 Å of each other, and cysteine substitution of these residues (in an already cysteine-to-serine-substituted version of GroEL that is fully functional) enabled simple air oxidative crosslinking to occur in vitro. The ‘locked’ complexes could bind ATP (judged by gel filtration and an assay of perchloric acid-extracted complexes), but could not bind a fluorescently-labeled GroES, as determined by gel filtration, supporting that apical movement is required for GroES binding. While able to bind ATP, the locked complex did not exhibit ATP hydrolysis activity, and the authors presciently speculated that hydrolysis might require participation by another domain, shown in 1997 by the structural and functional studies of Xu et al. (Reference Xu, Horwich and Sigler1997) and Rye et al. (Reference Rye, Burston, Fenton, Beechem, Xu, Sigler and Horwich1997), respectively, to be the intermediate domain and Asp398. Thus, the observation of binding but lack of turnover in the Murai et al. study can be interpreted to indicate that hydrolysis of ATP in standalone GroEL requires also the downward rotation of the intermediate domain to deliver Asp398 to the nucleotide pocket. Notably, substrate protein could be bound by the ‘locked’ GroEL, consistent with a binding-proficient apo state, but ATP-directed release did not occur, consistent with the notion that apical movement is required for polypeptide release. All of the observed defects were reversed by DTT reduction of the ‘locked’ state.
‘Locking down’ the apical domain onto the equatorial domain, as carried out by Murai et al. (Reference Murai, Makino and Yoshida1996). Ribbon diagram of a GroEL subunit, showing the close positions of the side chains of equatorial D83 and apical K327, allowing cysteine substitution and oxidative disulfide bond crosslinking. The ‘locked’ complex could bind substrate protein and could bind ATP but not hydrolyze it (the result of the inability of the intermediate to tilt down onto the ATP pocket to catalyze hydrolysis). Similarly, the lockdown of the apical domain prevented movement that enables GroES binding. From PDB: 1OEL.

GroEL mutant C138W is temperature-dependent in folding activity – blocked C138W traps cis ternary complexes of GroEL/GroES/polypeptide, supporting that polypeptide and GroES may be simultaneously bound to the apical domains during cis complex formation
In 1999, Kawata et al. (Reference Kawata, Kawagoe, Hongo, Miyazaki, Higurashi, Mizobata and Nagai1999) reported on a single substitution in the lower aspect of the intermediate domain, C138W. Binary complexes of this mutant with a number of different substrate proteins were incubated with ATP and GroES at 25 °C and failed to produce a native protein (Kawata et al., Reference Kawata, Kawagoe, Hongo, Miyazaki, Higurashi, Mizobata and Nagai1999; Miyazaki et al., Reference Miyazaki, Yoshimi, Furutsu, Hongo, Mizobata, Kanemori and Kawata2002). When analyzed by gel filtration, both non-native protein and GroES were found associated with the mutant GroEL, and ~50% of the bound substrate protein was protected from PK digestion, consistent with the encapsulation of ~50% substrate protein in cis underneath GroES. Remarkably, when the temperature of the stalled mixture was shifted from 25 °C to either 30 or 37 °C, folding productivity was immediately restored. These data suggested that, in the blocked state, the apical domains had undergone sufficient ATP-driven movement to allow the formation of a cis ternary complex, but one in which the substrate protein remained unable to fold because it, most likely, remained bound on the cavity walls [see, e.g. cis ternary SR1/GroES/rhodanese complexes formed in ADP in Weissman et al. (Reference Weissman, Rye, Fenton, Beechem and Horwich1996)]. Here, because the productive nucleotide, ATP, was being supplied, and because the block could be reversed by a temperature shift, this suggested that this intermediate lay on the normal pathway of cis complex formation. The implication was that both GroES and the underlying polypeptide were simultaneously bound on some of the apical domains, since GroES binds 7-valently to all of them. Such an intermediate state would thus serve to prevent any premature loss of polypeptide from the folding chamber once polypeptide is released from the cavity walls.
Kinetic observations of cis complex formation following addition of ATP/GroES to GroEL or GroEL/substrate complex – three phases corresponding to initial apical movement, GroES docking, and subsequent large apical movement releasing substrate into the cis cavity
Reports from Taniguchi et al. (Reference Taniguchi, Yoshimi, Hongo, Mizobata and Kawata2004) and Cliff et al. (Reference Cliff, Limpkin, Cameron, Burston and Clarke2006) monitored the kinetics of cis complex formation by fluorescence changes of tryptophans substituted, respectively, either at GroEL R231 in the apical helix H–I groove, or at Y485 in an equatorial location near the ring–ring interface and nucleotide pocket (recall that GroEL is devoid of tryptophan). Four major phases of fluorescence change were reported (see Fig. 83 for the first three phases). First, there was a rapid enhancement of fluorescence produced by ATP over ~20 ms, termed T→R1, unaffected by the presence of GroES and reported by the tryptophan in either equatorial or apical domain. Then a second phase, R1→R2, was observed, involving fluorescence quenching at both positions, occurring on a timescale of ~200 ms. This transition was likely to be the movement detected by stopped-flow small-angle X-ray scattering by Inobe et al. (Reference Inobe, Arai, Nakao, Ito, Kamagata, Makio, Amemiya, Kihara and Kuwajima2003) and appears to correspond to an initial ATP-directed elevation and counterclockwise twist of the apical domains observed in EM (see Ranson et al., Reference Ranson, Farr, Roseman, Gowen, Fenton, Horwich and Saibil2001; Clare et al., Reference Clare, Vasishtan, Stagg, Quispe, Farr, Topf, Horwich and Saibil2012). While the rate of the transition was unaffected by GroES, its amplitude was affected, and the initial interaction of GroES was placed at R2. The rate of a third phase, R2→R3, was substantially increased by the presence of GroES. This transition, extending out to 1 s, produced quenching at W485 and enhancement at W231, and likely corresponds to the large apical movement (principally clockwise twist in Clare et al., Reference Clare, Vasishtan, Stagg, Quispe, Farr, Topf, Horwich and Saibil2012; see page 78), accompanied by the ejection of polypeptide into the cis cavity. Indeed, in the Cliff et al. study, dansylated RCMLA (reduced and carboxymethylated α-lactalbumin) pre-bound to GroEL exhibited a rate of fluorescence change and an ATP-dependence that corresponded to that of the R2→R3 phase. Overall, this suggests that the R2 state is likely to comprise a GroEL/GroES collision complex in which both substrate protein and GroES simultaneously occupy the apical domains of GroEL, assuring that substrate can become encapsulated prior to its release from the cis cavity wall. Finally, a further slow quench phase beyond R3 likely comprises a further tightening of GroES binding that may enable subsequent ATP hydrolysis to occur. Supporting that these phases are relevant to cis complex formation, both studies observed similar phases when SR1 bearing the respective reporters was examined.Footnote 37, Footnote 38
Three states on the pathway to the production of a cis complex after stopped-flow addition of ATP/GroES to a binary complex of GroEL (in the T state) with unfolded α-lactalbumin. Phases of tryptophan fluorescence change were followed using a Y485W version of GroEL. Only one ring of GroEL is shown. At R1, the apical domains have likely elevated and twisted counterclockwise; upon R2 formation, there is the first interaction of GroES (collision state) with the apical domains. The R2-to-R3 transition involves large apical domain clockwise twist and further elevation with dome formation. Substrate protein is released from the cavity wall into the cis cavity during the R2-to-R3 transition to commence folding. Drawn from data in Cliff et al. (Reference Cliff, Limpkin, Cameron, Burston and Clarke2006).

Bound substrate protein comprises a ‘load’ on the apical domains as judged by FRET monitoring of apical movement: ATP/GroES-driven apical movement occurring in ~1 s is associated with release from the cavity wall, whereas failure of release by ADP/GroES is associated with slow apical movement
In 2004, Motojima et al. (Reference Motojima, Chaudhry, Fenton, Farr and Horwich2004) reported ensemble FRET studies monitoring apical domain movements during cis complex formation in real time following the addition of nucleotide and GroES. A fluorophore pair, donor fluorescein and acceptor TMR, was placed on two cysteines substituted into a cysteine-to-alanine-substituted GroEL (Fig. 84, schematics at left). One cysteine was placed in the stable equatorial ‘base’ (aa 527, in the proximal C-terminal tail at the cavity wall) and the other placed in the face of the mobile apical domain (aa 242, adjoining helix H).Footnote 39 From crystallographic models, a distance change between these cysteines of 52 to 82 Å occurs in proceeding from apo GroEL to the endstate of a cis GroES-bound ring upon apical elevation and twisting. Notably, the same end-state cis ring is reached in GroEL/GroES/(ADP–AlF3)7 (PDB:1PCQ; Chaudhry et al., Reference Chaudhry, Farr, Todd, Rye, Brunger, Adams, Horwich and Sigler2003) and in GroEL/GroES/ADP7 (PDB:1AON; Xu et al., Reference Xu, Horwich and Sigler1997). These crystals, however, were produced in the absence of substrate protein. Correspondingly, in the absence of substrate protein, GroEL or SR1 underwent a full extent of donor dequenching in ~1 s upon addition of either GroES/ATP or GroES/ADP.
Time-dependent FRET analysis of apical domain movement upon nucleotide and GroES binding to GroEL reveals that, in the presence of substrate protein, there is a slowing of apical movement, with substrate protein effectively acting as a ‘load’ on the system. Left: Schematic diagrams of one subunit of GroEL in the unliganded (upper) and ADP/GroES-liganded (lower) states. Positions of Cys-substituted/fluorophore-labeled amino acid residues are shown, along with the distances between them. Right: Time-dependent FRET signal on adding nucleotide and GroES to GroEL–rhodanese (top) or SR1–rhodanese complexes (bottom). Gray traces acquired in the absence of substrate (GroEL alone) and black traces starting with binary complexes (denoted at left). Left: Experiments carried out with ATP. Right: Experiments carried out with ADP. AlFx complex was added at the indicated times to GroEL/substrate/ADP complexes (right) to trigger ATP-like movement. In all cases, rate constants for the principal kinetic phases of the substrate-bound reactions are shown. From Horwich and Fenton (Reference Horwich and Fenton2009); adapted from Motojima et al. (Reference Motojima, Chaudhry, Fenton, Farr and Horwich2004); copyright 2004, National Academy of Sciences, USA.

Starting with binary complexes of GroEL with the substrates rhodanese or MDH, movement of the apical domains of GroEL upon addition of GroES/ATP was almost as rapid as without substrate (Fig. 84 left panels of time-dependent FRET, compare black with gray). However, the rate of movement in GroES/ADP was about a twentieth as rapid (Fig. 84 right panels, compare black with gray). Not only was movement with GroES/ADP greatly slowed, but when the starting binary complex was with SR1, the rate was slowed in ADP/GroES by several orders of magnitude relative to ATP/GroES, and only partial donor dequenching occurred, reflecting apparent arrest of the excursion. Remarkably, this arrest of dequenching could be reversed by adding aluminum fluoride complex, in effect supplying the γ-phosphate of ATP to reinitiate what now became a rapid apical movement as a distinct step (Fig. 84, right-hand panels). This was associated with the release of rhodanese into the cis cavity and production of the native state (Chaudhry et al., Reference Chaudhry, Farr, Todd, Rye, Brunger, Adams, Horwich and Sigler2003; see Fig. 85).
Recovery of rhodanese activity is triggered by adding AlFx (effectively, the γ phosphate) to a stable SR1/GroES/ADP complex containing non-native rhodanese bound on its cavity wall. (Note that kinetics of refolding upon addition of AlFx resemble those of GroEL/GroES/ATP or SR1/GroES/ATP.) From Chaudhry et al. (Reference Chaudhry, Farr, Todd, Rye, Brunger, Adams, Horwich and Sigler2003).

Thus, the physiologic nucleotide, ATP, in cooperation with GroES, promotes a more rapid apical movement in the presence of the substrate protein ‘load’ than ADP/GroES, with ATP/GroES enabling substrate protein release. Release is either an effect of the rapid apical movement itself or an effect of the force associated with that movement. It might also be a function of extent of apical elevation and twist as achieved in ATP/GroES or ADP–AlFx/GroES versus ADP/GroES, with polypeptide complexes formed in ADP/GroES potentially not fully removing the hydrophobic binding surface from facing the cavity. While the extent of donor dequenching is the same when starting with GroEL/substrate binary complexes as with GroEL alone, dequenching is not completed when starting with SR1/substrate complexes, suggesting that, at least in that case, the apical domains have not fully rotated. In the case of GroEL/substrate, initial cryoEM studies at low resolution suggested the possibility that the same cis end-state of GroEL complexes can be reached in ADP/GroES as in ATP/GroES (Saibil, unpublished), but a higher resolution study is needed. In sum, the success of ATP/GroES in releasing the substrate from the cavity wall relative to ADP/GroES could be a function of speed, force, and complete displacement of the hydrophobic surface.
Production of a folding-active cis complex in two steps: addition of ADP/GroES followed by AlFx, and energetics of cis complex formation
In 2003, Chaudhry et al. (Reference Chaudhry, Farr, Todd, Rye, Brunger, Adams, Horwich and Sigler2003) reported on a further experiment of SR1-mediated refolding of rhodanese, involving two steps of addition to SR1/rhodanese binary complexes (Fig. 85). First, ADP/GroES was added. As shown previously, this produced no recovery of enzymatically active native rhodanese, correlating with the retention in anisotropy studies of rhodanese on the SR1 cavity wall. In a second step, an AlFx complex was added. This produced immediate development of rhodanese enzymatic activity, with kinetics exactly resembling that of the addition of ATP/GroES to SR1/rhodanese, associated with an immediate drop of fluorescence anisotropy of rhodanese, also resembling that occurring on the addition of ATP/GroES. This second step, effectively adding the γ-phosphate of ATP to the inactive GroEL/GroES/ADP–rhodanese complex, released rhodanese into the cis cavity where it reached native form. The cis complex that formed upon the incorporation of the metal complex at the position of the γ-phosphate (observed in the crystal structure, PDB:1PCQ) was relatively stable. It exhibited a stability to dissociation by 0.35 M GuHCl that was matched only by a similarly stable ATP/GroES-bound form of hydrolysis-defective SR1, SR-D398A. Thus, thermodynamic stability likely weighs into the production of the release/folding-productive cis complex.
The ability to isolate a distinct, albeit not necessarily physiologic, intermediate state along the pathway to cis complex formation, SR1/GroES/ADP7, also allowed an estimate of the energetic contribution of the γ-phosphate moiety of ATP, effectively added as AlFx, to the energetics of cis complex formation. The energetics were calculated from measured affinities of: SR1 for ADP; SR1/ADP7 for GroES; and SR1/GroES/ADP7 for AlFx, measured, respectively, by ITC (exothermic reaction), Hummel–Dreyer-type analysis (SR1 applied to a column equilibrated in 35S-met GroES/5 mM ADP), and an AlFx/7BeFx competitive binding assay (using spin column separation of complexes). This allowed the calculation of free energy changes at the successive steps of binding (Fig. 86), amounting to −43 kcal mole−1 of SR1 rings for ADP binding, −9 kcal mole−1 of rings for GroES binding, and −46 kcal mole−1 of rings for AlFx binding. Thus, the free energy of stabilization of the cis complex by AlFx binding is considerable, much greater than differences typically observed for transitions of unfolded state-to-native state.Footnote 40
Estimated free energy changes during cis complex formation at SR1 by the sequential addition of seven ADPs, GroES, then AlFx, calculated from measured affinities of each interaction (see text). From Chaudhry et al. (Reference Chaudhry, Farr, Todd, Rye, Brunger, Adams, Horwich and Sigler2003).

Valency of ATP and of GroES mobile loops for triggering productive cis complex formation
Whether full occupancy of a ring with ATP and binding by all seven GroES mobile loops is needed to produce a cis complex able to release and fold polypeptide has been investigated by two studies. Chapman et al. (Reference Chapman, Farr, Fenton and Horwich2008), employing a strategy of Bishop et al. (Reference Bishop, Ubersax, Petsch, Matheos, Gray, Blethrow, Shimizu, Tsien, Schultz, Rose, Wood, Morgan and Shokat2000) in kinase studies, identified a pyrazolol pyrimidine compound that selectively bound a mutant GroEL subunit whose ATP pocket at the position of the base bore a shortened side chain, I493C. The compound competitively inhibited ATP binding by I493C GroEL but did not interfere with ATP binding/turnover by wild-type GroEL. Thus, mixed-ring complexes containing various ratios of I493C and wild-type subunits, as well as several covalent assemblies with varying arrangements of the two subunit types, were produced in E. coli, purified, and tested for the ability to refold rhodanese in the presence of ATP and GroES with or without compound. The presence of four or more wild-type subunits (in the presence of compound) was required to produce folding of rhodanese. Thus, binding of four ATPs seems to provide the minimal energy to move all of the apical domains in a coordinated fashion to produce a folding-active cis complex (see Ma and Karplus, Reference Ma and Karplus1998).
A study of Nojima et al. (Reference Nojima, Murayama, Yoshida and Motojima2008) examined the GroES requirement in cis complex formation from the standpoint of binding-proficient versus binding-defective subunits of GroES, producing sevenfold tandemized GroES at the coding sequence level. The ability of combinations and permutations of wild-type and mobile loop-substituted (IVL-to-SSS) binding-defective GroES subunits to bind GroEL in the presence of substrate protein and ATP was tested. Here, it was observed that four or five wild-type GroES subunits were required for efficient complex formation. The point made by Nojima et al., as made by others in the preceding mutant and kinetics studies, was that if both substrate binding and GroES binding require four or more wild-type subunits, then at least one or two of the same GroEL subunits that bind protein must also be able, at the same time, to recruit the association of GroES. This would suggest that the hydrophobic surface of the apical domains could simultaneously be occupied with bound substrate protein and a GroES mobile loop. Such simultaneous binding by a mobile loop peptide and a rhodanese peptide to a miniapical domain was observed in a fluorescence study (Ashcroft et al., Reference Ashcroft, Brinker, Coyle, Weber, Kaiser, Moroder, Parsons, Jager, Hartl, Hayer-Hartl and Radford2002).Footnote 41, Footnote 42
Release of substrate from GroEL by ATP is a concerted step
Release of substrate protein from GroEL by ATP was shown to occur in a manner that is concerted by Kipnis et al. (Reference Kipnis, Papo, Haran and Horovitz2007) and Papo et al. (Reference Papo, Kipnis, Haran and Horovitz2008). Both studies produced chimeric substrate proteins that joined two different proteins in tandem via a linker sequence at the coding sequence level. The two protein moieties were thus able to report on whether release and folding to their respective native forms was occurring simultaneously or sequentially after addition of ATP to a GroEL binary complex. The chimeric proteins were studied both at wild-type GroEL and at a cooperativity mutant, D155A, that had been previously shown to abolish concerted T-to-R transition of subunits within a ring, resulting in a sequential transition, with one set of adjoining subunits in a ring converting ahead of the others (Danziger et al., Reference Danziger, Rivenzon-Segal, Wolf and Horovitz2003). This altered behavior was evident at low ATP concentration, where the distinct states of subunits remaining in the T state (with high affinity for polypepeptide and low affinity for ATP) were directly observable in cryoEM. In Papo et al., a CFP–YFP fusion was examined, enabling the release and refolding of the individual moieties in varying concentrations of ATP to be monitored by the acquisition of the individual fluorescence signals and with refolding of both accompanied by a FRET signal. Concerted release and folding was observed to be favored by wild-type GroEL with its concerted allosteric switch, as compared with the D155A mutant with its sequential allosteric transition. Addition of a high concentration of ATP favored concerted release/folding by both wild-type and D155A, and addition of ATP/GroES produced simultaneous cis folding of both molecules. The latter observation involves cis ternary complex formation and further supports that GroES binding enforces a concerted discharge of substrate protein from all of the apical domains at once.Footnote 43
Trajectory of ATP binding-directed apical domain movement studied by cryoEM analysis of ATP hydrolysis-defective D398A GroEL in the presence of ATP
In 2012, Clare et al. (Reference Clare, Vasishtan, Stagg, Quispe, Farr, Topf, Horwich and Saibil2012) reported cryoEM resolution of multiple structural states obtained when hydrolysis-defective D398A was incubated for a few seconds in ATP and frozen. Automated data collection allowed a large number of particles to be analyzed, and multivariate statistical analysis allowed distinction of conformational changes from orientational variation. Three states were distinguished at ~9 Å resolution that contained ATP in one ring (EMDB 1998, 1999, 2000).Footnote 44
Starting with an unoccupied T state ring, the three ATP-bound R states seemed to fit into a trajectory of rigid body conformational change (see Fig. 87), termed
 $${\rm T}\to {\rm Rs}1\to {\rm Rs}2\to {\rm Rs}\hbox{-}{\rm open}\to {\rm R}\hbox{-}{\rm ES}$$
Space-filling models of the structural transitions of a GroEL ring during cis complex formation. A trajectory was derived from distinct cryoEM reconstructions obtained from incubation of D398A hydrolysis-defective mutant of GroEL challenged with ATP for ~3 s prior to freezing. Note that the Rs2 state that lies between Rs1 and Rs-open is not shown, but it involves a small apical elevation from the Rs1 state (see text). End views (upper row) and cutaway side views (lower row), each showing what were aligned as four successive states, starting with unliganded GroEL (apo). Note that the end view of R-ES (fit with the crystallographic model of GroEL/GroES) does not show the GroES density to allow the comparison of the cis ring in this state with the others. Schematic docking of GroES to Rs-open, as illustrated in the lower image of Rs-open, is hypothetical but shows that the apical binding sites are positioned in Rs-open to be directly accessible to contact with the GroES mobile loops in this state. Polypeptide binding surfaces of helices H and I are colored in red and orange throughout, respectively. The potential ‘landing’ sites of GroES mobile loops on the apical domains of the Rs-open state are depicted by the dashed black circle. From Clare et al. (Reference Clare, Vasishtan, Stagg, Quispe, Farr, Topf, Horwich and Saibil2012). Rs1, EMDB 1998; Rs2, EMDB 1999; Rs-open, EMDB 2000.

First, a large en bloc 35° sideways tilting rotation of the intermediate and apical domains occurs about the lower ‘hinge’ of the intermediate domain, forming Rs1. This brings helix M (and residue 398) into the equatorial nucleotide pocket. Next, an elevation of the apical domains occurs about the upper ‘hinge’ of the intermediate domain to form Rs2. After that, the apical domains move radially outward from each other and further elevate to produce Rs-open. Inspection of the Rs-open state suggested that the overall counterclockwise and elevated position of the apical domains might permit the initial association of downwardly-projecting GroES mobile loops, via their IVL ‘edge’, with helices H and I of the apical domains. While potentially accessible to the mobile loops of GroES, in the Rs-open state, the H and I helices are still facing the central cavity, indicating that they could maintain binding of the non-native substrate protein. Thus, a ternary complex of GroEL/polypeptide/GroES could be accommodated, as had been suggested by the preceding biochemical observations (see above). Notably, such a ternary arrangement, with GroES mobile loops ‘landing’ on the apical domains, would already serve to ‘cage’ the bound polypeptide, ensuring encapsulation. Finally, subsequent to the initial putative association of GroES with Rs-open, the apical domains would undergo a 120° clockwise rotation and further elevation, to produce the crystallographically resolved cis complex, R-ES (Xu et al., Reference Xu, Horwich and Sigler1997; Chaudhry et al., Reference Chaudhry, Farr, Todd, Rye, Brunger, Adams, Horwich and Sigler2003).
Considering the observed movements, it is clear that the inter-subunit salt bridges formed between the apical domains (197/386 and 255/207; see Fig. 55) are broken by the ATP-driven movements, particularly considering that the apical domains are separated from each other in Rs-open (compare Figs 55 and 87). Saibil has proposed that, in reaching the Rs-open state, a ‘click-stop’ mechanism may be involved that allows the formation of transient new salt bridges (e.g. E255-K245), thus allowing the population of the Rs1 and Rs2 states (see Clare et al., Reference Clare, Vasishtan, Stagg, Quispe, Farr, Topf, Horwich and Saibil2012). The equatorial ring–ring contacts were also inspected in the various ATP-bound states, and here there were changes at the ‘left’ site (at inter-ring end of helix D), vertical lengthening, by the point of forming Rs1.
In sum, the study suggested a trajectory of cis complex formation that agreed with the kinetic studies. It remains, however, to resolve these states in the presence of bound polypeptide, in particular both to verify the state of initial GroES contact and to resolve the exact topological arrangement at that point and immediately beyond.
CryoEM analysis of Rubisco in an encapsulating GroEL/GroES/ATP complex reveals contact of the substrate protein with apical and equatorial domains
In 2013, Chen et al. (Reference Chen, Madan, Weaver, Lin, Schröder, Chiu and Rye2013) reported a cryoEM structure of a substrate complex with a chemically modified GroEL that had been observed in functional studies to stall during cis ternary complex formation (EMDB:2327; see earlier Footnote 37). In particular, Madan et al. (Reference Madan, Lin and Rye2008) had reported on pyrene labeling of a Cys43-substituted GroEL (aa 43 is positioned at the tip of the equatorial stem-loop structure that reaches over to the neighboring subunit, lying at the equatorial wall of the central cavity, see Fig. 53). The pyrene maleimide-coupled GroEL was observed to be blocked in the presence of ATP and GroES between the R2 and R3 states of cis complex formation (see Fig. 83), i.e. between the steps of putative collision of GroES with the ATP-elevated, substrate protein-occupied apical domains of GroEL and the subsequent full clockwise twisting of the apical domains that releases polypeptide into the cis chamber.
In the 2013 cryoEM study, a pyrene-modified Cys43 version of the ATP hydrolysis-defective D398A GroEL was complexed with Rubisco (under chloride-free, non-permissive, conditions) and then challenged with ATP and GroES for 10 s, then ultrafiltered (100 kDa cutoff) at 4 °C for 6 min and directly applied to grids. In a non-symmetrized reconstruction of asymmetric complexes, there was a position in the cis ring where sevenfold symmetry was broken by a gap between two apical domains. At the position of these two subunits, density for encapsulated non-native Rubisco was observed in the cis cavity, contiguous with the apical domain underlying segments (aa199–203), and in the equatorial region, contiguous with the equatorial stem-loop segments bearing the pyrenes. Variance measurements also suggested that contacts were formed with the corresponding C-terminal tails (which continue into the cavity from the four-stranded β-sheet).
To assess the degree to which the contacts had been dependent on the pyrene labeling, a non-substituted complex was formed and analyzed and, once again, in the absence of symmetrization, similar densities were seen. At the level of the apical domains of the two complexes, a degree of rotational difference was observed, suggesting that, as indicated by the biochemical studies, the pyrene complexes might be closer to an R2 state and the non-substituted complexes might lie at R3. Unfortunately, no landmarks of Rubisco could be identified in the analysis of the density in the cavity, so the nature and specificity of the visualized contacts relative to Rubisco remain unknown. Also unclear is whether the time (10 s) used to form the pyrene complexes allowed them to advance toward R3.
XXIII. A model of forced unfolding associated with cis complex formation
Tritium exchange experiment
In 1999, Shtilerman et al. (Reference Shtilerman, Lorimer and Englander1999) reported a tritium/hydrogen exchange experiment that suggested that cis complex formation could be associated with a forceful unfolding action exerted on substrate polypeptide. They tritiated unfolded Rubisco by incubation in 5 M urea/10 mM HCl/1 mM DTT/tritiated water, then diluted it 20-fold into a chloride-free buffer at pH 8 to produce a metastable intermediate of Rubisco (that remains soluble, cannot spontaneously reach the native form, and can be bound by GroEL). This species was rapidly gel filtered to remove solvent tritium, followed by timed hydrogen exchange carried out in the chloride-free buffer. Twelve amide tritons per Rubisco molecule were calculated to remain protected for a half hour or longer. Hydrogen-exchanged Rubisco could be added to GroEL to form a binary complex without loss of the observed level of residual tritium protection. The investigators reported that addition of GroEL/GroES/ATP at 10 min into the Rubisco tritium–hydrogen exchange reaction produced a rapid drop of protection from the ~12 tritons to two protected tritons per Rubisco. This occurred within 5 s of addition (as judged by postmixing addition of EDTA at 5 s followed by measurement of the tritons remaining). This seemed likely to correspond to the time of cis complex formation and was dependent upon both ATP and GroES being added. The same results were obtained if ATP/GroES was added to a pre-formed binary complex of GroEL and 12 triton-containing Rubisco. It was also observed following AMP-PNP/GroES addition. The drops in protection were noted to correspond to earlier-reported drops of tryptophan fluorescence of Rubisco (~1 s) observed upon addition of either ATP/GroES or AMP-PNP/GroES to GroEL/Rubisco complexes (Rye et al., Reference Rye, Burston, Fenton, Beechem, Xu, Sigler and Horwich1997; see page 81). (This fall in Trp fluorescence was followed by a slow rise in fluorescence in folding-productive ATP/GroES, but no rise occurred in non-productive AMP-PNP/GroES.) In contrast with the foregoing results, ADP/GroES did not produce a loss of the protected tritons. Finally, when the tritiated metastable intermediate was added in molar excess over GroEL/GroES in ATP, there was progressive loss of tritons, corresponding to multiple turnovers of the chaperonin system.
The investigators suggested that the elevation and twisting movements of the apical domains of GroEL during ATP/GroES binding, which lengthens the distance between the apical polypeptide binding surfaces, could exert a force on the non-native polypeptide, effectively stretching it and potentially disrupting the residual secondary structure, prior to release into the cis cavity. This would amount to a direct translation of the energy of ATP/GroES binding to the forceful unfolding of a substrate protein.
Exchange study of MDH and further exchange study of Rubisco
MDH
The degree of protection of the proposed ‘core’ of Rubisco amide protons, retained even after more than a half hour of exchange of the binary complex, did not correspond to the exchange behavior of other protein substrates studied while in complex with GroEL, which exhibited no substantial exchange protection (protection factors <100). The analogous experiment with MDH (Chen et al., Reference Chen, Walter, Horwich and Smith2001) did not produce major deprotection: In particular, when GroEL/MDH binary complex was pulsed with D2O for 1 s, there were 45 protons protected from exchange, while 247 deuterons were incorporated. When the binary complex was first challenged with ATP/GroES for 1 s and then pulsed with D2O for 1 s, there were now 32 protons protected. The loss of the 10 protons was analyzed at the peptide level and found to be distributed across the protein. Thus, on one hand, major deprotection did NOT occur with the addition of ATP/GroES, and on the other, the small amount of deprotection observed did not map to a ‘core’ structure.
Rubisco
An effort to further study/localize protected tritons in Rubisco was undertaken by Park et al. (Reference Park, Fenton and Horwich2005) but resulted in the inability, in the first instance, to observe any significant protection of tritiated Rubisco, standalone, from hydrogen exchange. The protocol of Shtilerman et al. (Reference Shtilerman, Lorimer and Englander1999) was employed for tritium labeling of Rubisco (carried out under direct supervision by Englander). Tritiated water was used at a specific activity 10-fold greater than in the Shtilerman et al. study to increase sensitivity at the hydrogen exchange steps. Yet when the hydrogen exchange was carried out on tritiated Rubisco in four separate experiments, only a single triton was found to be protected at 20 min.
Consultation with Lorimer indicated that the original exchange experiments had been conducted with a Rubisco containing a 24-residue segment from β-galactosidase at the N-terminus, so this might have contributed to the different outcome, because the first three tests by Park et al. were conducted with unfused Rubisco. A fourth test was carried out with the original fused Rubisco preparation taken from Lorimer's freezer, now containing a mixture of five and seven amino acid β-galactosidase segments at the N-terminus, apparently cleavage products produced during storage. Here also, the protein exhibited no significant protection at 20 min.
FRET study of Rubisco
Further fluorescence experiments with Rubisco have also not been consistent with the Shtilerman et al. study. Lin and Rye (Reference Lin and Rye2004) employed FRET between fluorophores placed in the N-terminal and C-terminal regions of Rubisco, observing expansion of the distance between fluorophores (loss of FRET) upon binding of a monomeric metastable intermediate of the labeled Rubisco to apo GroEL, an event of ‘passive unfolding’ (see page 96). Upon addition of ATP/GroES, there was immediate compaction of Rubisco (an increase of FRET), rather than evidence of any associated long-range unfolding. Subsequent studies of Lin et al. (Reference Lin, Madan and Rye2008, Reference Lin, Puchalla, Shoup and Rye2013) investigated ATP/GroES-addition to asymmetric GroEL/GroES/ADP complexes containing fluorophore-labeled Rubisco in the open trans ring. These complexes exhibited a less expanded state of bound Rubisco than at apo GroEL. In the case of trans ring-localized Rubisco, ATP/GroES addition produced a rapid drop of FRET during the first ~200 ms following addition, followed by a slower rise of FRET over the next 3 s. The drop in FRET mirrors the R1→R2 phase of fluorescence changes of GroEL itself following ATP/GroES binding, as described by Taniguchi et al. (Reference Taniguchi, Yoshimi, Hongo, Mizobata and Kawata2004) and Cliff et al. (Reference Cliff, Limpkin, Cameron, Burston and Clarke2006), a phase that is NOT GroES-affected. This FRET drop could comprise an unfolding/stretching associated with the ATP-directed initial elevation and counterclockwise twist of the apical domains prior to GroES docking. The subsequent rise in FRET likely corresponds to the compaction of Rubisco as observed in the earlier Lin and Rye (Reference Lin and Rye2004) study, occurring following GroES binding. Thus, the loss of FRET observed here during what is an ATP-governed phase does NOT correspond to the observations of Shtilerman et al., where tritium exchange required BOTH ATP and GroES. In fact, the addition of ATP alone produced the same drop in FRET (Lin et al., Reference Lin, Madan and Rye2008).
The question remains as to whether the ATP-mediated FRET change reflects a significant conformational adjustment of Rubisco, required for its subsequent productive folding in the cis cavity. This remains poorly resolved. Lin et al. (Reference Lin, Madan and Rye2008) sought to address the question with an experiment correlating a period of Rubisco binding to SR1 (passive unfolding in association with binding to an open ring) with productivity upon addition of ATP/GroES, but this seems to be too distant an extrapolation. A test by Sharma et al. (Reference Sharma, Chakraborty, Müller, Astola, Tang, Lamb, Hayer-Hartl and Hartl2008), analyzing intramolecular FRET of double-mutant maltose-binding protein (DM-MBP), also at SR1, observed that a similar rapid ATP-mediated drop of FRET did NOT occur when ADP–AlFx/GroES was added, yet such complexes were equally productive of the native state.
XXIV. Action of ATP binding and hydrolysis in cis and trans during the GroEL reaction cycle
In 1997, Rye et al. (Reference Rye, Burston, Fenton, Beechem, Xu, Sigler and Horwich1997) reported on the actions of ATP binding and ATP hydrolysis in cis and trans rings of GroEL/GroES/substrate protein complexes. They availed of the crystallographic information from the GroEL/GroES/ADP7 model that D398 from the intermediate domain had swung into the nucleotide pocket, compared with unliganded GroEL. In the asymmetric (ADP) complex, the D398 side chain carboxylate coordinates the Mg+2 ion along with D87, and the Mg+2 in turn coordinates β phosphate oxygens. When D398 was altered to alanine, the substitution-bearing tetradecamer complex could bind ATP with normal affinity but hydrolyzed it at a rate ~2% that of wild-type GroEL.
ATP binding in cis directs GroEL/GroES complex formation and triggers polypeptide release and folding
The ability to fold substrate protein upon ATP/GroES binding could thus be tested using D398A, where there would be an absence of ATP hydrolysis. An SR1 derivative SR1-D398A (SR398) was produced, which would be obligate for cis complex formation in the presence of ATP and GroES. First, the complex was demonstrated to be unable to turn over ATP in the presence of GroES (Fig. 88a, single turnover ATP hydrolysis assay). Next, SR398/Rubisco binary complexes were incubated with ATP and GroES. Despite the absence of ATP hydrolysis, Rubisco underwent the same tryptophan anisotropy changes, a rapid drop followed by a slow rise, that occurred when it was refolding inside of a complex known to be productive, SR1/GroES/ATP (Fig. 88b; while not shown in the figure, note that no anisotropy change occurred at either SR1 or SR398 in the presence of ADP/GroES). In the case of the SR1 reaction, the refolding of Rubisco monomer was confirmed by subsequent incubation at 4 °C, which allowed the release of GroES and refolded Rubisco and thus enabled Rubisco to homodimerize and exhibit enzyme activity. In the case of SR398-mediated refolding in the SR398/GroES/ATP complex, the refolded Rubisco remained ‘stuck’ in the cis cavity of a very stable complex, resistant to 4 °C incubation, resistant to gel filtration in the absence of nucleotide, and even resistant to treatment with 0.4 M GuHCl. This ATP-associated state with high affinity of SR1(398) ring for GroES (or, similarly, an inferred high affinity of ATP-associated GroEL for GroES) suggested that affinity for GroES becomes relaxed upon cis ATP hydrolysis, which, given negative cooperativity between GroEL rings, could gate the entry of ATP into the opposite trans ring, that step allowing allosterically driven dissociation of the cis ligands.
SR-D398A does not turn over ATP but is able to refold Rubisco in the presence of ATP/GroES, as observed by Trp fluorescence anisotropy changes (note that there is no tryptophan in GroEL or GroES). (a) Single turnover ATPase assay of wild-type GroEL (wtEL), SR1, and SR398 incubated with ATP/GroES. Note that SR1 and GroEL turn over one ring of ATP with nearly identical kinetics, whereas SR1-D398A does not turn over ATP on this time-scale. (b) Anisotropy change of Rubisco bound to SR1 or SR-D398A upon stopped-flow mixing with ATP/GroES, showing similar rapid release and folding of Rubisco from the apical domains of either SR1 or SR-D398A, in the latter case despite the lack of ATP hydrolysis. From Rye et al. (Reference Rye, Burston, Fenton, Beechem, Xu, Sigler and Horwich1997).

ATP hydrolysis in cis acts as a timer that both weakens the cis complex and gates the entry of ATP into the trans ring to direct dissociation
To address the model that cis ATP/GroES binding triggers productive folding in the stable cis chamber and that subsequent hydrolysis advances the machine to allow subsequent release of cis GroES and polypeptide, a mixed-ring complex was formed (MR2; Fig. 89a), containing one D398A ring, able to bind polypeptide and GroES but unable to hydrolyze ATP, opposite a Y203E ring unable to bind polypeptide or GroES and marked to permit isolation of mixed-ring complexes in anion exchange chromatography by the double substitution, G337S/I349E. The two parental tetradecamers were mixed together and heated to 42 °C for an hour in the presence of 10 mM ATP, enabling ring separation and random reassembly, and the desired mixed-ring complex was isolated in anion exchange chromatography by its elution at a salt concentration intermediate between those of the parent tetradecamers. When [35S]-GroES and ATP were added to the MR2 mixed-ring assembly, asymmetric complexes were formed, presumably via ATP and GroES binding to the D398A ring, which can bind GroES through its apical domains (but not turn over the ATP), whereas the opposite ring cannot bind GroES (because it bears Y203E). The [35S]-GroES/MR2 complexes were stable against the release of [35S]-GroES (Fig. 89b second panel; no transfer was observed of radiolabeled GroES to SRD398A, a GroES ‘trap’, in gel filtration), even though ATP had entered the trans ring as evidenced by the occurrence of ATP turnover at a rate ~20% that of wild-type GroEL (attributable to the trans ring and not the D398A hydrolysis-defective cis ring). The absence of departure of cis-bound [35S]-GroES in the face of cis ATP (required for GroES binding but unable to hydrolyze due to the D398A mutation) and trans ATP binding was consistent with the idea that a block of cis ATP hydrolysis (via the presence of D398A in the GroES-bound ring) prevented the discharge of [35S]-GroES.
ATP hydrolysis in cis is required to enable the release of the cis ligands (GroES and substrate protein) by subsequent action of ATP in trans. (a) Schematic of MR2 mixed-ring complex, able to bind substrate protein and GroES on a D398A ring that can bind ATP but not hydrolyze it, apposed to a GroEL ring that cannot bind either substrate protein or GroES (by virtue of a Y203E mutation) but which can bind and turn over ATP. (b) Gel filtration analyses of 35S-GroES binding to MR2 monitored by comigration of radioactivity with MR2 (MR2 gel filtration migration shown in top profile, A229). 35S-GroES is efficiently captured by MR2 when incubated with ATP. It is not released, however, as indicated by the failure of any 35S-GroES to transfer to an added SR398 GroES ‘trap’ (able to bind but not release GroES), distinguishable from MR2 in gel filtration. The failure of transfer is not a function of ATP failing to bind the trans ring, because there is ATP turnover mediated during the reaction, obligately by that ring since the other is hydrolysis-defective. On the other hand, when an MR2/35S-GroES complex is formed in ADP (shown in third trace), there is significant transfer to SR398 ‘trap’ when ATP is added, reflecting that a cis ADP state can be discharged by trans ATP. Thus, the cis ATP/GroES-bound state is a high-affinity state that is not releasable by trans ATP, but once the cis ring is hydrolyzed to an ADP state, the affinity is weakened and the ring is ‘primed’ for discharge by trans ATP. (c) Same behavior of the release of substrate protein as with the release of GroES, here pyrene-labeled Rubisco, from formed and gel filtration purified MR2/Rubisco/GroES/ATP (cis) complexes. Rubisco is not released from such complexes in the absence of added ATP, even at 4 h (left traces). However, if additional ATP is supplied (right traces), after 3 h there has presumably been some cis hydrolysis in the 398 ring, and now ATP in the opposite ring drives the release of the cis refolded Rubisco (time scale in min along right edge). From Rye et al. (Reference Rye, Burston, Fenton, Beechem, Xu, Sigler and Horwich1997).
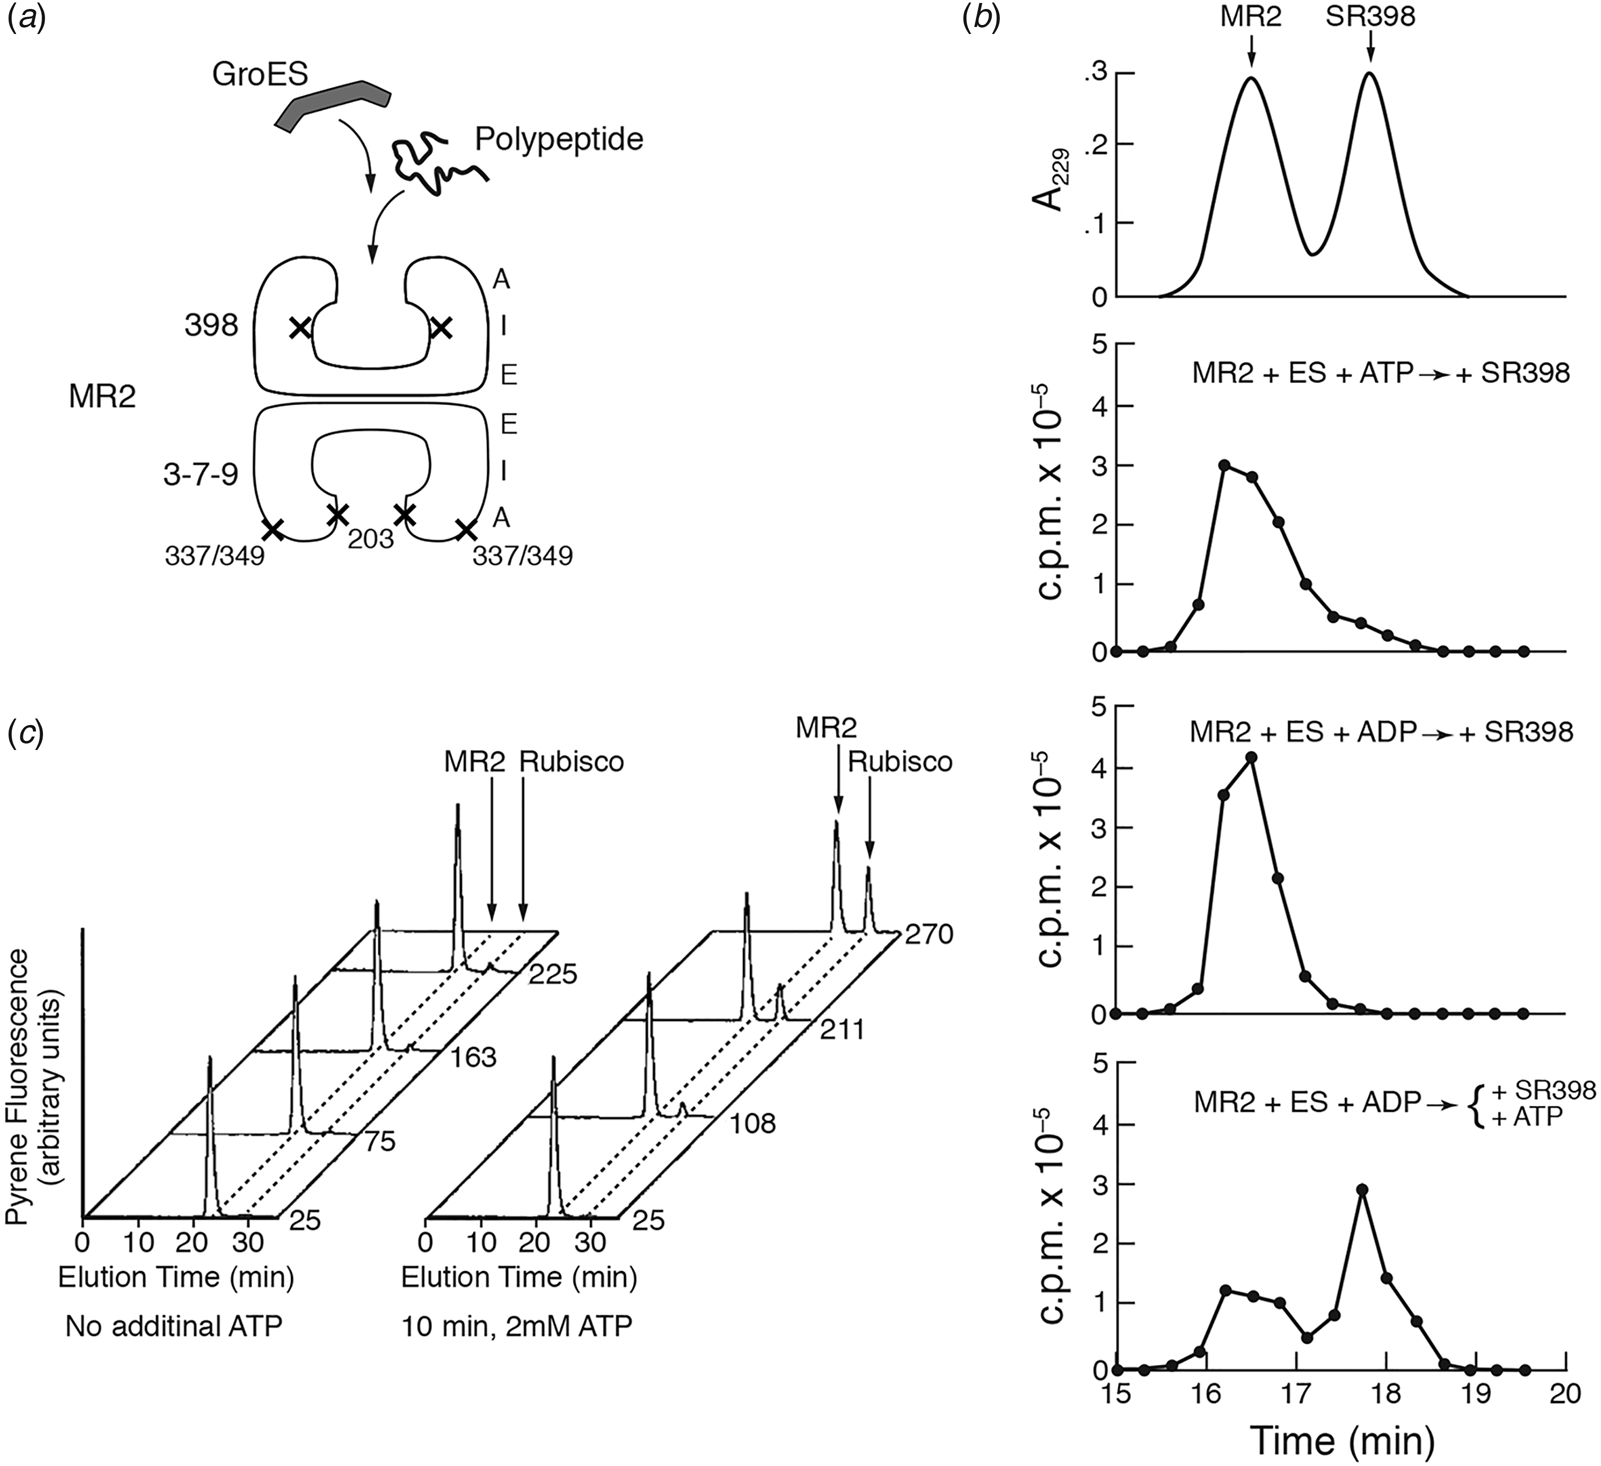
Next, a cis ADP/GroES complex was formed de novo and tested for GroES discharge with ATP. Indeed, when MR2/[35S]-GroES complexes were formed in ADP (Fig. 89b third panel), the subsequent addition of ATP (fourth panel) led to [35S]-GroES release ([35S]-GroES now migrated to the position of SR-D398A in gel filtration). The MR2/[35S]-GroES/ADP complex likely mimics the post-cis ATP hydrolysis state, indicating that cis hydrolysis weakens that ring's affinity for GroES, ‘priming’ the cis ring for dissociation via subsequent trans ring ATP binding action. This was directly tested by allowing the cis D398A ring of an MR2/GroES/Rubisco cis ternary complex formed in ATP, which refolds Rubisco in its cis cavity, to slowly hydrolyze cis ATP over 3–4 h, challenging the complexes at various times with ATP (which can bind in trans) – there was indeed a progressively increasing ability of ATP to produce the release of refolded Rubisco from the cis cavity, as observed in gel filtration chromatography (observing the native Rubisco homodimer; Fig. 89c, right). Thus, slow hydrolysis here of cis ATP complexes to produce cis ADP ones exactly corresponded to their ability to release substrate upon binding of ATP in trans.
Thus, the lifetime of a cis ATP complex (10–15 s at 25 °C) corresponds quite closely to the cis dwell time of a folding polypeptide, because, following cis ATP hydrolysis, trans ATP binding and discharge of cis GroES, polypeptide, and phosphate probably all occur in <1 s. Hydrolysis of cis ATP thus comprises a ‘timer’ that represents a ‘set point’ that has been evolutionarily optimized to accommodate sufficient time for slow folding proteins to reach native form and yet allow the efficient release of folded subunits, including those that need to undergo oligomeric assembly, to carry out functions in the cell. Later studies showed that altering the timer by various molecular manipulations can affect the rates of folding (see e.g. Wang et al., Reference Wang, Herman, Tipton, Gross and Weissman2002, and page 92; Farr et al., Reference Farr, Fenton and Horwich2007, and page 94).
ATP binding in trans is sufficient to direct discharge of the ligands of a cis ADP complex
Finally, in the same way that ATP binding (in the absence of hydrolysis) is sufficient to activate folding when GroES associates in cis with the ATP-bound GroEL ring, it was considered that ATP binding in the trans ring might be sufficient, in the absence of hydrolysis, to trigger the release of the ligands from the cis ADP ring. This was addressed by forming a binary complex between unfolded GFP and standalone D398A tetradecamer, then adding ATP/GroES, proteolyzing any GFP in the open trans ring, then rapidly purifying the (now GFP-fluorescent) stable cis ternary ATP complexes by gel filtration. The slow hydrolysis of the cis ATP in the gel filtration-purified complexes was allowed for either 30 min or 2 h, followed by a 2 min exposure to ATP, a time so brief that little or no hydrolysis occurs at D398A. At the 2 h time point, this produced the release of nearly all of the refolded GFP as judged by gel filtration chromatography. Thus, ATP binding in trans was sufficient to dissociate the cis ligands.
Overall, in both cis and trans rings, it is the binding of ATP that carries out molecular work, in cis involving the formation of the folding-active cis complex, i.e. recruiting GroES and discharging polypeptide into the encapsulated chamber, and in trans providing an allosteric signal that discharges a pre-existing cis complex. ATP hydrolysis, by contrast, is used as a timer that advances the machine, with hydrolysis in cis weakening the affinity for GroES and gating the binding of ATP in trans that leads to the dissociation of the old cis complex and formation, upon GroES binding, of a new one.
XXV. Progression from one GroEL/GroES cycle to the next – arrival and departure of GroES and polypeptide
In 1999, Rye et al. (Reference Rye, Roseman, Chen, Furtak, Fenton, Saibil and Horwich1999) reported FRET studies examining the arrival and departure of GroES from asymmetric ADP complexes in real-time. They sought also to determine the acceptor state for the non-native polypeptide, but a mis-step concerning the complex employed to test polypeptide binding led to an incorrect assignment of the polypeptide-acceptor state. This was corrected in 2008 by Koike-Takeshita et al. (Reference Koike-Takeshita, Yoshida and Taguchi2008).
GroES release and binding studies
The rate of departure of GroES in a steady-state cycling GroEL/GroES/ATP reaction was measured by Rye et al. (Reference Rye, Roseman, Chen, Furtak, Fenton, Saibil and Horwich1999) as loss of a FRET signal between fluorophore-labeled GroEL and GroES upon addition of unlabeled GroES (Fig. 90, top). The FRET signal was produced in the GroEL/GroES complex between GroEL apical residue 315, at the outside aspect of the cylinder, substituted with cysteine and AEDANS (donor)-labeled, and a cysteine added to the C-terminus of GroES that was fluorescein (acceptor)-labeled. A rate of GroES departure in the steady-state reaction of 0.04 s−1 was measured, corresponding to the rate of ATP turnover in the cycling reaction (in the absence of substrate polypeptide). Similarly, when starting purified asymmetric GroEL/GroES/ADP complexes were mixed with ATP and unlabeled GroES (Fig. 90, bottom), this same phase was observed, but also an additional ~10-fold faster phase accounting for ~40% of released GroES was observed. This fast phase became prominent in the presence of non-native substrate protein, as observed both starting with ADP asymmetric complexes and in the steady-state reaction. Thus, the rate of dissociation of cis complexes directed by trans ATP can be stimulated by the presence of non-native protein, either by populating an alternate fast pathway to release of GroES or by promoting passage of the ADP asymmetric complex through a slow step. Regardless, in the presence of non-native protein, the rate-limiting step of the reaction cycle is thus no longer a transition occurring between cis ATP hydrolysis and cis ligand release (0.04 s−1), but rather becomes cis ternary complex ATP hydrolysis (0.12 s−1). Consistent with this, when denatured MDH was added to an ongoing GroEL/GroES/ATP reaction, the rate of ATP turnover increased by 2.3-fold.
Schematic of experimental design used to measure GroES dissociation from FRET-labeled GroEL/GroES complexes. (a) The GroEL/GroES/ATP is allowed to come to steady-state before stopped-flow mixing of unlabeled GroES to observe the kinetics of dissociation of the fluorophore-labeled GroES by loss of FRET. (b) A pre-formed ADP asymmetric complex is mixed with ATP and unlabeled GroES to initiate GroES dissociation and loss of FRET. From Rye et al. (Reference Rye, Roseman, Chen, Furtak, Fenton, Saibil and Horwich1999).

The arrival of GroES at an open trans ring of an ADP asymmetric complex in the presence of ATP was concentration-independent and exhibited rate constants of 0.038 and 1.0 s−1, nearly identical to the rate of cis dissociation, suggesting that arrival of GroES in trans occurs at about the same rate as departure of GroES in cis.Footnote 45
Polypeptide association – acceptor state is the open trans ring of the (relatively long-lived) folding-active cis ATP complex, preceding the step of GroES binding and assuring a productive order of addition
In a first effort to distinguish whether polypeptide could bind to the trans ring of a cis ATP complex, Rye et al. (Reference Rye, Roseman, Chen, Furtak, Fenton, Saibil and Horwich1999) formed a GroES/D398A complex in 2 mM ATP (using 2 µM GroES and 1 µM D398A, i.e. a twofold molar excess of GroES) and observed that such complexes could not bind fluorescein-labeled Rubisco (gel filtration analysis). By contrast, a GroEL/GroES/ADP asymmetric complex (formed in 1 mM ADP) readily bound the substrate protein. Because it was not recognized at that time that D398A formed symmetric complexes, with GroES bound to both GroEL rings under these conditions, this led to a wrong conclusion that an ATP asymmetric complex could not bind substrate protein until it hydrolyzed ATP (see below). The D398A/GroES/ATP complexes were examined in cryoEM, but the complexes for the EM study were formed with 1 µM GroES and 1 µM D398A in 2.5 mM ATP and were mostly asymmetric, although a statement was made that many symmetric complexes were present in the mixture.
In 2008, Koike-Takeshita et al. (Reference Koike-Takeshita, Yoshida and Taguchi2008) reported on studies of GroEL loaded on both rings with rhodanese substrate that had been thermally-unfolded (60 °C × 15 min, without any chemical denaturant). The ‘substrate-saturated’ GroEL could bind GroES in the presence of ATP. After a 3 s (single turnover) incubation, ended by HK/glucose hydrolysis of unbound ATP, the complex was isolated by ultrafiltration. Upon PK digestion, 50% of the rhodanese bound to the complex was not protected, inconsistent with the idea that the trans ring of an ATP-containing asymmetric complex would not retain, or accept, substrate protein. That unfolded rhodanese was still present in trans was further supported by a kinetic study. The asymmetric complex that had been generated by 3 s ATP exposure followed by HK/glucose treatment was allowed to refold its cis-encapsulated rhodanese over 20 min, and then fresh ATP was added for a second single turnover. This produced a second kinetic phase of additional rhodanese refolding over the next 25 min, ending with a near doubling of total rhodanese activity, indicating that indeed trans-sided rhodanese had been present. This led the investigators to re-examine the D398A/GroES/ATP complex with a suspicion that the cause for its failure to bind added substrate protein in Rye et al. (Reference Rye, Roseman, Chen, Furtak, Fenton, Saibil and Horwich1999) was that D398A had bound GroES to both rings.
The saturation protocol was again used to bind rhodanese to both rings of D398A, then ATP/GroES was added for 3 s (prior to HK/glucose). Here, when the investigators PK-digested, they observed no degradation of rhodanese – it was apparently fully encapsulated. The amount of GroES bound was quantified, indicating 2 moles per mole of D398A tetradecamer as compared to 1 mole GroES per mole in the wild-type GroEL experiment. Finally, the recovery of rhodanese activity from D398A in the 3 s ATP/GroES experiment, allowed to extend in the presence of HK/glucose, was twice that of the GroEL 3 s experiment (Fig. 91), indicating that rhodanese had been encapsulated by GroES in both D398A rings in the presence of ATP. Thus, D398A complexes bind GroES (when supplied in twofold molar excess) at both ends in the presence of ATP, and such complexes, formed in the functional tests of Rye et al. (Reference Rye, Roseman, Chen, Furtak, Fenton, Saibil and Horwich1999) would have had no affinity for non-native protein because both rings were already occupied with GroES.
D398A can fold two molecules of rhodanese per molecule of tetradecamer upon addition of GroES and ATP if the rhodanese substrate protein is initially bound to both rings of D398A. This implies that there is no exclusion of rhodanese from a ring in trans to GroES, as had been interpreted by Rye in an earlier D398A experiment. Refolding of rhodanese bound to both rings of D398A produces twice as much rhodanese activity as asymmetrically behaving wild-type GroEL. GroEL–D398A complexes were saturated with rhodanese that had been heat-denatured. The binary complex was incubated with GroES (3:1 to GroEL) and ATP for 3 s, then ATP was quenched by hydrolysis with added hexokinase/glucose. Rhodanese activity was then measured at the indicated times. Note the twofold greater activity recovered with D398A, which indicates that both rings of this complex bound rhodanese initially and then both bound ATP/GroES, reflecting that D398A has lost negative cooperativity between rings. Reprinted with permission from Koike-Takeshita et al. (Reference Koike-Takeshita, Yoshida and Taguchi2008), copyright ASBMB, 2008.

Next, directly addressing the point of whether ATP asymmetric complexes have an affinity on their trans rings for substrate protein, Koike-Takeshita et al. used a 1:1 ratio of D398A and GroES to form asymmetric complexes in ATP. The D398A/GroES/ATP complexes were indeed able to bind a urea-denatured Cy3-labeled rhodanese nearly as efficiently as unliganded GroEL (Fig. 92). Thus the normal acceptor state for non-native substrate protein during the GroEL reaction cycle is the open trans ring of a folding-active cis ATP complex.Footnote 46 This affords productive binding of non-native protein during what is the longest step of the reaction cycle, and precedes binding of GroES, which occurs only in the next phase of the reaction cycle, after cis ATP hydrolysis gates the entry of ATP into the trans ring (required for binding GroES). Thus, an ordered production of the new cis complex is assured because polypeptide binding occurs during a phase of the reaction cycle that precedes GroES binding.
Demonstration that the trans ring of an ATP bullet is the acceptor state for non-native substrate protein. An asymmetric GroEL–D398A/GroES complex was formed in the presence of ATP by using a 1:1 molar ratio of GroEL–D398A and GroES. The complex was then incubated with unfolded Cy3-labeled rhodanese and inspected in gel filtration for association with GroEL–D398A. A robust fluorescent signal at the same position as a control of Cy3-rhodanese bound to unliganded GroEL demonstrated that the trans ring of the ATP asymmetric complex had accepted rhodanese. This result indicated that polypeptide binds in a phase of the reaction cycle that precedes the step of GroES binding, ensuring an ordered formation of cis complexes (see text). Reprinted with permission from Koike-Takeshita et al. (Reference Koike-Takeshita, Yoshida and Taguchi2008), copyright ASBMB, 2008.

ADP release from a discharged cis ring can be a rate-limiting step in the reaction cycle in the absence of substrate protein, both inhibiting ATP hydrolysis in the opposite ‘new’ cis ring and blocking the entry of ATP into the discharged ring
In late 2008, Grason et al. (Reference Grason, Gresham, Widjaja, Wehri and Lorimer2008a, Reference Grason, Gresham and Lorimer2008b) reported two studies of the effects of ADP retained after the discharge of GroES from a cis complex to slow the overall reaction cycle. This was, to some extent, foreseen by the earlier study of Kad et al. (Reference Kad, Ranson, Cliff and Clarke1998), where, in a steady-state reaction with GroEL binding and hydrolyzing ATP (in the absence of GroES), the effect of adding ADP was to allosterically halt ATP turnover, i.e. binding of ADP to a ring opposite an ATP-bound one blocked ATP turnover. In initial tests, Grason et al. (Reference Grason, Gresham, Widjaja, Wehri and Lorimer2008a) noted that, in the same type of steady-state hydrolysis reaction, an increase of [K+] from 1 to 10 to 100 mM produced incremental declines of steady-state turnover of ATP. Most immediately relevant, with GroES present, the affinity for ADP on the open trans ring of an ADP bullet complex (i.e. GroES/ADP/GroEL/ADP) increased by more than a 100-fold in the presence of 100 mM K+ relative to 1 mM K+. Importantly, the presence of non-native protein (reduced α-lactalbumin) opposed this effect in both steady-state and pre-steady-state ATP hydrolysis measurements, indicating ability of non-native protein to increase the rate of ADP departure from the open ring. This connected the presence of non-native protein to gating cis ATP hydrolysis and allowing the entry of ATP into the trans ring to discharge the cis ADP complex.
In a companion study (Grason et al., Reference Grason, Gresham and Lorimer2008b), the fate of GroES was followed by placing fluorophore probes on GroES and GroEL and measuring FRET. Measuring dissociation, starting with GroES/ADP/GroEL/ADP complexes (i.e. bullet complexes following rundown of 1 mM ATP over 30 min, with ADP present in cis, in the open trans ring, and in solution), the addition of ATP produced a half-time for ATP-driven GroES release of ~50 s. In the absence of ADP (removed by gel filtration, including removal of the trans ring ADP, which is exchangeable), the half-time for ATP-driven release was ~5 ms, 10 000-fold faster. Examining the association of GroES with the trans ring of the ADP bullet complexes produced similar results: in the presence of ADP, the association half-time was ~50 s, while in the absence, the rate became very fast. Non-native α-lactalbumin increased the rate of cis GroES departure dramatically when added to a trans-ADP complex. It was thus suggested that, in the presence of non-native substrate protein, the otherwise slow rate of ADP dissociation (a first ‘timer’) is increased, and thus the observed rate of ATP hydrolysis increases to that intrinsic to cis hydrolysis (considered to be a second ‘timer’) (see page 122, Appendix 2 for further analysis of ADP departure).
XXVI. Symmetrical GroEL–GroES2 (football) complexes
From the mid-1990s onward, investigators carrying out EM studies have appreciated the presence of symmetric GroEL complexes in their preparations of GroEL/GroES/ATP, with GroES bound simultaneously to both GroEL rings. The questions have remained open as to whether such complexes are obligatory to productive folding, whether they simply enhance the efficiency of overall folding by potentially accommodating two substrates simultaneously, or whether they are simply a happenstance of kinetics, in which a molecule of GroES is arriving on one ring to form a new cis complex before a GroES molecule has dissociated from the opposite ring. To date, we do not know to what extent such complexes versus asymmetric complexes are populated in vivo. The observations made to date are presented in Appendix 3, page 122.
XXVII. Later physiologic studies of GroEL – proteomic studies
Physiologic studies of GroEL beyond the mid-1990s have focused, using proteomic methods, on identifying GroEL-interacting proteins and particularly on proteins obligately dependent on the GroEL/GroES system for reaching the native state. Critical to identifying obligate proteins has been assay development. An initial study analyzing the duration of physical association by pulse-chase labeling and immunoprecipitation with anti-GroEL antibodies suggested that the longest-associated protein species were likely to include the obligate ones (Ewalt et al., Reference Ewalt, Hendrick, Houry and Hartl1997; see below). This proved to be roughly correct, but a more defining assay for obligate substrates employed the reduction of abundance of particular proteins from the soluble fraction of groE-depleted cells, as the result of either their aggregation (in most cases) or proteolysis, a strategy originally employed by McLennan and Masters (Reference McLennan and Masters1998; see below) and extended by Fujiwara et al. (Reference Fujiwara, Ishihama, Nakahigashi, Soga and Taguchi2010; see below). The collective of studies described below would indicate that while GroEL can interact in vivo under normal conditions with a significant fraction of protein species in E. coli, perhaps 25% (of ~3000), there is a smaller group, ranging between 60 and 250, that have an absolute requirement for GroEL/GroES to reach native form. Some of the latter dependent proteins are essential proteins, explaining why GroEL/GroES is essential to cell viability.
Flux of proteins through GroEL in vivo – extent of physical association with GroEL and period of association during pulse-chase studies as a means of identifying substrate proteins
In 1997, Ewalt et al. (Reference Ewalt, Hendrick, Houry and Hartl1997) reported 35S-methionine pulse-chase labeling studies of E. coli in which association of species with GroEL was measured by immunoprecipitation with anti-GroEL antibodies. These studies were necessarily complicated by the need to break cells under native conditions, employing: rapid cooling to 4 °C and lysozyme treatment, collection of spheroplasts by centrifugation, then hypotonic lysis followed by a 5 min centrifugation and immunoprecipitation of the supernatant. Moving the cells to 4 °C would transfer them to conditions that are generally ‘permissive’ for known GroEL/GroES-dependent substrate proteins, potentially allowing them to fold spontaneously if released. The time required for lysozyme to break the cell wall to produce spheroplasts, typically a few minutes, would also allow for ATP cycling to continue at some low level. Recovery from intact cells was in fact observed to be substantially reduced relative to an experiment in which the investigators carried out the pulse-chase study on spheroplasts, which were lysed rapidly with digitonin in the presence of EDTA. The latter experiment was in fact employed to draw a comparison between anti-GroEL captured proteins and total cytosolic proteins. It appeared that five or six species were enriched for co-immunoprecipitation with GroEL at the end of a 15 s pulse, appearing in the 10–55 kDa size range. The fate of these proteins during the chase was not specified but, more generally, it appeared that there was some dissociation of proteins in this size range by 60 s in the spheroplast experiment (50–75% dissociation of any given species).
A number of specific proteins were followed by inducing their (over) expression in a strain that was also overexpressing GroEL/GroES by fivefold, then carrying out a pulse-chase labeling study. Rhodanese, well established from in vitro studies as a GroEL/GroES requiring substrate (see page 38), exhibited a dwell time on GroEL of many minutes, as compared with chloramphenicol acetyl transferase, released by 40 s. This suggested that multiple rounds of the reaction cycle are required for rhodanese recovery in vivo (release of non-native rhodanese is likely occurring, but there is rapid rebinding until the point of EDTA addition during lysis, beyond which the non-native rhodanese would remain stably associated). Rhodanese refolding by the GroEL system was indicated by a separate experiment to occur post-translationally. When the protein was synthesized in vitro in an S30 extract immunodepleted of GroEL (in the presence of 35S-methionine), it remained unfolded and sensitive to PK. GroEL was then re-added at various times during synthesis. It enabled the production of PK resistance corresponding to the native form up to the point of completion of full-length rhodanese chains, but if GroEL was added after synthesis of rhodanese was complete, the rhodanese could not achieve a protease resistant state – it had irreversibly misfolded. The later the time of GroEL addition after completion of synthesis, the less that could be recovered in native protease-resistant form by the addition of GroEL. The investigators concluded that rhodanese and a set of E. coli proteins that flux slowly through GroEL comprise the proteins that interact quantitatively with GroEL and require its action for reaching native form, whereas other protein species are only fractionally bound and transit rapidly or do not interact at all, as in the case of most proteins below 20 kDa.Footnote 47
More generally, the issues of protein flux through GroEL were considered anteriorly by Lorimer (Reference Lorimer1996). He posited that, with ~1600 GroEL particles per cell, present at a tenth the level of ribosomes, there would be capacity of GroEL to handle only ~5% of the newly-translated proteins. This estimate had thus suggested that there might be a limited set of proteins that would be dependent on GroEL, even assuming it to be fully occupied. This was supported by the earlier data of Horwich et al. (Reference Horwich, Low, Fenton, Hirshfield and Furtak1993) and by that of Ewalt et al. (Reference Ewalt, Hendrick, Houry and Hartl1997).
Identification of proteins co-immunoprecipitating with GroEL after pulse labeling
In 1999, Houry et al. (Reference Houry, Frishman, Eckerskorn, Lottspeich and Hartl1999) reported on 2D gel-separated proteins that corresponded to the foregoing radiolabeled ones, accomplished by a scaleup experiment, co-immunoprecipitating with anti-GroEL from the soluble cytosolic fraction of a mid-log phase culture, excising spots from a 2D gel, trypsin treating, and carrying out MALDI-TOF MS. Fifty-two proteins were identified, including SAM synthase (MetK; 42 kDa) and 5,10-methylene THF reductase (MetF; 33 kDa). The identified proteins exhibited a preference for α/β topology (exemplified by TIM barrel proteins), potentially reflecting the kinetic difficulty of forming the β-sheet core in this context (disposing to the exposure of hydrophobic surfaces that could be captured by GroEL). Nevertheless, key questions remained as to which GroEL-bound proteins are obligately dependent on GroEL and whether they are also GroES-dependent.
DapA is an essential enzyme in cell wall synthesis dependent on GroEL/GroES for reaching its active form
In 1998, McLennan and Masters (Reference McLennan and Masters1998) reported on depleting GroEL/GroES from E. coli by replacing the groE promoter in the bacterial chromosome with an ara promoter and analyzing the fate of cells after the withdrawal of arabinose from the bacterial medium. GroEL levels were observed to reduce by 50% at each doubling, with the cells retaining exponential growth for 2 h, continuing slower growth for another 1.5 h, then lysing abruptly (Fig. 93).Footnote 48 The investigators noticed that the cells converted to spheroplasts during depletion, suggesting that cell walls (with constituent peptidoglycan) either could not be synthesized or maintained. An increased rate of incorporation of exogenously added 3H-labeled DAP (diaminopimelic acid) was observed, supporting that the cells might be DAP-starved. Indeed, the addition of DAP to the culture allowed it to continue to grow for an additional 6 h. This suggested an involvement of GroEL in the biogenesis of one or more enzymes of the DAP synthesis pathway. The investigators reasoned that overexpression of a relevant enzyme prior to GroEL/GroES depletion might allow the depleted cells to survive longer. Indeed, the introduction of a plasmid expressing DapA allowed such survival. In further observation of groE-depleted cells, the level of DapA enzyme just prior to lysis was observed in Western blotting to be 16% of normal. Encoded by an essential gene, DapA thus became the first identified essential substrate of GroEL/GroES, whose inability to reach native form in the absence of the chaperonin system offered the first explanation of the essential role of groE in cell growth. In principle, one such dependent gene product would be sufficient to offer an explanation for the essential role of groE.
GroEL does not appear to be saturated with substrate proteins under normal conditions. McLennan and Masters (Reference McLennan and Masters1998) placed an ara promoter in the bacterial chromosome to regulate the groE operon (panel a). A Western blot in panel (b) shows that the level of GroEL in the ara regulated cells is half to a third that of GroEL expressed endogenously from the wild-type groE operon. After switching the ara-regulated strain from arabinose to glucose-containing medium, the levels of GroEL fall very substantially over each 20 min period. Cells began to grow more slowly only at 2 h, however. By this time, the level of GroEL is probably significantly <10% normal wt. Thus, until there is very substantial depletion of GroEL, cells continue to grow at normal rates, suggesting that GroEL is not saturated under normal conditions. Reprinted from McLennan and Masters (Reference McLennan and Masters1998), by permission from Springer Nature copyright 1998.

GroEL-interacting substrates identified by trapping GroEL/GroES complexes in vivo
In 2005, Kerner et al. (Reference Kerner, Naylor, Ishihama, Maier, Chang, Stines, Georgopoulos, Frishman, Hayer-Hartl, Mann and Hartl2005) reported on an experiment in which an expressed C-terminally His6-tagged GroES from M. mazei was used to trap proteins bound to GroEL/GroES complexes in vivo. The M. mazei version of GroES binds more stably to GroEL in ADP, enabling complexes to be more efficiently recovered following cell breakage and IMAC affinity capture. Spheroplasts expressing this version of GroES were rapidly lysed in the presence of HK/glucose to convert ATP to ADP, and the lysates were subjected to IMAC.Footnote 49 After recovery from the IMAC column, the complexes were solubilized and fractionated in an SDS gel, followed by excision of stained bands and analysis by LC-MS/MS. Several dozen protein species were identified as present in the GroEL/GroES complex at a level >3% of the total amount of the species (SILAC study), supporting a substantial occupancy that was interpreted as reflecting the obligate requirement of GroEL. Many of these proteins exhibited (αβ)8 TIM barrel topology. A number of the species, e.g. MetK, were known to be encoded by essential genes.
Proteomic study of groE-depleted E. coli
In 2010, Fujiwara et al. (Reference Fujiwara, Ishihama, Nakahigashi, Soga and Taguchi2010) reported a proteomic analysis of soluble proteins in the setting of groE depletion, as had been carried out originally with DapA in the McLennan and Masters (Reference McLennan and Masters1998) study, inspecting for the loss of particular protein species as a function of either aggregation or turnover as the result of misfolding. In particular, cells were interrogated at 2 h after the shift from arabinose to glucose medium by sonication, isolation by centrifugation of the soluble fraction, tryptic digestion, and LC-MS. This identified ~250 proteins whose abundance was reduced by 50% or greater. These were considered as potentially obligate substrates, albeit that only some of them were subjected to a further assay in which individual protein species were overexpressed in cells that had a normal level of GroEL versus GroEL-depleted and examined for the lack of solubility in the depleted cells. Rather, the authors tested 83 proteins that had been classified in the earlier flux studies as being long-lived at GroEL, and observed that 49 of them were depleted (42 aggregating and seven degraded), whereas 34 remained soluble and thus did not appear to be affected by GroEL deficiency. Several additional proteins were also identified by metabolic studies of groE-depleted cells and confirmed as aggregating in this setting. A total of 57 obligate substrate proteins were thus identified (see page 126, Appendix 4), mostly metabolic enzymes, all with subunits between 20 and 65 kDa size, including six encoded by essential genes.Footnote 50 Because there was no statement of what fraction of the 250 proteins originally identified were confirmed as obligate at the level of individual protein assay, one is left to conclude that somewhere between 57 and 216 out of the 1000 most abundant proteins (of ~2000 total) in the bacterial cytosol are groE-dependent.
XXVIII. Later studies supporting that the minimal fully functional chaperonin system can be a single ring, cooperating with cochaperonin
Chimeric mammalian Hsp60 containing an SR1 equatorial domain fully functions as a single ring with mammalian Hsp10 in vitro – release of Hsp10 from Hsp60 post cis ATP hydrolysis differs from SR1/GroES, allowing cycling
Chimera of mammalian mitochondrial Hsp60 with SR1 equatorial region is fully functional as a single ring, supporting that mitochondrial Hsp60 functions as a single-ring system
In 1998, Nielsen and Cowan (Reference Nielsen and Cowan1998) provided additional support that mammalian Hsp60 is able to function as a single ring throughout the chaperonin reaction cycle. A chimeric version of the Hsp60 was produced, containing mammalian Hsp60 apical and intermediate domains and mutant SR1 equatorial domains (Fig. 94). The points of joining Hsp60 to SR1 sequences were at the lower aspect of the intermediate domain (aa 144 by GroEL numbering in ascending limb and aa 405 in the descending limb). As shown originally, the SR1 version of GroEL was designed to be unable to form double rings by virtue of four simultaneous substitutions, disrupting ring–ring contacts at the base of the equatorial domain of each GroEL subunit (Weissman et al., Reference Weissman, Hohl, Kovalenko, Kashi, Chen, Braig, Saibil, Fenton and Horwich1995). Experimentally, it had been demonstrated that SR1 remains as a single ring during ATP/GroES binding. In particular, a Hummel–Dreyer-type experiment was carried out, applying SR1 to a gel filtration column equilibrated in ATP and 35S-GroES. Radiolabeled GroES migrated strictly to the position of SR1 and not that of a double ring, indicating that no double rings were being formed in the presence of ATP/GroES (Weissman et al., Reference Weissman, Rye, Fenton, Beechem and Horwich1996). Accordingly, Nielsen and Cowan examined refolding of MDH by the Hsp60/SR1 chimera in the presence of Hsp10 and ATP, observing that it could efficiently refold stoichiometric amounts of MDH, starting either from a chimera/MDH binary complex or when adding non-native MDH after a 20 min preincubation of chimera, Hsp10, and ATP. Refolding in the latter case supported that ongoing cycling of chaperonin/cochaperonin was occurring. As further evidence that multiple rounds of folding were occurring, stoichiometric MDH was added to the mixture repeatedly at intervals, ultimately producing a fivefold molar excess of folded MDH to chaperonin. This cycling behavior implies that Hsp10 and cis MDH are released in an ongoing fashion from the chimera, different from the behavior of SR1/GroES, where GroES becomes stably associated with SR1 and locks the substrate into the cis chamber. This also indicates that ATP must be cycling as well, presumably recruiting Hsp10 to the chimera, then hydrolyzing, with, in this case, the release of both Hsp10 and product ADP, to allow a further cycle. This contrasts with SR1, where only a single round of ATP hydrolysis occurs in the GroES-bound SR1 ring, producing a stable long-lived ADP complex. It also contrasts with GroEL/GroES, where a GroES-ADP ring is not discharged until ATP binds to the opposite ring (and where pre-formed ADP complexes are very stable, with nanomolar dissociation constant, e.g. Jackson et al., Reference Jackson, Staniforth, Halsall, Atkinson, Holbrook, Clarke and Burston1993).
Chimeric chaperonin with the apical domain of mammalian Hsp60 fused to the equatorial domain of the single-ring (SR1) version of E. coli GroEL. SR1 was known, by Hummel–Dreyer analysis, to remain a single ring during its reaction with ATP and GroES. Thus, this construct was assured to remain a single ring throughout its cycle. The black bars at the bottom denote the four mutations at the equatorial base of each subunit of SR1 that abrogate apposition of a second ring. Adapted from Nielsen and Cowan (Reference Nielsen and Cowan1998), with permission from Elsevier, copyright 1998.

To assess the ability of Hsp10 to bind Hsp60 in ATP versus ADP, the apparent K ds were measured (using 35S-Hsp10 and sedimenting Hsp60/Hsp10 binary complexes through a sucrose cushion that retains free 35S-Hsp10). In ATP, the apparent K d measured ~20 nM, resembling that of GroEL/GroES in ATP. In ADP, however, GroEL/GroES exhibited ~nM affinity, as would be predicted, whereas there was no binding detectable of Hsp10 to Hsp60. Thus, after the step of ATP hydrolysis in the Hsp10-bound Hsp60 single ring, the cochaperonin departs, along with ADP, and the ring recycles, offering an explanation of how a single-ring chaperonin–cochaperonin system can cycle and mediate folding as efficiently as GroEL/GroES.
Mammalian Hsp60/Hsp10 can support the growth of a GroEL/GroES-depleted E. coli strain
A functional test in vivo of the mammalian Hsp60/Hsp10 system, replacing GroEL/GroES in E. coli, was reported in 1999 by Nielsen et al. (Reference Nielsen, McLennan, Masters and Cowan1999). This involved re-programming the chromosomal E. coli groESL coding sequence with an inducible ara promoter in the place of the groE promoter (McLennan and Masters, Reference McLennan and Masters1998), such that the cells could only grow on arabinose and would express little or no GroES/GroEL in glucose. The latter condition allowed testing of whether various chaperonin-expressing plasmids introduced into the strain could rescue growth. Indeed, the mammalian single-ring-encoding Hsp60 and mammalian Hsp10 coding sequence, expressed together from a groE promoter in a moderate copy (pBR origin-containing) plasmid, could fully rescue growth in the glucose-containing medium. This implied that the mitochondrial single-ring system could bind and refold all of the essential cellular proteins that are substrates for GroEL/GroES. Western analysis suggested that the level of groE promoter-expressed Hsp60 and Hsp10 from the plasmid was a few fold greater than normal GroEL and GroES expression from the chromosomal operon. It is unclear whether the same rescue would have been accomplished with a single copy chromosomal replacement of the groE coding sequence. Nevertheless, both Hsp60 and Hsp10 were required, suggesting that basic physiology was preserved in a setting where only a single-ring chaperonin was present. Curiously, however, the system could not support the growth of λ or T4 phages, probably reflecting some limitation at the level of mammalian Hsp60 and Hsp10 in regard to binding or encapsulation of phage substrate proteins (see e.g., page 107 on a specialized GroES encoded by T4 phage to accommodate folding of its large capsid protein).
Three single residue changes in the mobile loop of GroES enable it to substitute for mitochondrial Hsp10 as a cochaperonin for mammalian mitochondrial Hsp60
In 2001, Richardson et al. (Reference Richardson, Schwager, Landry and Geogopoulos2001) reported on changes made to the GroES mobile loop that could adapt it to function with mitochondrial Hsp60, defining that Hsp10 cochaperonin specificity (for Hsp60) resides in the mobile loop. First, the investigators showed that replacing the entire mobile loop of GroES with that of Hsp10 could enable in vitro refolding of CS by Hsp60, and, coexpressed with Hsp60, could support cell growth in vivo of a groE-deficient strain, as compared with the failure of the GroES/Hsp60 pair. Inspecting the differences between the GroES mobile loop and that of Hsp10, three notable changes were identified (Fig. 95): S21 prior to the turn in the GroES loop is present as threonine in Hsp10; the hydrophobic valine at residue 26 in GroES (in IVL motif) is replaced by methionine in Hsp10 (more hydrophobic); and threonine 28 in GroES is replaced with proline in Hsp10 (likely conferring rigidity). When the three changes to Hsp10-containing residues were made in GroES, it could now function with Hsp60 in mediating CS refolding and in supporting the growth of a groE-deficient strain expressing Hsp60.
Three differences between the mobile loop of E. coli GroES, whose structure is shown, and that of Hsp10 (residues in Hsp10 are arrowed). When Richardson et al. installed these changes into GroES, it could now bind to single-ring mammalian mitochondrial Hsp60 and mediate the folding of citrate synthase. Reprinted with permission from Richardson et al. (Reference Richardson, Schwager, Landry and Geogopoulos2001), copyright ASBMB, 2001.

Mutational alterations of the GroEL/GroES system can enable it also to function as a single-ring system
SR1 containing additional single amino acid substitutions after selection for viability on GroEL-depleted E. coli behaves like single-ring mitochondrial Hsp60, releasing GroES in the post cis hydrolysis ADP state
In 2003, Sun et al. (Reference Sun, Scott and Lund2003) produced single-ring versions of GroEL that could function in vivo with GroES to rescue GroEL-deficient cells. They started with SR1 (Weissman et al., Reference Weissman, Hohl, Kovalenko, Kashi, Chen, Braig, Saibil, Fenton and Horwich1995) and with an ara-regulated chromosomal groE (McLennan and Masters, Reference McLennan and Masters1998). A plasmid with trc promoter-driven GroES/SR1 was not able to rescue the strain when it was placed in glucose. This starting plasmid was then hydroxylamine-mutageneized and plated in glucose, obtaining normally-growing colonies. When the plasmids were isolated, SR1 variants with 32 different single amino acid substitutions were found to support growth, mapping mostly to the equatorial domain but with a smaller group mapping to intermediate domain helix M. To assess the relative strength of rescue, the strains were tested for ability to form plaques following T4 or T5 infection, and about a third of the strains formed plaques with normal efficiency. The new mutant groE coding plasmids were then reprogrammed under (tight) ara regulation and introduced back into the host strain. The transformants were tested for ability in the presence of arabinose to rescue the complete absence of GroEL, which was produced by transducing them with P1 phage grown on a GroEL disruption strain carrying a Kan-resistance marker in the GroEL coding sequence (selecting for Kan-resistance). Upon shift to glucose, the strains were then examined for how long it took them to halt growth. Three strains could maintain growth almost as long as similarly ara-regulated wild-type GroES/GroEL. When the three mutants were studied in vitro, they behaved as single rings, but in the presence of GroES, instead of the single turnover observed for parental SR1/GroES, they continuously turned over ATP at the same rate as parental SR1 alone. This was consistent with the likely release of GroES after each round of ATP binding and hydrolysis. Consistently, these mutant versions of SR1 could refold MDH and CS nearly as efficiently as wild-type GroEL in the presence of GroES/ATP. To directly assess the affinity of the mutants for GroES in the presence of ADP, a surface plasmon resonance measurement was performed with GroES coupled to the chip. No measurable affinity of the mutants for GroES could be detected, compared with stable binding to GroES (in ADP) of both GroEL or SR1. Thus, further substitution, in this case within the single-ring component SR1, could convert it to a behavior like that of the single ring of mitochondrial Hsp60, namely conferring ability to release GroES and ADP upon ATP hydrolysis and thus carry on a cycling reaction.
Mutations in the IVL sequence in the distal portion of the GroES mobile loop also enable productive folding in vivo by SR1
In 2009, Liu et al. (Reference Liu, Kovács and Lund2009) reported on site-directed mutations in GroES that could enable coexpressed SR1 to support the viability of E. coli. The investigators reasoned that if diminished binding of cochaperonin in the ADP state enables its post-ATP hydrolysis release from single-ring versions of chaperonin, then another route to SR1-mediated productive folding in vivo would be to mutagenize the mobile loop of GroES that forms a physical association with the GroEL apical domains to reduce the affinity for GroES. Here, the investigators used site-directed mutagenesis, targeting the I25-V26-L27 binding region in the distal limb of the mobile loop and G24, chosen for its invariance in evolution (putatively conferring flexibility to the three adjoining hydrophobic GroEL-contacting residues). Each of the four residues was changed individually to the 19 other possibilities. Nearly all changes of G24 produced a degree of rescue, with evidently all such changes reducing the affinity of GroES. Isoleucine 25 was also very sensitive to even conservative changes, enabling rescue, whereas valine 26 and leucine 27 were much less sensitive to conservative changes. A number of the GroES mutants were overexpressed and studied in vitro for the ability to inhibit the ATPase activity of GroEL and SR1 (see Poso et al., Reference Poso, Clarke and Burston2004 for kinetics of ATP turnover by SR1). As might be expected, the mutants of GroES that rescued well only minimally suppressed ATPase activity, a function apparently of weak binding to SR1, whereas a mutant unable to rescue inhibited ATPase activity almost as well as wild-type GroES.
Notably, in the growth tests of the GroES mutants, none exhibited a rescue of growth comparable to wild-type GroEL/GroES. More generally, the investigators commented that neither the mutations previously made in SR1 (Sun et al., Reference Sun, Scott and Lund2003) nor those made here in GroES could support the growth at 43 °C, suggesting that the double-ring structure of GroEL may comprise a refinement that maximizes the activity.
Separation of the GroEL double ring into single rings that can reassort during the GroEL/GroES reaction cycle carried out in vitro
While wild-type GroEL clearly is isolated as a double ring, in vitro studies from the mid-1990s have noted the ability of the rings to separate and reassort with others in vitro in the presence of hydrolyzing ATP. Horwich and coworkers produced two mutant GroEL mixed-ring assemblies to interrogate the reaction cycle by such incubation (MR1 and MR2; Figs. 65 and 89; Burston et al., Reference Burston, Weissman, Farr, Fenton and Horwich1996; Rye et al., Reference Rye, Burston, Fenton, Beechem, Xu, Sigler and Horwich1997; see pages 62 and 81). In 1997, Taguchi et al. (Reference Taguchi, Amada, Murai, Yamakoshi and Yoshida1997) demonstrated the ability of the T. thermophilus GroEL rings to re-assort in vitro with those of E. coli GroEL. In this latter study, a hydrolysis-defective version of GroEL could not exchange. More recently, the same behavior has been further studied with E. coli GroEL by Yan et al. (Reference Yan, Shi, Bracher, Miličić, Singh, Hartl and Hayer-Hartl2018). In 150 mM potassium at 25 °C, they noted that ring exchange in vitro (between wild-type GroEL and 203/337/349 mutant) proceeds at approximately the same rate as ATP turnover, suggesting that separation of rings is occurring in vivo at each round of the reaction cycle. Using a number of different mutants, it appeared that, in a GroEL/GroES reaction cycle, it is the step of trans ATP binding, following cis ATP turnover, that drives ring separation. The investigators asked whether preventing ring separation by disulfide bond formation between the two GroEL rings would impair function. They substituted a cysteine in the GroEL subunit at the A109 position at the ‘left’ site of the equatorial interface and confirmed that inter-ring disulfide bonds were formed upon expression of the mutant in E. coli. In vitro, they observed that the crosslinked rings exhibited a slower release of substrate protein, associated with a several-fold decreased rate of recovery of MDH, but with normal recovery of rhodanese. In vivo, in the setting of shutoff of an ara-controlled chromosomal groE and rescue by IPTG induction of a single copy plasmid encoding the lac-driven disulfide-forming 109C mutant (and GroES), they observed no difference of growth at 25 °C as compared with similarly expressed wild-type GroEL and GroES and only a minor effect at 37 °C (at best; there was no difference comparing A109C to a ‘control’ A109S mutant). At 42 °C, however, the 109C mutant exhibited diminished growth by ~10-fold. The investigators suggested that there is a decreased efficiency of the symmetric locked-together rings. There is surely an effect on growth at heat shock temperature; but it seems unclear whether the effect at that temperature corresponds to the one observed in vitro at 25 °C.Footnote 51
XXIX. Later studies of polypeptide binding by GroEL
Role of hydrophobic interaction between substrate protein and apical domains supported by ITC, proteolysis of a bound substrate protein, and mutational analysis of an interacting protein
In January 1995, Lin et al. (Reference Lin, Schwarz and Eisenstein1995) reported isothermal titration calorimetry studies of binding of a soluble non-native mutant form of subtilisin to GroEL, observing a negative heat capacity, supporting the idea of hydrophobic contact between the chaperonin and non-native substrate (see earlier discussion of hydrophobic effect and heat capacity under Footnote 19). In July 1995, Hlodan et al. (Reference Hlodan, Tempst and Hartl1995) reported on fragments of rhodanese that could be isolated in association with GroEL following limited treatment of GroEL/rhodanese binary complexes with trypsin, chymotrypsin, or PK, such that bound rhodanese was cleaved but not GroEL. Rhodanese peptides of 7–14 kDa remained bound to GroEL through gel filtration, suggesting that stable association requires a length of at least 60 amino acids (sufficient to bind to two or three consecutive apical domains). The physiologic nature of binding was supported by the observation that addition of ATP produced dissociation. Sequencing of the associating peptides revealed essentially one from each of the N-terminal and C-terminal domains of rhodanese (which are duplicated folds), including hydrophobic residues that had been recognized as lying at the interface between the domains in the native state (see page 38). In November 1995, Itzhaki et al. (Reference Itzhaki, Otzen and Fersht1995) reported that spontaneous folding of the 64 amino acid chymotrypsin inhibitor, CI2, is retarded by the presence of GroEL, and that a series of mutations altering hydrophobic residues in CI2 to alanine diminished such slowing of refolding, supporting the idea that GroEL interacts with CI2 via hydrophobic contacts.
Reversal of low-order aggregation by the GroEL/GroES system
In July 1995, Ranson et al. (Reference Ranson, Dunster, Burston and Clarke1995) reported a study of rates and yields of MDH refolding after dilution from denaturant under permissive conditions (30 °C), comparing spontaneous and GroEL/GroES-mediated reactions, that indicated that the complete chaperonin system was able to reverse early steps of aggregation of misfolded species. This study in some respects provided a detailed analysis of the kinetic competition that had been observed earlier by Buchner et al. (Reference Buchner, Schmidt, Fuchs, Jaenicke, Rudloph, Schmid and Kiefhaber1991) between folding and aggregation of CS. Overall, spontaneous refolding exhibited a slower rate (~30% that of the chaperonin-mediated reaction) and a yield that was even lower (15% that of the chaperonin-mediated reaction). The spontaneous reaction was associated with irreversible misfolding as judged by a delay experiment in which spontaneous refolding was allowed to proceed for varying periods of time prior to adding the chaperonin system (at long delay times, there was only ~20% recovery). The irreversible losses were attributed to multimolecular aggregation because they were proportional to the concentration of input MDH. The question was raised as to whether the chaperonin system blocks versus reverses low-order aggregation before it becomes irreversible. A block would require stoichiometric chaperonin, whereas reversal could be achieved with substoichiometric levels. Strikingly, even with 1:10 chaperonin:MDH, there was full recovery of MDH. Kinetic modeling (Fig. 96) supplied rates for MDH monomer folding (unimolecular), competing spontaneous low-order aggregation (in the forward direction including misfolding, and in the reverse direction slowly reversible), chaperonin-mediated reversal of low-order aggregates (embracing potentially an off-rate of monomers from these structures), and unproductive irreversible aggregation from low-order aggregates (see Fig. 96). The chaperonin-mediated reversal of aggregation was a rapid step. This was interpreted as efficient binding and ATP-dependent folding of a competing off-pathway misfolded monomeric state, with flux to the native state ‘intercepting’ irreversible aggregation. Because the rate of regeneration of folding-competent monomers is much greater than that of irreversible aggregation, the latter process is prevented. Thus, the overall rate of reaching the native state is enhanced but without any rate enhancement of the productive GroEL/GroES-dependent steps [in agreement with later observations of Walter et al. (Reference Walter, Lorimer and Schmid1996), immediately below].
GroEL can reverse low-order oligomer formation by misfolded MDH in a substoichiometric manner in the presence of ATP and GroES, with binding and productive folding of released monomers competing successfully against irreversible aggregation. Rates were modeled to fit data from spontaneous refolding and from later addition of the chaperonin system to ongoing spontaneous reactions. Reprinted from Ranson et al. (Reference Ranson, Dunster, Burston and Clarke1995), with permission from Elsevier, copyright 1995.

Thermodynamic coupling mechanism for GroEL-mediated unfolding
In September 1996, Walter et al. (Reference Walter, Lorimer and Schmid1996) reported an experiment that supported a thermodynamic coupling mechanism of unfolding as mediated by GroEL. They employed a form of RNAse T1 that reversibly populates both a near-native and an unfolded state in aqueous solution (avoiding denaturants). Both disulfide bonds of T1 had been reduced and carbamidomethylated, preventing the protein from reaching the fully native state. Two additional residue substitutions removed a proline and simplified the folding kinetics. Trytophan fluorescence (320 nm emission) was employed to monitor the state of the so-called RCAM-T1 (Fig. 97a), with native-associated fluorescence in high salt (1.5 M or greater) but quenched fluorescence in low salt, reflecting the unfolded state. At 1.5 M NaCl, the protein largely populated the native-like state, but very slowly unfolded. Addition of GroEL (devoid of tryptophan) in increasing amounts (across 1:1 stoichiometry) produced a progressively increased amplitude of unfolding (Fig. 97b). That is, the fraction of unfolded molecules at a given time point after addition increased with GroEL concentration. The microscopic rate of unfolding, however, as reflected in the fast phase of fluorescence change (λ 2), was not affected by GroEL (Fig. 97c). This, fundamentally, indicated that GroEL does not ‘catalyze’ unfolding. Rather, it shifts the equilibrium, here between a folded and an unfolded state, toward the unfolded state by favoring binding of the unfolded state. Unfolding is thus coupled with the binding to GroEL. Binding is thermodynamically favored insofar as the free energy of binding RCAM-T1 to GroEL (estimated at 7–8 kJ mol−1) is greater than the free energy of unfolding (conformational stability of RCAM-T1 at 1.5 M NaCl was estimated at 6.5 kJ mol−1). Thus unfolding becomes thermodynamically coupled to binding.
Studies of a mutant of T1 RNAse, RCAM-T1 (reduced and carbamidomethylated), that exhibits two-state folding and can bind to GroEL in its non-native state. GroEL does not affect the microscopic rate constants of unfolding and folding. (a) RCAM-T1 undergoes a transition from unfolded (at low salt) to folded (above 1.5 M NaCl), as monitored by tryptophan fluorescence. (b) At 1.5 M NaCl, unfolding kinetics of 0.5 µM RCAM-T1 in the presence of increasing concentrations of GroEL from zero (top) to 1.5 µM (bottom). (c) Apparent rate constants for unfolding from panel (b) show little (λ 2, folding/unfolding) or no (λ 1, cis/trans proline isomerization) dependence on GroEL concentration, indicating that GroEL does not catalyze unfolding. From Walter et al. (Reference Walter, Lorimer and Schmid1996). Copyright 1996 National Academy of Sciences USA.

GroEL binds late intermediates of DHFR
In 1997, Goldberg et al. (Reference Goldberg, Zhang, Sondek, Matthews, Fox and Horwich1997) reported that addition of a small molar excess of GroEL 5–60 s after initiating spontaneous refolding of human DHFR by dilution from denaturant could immediately halt the changes of tryptophan fluorescence. This indicated that even late-stage intermediates can be recognized by GroEL. In 1999, Clark and Frieden (Reference Clark and Frieden1999) reported a detailed analysis of tryptophan fluorescence during both folding and unfolding of E. coli and mouse DHFR in the presence of varying concentrations of GroEL at various temperatures. In both cases, late intermediates that had been defined in the spontaneous folding pathways of both proteins were shown to be able to be bound by GroEL. The temperature was found to affect the equilibrium between native DHFR and late intermediates, and the presence of GroEL shifted the equilibrium away from native toward the bound late intermediate forms. This overall unfolding action (with associated free energy estimates for both the conformational transitions from native-to-late intermediate states and binding to GroEL, in relation to temperature) likened the binding of these intermediates to the thermodynamic coupling described by Walter et al. (Reference Walter, Lorimer and Schmid1996).
GroEL binding to synthetic peptides – contiguous exposure of hydrophobic surface is favored
In 1999, Wang et al. (Reference Wang, Feng, Landry, Maxwell and Gierasch1999) reported a transferred NOE NMR study of binding to GroEL of a number of synthetic peptides of 12 or 13 residues, configured to inform about binding preferences of GroEL. Binding was qualtitatively assessed by transferred NOE spectral line broadening, and the structure of the peptide in association with GroEL assessed by the analysis of trNOE cross-peaks. Given the synthesized peptide sequences, binding preferences could be assessed in relation to peptide chirality, peptide secondary structure (helical versus strand character), and, in the case of helical peptides, amphipathicity. First, an L-peptide, D-peptide, and mixed D,L-peptide of the same amino acid sequence, rhodanese helix A (aa 11–23; Ploegman et al., Reference Ploegman, Drent, Kalk, Hol, Heinrikson, Keim, Weng and Russell1978; PDB:1RHD), were compared. Whereas the first two pure L and D peptides could form α-helix by CD analysis in 20% TFE, the mixed L,D-peptide did not form α-helix; yet all three peptides bound to GroEL with similar affinity as indicated by equivalent amounts of line broadening and similar trNOE peak intensities.Footnote 52 This indicated that an α-helix motif is not essential for binding to GroEL.
Next, the rhodanese peptide was ‘idealized’ as an amphipathic helix, with hydrophobicity exhibited at one face, as delineated in a helical wheel plot, versus dispersed around the putative helix in a second designed peptide of the same amino acid composition. The two peptides (each 12 aa) exhibited helical character in 20% TFE. When mixed with GroEL, the trNOE spectra revealed substantially greater line broadening in 1D spectra of the amphipathic peptide relative to the non-amphipathic one and greater magnitude of trNOEs in the 2D NOESY measurements. Thus, clustering of hydrophobic residues on one face of the peptide appears to favor binding to GroEL.
A third comparison was carried out between two peptides derived from native β-strand structures, one with alternating hydrophobic/hydrophilic amino acids presenting a hydrophobic face, the other lacking such arrangement. The alternating peptide selectively bound to GroEL, producing trNOEs consistent with the β-strand character, whereas the other peptide showed no evidence of binding.
Finally, the various peptides were studied for the ability to be retained in C18 reverse phase HPLC, where retention had been shown to reflect the ability of a ‘contact area’ of localized hydrophobicity of a peptide to interact with the C18 stationary phase (see Büttner et al., Reference Büttner, Blondelle, Ostresh and Houghten1992). Remarkably, the retention time of the various peptides in C18 RP-HPLC correlated with the magnitude of trNOE intensity across the three sets of comparisons. This argued that the presentation of a contiguous hydrophobic surface is the major driver of GroEL-peptide recognition.
Crystallographic resolution of peptides bound to GroEL apical domains
An N-terminal tag added to an isolated apical domain is bound to the apical polypeptide binding surface of a neighboring apical domain in a crystal lattice as an extended segment, via predominantly hydrophobic contacts
In 1997, Buckle et al. (Reference Buckle, Zahn and Fersht1997) reported a crystal structure of an expressed apical domain of GroEL (aa 191–376). An N-terminal tag containing a 6-His followed by a thrombin cleavage site [(G)LVPRGS] was attached to the GroEL apical domain at the coding sequence level to facilitate purification. Crystals grown in 0.5 M NaCl/glycerol formed a P212121 lattice and diffracted to 1.7 Å (PDB:1KID). The structure was solved by molecular replacement, and the fold of the apical domain in isolation superposed with that of the apical domain in models of intact GroEL. Interestingly, the greatest differences in Cα positioning between the miniapical structure and intact GroEL lay in the two α-helices of the peptide binding surface (helices H and I as enumerated in intact GroEL), potentially indicating local flexibility. Remarkably, the –7/GLVPRGS/-1 sequence could be built into the map (see Fig. 98 panels A and D), occupying an extended density that began in the groove between the helices, extended for several residues across the interhelical groove, then crossed helix I (without contact with the underlying extended segment) and connected to the N-terminus of the neighboring apical domain in the crystal lattice. The peptide did not obviously participate in a lattice contact and was thus interpreted to inform about binding to the peptide binding surface of GroEL. Perhaps most striking was L –6, whose side chain was found inserted into a hydrophobic pocket in the interhelical groove to form contacts with L237 and V271. Other apolar contacts of peptide side chains were noted as well, with apical residues that had been identified by mutagenesis as affecting polypeptide binding (Fenton et al., Reference Fenton, Kashi, Furtak and Horwich1994), e.g. with L234 and V264, but a number of hydrogen bonds were also observed between the main chain of the peptide and polar side chains of helices H and I (e.g. –5 with N265).Footnote 53, Footnote 54
Crystallographic resolution of peptide segments binding to GroEL apical domain. Binding of SBP (strong binding peptide, 12 aa hairpin with one leg complexed with GroEL miniapical domain), GroES mobile loop with IVL edge complexed with GroEL (from GroEL/GroES/ADP7 crystal structure), and an N-terminal tag segment (GLVPRGS) of a miniapical domain (from a neighbor in the lattice), each in the peptide binding surface of the GroEL apical domain as an extended segment in the hydrophobic groove between α-helices H and I. (a) The schematic showing main chains of the peptides as tubes; (b–d) peptides shown binding to a molecular surface (green, convex; gray, concave) of H–I region and groove in apical domain. (b) SBP (PDB:1DKD); (c) GroES mobile loop (from PDB:1AON); (d) miniapical tag (from PDB:1KID). Adapted from Chen and Sigler (Reference Chen and Sigler1999), with permission from Elsevier, copyright 1999.

Crystal structures of complexes of a strong binding peptide with isolated apical domain and with GroEL tetradecamer
In 1999, Chen and Sigler (Reference Chen and Sigler1999) reported the crystal structure of a complex of the GroEL miniapical domain and a 12-residue peptide that had been affinity-selected for strongly binding to it. Affinity selection was accomplished by immobilizing N-terminally 6His-tagged miniapical domain on a Ni-NTA resin, then incubating with a phage library displaying 12-mer peptides on the phage surface. After washing and imidazole elution, the recovered phages were amplified by E. coli infection and three further such rounds of selection carried out. Forty-one phages were then randomly selected and their DNA characterized. The top five hits occurred more than once. These peptides were tagged with fluorescein and an anisotropy assay carried out to assess the affinity for the miniapical domain. One peptide bound considerably more strongly than the others and was termed the strong binding peptide (SBP), with a micromolar affinity for the miniapical domain. Both a GroES mobile loop peptide and the N-terminal tag peptide from the Buckle et al. experiment bound two orders of magnitude less strongly. The SBP sequence, SWMTTPWGFLHP, contains an unnatural amount of tryptophan (usually found at approximately the 1% level in natural proteins), supporting that hydrophobicity favors binding to the miniapical domain. Indeed the tryptophan fluorescence of the peptide exhibited both an intensity increase and a blue shift of the emission maximum (356–345 nm) upon incubation with the miniapical domain, suggesting exclusion from solvent upon binding (recall that GroEL lacks tryptophan).
The complex of miniapical domain and SBP crystallized in PEG4000 and produced monoclinic crystals, solved by molecular replacement, with four complexes in the asymmetric unit (PDB:1DKD). The GroEL apical fold was present in an unaltered state, and the SBP peptide was found as a β-hairpin (Fig. 98a) with the main chain of residues 7–12, WGFLHP, lying just outside of the helix H–I groove (in what would be the cavity of an intact GroEL ring). The general backbone trajectory of residues 7–12 of SBP matched those of the resolved tag segment in the miniapical crystallographic model of Buckle et al., and the GroES mobile loop distal segment in the GroEL/GroES/ADP7 structure of Xu et al. (Fig. 98a). At the next level of inspection (Fig. 98b), the side chains of SBP W7 and F9 inserted into contiguous hydrophobic pockets in the H–I groove, and L10 inserted into a shallower impression. Interestingly, the same contiguous pockets housed Val26 from the IVL sequence of the distal loop of GroES in the GroEL/GroES/ADP7 crystal structure (Fig. 98c), but despite the single hydrophobic insertion by GroES, sufficient binding energy was likely conferred, as was commented, by the seven-valent nature of GroES loop binding to the seven H–I grooves of the mobilized GroEL apical domains in a GroES-bound GroEL ring. SBP also formed a number of hydrogen bonds via its main chain with side chains of the binding surface, N265 and R268 (helix I), which could offer additional affinity to the interaction. In contrast, SBP residues 1–6 lay away from the surface (effectively in the cavity of an intact GroEL ring) and did not form contacts with the apical surface, but formed five hydrogen bonds to the distal residues of the SBP β-hairpin structure.
Interestingly, significant rms deviation of helices H and I was observed by Chen and Sigler within the standalone (P321) miniapical crystal structure, comparing the two members of the asymmetric unit, resembling rms deviation of H and I observed by Buckle et al. in their earlier study of tagged miniapical domain crystals. By contrast, the crystal of miniapical with SBP (P21 lattice) lacked such rms deviation (comparing the four members in the asymmetric unit). It was suggested, as in Buckle et al., that H–I helices exhibit inherent local flexibility that can putatively accommodate the various hydrophobic sequences associating with them. The exact adjustments that occurred with SBP binding, however, were not enumerated.
A crystal structure of SBP in complex with intact GroEL was also studied (Wang and Chen, Reference Wang and Chen2003; PDB:1MNF). Here SBP was incubated with GroEL and the mixture set up in the PEG condition that produced the P21 monoclinic lattice. This resolved GroEL/SBP14, that is, there was full occupancy with 14 SBP peptides per GroEL tetradecamer. Interestingly, the apical domain B factors of these crystals were reduced to 50% of those of GroEL standalone structures. The same topology of SBP at the apical face was observed as had been seen in the miniapical structures but, in addition, there were hydrogen bonds with the arginine residues at the edges of adjacent apical domains in the ring, between Ser1 of the peptide and R268 of the neighboring apical domain on one side, and between Pro6 of the peptide and R231 from the neighboring apical domain at the other side.
Multivalent binding of non-native substrate proteins by GroEL
Covalent rings
To address whether polypeptide binding to an open GroEL ring involved interaction with multiple surrounding apical domains, Farr et al. (Reference Farr, Furtak, Rowland, Ranson, Saibil, Kirchhausen and Horwich2000) produced rings of GroEL as single protein molecules by tandemizing seven GroEL subunits at the level of the coding sequence. This allowed them to program various arrangements of wild-type binding-proficient and mutant (V263S) binding-defective subunits, measuring the ability of the various constructs both to rescue growth in the setting of GroEL deficiency in vivo, and, once purified, to mediate substrate binding in vitro.
Because the N-terminus of the GroEL subunit is localized at the cavity-facing aspect of the GroEL ring and C-terminal tails are localized within the central cavity, it was reasoned that the flexible C-terminus of one subunit could be covalently joined to the N-terminus of another subunit without perturbing side-by-side subunit assembly in the ring, and thus covalent rings might be able to be produced. Thus, by joining GroEL coding sequences via short linkers containing unique restriction sites (to allow the precise exchange of wild-type for mutant coding units), a seven-subunit continuous coding sequence was constructed by adding one GroEL coding sequence at a time. When the tandemized construct of seven wild-type subunits was expressed in E. coli, double rings were formed. The wild-type expression construct could rescue the growth of GroEL-deficient E. coli. Further constructs incorporated various combinations and permutations of V263S and wild-type subunits (Fig. 99). It was observed that 3–4 consecutive wild-type subunits were required to rescue the growth of GroEL-deficient E. coli. Interrupted arrangements of wild-type subunits (e.g. two on one side of a ring and one at the opposite) were unable to rescue. Similarly, when the various tandemized GroELs were purified, the efficient binding of substrate proteins Rubisco, MDH, and rhodanese was likewise dependent on three or four consecutive wild-type subunits (Fig. 99).Footnote 55 Notably, when ATP/GroES was added to the various mutant binary complexes, the refolding yield paralleled the efficiency of binding.
Binding to GroEL rings with varying numbers and arrangements of binding-proficient wild-type subunits (open circles) and binding-defective V263S subunits (filled circles). Rings were produced as covalent assemblies from the expression of tandemized GroEL coding sequences in E. coli, followed by gentle PK clipping of the intersubunit connections after purification. Binding was scored as a percent of binding observed to a PK-clipped wild-type GroEL. A minimum of three consecutive wild-type GroEL subunits are required for efficient binding of Rubisco or MDH. From Farr et al. (Reference Farr, Furtak, Rowland, Ranson, Saibil, Kirchhausen and Horwich2000).

A direct physical association of GroEL-bound Rubisco with multiple GroEL apical domains was also demonstrated by a cysteine crosslinking experiment (Fig. 100). 35S-methionine-labeled Rubisco, containing five cysteines, was complexed with a non-tandemized GroEL mutant, T261C, containing a single apical cysteine in each subunit in helix I at the lateral edge of the apical polypeptide binding surface (in a GroEL with three Cys-to-Ala substitutions replacing the endogenous cysteines). The Cys261 mutant could rescue GroEL deficiency and exhibited normal in vitro binding and refolding of Rubisco. The number of air oxidation-produced crosslinks occurring between Rubisco and surrounding GroEL apical domains was assessed by the size of the complexes in a low percentage non-reducing SDS gel. A ladder of radiolabeled species was observed, and their sizes could be ascertained by comparing with protein markers composed of various numbers of tandemized GroEL subunits expressed and solubilized during the original covalent ring construction. Most Rubisco complexes contained more than one GroEL subunit (i.e. were >110 kDa; specifically Rubisco, 52 kDa, plus n × 58 kDa, where n = 2–5), and complexes with 2–4 crosslinked GroEL subunits comprised 70% of the total. This further supported that polypeptides are bound multivalently by the apical domains of a GroEL ring. The study also informed that bound polypeptide is flexible/weakly structured, allowing in this case cysteines at various locations along the Rubisco chain to contact apical domains at the 261 position with the correct stereochemistry to form a disulfide bond. This flexibility was supported by later NMR studies of isotopically-labeled substrate protein in binary complexes with perdeuterated GroEL (see page 97 below).
Physical association of GroEL-bound Rubisco with multiple surrounding subunits. Cysteine crosslinking, shown here schematically, was used to form covalent crosslinks in GroEL/Rubisco binary complexes between cysteine placed in the GroEL apical domains, at position 261 within the polypeptide binding surface, and the five cysteines in Rubisco. Air oxidation followed by NEM quenching produced large covalent molecules, as diagrammed, that could be resolved in non-reducing SDS-PAGE, thus scoring the number of crosslinked GroEL subunits by molecular mass (increments of ~60 kDa). In a typical experiment, 2–4 such crosslinks were observed (see text). Note that this indicates considerable flexibility of the bound Rubisco in order to allow correct stereochemistry for disulfide formation. From Farr et al. (Reference Farr, Furtak, Rowland, Ranson, Saibil, Kirchhausen and Horwich2000).

CryoEM observations
In 2005, Falke et al. (Reference Falke, Tama, Brooks, Gogol and Fischer2005) presented a cryoEM study of a binary complex of glutamine synthetase subunit (51 kDa) with GroEL at ~13 Å, showing a central density within the apical cavity of one GroEL ring, extending outward toward the apical binding surface. The density was symmetric because of the application of sevenfold symmetry during reconstruction.
In 2007, Elad et al. (Reference Elad, Farr, Clare, Orlova, Horwich and Saibil2007) presented a non-symmetrized cryoEM study of a binary complex of MDH with GroEL, observing several topologies of MDH electron density within the central cavity, the image classes all featuring contacts between MDH and multiple consecutive apical domains. Initial frozen grids prepared with GroEL/MDH binary complexes produced only end views of particles. Various manipulations were tested to produce side views. When GroEL particles were modified at the outside aspect of the cylinder by (non-perturbing) covalent attachment of 6-His tags at residue 473 (Cys substituted for Asp), this produced 50–80% particles that were on-side. A sevenfold symmetrized reconstruction was first carried out on 8000 particles, revealing a mass in the central cavity of one ring, abutting the apical domains at the level of helix I. This density represented only a small portion of the total mass of an MDH subunit, indicating helix I as a common site significantly occupied by the non-native substrate protein. With image classification by multivariate statistical analysis, structural variation could be distinguished from orientation differences and noise, and 40 000 particles were separated into major classes, of which three showed MDH in different positions in the cavity at ~10 Å resolution (Fig. 101). One class (top panel) exhibited density off of helix I and the underlying segment, extending downward into the cavity, with substrate spread across three consecutive apical domains. A second class (middle panel) extended downward from helices H and I and also spread across three apical domains. The third class (bottom panel) lay more external, at the inlet to the cavity, extending upward, contacting helices H and I, and spreading across four apical domins.
Non-native MDH bound to three or four consecutive apical domains of GroEL visualized by cryoEM. Maps of three image classes of GroEL–MDH complexes at 10–11 Å resolution at 0.5 FSC. Left: Side view cross-sections of three classes exhibiting substrate protein density, with arrows indicating the density of non-native MDH. Right: End views showing MDH density in the central cavity, abutting three or four consecutive apical domains. (See text for discussion of the image classes.) Taken from Elad et al. (Reference Elad, Farr, Clare, Orlova, Horwich and Saibil2007).

While a portion of non-native MDH localized against the apical binding surface, the localization of other portions within the central cavity of an open ring remained unresolved. [Recall that a small-angle neutron scattering experiment of Thiyagarajan et al. (Reference Thiyagarajan, Henderson and Joachimiak1996) had indicated that a portion of GroEL-bound rhodanese can localize outside the cavity in the bulk solution.]
To further address the positions of localization of bound non-native protein within the central cavity, independent of any need to accrete electron density, 35S-radiolabeled human DHFR containing a single cysteine at position 90 was bound to versions of GroEL devoid of the three endogenous cysteines but containing a single cysteine localized at various positions within the central cavity or on the outside surface of GroEL. Binary complexes between the radiolabeled DHFR and single cysteine GroELs were formed in reductant and then oxidized with diamide, alkylation carried out with iodoacetamide (to block unreacted SH groups), and the reactions were fractionated in an SDS gel to detect DHFR–GroEL adducts. Such adducts were readily observed when cysteine was situated anywhere within the central cavity, but not when cysteine was on the outside surface. In particular, oxidative crosslinking occurred when the cysteine was situtated in the apical face, on the top surface of the equatorial domain (which faces upward into the cavity), and at two positions within the flexible C-terminal tails. Thus, a non-native chain can explore the entire cavity space, with sufficient flexibility to produce the correct stereochemistry for disulfide bond formation.
Finally, because the cryoEM reconstructions of Elad et al. were not symmetrized, it was possible to evaluate whether there were adjustments of the ring itself upon binding a substrate protein. This analysis suggested that the apical domains contacted by bound MDH became ‘bunched’ together. This was not observed, however, in a later study of the large T4 capsid substrate protein, gp23 (56 kDa), complexed with GroEL, where the substrate protein contacted as many as five apical domains (Clare et al., Reference Clare, Bakkes, van Heerikhuizen, van der Vies and Saibil2009; EMDB 1544).
Fluorescence and EPR studies showing large-scale ‘stretching’ of non-native substrates upon binding to GroEL
In 2004, Lin and Rye (Reference Lin and Rye2004) reported on the binding of monomeric misfolded fluorescent-double-labeled Rubisco to GroEL. The investigators observed that by diluting Rubisco from denaturant at 4 °C to a final concentration of 100 nM in chloride-free low ionic strength buffer, the Rubisco would misfold as a monomer.Footnote 56
When GroEL/GroES/ATP were added to the mixture containing monomeric misfolded Rubisco at 4 °C, Rubisco was efficiently refolded with a half-time of ~20 min. It appeared that binding of the misfolded species by GroEL could remove it from a kinetically trapped state and enable productive folding. To address the conformational state of the misfolded species and its fate upon binding to GroEL, two fluorophores were site-specifically placed on Rubisco via substituted cysteines (without perturbation), a donor probe in the C-terminal region (AEDANS, residue 454) and and an acceptor probe in the N-terminal region (fluorescein, residue 58). The misfolded species in solution exhibited considerable FRET, reflecting a distance of ~37 Å between the probes, as compared with ~90 Å in the native monomer (Fig. 102). This suggested that the misfolded species was collapsed. Upon mixing the misfolded monomer with either GroEL or SR1, a significant decrease in FRET efficiency was observed in a ‘fast’ phase (~1 s in the case of GroEL; the rate was proportional to GroEL concentration), with a smaller further change over a ‘slow’ phase of minutes. The final apparent distances between the fluorophores were estimated as >70 Å for GroEL and 46–47 Å for SR1. The investigators thus concluded that binding to GroEL was associated with a large-scale ‘stretching’ action that rearranged the gross structure of non-native Rubisco to rescue intrachain misfolding.
Binding to an open GroEL ring exerts long-range ‘stretching’ action on Rubisco, as observed by FRET. With fluorescent probes placed on Rubisco near N- and C-termini, distances between these points could be determined in the states indicated. Most significantly, there is an increase of distance when a collapsed misfolded Rubisco monomer becomes bound to an open GroEL ring (see text), and likely a decrease of distance (compaction) when ATP/GroES bind to the binary complex. Adapted from Lin and Rye (Reference Lin and Rye2004), with permission from Elsevier, copyright 2004.

A later study of Sharma et al. (Reference Sharma, Chakraborty, Müller, Astola, Tang, Lamb, Hayer-Hartl and Hartl2008) using double fluorescent-labeled versions of DM-MBP, whose folding is GroEL/GroES/ATP-dependent, made observations similar to that of Lin and Rye. In an ensemble study, the substrate bearing a FRET pair (52–298) underwent a rapid collapse upon dilution from denaturant in the dead time of stopped-flow mixing (FRET efficiency change from ~0.1 to ~0.7) but then, if GroEL was present, underwent a subsequent loss of FRET (efficiency change 0.70–0.63 on the timescale of ~100–200 ms), reflecting presumed expansion. By contrast, in the absence of GroEL, the labeled DM-MBP remained collapsed (apparently misfolded).
A further study reported by Owenius et al. (Reference Owenius, Jarl, Jonsson, Carlsson and Hammarström2010) monitored by EPR the behavior of a doubly spin probe-labeled version of human carbonic anhydrase II, placing the labels on what corresponds in the native state to neighboring parallel β-strands in the core of the otherwise anti-parallel 10-stranded β-sheet protein. Binding to GroEL was associated with distance change from ~8 Å (~14 Å minor population) to 17 Å or greater, reflecting that, at minimum, this topological breakpoint in the protein had been stretched.
NMR observation of GroEL-bound human DHFR – lack of stable secondary or tertiary structure
In 2005, Horst et al. (Reference Horst, Bertelsen, Fiaux, Wider, Horwich and Wüthrich2005) reported on direct NMR observation of uniformly 15N-labeled or 15N-leucine-labeled human DHFR (~80% deuterated) in a binary complex with GroEL or SR1. A number of different 2D TROSY experiments were carried out, with the highest sensitivity obtained from 2D [15N,-1H]-CRINEPT-HMQC-[1H]-TROSY (of SR1/hDHFR binary complex). Only small chemical shift dispersion was observed, with the signals appearing in the random coil region of the spectrum. This indicated that the bound hDHFR did not exhibit stable secondary or tertiary structure. Line broadening was also observed in both dimensions, reflecting three possibilities: millisecond timescale internal motions of hDHFR, different conformations of hDHFR, or slow overall tumbling of the binary complex. To further analyze the dynamics of bound hDHFR, 15N-selected 1D 1H spectra of SR1/15N hDHFR were measured, using either CRIPT or INEPT magnetization transfer steps. If hDHFR were rigidly bound to SR1, the signals should exhibit equal signal strength, but INEPT produced a nearly threefold greater signal intensity, suggesting internal mobility of hDHFR relative to SR1. Model calculations over a range of different relaxation parameters supported the likelihood of slow internal motions of hDHFR. Overall, motions were judged to occur across a broad range, with correlation times in the microsecond to millisecond time range but also in the picosecond to nanosecond range.
For both uniformly labeled and leucine-labeled hDHFR, only a portion of the expected resonance intensity was observed (e.g. in the region of Gln and Asn), estimated as possibly comprising only ~25% of the backbone 15NHs, although an overlap of peaks prevented the number of resonances from being determined. Thus, it was unclear whether the missing intensity represented extensive line broadening of backbone resonances, producing low intensity, versus observation of only a subset of signals corresponding to discrete parts of hDHFR. An attempt was made to resolve this by leucine-specific labeling of hDHFR (19 leucines) but, once again, an overlap of resonances prevented a clear distinction.
When ATP and GroES were added to the binary complexes, hDHFR was recovered in its native state exhibiting dispersed spectra corresponding to those reported earlier for native hDHFR. This supported the physiological significance of the binary complexes.Footnote 57
‘Trans-only’ GroEL complexes with GroES tightly tethered to one GroEL ring and thus only able to bind and release substrate protein from the opposite open ring are inefficient in supporting folding in vitro and, correspondingly, in vivo, a trans-only-encoding construct only weakly rescues GroEL-deficient E. coli
In 2003, Farr et al. (Reference Farr, Fenton, Chaudhuri, Clare, Saibil and Horwich2003) reported on the behavior in folding of stable trans complexes in which GroES was covalently attached to one GroEL ring (see Fig. 103 left). These complexes could only accept a non-native protein into the open GroEL ring opposite to the GroES-attached ring, because GroES was tightly tethered and sterically blocked the entry of polypeptide into the cavity of the GroES-attached ring, as shown by EM (see Fig. 103 right). The ability of the GroES-attached GroEL ring to nonetheless follow a normal nucleotide cycle (including nucleotide-induced GroES association, as indicated by dome formation of the tethered GroES in the presence of ADP; see Fig. 103, far right), implied the ability to cycle substrate polypeptide on and off of the open (trans) ring. This resembled the (required) behavior of ATP/GroES in trans in discharging the large substrate protein aconitase (82 kDa) from an open ring (Chaudhuri et al., Reference Chaudhuri, Farr, Fenton, Rospert and Horwich2001). That is, aconitase is too large to be cis-encapsulated, and is released by binding ATP/GroES in trans.
Production of a trans-only complex for assessing whether productive folding can occur in the absence of cis complex formation. GroES was tightly tethered to a GroEL ring at the outside aspect of an asymmetric GroEL/GroES/ADP complex. The tether was composed of ser-gly-gly-ser-gly-gly-cys extension of the GroES C-terminus (which points into the bulk solution in the natural form; the extension was programmed at the level of the coding sequence) and homobifunctional crosslinking via BM(PEO)3 between the engineered C-terminal cysteine and an apical-substituted 315C GroEL (see schematic at left). On average, one tether was joined per complex between the extended GroES and 315C-GroEL. Right: Three images of the trans-only complex in the absence of nucleotide. Note GroES density at one end and that the associated ring has the appearance of an unliganded complex (‘brick’). Far right: Two negative stain EM images of trans-only incubated with ADP, showing a typical asymmetric complex with domed apical domains of cis ring. From Farr et al. (Reference Farr, Fenton, Chaudhuri, Clare, Saibil and Horwich2003).

In vitro study of trans-only
For in vitro studies, two Ser-Gly-Gly tripeptide repeats were added at the coding sequence level to the C-terminus of GroES, followed by a cysteine (non-perturbing to GroES-assisted reactions). This was then used with a homobifunctional crosslinker [BM(PEO)3] to link GroES through the C-terminal cysteine of its tag to GroEL Asn315Cys at the outer aspect of the apical domain, a distance of ~40 Å. This compares with a distance measured from the model of GroEL/GroES/ADP7 of 36 Å (Fig. 103a). To crosslink only one GroEL ring, crosslinking was carried out on asymmetric GroEL315C–GroES–SGGSGGC complexes formed in ADP. EM side views of the purified complexes confirmed the presence of GroES juxtaposed to one ring of a GroEL ‘brick’ (unliganded symmetric particle) in the absence of nucleotide, and forming a domed GroEL cis ring in the presence of ADP. On average, approximately one crosslink per particle was observed, as determined by SDS gel analysis. Further tests revealed that substrate protein could not enter the tethered GroEL ring. For example, the untethered ring could be first ‘marked’ by PK clipping in the presence of ADP, and then MDH bearing a radioiodinated hit and run-crosslinker bound as substrate (see Weissman et al., Reference Weissman, Hohl, Kovalenko, Kashi, Chen, Braig, Saibil, Fenton and Horwich1995, and Fig. 57). Photocrosslinking, reduction (to release the crosslinker from GroEL), and SDS gel analysis revealed crosslinking only to the clipped, untethered, ring.
The trans-only complexes were then tested in in vitro refolding assays. First, the large substrate aconitase was tested, whose folding can only occur in trans. Its kinetics of refolding by addition of ATP (absent any additional GroES) was identical to that mediated by GroEL/GroES/ATP. Next, binary complexes were formed with Rubisco or MDH, ATP was added, and recovery of activity measured. In the case of Rubisco (Fig. 104), in a GroEL/GroES/ATP reaction, there was nearly complete recovery by 15 min, whereas only ~20% of Rubisco was refolded by trans only/ATP. The trans-only reaction continued beyond 15 min to produce native Rubisco, but plateaued at ~40% by 1 h. The rate of folding of Rubisco by wild-type GroEL/GroES/ATP was estimated to be 4–6 times greater than trans only. Thus, in vitro, the repeated binding and release of non-native Rubisco from an open ring, without cis encapsulation, is capable of producing the native state, but at a significantly slower rate and with reduced yield. This suggests that cycles of binding to an open GroEL ring, associated with the unfolding of kinetically trapped states (e.g. Lin and Rye, Reference Lin and Rye2004), followed by release back into the bulk solution, is a relatively inefficient mechanism of refolding. It avails of the benefit of capture by an open ring, which is, to a certain extent, sufficient to prevent aggregation and allow some fraction of substrate molecules to eventually, with enough cycles, find the route to the native state.Footnote 58 A mechanism that relies solely on binding/unfolding by an open ring is considerably improved upon, however, by ATP/GroES binding to the same ring as substrate protein attended by release into the cis cavity with subsequent folding in the cis chamber (when polypeptide substrate is of a size to allow encapsulation to occur).
Trans-only/ATP compared with GroEL/GroES/ATP produces a substantially slower rate (~20%) and extent (~40%) of recovery of native Rubisco. Taken from Farr et al. (Reference Farr, Fenton, Chaudhuri, Clare, Saibil and Horwich2003).

In vivo test of trans-only
Trans-only action was also tested in vivo by the production of a plasmid construct in which two GroEL subunits were first adjoined at the coding sequence level by connecting the C-terminal tail of one to the N-terminus of a second. Remarkably, when overexpressed in E. coli, this efficiently produced intact tetradecamers of GroEL, as viewed in EM of the purified molecules. This implied that at least one or more subunits must be arranged in a ring-to-ring topology as opposed to strictly side-by-side within a ring (which could not account for a 7 × 2 structure). The tetradecamers of trans-only in vivo were fully functional in vitro, in the presence of GroES and ATP, to mediate efficient refolding of stringent GroEL/GroES-dependent substrates such as MDH and Rubisco. The dimer could also rescue in vivo when its coding region was placed into a groESL-encoding plasmid, rescuing groE-deficient cells (LG6 strain). Considering these observations, a further extension was built at the coding sequence level, between the GroEL C-terminus (of the C-tail of the second GroEL subunit of the covalent dimer) and N-terminus of GroES, composed of 34 codons with a repeating ser-gly-gly repeat interspersed with basic residues and totaling ~100 Å length. When this GroEL–GroEL–GroES fusion construct was overexpressed in E. coli, it produced an ~120 kDa species observed in SDS gels that, in EM, revealed, as with the in vitro construct, a brick-like symmetric GroEL with a GroES juxtaposed to one ring in the absence of nucleotide, and a domed GroES-bound ring in the presence of ADP. When the open ring was ‘marked’ by PK clipping of its tails, and as before, crosslinker-bearing substrate allowed to bind following dilution from denaturant followed by photocrosslinking, it crosslinked only to the clipped open ring.
The transinvivo plasmid was then tested for ability, when expressed from a leaky trc promoter (no induction), to rescue GroEL-depleted E. coli (LG6 strain). Plating mock transformants in the absence of ITPG, no colonies were observed. When a plasmid containing the wild-type operon was transformed, there was efficient rescue – large numbers of colonies of substantial size. This result obtained also with the plasmid containing the groE operon expressing GroES (unfused) and the covalent GroEL dimer. In contrast, transinvivo transformants, while plating with the same efficiency as the others, produced only tiny colonies, one-tenth the size of the wild-type-rescued ones. This paralleled the in vitro observations, supporting that trans-only binding and release of GroEL substrate proteins can provide only some degree of folding function to the various obligatory substrates in vivo, but cannot reach the level of function produced by the additional feature of cis complex formation.
XXX. Later studies of cis folding and release into the bulk solution of substrate protein
Further kinetic analysis of MDH – folding occurs at GroEL/GroES, not in the bulk solution
In 1997, Ranson et al. (Reference Ranson, Burston and Clarke1997) reported additional kinetic studies of MDH. They addressed whether folding occurs in association with GroEL/GroES versus in the bulk solution. They provided increasing concentrations of GroEL/GroES (in 1:2 molar ratio) relative to MDH (fixed at 1 µM) and measured the rates for achieving active MDH (Fig. 105). The maximal rate was achieved at 1.3:1 GroEL:MDH and did not change at higher ratios. The data were fit to a tight ligand binding equation and gave a value for the apparent dissociation constant for MDH of 10 nM (taken simply to describe the distribution of MDH between the bulk solution and bound). If folding was occurring only in the bulk solution, then increasing the concentration of GroEL to the maximum achievable should have inhibited folding ([GroEL] reaching 40-fold relative to MDH in these experiments). In quantitative terms, with the GroEL concentration at 40 µM and K d′ = 10 nM and assuming that the steps of MDH binding and release are fast (i.e. in a rapid equilibrium) relative to the time of folding, then a derived equation for the kinetics of folding exclusively in the bulk solution would give a half-time for folding of 23 days. In contrast, the data showed no inhibition of the rate of recovery of native MDH, which had a half-time of ~10 min, even at a 40:1 molar ratio of GroEL:MDH. Thus, this kinetic data added to the physical evidence that productive folding occurs in association with GroEL/GroES.
Rate of folding of MDH as a function of GroEL to MDH ratio. A fixed concentration (1 µM) of denatured MDH was diluted into varying concentrations of GroEL, maintaining a twofold molar excess of GroES, in the presence of ATP, and first-order rates of refolding were determined. Note that GroEL concentration (=GroEL/mMDH ratio because MDH is in all cases 1 µM) is plotted on the abscissa. Note that the rate of MDH refolding does not increase with a ratio beyond ~1.3. Reprinted from Ranson et al. (Reference Ranson, Burston and Clarke1997), with permission from Elsevier, copyright 1997.

In a second analysis, the investigators also revisited trap experiments to measure the rate of dissociation of non-native MDH from GroEL/GroES. A dissociation rate of 0.036 s−1 was measured, ~25-fold faster than the rate of MDH refolding. This dissociation rate matched the rate of ATP turnover by GroEL/GroES and the rate of departure of GroES from GroEL (Burston et al., Reference Burston, Ranson and Clarke1995). This further supported that the substrate leaves at each round of the reaction cycle, whether native or not, and indicated that only ~4% of MDH reaches the native state at each round.
Non-native protein released into the bulk solution and prevented from binding to GroEL by acute blockage of open rings does not proceed to the native state in the bulk solution
In 2001, Brinker et al. (Reference Brinker, Pfeifer, Kerner, Naylor, Hartl and Hayer-Hartl2001) reported an ingenious experiment in which they rapidly blocked the access of released non-native substrate protein to the central cavity of open rings during GroEL/GroES-mediated folding. Access to open rings was blocked by carrying out folding with a GroEL modified with a strategically-placed biotin and acutely adding streptavidin. This prevented non-native polypeptide released into the bulk solution during the reaction from reassociating with open rings of GroEL, and allowed the assessment of whether substrate protein in the bulk solution could proceed to the native state.
A cysteine residue was substituted for Asn 229 at one edge of the polypeptide binding surface, positioned in a loop adjoining inlet helix H (233–242), in a background of Cys-to-Ala-substitution (C138A, C458A, C519A). Biotin maleimide was covalently linked to the cysteines of Cys229 GroEL, and the modified molecule was observed to be fully functional in rhodanese binding and ATP/GroES-dependent rhodanese refolding. When tetrameric streptavidin (4 × ~13 kDa) was incubated with the biotin-labeled GroEL, it associated in <1 s as judged by the loss of Trp fluorescence of the streptavidin, and this blocked the central cavity, as observed in EM (Fig. 106; two or three molecules of streptavidin were bound per ring). Consistent with the obstruction of the cavity, the streptavidin-complexed GroEL could not bind an Alexa488-labeled rhodanese as judged by gel filtration.
Acute occlusion of the central cavity of GroEL with streptavidin via addition to strategically biotinylated-N229C GroEL. Negative stain EM images (end views) of biotinylated-N229C GroEL (left) and N229C-biotin after incubation with tetrameric streptavidin (right). Adapted from Brinker et al. (Reference Brinker, Pfeifer, Kerner, Naylor, Hartl and Hayer-Hartl2001), with permission from Elsevier, copyright 2001.

Streptavidin was added to biotin-Cys229GroEL/GroES/ATP reactions during refolding of Rubisco or rhodanese (under non-permissive conditions, where spontaneous refolding does not occur) after 45 or 90 s (Fig. 107 for 90 s). This uniformly halted further refolding. In the case of Rubisco, the halt was instantaneous and complete, suggesting that there is no acquisition of native form occurring in the bulk solution. Thus, if 5–10% of Rubisco reaches native form at each round of the reaction cycle (with 10–20 cycles required to refold a stoichiometric amount of input Rubisco), then this material must be reaching that state inside the cis cavity prior to release (not in the bulk solution). In the case of rhodanese, following streptavidin addition, 5–10% continued to slowly reach native form over ~20 min. This might reflect a slow partitioning of misfolded rhodanese in the solution to conformers that could ultimately reach the native form. The timescale of recovery, however, was not physiological. That is, the ~20 min time period produced an amount of native protein normally recovered in one 20 s round of a cycling reaction; thus, the reaction is ~60 times slower than normal. Thus, overall, a failure here of any timely recovery of the native state of two GroEL/GroES-dependent substrates in the bulk solution agrees with the physical and kinetic observations that placed the recovery of the native state (or commitment to rapidly achieving it) in the cis cavity.
Prevention of rebinding of released non-native substrate protein to open GroEL rings, via an acute block of access to the central cavity by addition of tetrameric streptavidin to the 229C-biotinylated version of GroEL, produces immediate halt of GroEL/GroES/ATP-mediated Rubisco refolding and nearly complete halt of rhodanese refolding. Streptavidin was added 90 s after the start of a standard folding reaction (black circles). Adapted from Brinker et al. (Reference Brinker, Pfeifer, Kerner, Naylor, Hartl and Hayer-Hartl2001), with permission from Elsevier, copyright 2001.

XXXI. Rates of folding to the native state in the cis chamber relative to folding in free solution under permissive conditions
Further consideration of non-permissive and permissive conditions
Given that most natural GroEL/GroES-dependent substrate proteins have been reliably identified in vivo by their insolubility in the setting of groE depletion (Fujiwara et al., Reference Fujiwara, Ishihama, Nakahigashi, Soga and Taguchi2010; a few were degraded), it seems, by definition, that non-permissive conditions for such substrate proteins prevail in vivo (i.e., these proteins would not efficiently reach native form in vivo in the absence of groE). However, in vitro conditions can be identified where either spontaneous folding or GroEL/GroES-assisted folding can occur (‘permissive’ conditions, as described by Schmidt et al., Reference Schmidt, Buchner, Todd, Lorimer and Viitanen1994). Such conditions typically involve lowering temperature or reducing the concentration of substrate protein, both of which, notably, reduce the occurrence of aggregation. Nevertheless, it has remained of interest to assess whether the cis folding chamber of GroEL/GroES has a role that could go beyond that of allowing folding in isolation where aggregation cannot occur. The comparison of folding rates of monomeric substrate polypeptides under permissive conditions in free solution versus the cis cavity allows such assessment.
Theoretical considerations
A number of theoretical considerations and simulations have suggested that confinement in a chamber might accelerate the rate of folding to native form relative to spontaneous folding under infinite dilution conditions (e.g. Betancourt and Thirumalai, Reference Betancourt and Thirumalai1999; Baumketner et al., Reference Baumketner, Jewett and Shea2003; Takagi et al., Reference Takagi, Koga and Takada2003). An obvious potential effect of confinement is the reduction of polypeptide chain entropy. This might be particularly relevant if there are substrate proteins that do not rapidly collapse upon release from the cis cavity wall. Another potential influence is the substantial electrostatic character of the cavity surface. Either of these influences or others, if operative, could, in effect, change the energy landscape of polypeptide folding in cis versus solution. Of course, the net effects could either favor or disfavor the rate of recovery of the native state.
Experimental work – overview
Experimental work, reviewed below, all necessarily carried out in vitro under a variety of permissive conditions, supports that the energy landscape can be altered relative to folding in solution for at least three substrate proteins. In the case of two of them, DM-MBP (at concentrations of 10 nM or below) and PepQ, an acceleration of folding to native form in the cis cavity relative to the free solution is observed. In these cases, it appears that a misfolded monomeric species observed in free solution slowly finds its way out of a kinetically trapped monomeric state to reach the native form, whereas folding of the monomer to native form at chaperonin is accelerated by the cis cavity. That is, in the cis cavity, the kinetically trapped monomer produced upon dilution from denaturant into the bulk solution is not substantially populated. Apparently, ejection off the cavity wall and/or a property of the cis cavity itself forestalls the production of the trapped state populated by dilution from GuHCl into the bulk solution. In a third case, rhodanese, there is deceleration of folding of one of its two domains in the cis cavity relative to folding at high dilution in solution under permissive conditions, but the overall rate of achieving native form is the same in cis as in free solution. The rhodanese study seems to suggest that the cis cavity is agnostic with respect to the rate of folding under permissive conditions. After all, the cavity itself almost certainly evolved under non-permissive conditions where folding in the absence of the chaperonin system would lead to essentially quantitative aggregation with little or no recovery of the native state. The cavity likely evolved to prevent such aggregation and loss during folding of a number of essential substrate proteins by isolating the folding of monomers of these species within the cis cavity [see the list of Fujiwara et al. (Reference Fujiwara, Ishihama, Nakahigashi, Soga and Taguchi2010), of E. coli proteins, including essential ones, dependent on groE, in Appendix 4]. The cavity size and wall character likely evolved as a compromise to allow the production of a sufficient native yield of each of the collective of these essential substrate proteins for the provision of overall survival (see e.g. Wang et al., Reference Wang, Herman, Tipton, Gross and Weissman2002, and page 109). Such adjustment presumably occurred without any pressure to optimize folding under conditions that would be permissive. Thus, assuming evolution occurred under non-permissive conditions, the question arises as to whether the acceleration of folding rate under permissive conditions could be a general byproduct of such evolution. Certainly, the number of substrates studied to date, under conditions where they remain as monomers in solution under permissive conditions, allowing rates to be directly compared, seems too small to draw any firm conclusions. (Note that even low-order aggregation of a substrate under study would comprise a kinetic detour, making a comparison of rates of folding in solution and in cis untenable.) It would be helpful to observe additional substrates from the list of Fujiwara et al. (Reference Fujiwara, Ishihama, Nakahigashi, Soga and Taguchi2010), which either remain monomeric in the solution at a relatively high concentration (like PepQ) or which could be studied under single-molecule conditions, for how they behave under permissive conditions.
Initial report of cis acceleration of folding relative to free in solution of a double mutant of MBP (DM-MBP) at 250 nM concentration, and report of acceleration of rhodanese refolding by duplication of the GroEL C-terminal tails
In 2006, Tang et al. (Reference Tang, Chang, Roeben, Wischnewski, Wischnewski, Kerner, Hartl and Hayer-Hartl2006) reported a series of experiments exploring the features of the cis chamber that might influence the rates of refolding therein. Two principal experiments were conducted, and major conclusions were drawn from each. In both cases, however, additional testing by others revealed that the conclusions did not seem warranted.
The first experiment examined refolding of a double mutant of the signal peptide-deleted (mature) maltose-binding protein (V8G/Y283D; DM-MBP). Under permissive conditions (0.25 µM, 25 °C), the protein could fully regain the native form either free in solution or with GroEL/GroES/ATP. The rate of refolding by GroEL/GroES/ATP, or by SR1/GroES/ATP, was 13-fold greater than observed in free solution (Fig. 108). This was attributed to the physical environment of the cis folding chamber.
Refolding of DM-MBP under permissive conditions – 250 nM, 25 °C – is more rapid in the presence of GroEL/GroES/ATP (upper panel, red) or SR1/GroES/ATP (lower, red) than spontaneous refolding (black). Note that the chaperonin reactions were commenced starting with binary complexes of DM-MBP bound to either GroEL or SR1, while spontaneous folding was commenced by dilution of DM-MBP from denaturant. Note that there is full recovery of the native state from both reactions. Adapted from Tang et al. (Reference Tang, Chang, Roeben, Wischnewski, Wischnewski, Kerner, Hartl and Hayer-Hartl2006), with permission from Elsevier, copyright 2006.

A second experiment altered the volume of the cis chamber by either deleting or multiplying the GGM repeat sequence comprising the C-terminal portion of the flexible GroEL C-terminal tails localized within the central cavity at the equatorial level. The sequence at the C-terminus is (GGM)4M in wild-type GroEL, and this sequence was either deleted or multiplied. Each such change (affecting all seven subunits per ring) was estimated to alter the cavity volume by ~4%. The tail-altered versions of GroEL were tested for the ability to encapsulate and fold rhodanese (33 kDa), DM-MBP (41 kDa), and Rubisco (51 kDa). Encapsulation by nucleotide/GroES was unaffected except for Rubisco, the largest of the substrates, whose efficiency of encapsulation was reduced with duplicated tails and strongly reduced with triplicated tails. The rate of rhodanese refolding by GroEL with duplicated tails was increased relative to wild-type GroEL by ~50%, interpreted as an effect of spatial confinement enhancing the rate of folding. With triplication, the rate of rhodanese folding was equal to that of wild-type, and with quadruplication, there was strong inhibition. In the cases of both DM-MBP and Rubisco, there was a drop of rate with tail duplication, relative to wild-type, and a stronger drop with triplication. The data for the three substrates were explained as a reflection of steric confinement which could produce a ‘rate acceleration of folding with increasing confinement up to a point where further restriction in space would limit necessary reconfiguration steps.’
Faster refolding of 100 nM DM-MBP at GroEL/GroES/ATP or SR1/GroES/ATP as compared with solution is associated with reversible aggregation in free solution
In 2008, Apetri and Horwich (Reference Apetri and Horwich2008) reported a similar 10-fold faster rate of DM-MBP refolding by GroEL/GroES/ATP or SR1/GroES/ATP relative to that in free solution (Fig. 109a; DM-MBP at 0.1 µM, 25 °C). When they carried out dynamic light scattering on the spontaneous reaction, they observed light scattering immediately upon 100-fold dilution (to 0.1 µM) from denaturant (Fig. 109b), whereas none occurred with wild-type MBP (Fig. 109b), which refolds rapidly and spontaneously. This supported that the mutant protein proceeds to aggregate in free solution (but reversibly, because there is ultimately full renaturation). The rate of spontaneous refolding of DM-MBP was significantly reduced as the concentration of DM-MBP was increased (Fig. 109c), a hallmark of aggregation behavior (see Silow and Oliveberg, Reference Silow and Oliveberg1997). Most revealing, when DM-MBP was diluted from denaturant into a chloride-free buffer, light scattering no longer occurred (Fig. 110a). In the absence of aggregation, the rate of DM-MBP refolding in the solution was now precisely equal to that at GroEL/GroES or SR1/GroES (Fig. 110b). Thus, at least with permissive conditions and an even lower concentration of DM-MBP than used in Tang et al., the faster rate of folding at GroEL/GroES was due to reversible aggregation of the protein in free solution.Footnote 59
Slower spontaneous refolding of DM-MBP than chaperonin-mediated under permissive conditions is due to the occurrence of reversible aggregation in free solution. (a) At 100 nM DM-MBP, 25 °C, spontaneous refolding in free solution (black) is 6–8-fold slower (see rate constants) than GroEL/GroES/ATP-mediated or SR1/GroES/ATP-mediated folding (red,blue). (b) Slowed refolding in solution is the result of off-pathway (reversible) aggregation, as shown by dynamic light scattering of solutions of DM-MBP during spontaneous refolding. (Note that wt-MBP does not produce such scattering during its refolding.) (c) Further evidence of off-pathway aggregation behavior is the concentration dependence of spontaneous refolding rate on DM-MBP concentration, with a reduced rate of recovery as the concentration of DM-MBP is increased. (d) Note that wild-type MBP, which did not produce light scattering during refolding, does not exhibit concentration dependence of its rate of recovery. From Apetri and Horwich (Reference Apetri and Horwich2008); copyright 2008, National Academy of Sciences USA.

Abolition of aggregation of DM-MBP in the spontaneous refolding reaction is associated with an increase of refolding rate to match that of the GroEL/GroES/ATP or SR1/GroES/ATP reactions. (a) The omission of chloride ions from the spontaneous DM-MBP refolding mixture abolishes aggregation, as shown by dynamic light scattering. Chloride was replaced with acetate anions. (b) Rate of DM-MBP refolding in the absence of chloride ions in free solution (black) becomes equal to that with GroEL/GroES/ATP or SR1/GroES/ATP (red, blue). From Apetri and Horwich (Reference Apetri and Horwich2008); copyright 2008, National Academy of Sciences USA.

GroEL tail multiplication does not affect the rate of folding in the cis cavity but instead affects the lifetime of the cis complex by perturbing ATPase activity and the rate of GroEL/GroES cycling
In 2007, Farr et al. (Reference Farr, Fenton and Horwich2007) reported further studies of tail-multiplied GroELs. First, they reasoned that if cis cavity volume alteration is the site of the effect of tail multiplication, then the rate of folding by stable cis complexes formed with tail-multiplied SR1 and ATP/GroES should be similarly affected. No effect was observed, however. The rates of folding of rhodanese (33 kDa) (Fig. 111a), MDH (33 kDa), and Rubisco (51 kDa) inside the tail-multiplied SR1/GroES complexes were the same as with unmodified SR1 and GroES. In particular, rhodanese refolding was not accelerated by duplication of the C-terminal tail of SR1 (Fig. 111a), and the rates of refolding of the three substrates were not reduced upon tail duplication or triplication.
Multiplication of the GroEL C-terminal (GGM)4 tails does not affect the rate of folding in the cis cavity but instead affects the lifetime of the cis complex by perturbing ATPase activity. (a) No effect of tail multiplication on refolding mediated in the stable cis chamber of SR1/GroES derivatives (tail duplication, SR-T2; tail triplication, SR-T3). (b) Tail multiplication progressively increases the rate of ATP turnover by GroEL double ring (black bars) and GroEL/GroES (open bars), but has no effect on SR1 (which undergoes a single round of ATP turnover after forming the SR1/GroES obligate cis complex). Thus, it is a disturbance of the cis dwell time in the cycling complexes and not the rate of intrinsic folding in the cis chamber that is affected by tail multiplication of GroEL (see text). From Farr et al. (Reference Farr, Fenton and Horwich2007); copyright 2007, National Academy of Sciences USA.

It thus appeared that the effects of tail multiplication at GroEL might lie with altered rates of cycling of GroEL/GroES. Indeed, when steady-state ATPase rates were measured for the tail-multiplied GroELs, both in the presence and absence of GroES, the rate of ATP turnover was found to scale with the number of tails (Fig. 111b): tail duplication increased the rate by >50% over wild-type; and triplication nearly tripled the rate over wild-type. When GroES was added to the GroEL derivatives, the rate of ATP turnover particular to each derivative was reduced by ~50%, resembling the effect on wild-type. By comparison, the tail-deleted and tail-multiplied versions of SR1 exhibited the same rate of steady-state ATP turnover as the SR1 parent. For all of the SR1 versions, the addition of GroES abolished ATP turnover, consistent with the early observation that, upon binding GroES in the presence of ATP, SR1 undergoes only a single round of ATP hydrolysis and is then stable as an SR1/GroES/ADP complex. These results thus indicated that it is not the rate of cis cavity folding that is affected at the GroEL derivatives, but rather it is the cis cavity dwell time that is affected, as the result of altered rates of ATP turnover. That is, because the longest phase of the GroEL/GroES reaction cycle at wild-type GroEL is the cis ATP-bound folding-productive phase, ended by ATP hydrolysis (see Rye et al., Reference Rye, Roseman, Chen, Furtak, Fenton, Saibil and Horwich1999), then, with faster ATP turnover, the cis lifetime will be correspondingly reduced. As observed in other studies where the ATP hydrolysis ‘timer’ is affected (see Wang et al., Reference Wang, Herman, Tipton, Gross and Weissman2002; Madan et al., Reference Madan, Lin and Rye2008), this affects the rate of productive folding.
Variable effects of experiments switching negatively charged residues of the cis cavity wall to positive to remove its net negative charge
A third test carried out by Tang et al. (Reference Tang, Chang, Roeben, Wischnewski, Wischnewski, Kerner, Hartl and Hayer-Hartl2006) was aimed at adjusting the net charge of the cis cavity wall. The cis cavity of a GroEL/GroES ring presents 189 negatively charged side chains and 147 positively charged ones, with a net negative charge of −42. This charge was suggested to potentially mediate a repulsion of most E. coli proteins, whose pIs are generally below 7. The effect of abrogating this net negative charge was assessed by producing mutants of SR1. Simultaneous cavity wall triple acidic-to-lysine substitutions in a short stretch of the primary sequence were made. The mutant called SR-KKK2, containing substitutions D359K/D361K/E363K, appeared to exhibit strong effects on the folding of DM-MBP and Rubisco. This could have been predicted from the earlier study of Fenton et al. (Reference Fenton, Kashi, Furtak and Horwich1994), where it had already been observed that the single substitution, D361K, in the context of GroEL double ring, impaired GroES binding, as judged by the failure of 35S-GroES to stably associate with the mutant complex in ADP (measured by gel filtration in ADP). As a result, there was a failure of OTC to be released from a D361K/OTC binary complex by ATP/GroES, as observed by sucrose gradient cosedimentation of OTC with D361K. D361K was thus concluded to be unable to release OTC as the result of an inability to form a cis ternary complex. Curiously, in the Tang et al. study, the investigators presented data that indicated efficient encapsulation of substrate proteins (DM-MBP and Rubisco) by the SR-KKK2 mutant. On the other hand, in line with the result of Fenton et al., Motojima et al. (Reference Motojima, Motojima-Miyazaki and Yoshida2012) reported the failure of SR-KKK2 to stably bind GroES under the conditions reported by Tang et al. Instead, a cycling reaction was observed, where initially-bound DM-MBP was released into solution and could slowly fold therein instead of remaining strictly in a stable cis chamber (where cis folding rate measurements could be taken).
When Motojima et al. employed urea denaturation of substrate protein, avoiding any effect of residual GuHCl carrying over from binary complex formation to destabilize GroES binding, stable cis SR-KKK2/GroES/ATP complexes were formed, and now the rates of cis folding could be measured. The rates of folding of both DM-MBP and Rubisco were reduced by ~50% inside SR-KKK2/GroES relative to SR1/GroES. In contrast, both rhodanese and GFP refolded at the same rate as at SR1/GroES. While DM-MBP and Rubisco have calculated pIs lower than that of rhodanese (4.9 and 5.5 versus 6.9), that of GFP is not very much greater (5.8). Thus, it seems at best tentative to conclude that there might be a modest effect of replacing the acidic residues of 359/361/363 with lysines on the rate of cis refolding of some proteins. It remains troubling, however, to consider the profound effect of just a single one of the three substitutions (D361K) on GroES encapsulation in the Fenton et al. study. As opposed to a conclusion concerning net negative charge of the cavity wall, perturbed kinetics of cis complex formation might just as easily explain the result, particularly considering that smaller sizes of rhodanese (33 kDa) and GFP (27 kDa) might dispose them to easier encapsulation than DM-MBP (41 kDa) and Rubisco (51 kDa).
Same folding trajectory of human DHFR inside SR1/GroES as in free solution
In 2007, Horst et al. (Reference Horst, Fenton, Englander, Wüthrich and Horwich2007) reported a hydrogen–deuterium exchange experiment comparing folding of human DHFR in the cis cavity of SR1/GroES with folding in free solution. This experiment sought to address whether the cis cavity produces a distinctly different folding trajectory than free solution. The experiment was carried out at pH 6.0 and 15 °C, which comprised a ‘semi-permissive’ condition. That is, under these conditions, the chaperonin reaction at either GroEL or SR1 required GroES/ATP, whereas addition of ATP alone was unable to produce the native state; and folding in free solution under these conditions exhibited a similar rate of recovery as with the chaperonin system but the extent of recovery was only ~40%, with sedimented aggregates readily observed in the scaled-up reaction used for HX/NMR.
For HD exchange measurements of folding trajectory, folding was commenced in H2O, either by ATP/GroES-mediated release of 15N-labeled hDHFR into the cis cavity of SR1 or by dilution of 15N-labeled hDHFR (to 2.3 µM) from 6 M GuHCl into free solution (Fig. 112). At various time points (15, 25, 60, 120 s), 10 volumes of D2O were added and the reactions allowed to proceed to the native state. MTX was present in both reaction mixtures to stabilize the native state [preventing unfolding, which could otherwise occur in the absence of ligand, as in Viitanen et al. (1991), and would lead to back-exchange of protonated regions to deuterated]. Native 15N-DHFR was recovered and assessed by 2D [15N,1H] HSQC NMR, analyzing 51 assigned crosspeaks of native hDHFR for the level of protonation.Footnote 60 Both the chaperonin and solution reaction exhibited substantial protection of the central β-sheet by 15 s (strands E and F), and for both reactions, there was an increase of protection in this region by 120 s with similar protection of additional scorable regions. Overall, it appeared that the mechanism of folding in the two settings was the same, but the efficiency was different, with aggregation significantly occurring in the spontaneous reaction (reducing its yield) but not in the cis folding reaction.
Comparing the trajectory of refolding of human 15N-labeled DHFR in the stable SR1/GroES cis cavity with folding in free solution, by measurement of protection from hydrogen–deuterium exchange and NMR. Experimental design, showing that at time points during either folding reaction, initiated in H2O, a 10-fold volume of D2O is added, the protein is allowed to reach the native form, and a 2D [1H,15N] HSQC spectrum is collected (scoring previously assigned amide proton resonances for the extent of protonation). Black ‘H’, exchangeable proton; red ‘H’, non-exchangeable proton; D, deuteron. From Horst et al. (Reference Horst, Fenton, Englander, Wüthrich and Horwich2007); copyright 2007, National Academy of Sciences USA.

Conformational ‘editing’ in the cis cavity – disulfide reporting on refolding of trypsinogen under non-permissive conditions
Park et al. (Reference Park, Fenton and Horwich2007) studied the six-disulfide bond monomeric secretory protein, trypsinogen (TG), the 24 kDa pro-form of trypsin, composed of two orthogonal β-barrels (PDB: 1TGS), that, starting from the fully reduced form in 6 M urea, behaved, when provided with a GSH/GSSG redox pair, as absolutely dependent on GroEL/GroES/ATP for refolding in vitro.Footnote 61 Notably, the two β-barrels are linked at opposite aspects of the protein by long-range disulfide bonds (C1–C6 and C4–C12; see view in Fig. 113). In short times of cis folding (5 min, 20 °C), mostly short-range disulfides, both native and non-native, were formed, along with one medium-range non-native bond. By 15 min into the reaction, the two long-range disulfide bonds pinning the two β-barrels together began to appear. By 30 min (t ½), two medium-range non-native bonds were also observed. A final event was the formation of a mid-range (intra-barrel) C5–C10 native bond, not present in any of the intermediate forms but present in the final native state. Interestingly, aggregates of trypsinogen, produced during spontaneous folding (in the presence of the redox pair) within 30 s, exhibited only short-range intramolecular native and non-native disulfide bonds. Intermolecular disulfides were not observed in the aggregate material. Of particular interest, only the native long-range disulfide bonds were produced in the cis cavity, despite that many other non-native long-range bonds could have formed, extending, e.g. from ‘top’ to ‘bottom’ or barrel-to-barrel (as shown in the view in Fig. 113). The basis for native preference is unknown. Given that the long-range bond formation occurs fairly well into the reaction, the individual barrels may collapse/fold independently of one another during the opening minutes of folding, prefiguring the correct long-range interactions. Of course, in evolutionary terms, TG, as a secretory protein, has never seen GroEL, so a coevolved ‘fit’ seems excluded. In contrast with long-range bonds, however, it seems clear that short- and medium-range non-native bonds within the barrels can be formed early and then can be ‘edited’ to native ones as folding proceeds in the cis cavity.
Trypsinogen, a monomeric secretory protein, behaves as a stringent, GroEL/GroES-dependent substrate protein in vitro in the presence of a GSH/GSSG redox pair, with six disulfide bonds in the native state that serve to inform about the topology of the protein during refolding in the cis cavity of SR1/GroES. Ribbon diagram of native trypsinogen and a linear schematic of the disulfide bonds colored according to the distance along the primary sequence as: long-range (>70 aa), red; medium-range (40–70 aa), green; short-range (<40 aa), blue. Cysteine residues are denoted ‘C’ and numbered from the N-terminus. From Park et al. (Reference Park, Fenton and Horwich2007), and PDB:1TGS; copyright 2007, National Academy of Sciences USA.

Single-molecule analysis of rhodanese refolding in the cis cavity of SR1/GroES versus free solution – slower folding of C-terminal domain within the cis cavity
In 2010, Hofmann et al. (Reference Hofmann, Hillger, Pfeil, Hoffmann, Streich, Haenni, Nettels, Lipman and Schuler2010) reported on the refolding of rhodanese in solution at high dilution and inside the cis cavity of SR1/GroES/ATP using single-molecule FRET. FRET pairs were placed on engineered cysteines in rhodanese, both within the N- and C-terminal domains and split between them, the last reporting, effectively, on the linkage of the N- and C-terminal domains.Footnote 62 With spontaneous folding under single-molecule conditions, the C-terminal domain folded ~5 times faster (2.2 × 10⁻³ s−1) than the N-terminal domain and linker (4.2 × 10⁻⁴ and 3.9 × 10⁻⁴ s−1, respectively). In the cis cavity, the folding hierarchy (C→N&L) was the same as in free solution. The rate of folding of the N-terminal domain and linker was the same, but the folding of the C-terminal domain was decelerated by a factor of two at 24 °C and by a factor of eight at 37 °C.
With rapid microfluidic mixing, the reactions could be examined at an early time, on the millisecond timescale. There were no obvious differences between spontaneous and cis-mediated refolding in FRET efficiency histograms produced from the data obtained during the first second. There, thus, was no evidence of forced unfolding.
The basis for slowing in the cis cavity of formation of the native structure of the C-domain was considered. An increase of enthalpic barrier height of the rate-limiting step for C-domain folding could have offered an explanation, but instead a decreased activation enthalpy was extracted from Arrhenius plots. A decrease in the activation entropy of the rate-limiting step could alternatively have offered an explanation, due to spatial confinement and reduced chain entropy, but this would have produced an acceleration of rate instead of the observed deceleration. The possibility of confined water molecules influencing the reaction was experimentally tested by inspecting for a solvent isotope effect, replacing water with D2O – both spontaneous folding and cis folding rates were similarly reduced in 90% D2O by a factor of 1.5–2. Thus, the investigators suggested that ‘friction’ between the folding polypeptide and the cavity wall, with overall lowered mobility in the cavity, might be operative to slow the rate of C-terminal domain folding. As the investigators noted, there must be additional wall interactions involved in order to explain the selective effect on C-domain folding in the absence of effects on N and linker.
The investigators concluded: ‘Although the biological function of the GroEL/GroES system is suggestive of acceleration of folding rates, our results show that chaperonins can even slow down protein folding processes, and support the view that preventing aggregation of proteins is more important for cellular viability than accelerating protein folding reactions.’
Study of folding of 10 nM and 100 pM concentrations of DM-MBP supports that a misfolded monomeric species is populated while free in solution at these concentrations, but not during folding in the cis cavity
In a study by Chakraborty et al. (Reference Chakraborty, Chatilla, Sinha, Shi, Poschner, Sikor, Jiang, Lamb, Hartl and Hayer-Hartl2010), the folding of DM-MBP in solution and at GroEL/GroES under permissive conditions was again addressed. First, Chakraborty et al. presented evidence that multimolecular association of DM-MBP during spontaneous refolding at 10 nM concentration (20 °C) does not occur, as indicated by fluorescence cross-correlation spectroscopy with a mixture of two different fluorophore-labeled populations of DM-MBP. The investigators concluded that a monomeric kinetically-trapped species must be involved.
Such a kinetically trapped monomeric form of DM-MBP at 10 nM concentration or at 100 pM,Footnote 63 under the permissive conditions of the experiment, could apparently slowly exit from the kinetically trapped state in free solution and proceed to native form. In contrast, binding by GroEL and subsequent release and folding in the cis cavity could allow a greater rate of reaching the native state if these actions were to limit or prevent the same off-pathway step that kinetically traps the monomer in free solution. Note that the step of ATP/GroES-driven release from the GroEL cavity wall into the cis chamber could already populate different states than are produced by dilution from denaturant into solution. Regardless, at higher concentrations, the same kinetically-trapped monomer of DM-MBP formed in free solution would undergo multimolecular aggregation, presumably via exposed hydrophobic surfaces, presenting the observed features of light scattering and a diminished rate of folding with increasing concentration. Here, at higher concentration, the rate of folding is diminished not only by the kinetically trapped state of the monomer but by the kinetic detour of reversible multimolecular aggregation. At 10 nM or lower concentration, however, where multimerization does not occur, direct comparison of rates of folding of monomer inside GroEL/GroES and in free solution could be made. Thus, by such a model involving a misfolded monomeric state, it appeared that a single step, i.e. misfolding of the DM-MBP monomer in free solution but not in cis, could account for the collective of data.Footnote 64
PepQ refolding is accelerated in the cis cavity versus free solution under permissive conditions, in the absence of multimolecular association, and this correlates with a different fluorescent intermediate state populated in cis versus free solution
PepQ is a groE-dependent substrate protein identified as aggregating to the level of 85% in the in vivo study of Fujiwara et al. (Reference Fujiwara, Ishihama, Nakahigashi, Soga and Taguchi2010) depleting groE and analyzing the insolubility of substrate proteins in vivo (non-permissive conditions). PepQ is a non-essential homodimer of 50 kDa subunits that cleaves dipeptides terminating in proline. In 2017, Weaver et al. (Reference Weaver, Jiang, Roth, Puchalla, Zhang and Rye2017) reported in vitro studies of refolding of the subunit under permissive conditions, 100 nM concentration and 23 °C, showing that, upon addition of ATP/GroES to either GroEL/PepQ or SR1/PepQ binary complexes, folding was accelerated ~15-fold relative to folding in free solution following dilution from acid. The yield was also increased by 20–40%. In this case, light scattering of the solution reaction was not observed (as compared with Rubisco, studied here in parallel and by others). There was likewise no effect on rate constant with increasing concentration of PepQ up to 500 nM. As evidence that the cis cavity could change the folding trajectory of the reversibly misfolded monomer, intrinsic tryptophan fluorescence of PepQ was followed during folding in solution versus cis. (Recall that neither GroEL nor GroES contain tryptophan.) In solution, there was a single downward fluorescence change during spontaneous folding with a time constant of 125 s (Fig. 114), considerably faster than the rate of production of the native state (t ½ = 15 min), indicating that this fluorescence change precedes the committed step of folding. In GroEL/GroES-mediated refolding (t ½ = ~1 min), there was a rapid rise (over ~30 s) followed by a fall of fluorescence (time constant 73 s). Inside SR1/GroES, the same rise occurred with no subsequent fall of fluorescence. Notably, the rising phase at chaperonin was too slow to be involved with the steps of encapsulation or release of substrate protein into the cis cavity, suggesting that the rise is a reflection of folding occurring after release into the cavity. This more fluorescent species was suggested to comprise a folding intermediate state(s) that differs from the dominant population(s) produced during folding in free solution.
Under permissive conditions (25 °C, 100 nM substrate protein), GroEL/GroES or SR1/GroES system can populate different states of the monomer of substrate protein PepQ than are populated following dilution from acid into free solution, as reported by tryptophan fluorescence monitoring of PepQ. (a) Spontaneous refolding upon dilution from acid denaturant. (b) Refolding after addition of ATP/GroES to GroEL/PepQ binary complex. (c) Refolding after addition of ATP/GroES to SR1/PepQ binary complex. Note the steady fall of tryptophan fluorescence in the spontaneous reaction versus early rise at either GroEL/GroES or SR1/GroES, reflecting the population of apparently different intermediate states. From Weaver et al. (Reference Weaver, Jiang, Roth, Puchalla, Zhang and Rye2017).

XXXII. Evolutionary considerations
T4 phage encodes its own version of GroES, Gp31, that supports cis folding of its capsid protein, Gp23, by providing a larger-volume chamber than GroES; Gp31 can substitute, however, in GroES-deleted E. coli
In 1994, 22 years after the original reports that T4 gene 31 cooperated with GroEL to enable the assembly of the T4 phage capsid protein Gp23 into phage heads during T4 biogenesis (Georgopoulos et al., Reference Georgopoulos, Hendrix, Kaiser and Wood1972; Takano and Kakefuda, Reference Takano and Kakefuda1972), it became clear that the gene 31-encoded protein, Gp31, is itself a GroES-like molecule. The 1994 study of van der Vies et al. (Reference van der Vies, Gatenby and Georgopoulos1994) observed first that Gp31 expressed from a plasmid could rescue λ phage infection/plaque formation that was defective on GroES mutants G23D, G24D, and A31V (affecting mobile loop residues). Further, the block of cell growth of G23D at 43 °C was also rescued by the plasmid encoding Gp31, consistent with the ability of Gp31 to provide a full range of cochaperonin function of GroES for host proteins. [Subsequently, it was shown that Gp31 could also rescue a GroES deletion, reported by Keppel et al. (Reference Keppel, Rychner and Geoergopoulos2002).] As a further example of specific action of Gp31 in vivo, it was able to rescue the activity of programmed A. nidulans Rubisco (L8S8 hexadecamer) that was impaired in the G24D mutant.
In vitro, Gp31 behaved like a 90 kDa homooligomer of ~10 kDa subunits that exhibited similar mobility in SDS gels to GroES (van der Vies et al., Reference van der Vies, Gatenby and Georgopoulos1994). In the presence of ATP, Gp31, like GroES, physically associated with GroEL, as observed in gel filtration. Also similar to GroES, Gp31 partially inhibited the steady-state turnover of ATP by GroEL. The investigators concluded that Gp31 could be supplying a specialized function to support T4 Gp23 capsid folding that could not be supplied by GroES. In particular, Gp23 is a 56 kDa protein, potentially too large to be encapsulated by GroES. Alternatively, Gp31could be serving during phage infection simply to supply additional cochaperonin capacity to assist the folding of a large amount of Gp23 capsid protein produced during infection.
Some insight into the potential role of Gp31 came in 1997 when Hunt et al. (Reference Hunt, van der Vies, Henry and Deisenhofer1997) reported a crystal structure of Gp31 (PDB:1G31). The β-sheet fold of the central core of Gp31 was superposable to that of GroES, despite only a few residues of amino acid identity. Most significantly, the mobile loop of Gp31 was six residues greater in length than the loop of GroES (22 residues versus 16), indicating that it could produce a greater separation between chaperonin and cochaperonin, increasing the height of the cis chamber by 3–12 Å. For encapsulating the Gp23 capsid protein of 56 kDa, this could potentially provide a required volume expansion.Footnote 65
In 2005, Bakkes et al. (Reference Bakkes, Faber, van Heerikhuizen and van der Vies2005) reported functional and topological studies with purified Gp23 capsid protein, comparing its behavior with GroEL/GroES and GroEL/Gp31. First, they set up an in vitro refolding mixture, in which folding of Gp23 capsid to native form by GroEL/cochaperonin was assessed by the ability of the native form to assemble into hexamers observable in gel filtration chromatography. Starting with binary complexes of GroEL/Gp23, the addition of Gp31/ATP produced a hexamer peak of assembled Gp23 capsid in gel filtration, whereas GroES/ATP did not. In the latter case, it was suspected that Gp23 capsid monomers had misfolded and aggregated. Thus, it appeared that Gp31 enabled productive folding of the Gp23 capsid protein where GroES did not. Next, GroEL/Gp23 binary complexes were incubated with either ADP/GroES or ADP/Gp31, and encapsulation of Gp23 capsid protein in a cis complex was assessed by PK treatment. Whereas Gp23 capsid protein was protected by Gp31 (partially, because some molecules were bound in trans), it was not protected by GroES. This supported that the Gp23 capsid protein is too large to allow GroES encapsulation, whereas Gp31 accommodates the capsid protein. The same result was obtained when starting with SR1/Gp23 binary complexes, where, in this case, Gp31 quantitatively protected Gp23 (in an obligatory cis situation), while GroES could not afford protection. These results supported the structural evidence that Gp31 functions as a specialized GroES for the T4 system that accomodates the size and shape of the T4 Gp23 capsid as the substrate in a cis cavity.
The functional conclusions from the Bakkes et al. study were further supported by a cryoEM study of Clare et al. (2009). Binary complexes of GroEL/Gp23 were incubated with Gp31 in the presence of ADP–AlFx, and the presence of (refolded) Gp23 in cis was observed, selectively, only in GroEL particles that also bore non-native Gp23 in the open trans ring (Fig. 115; EMDB 1548). Because Gp23 is homologous to another component, Gp24, whose crystal structure had been solved, it was possible to carry out fitting into the putatively native density of what would be refolded Gp23 in the stable cis cavity (note that the release of either Gp31 or refolded Gp23 would not occur here because the transition state analogue employed for cis complex formation cannot ‘hydrolyze’ to an ADP state). The fitting of cis density carried out with the Gp24 model could account for a substantial portion of the elongated mass of a putatively native state. Notably, the cis cavity appeared expanded – it appeared that the substrate capsid protein was exerting ‘pressure’ on the cis ring. Thus, even with evolutionary physical expansion, a tight fit remained even for the refolded state of Gp23 capsid protein.
Side and end cutaway section views of the cis ring of an asymmetric complex of GroEL and Gp31 in ADP–AlFx (which supports the formation of stable cis complexes), containing refolded Gp23 capsid inside the bulged-out cis ring, but also non-native Gp23 bound in the open but contracted trans ring (not shown in this figure, but see red circle in end view as the projection of the contracted trans ring). The model of the native structure of Gp24, a homologue of Gp23 for which there is a crystal structure, was fit into the substrate density in the cis cavity. Adapted from Clare et al. (Reference Clare, Bakkes, van Heerikhuizen, van der Vies and Saibil2009), by permission from Springer Nature, copyright 2009.

Pseudomonas aeruginosa large phage encodes a GroEL-related molecule that, when expressed in E. coli, appears in apo form to be a double-ring assembly
In 2016, Molugu et al. (Reference Molugu, Hildenbrand, Morgan, Sherman, He, Geogopoulos, Sernova, Kurochkina, Mesyanzhinov, Miroshnikov and Bernal2016) reported the expression in E. coli of a coding sequence from a P. aeruginosa large phage (Hertveldt et al., Reference Hertveldt, Lavigne, Pleteneva, Semova, Kurochkina, Korchevskii, Robben, Mesyanzhinov, Krylov and Volckaert2005) that predicts a 58 kDa translation product that exhibits an overall amino acid sequence identity to E. coli GroEL of ~24% and a similarity of 61%. The amino acid sequence relatedness lined up along the length of the polypeptide chain, except at the C-terminus, where the phage-encoded protein truncates without a GGM repeat sequence. It was suggested that, along the lines of T4 phage-encoded Gp31, the phage has adapted its own GroEL to accommodate biogenesis of specific phage-encoded structural proteins, some of which are beyond 60 kDa in mass. In a functional study, the investigators programmed lac-driven expression of the coding sequence in the ara-regulated groE-depletion strain of McLennan and Masters (Reference McLennan and Masters1998), and could, after ~12 h of depletion of chaperonins in glucose, rescue growth by IPTG induction of the lac-regulated GroEL-related molecule. This was somewhat surprising in the absence of any GroES.
The investigators carried out several in vitro studies with the purified GroEL-like species that led them to suggest that the GroEL-like homologue might be able to function on its own by rearranging its structure. A working model was derived from EM analysis of the purified protein in ATP and ADP, suggesting that the rings split apart upon ATP hydrolysis, and that the domains of the subunits of the split rings (in an ADP-bound state) rearrange to produce a closed cavity that is many times greater in volume than that of a GroEL/GroES ring. (This would have obvious implications for cis confinement and folding if the expression of this gene can truly rescue GroE-deficient E. coli.) A functional experiment was carried out along the lines of a potentially larger-volume cavity, indicating that β-galactosidase (120 kDa subunit) could be folded by the GroEL-related molecule. Thus, it appears at a minimum that the Pseudomonas large phage is producing a GroEL homologue that has evolved to accommodate one or more phage substrate proteins. It remains to be seen exactly how this is accomplished and whether the reaction cycle is as described. Clearly, additional EM data and likely crystallographic data will be needed in order to establish the action of this interesting evolutionarily-adapted component.
Directed evolution of GroEL/GroES to favor GFP folding disfavors other substrates
In 2002, Wang et al. (Reference Wang, Herman, Tipton, Gross and Weissman2002) reported on directed evolution of GroEL/GroES, aimed at increasing the folding in vivo of GFP from A. victoria. The possibility that folding could be improved was supported by the observation that overexpression of GroEL/GroES increased the fluorescence of cells expressing GFP, without affecting the level of GFP protein production, by increasing the fraction of protein that was soluble versus aggregated. Following random PCR mutagenesis of a GroEL/GroES expression plasmid, with mutagenesis particularly focused on the apical polypeptide binding surface, and three rounds of shuffling/recombination of DNA fragments (see Fig. 116a), the GFP fluorescence of cells in culture was improved by up to 6–8-fold (Fig. 116b). Many of the most-fluorescent clones exhibited growth defects, but clone 3-1 did not. In 3-1, instead of only 10% solubility of GFP protein, 50% was soluble. The improvement of native GFP production came at a cost, however (see Fig. 117). The 3-1 cells could not grow at 45 °C, and λ phage plaque production was diminished by 1000-fold. An expressed HrcA transcriptional regulator was affected. Expressed rhodanese, however, was not affected.
In vitro evolution experiment isolating chaperonin mutant-expressing plasmids that improve GFP folding. (a) Three rounds of in vitro mutagenesis and fragment shuffling of GroEL/GroES-expressing plasmid were carried out and brightest GFP fluorescing clones were analyzed. (b) GFP fluorescence of several cultures of individual clones, illustrating the increased intensity of GFP fluorescence of the GroE 3–1 strain relative to others. Cells expressing GroE3−1 are ~8-fold brighter than those expressing wt GroE and about twofold brighter than those expressing GFPopt, a mutagenized GFP selected for increased folding. Adapted from Wang et al. (Reference Wang, Herman, Tipton, Gross and Weissman2002), with permission from Elsevier, copyright 2002.

Venn diagram illustrating the shift in substrate folding efficiency in vivo as the result of optimizing for GFP. Phage biogenesis and HrcA repressor activity were compromised, for example, whereas rhodanese folding was not. Reprinted from Wang et al. (Reference Wang, Herman, Tipton, Gross and Weissman2002), with permission from Elsevier, copyright 2002.

The mutations in the most fluorescent third-round clones mapped within both GroEL and GroES. The mutations within GroEL contributed the greatest effect, amounting to a 5–6-fold improvement on their own. These mutations mapped in and around the ATP-binding pocket and intermediate domain, producing increased rates of ATP turnover and, in the presence of GroES, complete suppression of ATP turnover (instead of the usual ~50% inhibition). These mutations would thus affect the rates of GroEL/GroES cycling, potentially optimizing the cis dwell time for productive folding of GFP (apparently shortening it). Within GroES, mutations mapped specifically to tyrosine 71, altering it to either histidine or arginine, but contributed much less effect, improving GFP fluorescence by 50–100%. When additional substitutions were programmed to aspartate or glutamate or even glutamine, there was the same effect. Thus, it appears that changing the aromatic tyrosine side chain to a charged side chain or to a polar glutamine has a benefit. It is unknown whether this is a local benefit, e.g. removing the ring of aromatic side chains protruding as a ridge at the base of the GroES dome to accommodate some aspect of cis-folding GFP, or whether it allosterically affects GroES binding or perhaps allosterically affects ATP-driven cycling (see Kovalenko et al., Reference Kovalenko, Yifrach and Horovitz1994 for the last behavior, where a substitution in GroES allosterically affected the nucleotide cycle of GroEL/GroES). It is surprising that the GroES alteration is the only cis cavity change that came up in the screen, particularly when the peptide binding surface of the GroEL apical domains was a particular target of the mutagenesis. In any case, the major point appears to be that optimizing for a yield of a single GroEL/GroES substrate can compromise other ones. This enforces the notion that GroEL/GroES has evolved to handle the critical, presumably essential, protein substrates and that the set-point is ‘delicate’.
Overexpression of GroEL/GroES supports the preservation of function of an enzyme in the face of genetic variation/amino acid substitution and enables directed evolution of an esterase
In 2009, Tokuriki and Tawfik (Reference Tokuriki and Tawfik2009) reported an experiment randomly mutagenizing a number of enzyme-coding regions and assessing the effects of GroEL/GroES overexpression to maintain inducible enzymatic activity above a level of ~70% of wild-type. Through three rounds of mutagenesis and recovery with the overexpression of GroEL/GroES versus not, 60% of clones of GAPDH were ‘active’ in the setting of GroEL/GroES overexpression, while 43% were active in the absence of overexpression. A higher level of amino acid substitutions was found in the variants obtained with GroEL/GroES overproduction, and more of the GAPDH alterations localized to buried core residues (48% versus 41%). Thus, it appeared that the chaperonin system supported the recovery of activity in the presence of destabilizing mutations that would compromise folding. Consistently, low levels of soluble mutant protein were observed in the absence of chaperonin overexpression.
The ability of GroEL/GroES overexpression to support directed evolution was also demonstrated by a multiple-round selection for increased esterase activity of a phosphotriesterase that acts on paraoxon. A 44-fold increase of activity was observed in the setting of overexpression of GroEL/GroES versus only fourfold in the absence of overexpression of GroEL/GroES.
Eukaryotic cytosolic chaperonin CCT (TRiC) – asymmetry in both substrate protein binding by apical domains of an open ring and in steps of ATP binding and hydrolysis that drive the release of substrate into the closed folding chamber
From early studies recognizing eight subunits with distinct but conserved apical domains that differ from those of GroEL (Kim et al., Reference Kim, Willison and Horwich1994) atop conserved equatorial ATP-binding domains, it became evident that CCT would potentially exhibit selective and asymmetric substrate polypeptide binding as compared with the identical subunits and continuous ring of apical hydrophobic binding surface at GroEL. With respect to release/folding, it also became clear that CCT would exhibit a level of specificity and behavior different from that of GroEL, which would go beyond just harboring a ‘built-in lid’ structure versus a detachable cochaperonin-like GroES. For example, Tian et al. (Reference Tian, Vainberg, Tap, Lewis and Cowan1995) reported that major CCT substrates, β-actin and α-tubulin, could not reach native form in GroEL/GroES/ATP, fated to continuously cycle through binding, cis encapsulation, and release into solution with subsequent rebinding, whereas input actin and tubulin subunits readily reached native form in cycling CCT/ATP. Fundamentally, it seemed as if different intermediate forms were being bound by CCT versus GroEL, and that the release might also be differently programmed. Conversely, such well-studied GroEL substrates as unfolded rhodanese were not recognized by CCT.
Briefly stated, the behavior of CCT in polypeptide binding was shown through a series of additional mutational, structural, and biochemical studies to result from asymmetric binding carried out by one or more members of the eight distinct and characteristically-arranged apical binding surfaces of an open CCT ring (see Leitner et al., Reference Leitner, Joachimiak, Bracher, Mönkemeyer, Walzthoeni, Chen, Pechmann, Holmes, Cong, Ma, Ludtke, Chiu, Hartl, Aebersold and Frydman2012; Kalisman et al., Reference Kalisman, Schröder and Levitt2013; Joachimiak et al., Reference Joachimiak, Walzthoeni, Liu, Aebersold and Frydman2014), each apical domain presenting a differing level of hydrophobicity and polarity facing the cavity on structural equivalents to apical GroEL α-helix I, in CCT assigned as helix 11, and an underlying segment, termed the proximal loop. A recent study of CCT-bound actin using HX has indicated, as was suggested by earlier cryoEM and biochemical studies, that the actin already occupies native-like features (Balchin et al., Reference Balchin, Miliĉić, Strauss, Hayer-Hartl and Hartl2018).
The behavior of CCT in mediating release/folding also differs significantly from GroEL, with ATP binding exerting partial closing movements of the apical domains with what seems likely to be associated release of selected segments of the bound substrate (for actin, see Balchin et al., Reference Balchin, Miliĉić, Strauss, Hayer-Hartl and Hartl2018). This is followed by ATP hydrolysis, which fully closes the cavity of CCT by a radial inward rocking motion (around a fulcrum at the equatorial level of the subunits; note that the subunit contacts at the equatorial interface form 1:1 contacts across the ring–ring interface, facilitating such rocking motion; see Cong et al., Reference Cong, Schröder, Meyer, Jakana, Ma, Dougherty, Schmid, Reissmann, Levitt, Ludtke, Frydman and Chiu2012). The hydrolysis step thus brings the apical domains and their protrusions inward to form the roof of the enclosing dome. Lateral interactions between elements of the closing apical domains appear to strip polypeptide from the apical domains. In the case of actin, this is associated with complete release of the protein into the cavity with the production of the native state as exhibited by the formation of its ATP-binding pocket.Footnote 66
The steps of ATP binding and hydrolysis by CCT that drive apical domain movements that produce the release and folding of substrate protein are apparently also asymmetric. A crystal structure in ATP–BeFx (Dekker et al., Reference Dekker, Roe, McCormack, Beuron, Peal and Willison2011; PDB:4V81) showed only partial occupancy of equatorial nucleotide pockets (with ADP–BeFx), and subsequent biochemical studies suggested a sequential hydrolysis mechanism (Rivenzon-Segall et al., Reference Rivenzon-Segall, Wolf, Shimon, Willison and Horovitz2005; see also Gruber et al., Reference Gruber, Levitt and Horovitz2017). More recent study of ATP binding using 32P-α-labeled 8-azido-ATP and photolysis, as well as the study of P loop mutants in specific CCT subunits that block hydrolysis, indicates that one hemisphere of the (characteristically-arranged) ring binds ATP with higher affinity, and its hydrolysis is critical to closure as compared to such action in the other hemisphere (Reissmann et al., Reference Reissmann, Joachimiak, Chen, Meyer, Nguyen and Frydman2012). There is thus an asymmetric ‘power stroke’ driving polypeptide release, which likely occurs in a sequential manner.
Given the observations of asymmetry of both polypeptide binding and ATP-driven release, it seems inescapable that CCT substrates and the chaperonin must have coevolved to allow this extent of specificity. Were actin and tubulin, essential and abundant cytoskeletal components, the major drivers, with other substrates, e.g. a number of β-propeller proteins, thus needing to ‘fit in’ with the adapted arrangement? It remains to be seen how much evolutionary specialization has occurred.
Acknowledgement
We thank all of our colleagues in this field for the many stimulating discussions and good times we have had together in so many corners of the world. We thank Jimin Wang for helpful discussions during the preparation of this work, and Mark Saba for help with illustrations. We apologize for the inability to cover every work that contributed measurably to the understanding of the chaperonin system. We are deeply grateful to HHMI for supporting our work in this field.
XXXIII. Appendices
Appendix 1
The non-essential behavior of the C-terminal tails of GroEL
Barrier
A more recent study has supplied support for the cryoEM structural observations (Saibil et al., Reference Saibil, Zheng, Roseman, Hunter, Watson, Chen, auf der Mauer, O'Hara, Wood, Mann, Barnett and Ellis1993; Chen et al., Reference Chen, Roseman, Hunter, Wood, Burston, Ranson, Clarke and Saibil1994) that indicated that the collective of C-termini within the central cavity of each ring at the equatorial level present a barrier. Ishino et al. (Reference Ishino, Kawata, Taguchi, Kajimura, Matsuzaki and Hoshino2015) observed that a single-ring version of GroEL (called SR1; see pages 58 and 60) could bind unfolded GFP to form a (non-fluorescent) binary complex and then, upon addition of ATP/GroES, the protein refolded to its fluorescent form. It remained in the cavity of the SR1/GroES complex, as demonstrated by gel filtration showing fluorescence migrating with the SR1/GroES complex (see also Weissman et al., Reference Weissman, Rye, Fenton, Beechem and Horwich1996). When Ishino et al. carried out this same experiment with a version of SR1 that was deleted of the C-termini, unfolded GFP was efficiently bound by SR1, but in this case, addition of ATP/GroES led to the release of GFP into the bulk solution, apparently through the open ‘hole’ at the bottom of the central cavity. Instead of fuorescent GFP migrating in gel filtration with SR1/GroES, most migrated to the position of monomeric GFP. Supporting that this GFP had folded after the release of the non-native form into the bulk solution, if a trap mutant (N265A; Weissman et al., Reference Weissman, Kashi, Fenton and Horwich1994) was present in the reaction mixture, very little GFP fluorescence was recovered.
As a ‘floor’ of a central cavity, the C-terminal tails can contact non-native substrate protein
Because the C-termini collectively appear to serve as a ‘floor’ to the central cavity of each ring, one might expect that GroEL-bound polypeptide could make contact with the tails. Indeed, Elad et al. (Reference Elad, Farr, Clare, Orlova, Horwich and Saibil2007) reported that, when cysteine was substituted into the C-terminal tails (at position 527 or 548), it could become oxidatively crosslinked to bound non-native DHFR, containing a single cysteine at position 90, when binary complexes were exposed to diamide. The position of non-native Rubisco in the cavity of an open ring was indicated to be deeper in the presence of the C-tails than in their absence, as studied by FRET, suggesting a physical interaction (Weaver and Rye, Reference Weaver and Rye2014). A cryoEM study of encapsulating Rubisco also suggested possible physical interaction with the C-terminal tails (see page 79), and an accompanying functional test showed that, in the absence of the tails, there was less efficient encapsulation (Chen et al., Reference Chen, Madan, Weaver, Lin, Schröder, Chiu and Rye2013). Consistent with a possible role in substrate binding, a study of the non-essential GroEL1 gene of Mycobacterium smegmatis showed it to be critical to biofilm formation, and such function was dependent on an unusual histidine-rich C-terminal tail (substitution or deletion of which blocked biofilm formation; Ohja et al., Reference Ojha, Anand, Bhatt, Kremer, Jacobs and Hatfull2005). Two proteins involved with mycolic acid synthesis were implicated as possible substrates, but direct interaction with the C-terminal tails of GroEL1 remains to be demonstrated.
C-terminal tail truncation or multiplication affects rates of GroEL/GroES cycling and folding in vitro
Deletion or multiplication of the GroEL C-terminal tails also has effects on the rate of GroEL/GroES/ATP cycling, by virtue of altering the steady-state ATPase activity of GroEL, reducing it by ~50% with deletion, increasing it by >50% upon duplication, and increasing it by nearly 3-fold with triplication (Langer et al., Reference Langer, Lu, Echols, Flanagan, Hayer and Hartl1992a; Farr et al., Reference Farr, Fenton and Horwich2007; Machida et al., Reference Machida, Kono-Okada, Hongo, Mizobata and Kawata2008; Suzuki et al., Reference Suzuki, Ueno, Iizuka, Miura, Zako, Akahori, Miyake, Shimamoto, Aoki, Tanii, Ohdomari and Funatsu2008). This has been correlated with altered rates of GroEL/GroES-mediated folding measured in vitro (Farr et al., Reference Farr, Fenton and Horwich2007; Machida et al., Reference Machida, Kono-Okada, Hongo, Mizobata and Kawata2008; Suzuki et al., Reference Suzuki, Ueno, Iizuka, Miura, Zako, Akahori, Miyake, Shimamoto, Aoki, Tanii, Ohdomari and Funatsu2008; Weaver and Rye, Reference Weaver and Rye2014; Weaver et al., Reference Weaver, Jiang, Roth, Puchalla, Zhang and Rye2017).
Yet it remains that, in vivo, deletion of the tails is tolerated without significant growth defects (see Burnett et al., Reference Burnett, Horwich and Low1994). Notably, however, the substitution of a proximal hydrophilic region KNDAAD (526–531) with a hydrophobic or neutral sequence resulted in slowed growth in a GroEL-deleted strain (Machida et al., Reference Machida, Kono-Okada, Hongo, Mizobata and Kawata2008). The substituted sequence appears to be functioning in a dominant negative fashion, for mechanistic reasons as yet unknown. Finally, a GGM-repeat deletion of McLennan et al. (Reference McLennan, Girshovich, Lissin, Charters and Masters1993) was reported to be slower to recover from the stationary phase at 42 °C. This seems to reflect that the C-terminal tails, in their various actions as just described, are more of an efficiency factor.
Appendix 2
Further study of trans ADP release during the reaction cycle
In 2013, Ye and Lorimer (Reference Ye and Lorimer2013) further resolved a role of trans ADP release in a kinetic study. First, they followed the time-course of ATP hydrolysis using continuous Pi assay with a fluorescent Pi-binding protein, after adding ATP and variable concentrations of K+ in the presence or absence of α-lactalbumin substrate protein, to GroES/ADP/GroEL bullet complexes. Three pre-steady-state kinetic phases were observed, in temporal order: a lag phase of ~100 ms, during which no Pi was produced; a burst phase of <10 s, during which one ring's worth of Pi was produced; and a delay phase (tens of seconds) with a slower rate than steady-state before the steady-state rate was achieved. This delay phase had not been apparent in earlier studies, particularly those with lower time resolution. The lag and burst phases were insensitive to K+ or ATP concentrations or the presence of substrate protein. The delay phase was highly sensitive to [K+], however, ranging from undetectable at 10 mM to easily visible at 200 mM, a value thought to be a physiologic concentration in E. coli. Because the hydrolysis rate at 200 mM K+ during the delay phase was the slowest of the pre-steady-state rates and slower than the steady-state rate, the investigators suggested that it represented the rate-determining step in the GroEL/GroES reaction cycle under these conditions. Given their earlier results indicating that the effect of K+ is to increase the affinity of GroEL for ADP, a known inhibitor of ATP hydrolysis, they hypothesized that this rate-determining step was ADP release. Indeed, adding small amounts of ADP to the acceptor state complex (essentially partially converting it to the so-called ‘resting state’) before starting the reaction with ATP reduced the amplitude of the burst phase, allowing the calculation of a dissociation constant and Hill coefficient for ADP binding to the trans ring: K d = 5.3 µM at 200 mM KCl, with a Hill coefficient of 3.0. In the presence of substrate protein (reduced α-lactalbumin), however, the rate of ADP release, measured with a coupled enzyme assay, greatly increased (presumably because the dissociation constant increased), as did the rate of Pi release (ATP turnover) in the delay phase.
Next, a number of parameters, GroES binding (followed by FRET), Pi release, and ADP release, were examined in concurrent experiments in respect to the absence or presence of added substrate protein. Significant differences were apparent in the time-courses of each of these parameters (Fig. 118). In the absence of substrate protein (Fig. 118a), FRET signal at the level of one GroES per GroEL developed rapidly, within the lag phase (<100 ms). As shown before, Pi release began after the lag phase, with the burst completed within 10 s, but ADP release lagged behind, only ~20% complete (i.e. 1–2 released per active ring) in the same time. In contrast, when substrate protein was present (Fig. 118b), GroES binding led to almost twice the FRET signal (i.e. two GroES per GroEL) in an apparently two-phase reaction, the second phase completed in ~200 ms. The time-course of Pi release was similar to that without substrate polypeptide, but the ADP release kinetics were substantially different and complex. Strikingly, ADP release now began within the first 100 ms and rapidly increased to a plateau of ~1 ADP per active subunit (i.e. seven ADPs/GroEL) in <1 s, well before Pi release had reached this extent. After a ‘pause’ of a few seconds, ADP release resumed at the steady-state rate. The investigators suggested that this dramatic difference reflected a change in the kinetic mechanism and, hence, the identity of the rate-determining step in the overall hydrolysis cycle, from trans ADP release without substrate protein to cis ATP hydrolysis in its presence. This agreed with their earlier conclusions concerning two ‘timers’ controlling the reaction cycle (Grason et al., Reference Grason, Gresham and Lorimer2008b).
Presence of non-native substrate protein changes the kinetic mechanism of ATP hydrolysis by accelerating ADP release from the discharged cis complex. For both top and bottom panels, without and with substrate protein (SP), respectively, Pi production was measured by a fluorescent binding assay, as a measure of ATP hydrolysis; ADP release was measured by a coupled enzyme assay; and fluorescent GroES release was measured by exchange as the appearance of FRET between fluorophore-labeled GroEL and added excess of fluorophore-labeled GroES. In each case, an asymmetric cis ADP GroEL/GroES complex was mixed with ATP without (a) or with (b) stably unfolded α-lactalbumin as substrate protein. Phosphate production (blue) is similar in both experiments, but ADP release is greatly accelerated and occurs in two phases in the presence of substrate protein. GroES exchange occurs to a greater extent in the presence of substrate protein, approaching two per GroEL, indicative of the formation of symmetric complexes. Redrawn from Ye and Lorimer (Reference Ye and Lorimer2013)

(The investigators also proposed that two folding cycles were possible, asymmetric and symmetric, interconverted by the presence or absence of substrate protein. Notably, the asymmetric cycle had a symmetric intermediate state, while the symmetric one had asymmetric states, necessary to allow the release and binding of the non-native substrate protein.)
Appendix 3
Symmetric GroEL–GroES2 complexes
Initial observation
In 1994, three groups (Azem et al., Reference Azem, Kessel and Goloubinoff1994; Llorca et al., Reference Llorca, Marco, Carrascosa and Valpuesta1994; Schmidt et al., Reference Schmidt, Buchner, Todd, Lorimer and Viitanen1994) reported negative-stain EM images of GroEL–GroES complexes formed in ATP that showed symmetrical particles, assumed to be GroES7–GroEL14–GroES7 complexes, in addition to the ‘bullet’-shaped asymmetric GroEL14–GroES7 complexes previously observed (Saibil et al., Reference Saibil, Dong, Wood and auf der Mauer1991; Langer et al., Reference Langer, Pfeifer, Martin, Baumeister and Hartl1992b). Azem et al. called these ‘football-shaped’ due to their similar appearance in side views to American footballs. The conditions used to form footballs varied somewhat among these experiments, but, generally, a higher GroES:GroEL ratio (>2:1) and/or a higher concentration of ATP (typical experiments used 1–2.5 mM) led to a greater fraction of symmetric particles. Although Azem et al. used glutaraldehyde cross-linking to stabilize and analyze the complexes by both native gels and EM, the other two groups observed a large percentage of footballs (up to 95% with excess GroES) in EM images without this treatment. All groups agreed that ADP did not support football formation, while non-hydrolyzable AMP-PNP did. Azem et al. examined the functionality of the two types of complexes, reporting the equal recovery of Rubisco activity from refolding reactions carried out under conditions favoring either bullets or footballs. All three groups suggested that symmetric complexes might be significant or even obligate intermediate states in folding reactions.
Population of footballs versus bullets and functional tests
In 1995, companion papers from Engel et al. (Reference Engel, Hayer-Hartl, Goldie, Pfeifer, Hegerl, Müller, da Silva, Baumeister and Hartl1995) and Hayer-Hartl et al. (Reference Hayer-Hartl, Martin and Hartl1995) sought to address the question of whether symmetric complexes played a role in protein folding. First, Engel et al. examined the conditions necessary for football formation, in particular testing the effects of Mg2+ concentration, solution pH, and the presence of unfolded substrate protein. They observed by negative stain EM that unphysiologically high Mg2+ concentration (50 mM) and alkaline pH (8.0), conditions used by Schmidt et al. (Reference Schmidt, Buchner, Todd, Lorimer and Viitanen1994), indeed led to a high percentage of footballs in EM images, whereas using 5 mM Mg2+ and pH 7.2 resulted in a much lower fraction. AMP-PNP was as effective as ATP in supporting football formation in high [Mg2+], whereas ADP supported the formation only of bullet complexes. Interestingly, incubation of GroEL with non-native DHFR before adding AMP-PNP and GroES in high [Mg2+] resulted in very few footballs, despite high [Mg2+]. Equilibrium dialysis experiments with 3H-labeled GroES, using AMP-PNP as nucleotide, confirmed these results; that is, only 1:1 complexes were present in any of low [Mg2+], ADP, or presence of non-native DHFR. The investigators concluded that footballs, although observable under certain conditions, were not obligate to the chaperonin folding cycle. In Hayer-Hartl et al., a series of binding and release studies were carried out using SPR (surface plasmon resonance). Most significant, when GroEL–GroESchip complexes were formed on the chip in ADP (producing asymmetric complexes only), then challenged with ATP, complete release of GroEL occurred, establishing that a second GroES (to form a football) was not required for dissociation of the complex.
In 1995, Azem et al. (Reference Azem, Diamant, Kessel, Weiss and Goloubinoff1995) observed, using native gel analysis of glutaraldehyde cross-linked GroEL–GroES complexes and negative stain EM images, a correlation between timed recovery of mMDH activity and the presence of footballs, although asymmetric bullet complexes were present at all GroES:GroEL ratios.
In 1996, Llorca et al. (Reference Llorca, Carrascosa and Valpuesta1996) investigated the role of solution conditions in the formation of footballs, concluding that there was no pH dependence in the pH 7–8 range, but that there was a significant K+ concentration dependence, requiring at least 150 mM KCl to produce 30% footballs in EM images. Such a finding was consistent with observations by others that K+ ions were positive effectors of ATP binding. Llorca et al. also demonstrated that adding an excess of ADP over ATP to solutions with a high percentage of preformed footballs resulted in their rapid conversion to bullet complexes. Rhodanese refolding mixtures were examined for the presence of footballs during the time-course of the reaction, and, unlike the Azem et al. study above, a large percentage of footballs was not present until refolding was essentially complete. In fact, initial rates of rhodanese refolding (2:1 GroES:GroEL, 150 mM KCl, 5 mM ATP) were the same across a range (5–50%) of symmetric complex percentages. These investigators concluded that both types of complexes could be functional in the folding cycle without requiring that either have an exclusive role.
Substrate protein in both rings of football complexes
Two groups used negative stain EM to investigate the possibility that football complexes could contain non-native substrate protein in the cis cavity of both rings.
In 1997, Llorca et al. (Reference Llorca, Marco, Carrascosa and Valpuesta1997) formed footballs nearly quantitatively (90%) during a rhodanese folding reaction by employing 5:1 non-native rhodanese:GroEL, 2:1 GroES:GroEL, and an ATP regenerating system. Side views of particles from the EM images were collected, and the symmetric ones were subjected to an alignment and classification scheme that was based on the presence of stain-excluding material (sequestered rhodanese) in none, one, or both of the cis cavities. Out of 1059 particles processed, 26% had a stain in both cavities (i.e. were empty footballs), 59% had only one cavity with stain (single rhodanese present), and the remaining 15% had both cavities stain-free (both cavities with rhodanese). How these percentages were related, if at all, to the outcome of the ongoing refolding reaction was not discussed, except to suggest that fully symmetric complexes (i.e. two substrates and two GroES molecules) might have a role as intermediate states in the folding cycle.
A second study of Sparrer et al. (Reference Sparrer, Rutkat and Buchner1997) used a slightly different approach to populating footballs, incubating denatured mature form of wild-type maltose-binding protein (MBP), a non-stringent GroEL substrate, at 2:1 MBP:GroEL in 40 mM MgCl2, 2 mM AMP-PNP, and 3:1 GroES:GroEL for 2 min before applying to grids and staining. Images were processed and classified as bullets versus footballs and the presence of stain-excluding material in cis was scored. About 50% of side views were bullets, and about half of these had stain-excluding material under GroES. The football images were also divided equally between those with one or two cavities with stain-excluding material, essentially confirming the observations of Lorca et al.
Sparrer et al. also carried out kinetic experiments to further explore the role of symmetric complexes, here using the slower-folding Y283D mutant form of MBP, which is also a non-stringent substrate. When unfolded, however, it binds tightly to GroEL, preventing refolding, and requires the addition of ATP to cause dissociation and permit refolding in solution to proceed (Sparrer et al., 1996). Here, GroES was also added in various ratios to GroEL, and rates of refolding were measured and compared to the spontaneous folding rate of this protein free in solution. An increase in refolding rate was reported, reaching a maximum at about 2:1 GroES:GroEL when 200 nM substrate was used. At lower substrate concentration, refolding rates were lower but increased with ratios up to 4:1 GroES:GroEL, although the final rate achieved was less than that at higher substrate protein concentration. These observations, together with the EM images, led to the conclusion that symmetric GroEL-GroES2 complexes were ‘required’ in the chaperonin cycle. There are some concerns about this conclusion, however. First, the Y283D mutant is not a stringent GroEL substrate, meaning that it can fold in solution without chaperonin and, even though the unfolded species can bind to GroEL, it does not require the complete chaperonin system for refolding – that is, ATP-mediated release leads to productive folding in solution albeit slower than in the cis cavity. Thus, the relevance of this substrate to behavior under GroES-requiring nonpermissive conditions seems unclear. Also, surprisingly, the temperature selected for this study was 43 °C, a heat shock temperature, where the physiology of GroEL/GroES behavior, e.g. with respect to rates of GroES and polypeptide binding and release, are not very well-accounted relative to those at 25 °C. The conclusion, beyond these questions, that symmetric complexes are ‘required’ for folding in this context does not seem to follow.
In 1999, Hayer-Hartl (Reference Hayer-Hartl, Ewalt and Hartl1999) used a rapid cross-linking protocol and native gel analysis to separate cross-linked complexes and careful measurement of MDH activity to observe the maximum recovery of MDH at ATP concentrations where few symmetric complexes could be detected (even with [GroES]:[GroEL] = 3:1). Higher ATP concentrations produced more footballs, but recovery of MDH activity was not more efficient. In addition, rates of recovery were essentially identical between 1:1 and 4:1 GroES:GroEL ratios when GroEL concentration was 1 µM. It was noted, however, that at lower GroEL concentrations, greater [GroES] was required to achieve the maximum rate, attributed to the weaker binding of GroES to GroEL in the presence of non-native protein.
In 2004, Taguchi et al. (Reference Taguchi, Tsukuda, Motojima, Koike-Takeshita and Yoshida2004) reported that BeFx, a Pi mimic, added with ATP to a 4:1 GroES/GroEL mixture halted hydrolysis, produced football complexes by EM, and resulted in all 14 nucleotide binding sites occupied with ADP. In contrast, starting with ADP and BeFx, only bullet complexes with seven ADPs were formed. Interestingly, the two rings of the footballs appeared to be non-equivalent, because gel filtration of the symmetric complex in the absence of nucleotide and BeFx led to the dissociation of one GroES molecule. As in other studies, if GroEL was saturated with two moles of non-native rhodanese per complex, symmetric complexes with two moles of substrate were formed in ATP/BeFx (confirmed by resistance to proteinase K digestion) and produced almost 2 moles of native protein when the refolding reaction was allowed to proceed to completion.
In 2008, Sameshima et al. (Reference Sameshima, Ueno, Iizuka, Ishii, Terada, Okabe and Funatsu2008) reported ensemble FRET between TMR- or Cy3-labeled E315C GroEL and Cy5-labeled C98 GroES to follow the formation of both asymmetric and symmetric GroES-GroEL complexes with BeFx in the presence of ADP or ATP, respectively. A plot of FRET efficiency versus GroES:GroEL ratio showed a maximum at 1:1 for ADP + BeFx and an almost 2-fold higher maximum at 2:1 for ATP + BeFx. Maximum FRET in the presence of ATP alone (1 min incubation) was intermediate between these and also plateaued at a 2:1 ratio, interpreted to show the presence of a mixture of bullets and footballs under this condition. If the ATP-containing reaction was followed over time, FRET gradually decreased to the value with ADP + BeFx, suggesting that ADP accumulation was causing the loss of footballs. An increase in FRET also showed that binding of a second GroES to an existing ADP/BeFx bullet to form a football occurred rapidly in the presence of ATP, but not at all if ADP was present, suggesting that the nucleotide state of the two rings of a football might be different. Importantly, the investigators suggested that the participation of footballs in the chaperonin cycle might depend critically on the ratio of ADP to ATP, with estimates of in vivo concentrations of nucleotides and chaperonins in E. coli suggesting that the two forms would likely coexist.
In 2010, Sameshima et al. (Reference Sameshima, Iizuka, Ueno and Funatsu2010) further reported on the effect of non-native substrate proteins on football formation. Adding increasing amounts of non-native MDH to a wild-type GroEL-GroES mixture in ADP/BeFx for 1 min before adding ATP led to the more rapid formation of symmetric complexes at higher MDH concentrations, judged by the increase in FRET efficiency. Correspondingly, the presence of low concentrations (20 µM) of ADP decreased the rate of football formation in 1 mM ATP in the absence of non-native substrate. Similar to Grason et al. (Reference Grason, Gresham and Lorimer2008b), the investigators suggested that substrate protein could promote the dissociation of inhibitory ADP from the trans ring of a bullet complex, allowing ATP and a second GroES to bind. Although Grason et al., had argued on the basis of rates of GroES binding and release that footballs were likely a transient species, the investigators here concluded to the contrary that the chaperonin system might favor a football-containing cycle in the presence of high concentrations of non-native protein.
Further dynamic studies
In 2013, Yang et al. (Reference Yang, Ye and Lorimer2013) examined the dynamics of both GroES and substrate protein in symmetric complexes, using stopped-flow mixing and FRET between either fluorophore-labeled E315C GroEL and 98C GroES or between the fluorophore-labeled GroEL and fluorophore-labeled non-native α-lactalbumin.
In the absence of added substrate protein, FRET characteristic of football complexes was observed within 1 s after ATP was added, but rapidly declined to the asymmetric complex value thereafter, as the first ring's worth of ATP was hydrolyzed in the ‘burst’ phase. Notably, the loss of FRET due to GroES dissociation began well before one round of hydrolysis was complete, an effect especially apparent when the experiment was carried out with a D398A version of the fluorescent GroEL, where it was estimated that only 4–5 ATPs (out of 14) had been hydrolyzed when the transition to asymmetric complexes began.
In the presence of non-native substrate protein (α-lactalbumin), a similar experiment again showed the rapid population of symmetric complexes, but here, their decay to asymmetric ones depended on the amount of substrate protein relative to GroEL. At a 25:1 ratio of substrate:GroEL, almost no decay occurred, while at 2.5:1, FRET dropped to nearly the asymmetric value. Interestingly, when bullet complexes preformed in a reaction cycling in ATP for 2 min were challenged with similar ratios of substrate protein, FRET rapidly increased to the respective symmetric levels, consistent with a dynamic system in which the football:bullet ratio depends on the saturation of GroEL with substrate protein. In a further experiment starting with preformed symmetric complexes exhibiting FRET from fluorescent α-lactalbumin complexed with fluorescent GroEL, stopped-flow mixing of an excess of unlabeled GroEL resulted in the rapid decay of FRET with kinetics (t 1/2 = 2.1 s) similar to GroES exchange under equivalent conditions. In an attempt to relate these findings to folding reactions of well-established stringent GroEL substrates, mitochondrial MDH (mMDH) and R. rubrum Rubisco, decay experiments were carried out starting with symmetric complexes containing these substrates. For both substrates, the rate of symmetric complex decay (loss of FRET between labeled GroEL and labeled GroES) was similar to the rate of loss of Rubisco from the complex (also by FRET) in parallel experiments. Because these experiments were in the presence of an ATP regeneration system, the investigators interpreted the results to mean that the football:bullet ratio changed over the course of the folding reaction as increasing amounts of substrate protein reached native form and, thus, less non-native substrate was available to drive trans ADP release and consequent rapid ATP/GroES binding and new symmetric complex formation. The investigators further concluded, based on the half-time of α-lactalbumin loss from symmetric complexes (~1 s on a per ring basis), that the dwell time for non-native substrates would be considerably less in a symmetrically cycling reaction (in the presence of excess substrate) than in an asymmetric one (no excess), where the half-time would be ~7 s, based on cis ATP hydrolysis as the rate-determining step. They suggested that this potentially more rapid cycling of non-native protein through the cis folding chamber in symmetric complexes could make folding more efficient, although this hypothesis has not been rigorously tested. (Parenthetically, if GroEL's cis timer has reached an evolutionarily-derived ‘set-point’ that is a compromise among its substrates, then it would seem that this shortening of cis dwell time would be perturbing to productive folding of at least some substrates.) Regardless, none of this data suggests, as implied by the title of this study, that a football chaperonin cycle is an exclusive mechanism for productive folding.
In 2015, Haldar et al. (Reference Haldar, Gupta, Yan, Miliĉić, Hartl and Hayer-Hartl2015) revisited the bullet/football question, suggesting that the observation of symmetric complexes in fluorescence studies might depend on the choice of fluorophores, the method of detection, and the identity of the substrate protein used. In particular, they noted that other investigators had used different fluorophore pairs in calibrated FRET experiments to estimate the populations of asymmetric versus symmetric complexes and had observed disparate results. Haldar et al. carried out similar experiments with the FRET pairs used by others and also observed apparent football:bullet ratios that similarly varied significantly between conditions. The investigators then suggested that dual-color fluorescence cross-correlation spectroscopy (dcFCCS), using two differently labeled GroES 98C preparations without GroEL modification, might provide a less perturbing and more accurate report on the fraction of symmetric complexes present under a particular set of conditions. Here, only the simultaneous presence of the two different fluorescent GroES molecules in a confocal volume was being scored, with no reliance on interactions between the fluors or need to mutationally modify GroEL to allow labeling. This approach had the additional advantage that any GroEL mutant (e.g. D398A) could be compared to wild-type without requiring further modification. Using D398A GroEL in the presence of ATP and a regenerating system as the positive symmetric control (see page 83) and wild-type GroEL with ADP as the negative (i.e. no dcFCCS signal) asymmetric control, various conditions were tested: only ATP + BeFx gave a signal close to the positive control, and wild-type GroEL with ATP and a regeneration system produced a small positive signal, suggesting the presence of a small fraction of footballs. Non-foldable GroEL-binding proteins such as α-lactalbumin and α-casein produced easily detectable (symmetric reporting) signals, although less than that of the D398A/ATP control, but foldable substrate proteins (DM-MBP, rhodanese, mMDH, and Rubisco) showed almost no signal above that of the GroEL/ADP asymmetric complex. The effect of ADP was also tested, added at ATP:ADP ratios similar to those likely to be present in vivo in E. coli (i.e. ~10:1), on the formation of footballs with unfolded α-lactalbumin. Signals in dcFCCS were considerably reduced when ADP was present (to almost asymmetric levels at a 5:1 ratio), but folding rates of DM-MBP in a parallel experiment were only slightly reduced under these nucleotide conditions, even at a 5:1 ratio. These data were interpreted to mean that symmetric complexes were much less populated than suggested by earlier FRET experiments and, therefore, that they were much less likely to be significant contributors to the folding of stringent substrates under in vivo conditions.
Summary
The role of symmetric complexes remains unresolved. It seems that both symmetric and asymmetric complexes must be present at least transiently, the former produced by GroES binding to the new cis ring as the old one discharges its ligands, and the latter required to allow substrate protein binding in an open ring and release from a discharging cis complex. There is little doubt that both asymmetric and symmetric complexes are observable in complete in vitro folding reactions of stringent substrate proteins. It will now be of interest to see how they are populated in vivo. The use of contemporary cryo-tomography techniques should be able to address this question.
Crystal structures of symmetric complexes
In 2014, two groups reported X-ray structures of symmetric complexes.
Koike-Takeshita et al. (Reference Koike-Takeshita, Arakawa, Taguchi and Shimamura2014) used a double mutant of GroEL (D52A/D398A) that severely affects ATP turnover to form crystals in the presence of GroES and ATP (PDB:3WVL), noting that the half-time of ATPase activity for this mutant was ~6 days, allowing time for growing and freezing crystals. Overall, the structure of each ring was similar to the cis GroES-bound ring of the asymmetric GroEL/GroES/ADP7 structure (Xu et al., Reference Xu, Horwich and Sigler1997). The equatorial interface between the two rings was different, however, with one ring rotated ~7° relative to the other around the sevenfold axis. Because the molecule crystallized here was a mutant form of GroEL known to have disrupted ring–ring communication and negative cooperativity, it seemed unclear how this modified interface would relate to the allosteric characteristics of a wild-type symmetric complex (but see below).
Fei et al. crystallized wild-type GroEL or GroEL/Rubisco that had been complexed with GroES in the presence of ADP–BeF3 to form symmetric complexes (PDB:4PKO, without Rubisco). Notably, the two resulting structures were very similar. No density attributable to Rubisco can be observed in the electron density map of the second complex. The equatorial interface showed the 7–8° rotational shift reported for the D52A/D398A football. The left interface site appeared to be lengthened, separating the two D-helices of the opposite subunits, attributed to interactions at their respective N-termini with the γ-phosphate of ATP, here mimicked by the BeF3.
Appendix 4
List of GroEL/GroES-dependent substrate proteins from GroE depletion experiment of Fujiwara et al. (Reference Fujiwara, Ishihama, Nakahigashi, Soga and Taguchi2010) (see Fig. 119).
Table of obligate GroEL substrates from E. coli. Reprinted from Fujiwara et al. (Reference Fujiwara, Ishihama, Nakahigashi, Soga and Taguchi2010), with permission, copyright EMBO, 2010.

Appendix 5
Additional studies comparing folding in free solution to cis folding of DM-MBP, SM-MBP, and of DapA
Efforts to characterize a DM-MBP misfolded state and the effect of confinement
Chakraborty et al. (Reference Chakraborty, Chatilla, Sinha, Shi, Poschner, Sikor, Jiang, Lamb, Hartl and Hayer-Hartl2010) noted that when DM-MBP at 1 µM concentration was subject to equilibrium in the direction of unfolding versus folding across a range of GuHCl from 0 to 1.5 M, there was a hysteresis of Trp fluorescence, monitored as the measure of the fraction of native DM-MBP. This suggested the presence of a complex energy landscape (Andrews et al., Reference Andrews, Capraro, Sulkowska, Onuchic and Jennings2013), interpreted here as reflecting a monomeric folding intermediate populated at 0.5–0.8 M GuHCl in the folding phase. Additional studies by FRET suggested a compact species with the absence of secondary structure as judged by HX. It seems possible that a monomeric intermediate was being identified, particularly in the presence of GuHCl, although at the 1 µM DM-MBP concentration used in this experiment, in the absence of denaturant, Apetri and Horwich had observed aggregation. Of note is that hysteresis behavior in low GuHCl concentration has also been observed for such aggregation-prone proteins as γ-crystallin (Kosinski-Collins and King, Reference Kosinski-Collins and King2003).
Chakroborty et al. also sought to support the idea of reduction of chain entropy by cis confinement as a means of acceleration of the rate of folding of DM-MBP in the cis cavity versus free solution. The investigators showed that when they engineered disulfides into DM-MBP and oxidized, it led to an acceleration of reaching native form in free solution by fivefold or greater, but produced only a small increase of cis folding rate. This was taken to argue that the entropic contribution of confinement in cis is producing the acceleration of DM-MBP refolding. In respect to potentially preventing the population of a misfolded state in cis, it seems possible that chain confinement is playing a role, albeit that other influences might be operative to close off the route to a misfolded monomer.
Chakroborty et al. also carried out further tests concerning the effects of wall charge on DM-MBP folding using the mutant SR-KKK2, but given the later observations of Motojima et al. (Reference Motojima, Motojima-Miyazaki and Yoshida2012; see page 104) such tests appear uninterpretable.
HX and tryptophan fluorescence study of a single mutant form of MBP
In 2018, Ye et al. (Reference Ye, Mayne, Kan and Englander2018) reported on the folding of wild-type MBP and the singly-substituted form, V8G. Using chloride-free conditions to suppress aggregation, they observed, using pulsed deuterium labeling, acid quenching, and proteolysis/MS-MS, that wild-type MBP formed an early H-bonded intermediate within 1.2 s, with long-range H-bonds corresponding to native structure, and modeling indicated that a collapsed core of 24 hydrophobic side chains was present. Later-formed bonds (~20–40 s) appeared to occur beyond a large kinetic barrier that is rate-limiting for reaching the native state. Interestingly, a number of mutants affecting MBP folding kinetics lie in the putative hydrophobic core, including V8G. Indeed, V8G produced the early intermediate at a rate 20-fold slower than wild-type, and native form was reached at a rate 50% that of wild-type. When GroEL-bound V8G was cis-encapsulated by the addition of GroES/ATP, now the pulsed-exchange patterns became identical to wild-type. Consistent with this result, V8G folding, followed by a rise of Trp fluorescence, showed a faster rate in GroEL/GroES/ATP than in free solution. Further exchange analysis of the hydrophobic cluster segments suggested that they formed a pre-intermediate that is weakly protected in wild-type but completely unprotected in V8G. GroEL/GroES/ATP restored this protection. A model was proposed wherein the encapsulation of the collapsed pre-intermediate serves to ‘compress’ its hydrophobic core, restoring the wild-type rate of folding. These observations and conclusion likely have relevance as well to folding of DM-MBP folding (which includes V8G as well as Y283D), but this model might simply reflect one of a number of ways in which the cis cavity can perturb an otherwise agnostic behavior toward the rate of cis folding (see page 101).
Studies of DapA folding
In 2014, Georgescauld et al. (Reference Georgescauld, Popova, Gupta, Bracher, Engen, Hayer-Hartl and Hartl2014) reported on a study of folding of DapA, an essential homotetramer of 31 kDa subunits that is involved in cell wall synthesis (see page 87). They compared the kinetics of folding in solution under permissive conditions, 10–25 °C, with folding in the cis cavity, and carried out a study of secondary structure acquisition using HX. The renaturation study, carried out with 200 nM DapA subunit at 25 °C, observed an ~30-fold greater rate of folding in the cis cavity versus solution. Notably, the yield at 15, 20, and 25 °C was reported as ~75% from the solution refolding reaction, compared with ~100% yield from chaperonin. The HX study employed a much higher concentration of DapA subunit, 2.4 µM, and lower temperature, 10 °C, the latter presumably in an effort to maintain permissive conditions despite the high concentration of DapA. This latter condition was tested by Ambrose et al. (Reference Ambrose, Fenton, Mason, Chapman and Horwich2015), and they observed immediate and substantial dynamic light scattering upon dilution from denaturant. When the solution mixture was centrifuged, a pellet of aggregated DapA protein was directly observed, and contained ~25% of the input DapA. In contrast, dilution into the mixture with GroEL exhibited no light scattering and no insoluble material was recovered upon centrifugation. These results would indicate that, at least for the HX study conducted by Georgescauld et al., the solution reaction they analyzed contained states of DapA that are off-pathway misfolded states that are multimerizing and aggregating. Thus, the HX data of the solution reaction comprised a convolution of DapA states including multimeric ones that do not afford a direct comparison of two putatively distinct pathways of monomer folding. Whether the kinetic measurements at 200 nM DapA/25 °C are also complicated by aggregation remains untested, but there surely seems some uncertainty, raised by the reduced recovery, about whether DapA is entirely monomeric in solution at such a concentration (required for affording a genuine comparison of rates of folding of monomer in solution and cis). This said, it remains possible that DapA refolding at high dilution or at the level employed in single-molecule experiments could be faster in the cis cavity than free in solution.


 Open access

