


Introduction
Marriage is a matrimony recognized both culturally and legally between two or more people called spouse(s). It establishes rights and obligations between the couples and their children. Individuals marry for legal, social, emotional, financial, spiritual, libidinal, or religious reasons. Whom a girl marries may be influenced by prescriptive marriage rules, parental choice, or individual desire.
Marriage at times may be wanted or unwanted at a particular time, depending on the situation that leads to contracting it. Socio-cultural demand and unwanted pregnancy can propel individuals particularly women to marry early, even when the female children are not fully prepared for it (Adebowale et al., Reference Adebowale, Fagbamigbe, Okareh and Lawal2012). Whereas marriage is often characterized by moments of celebration and a landmark in adult life, the practice of early marriage may not permit such celebration. The imposition of a marriage partner upon a female children means that their childhood is cut short and their fundamental rights are compromised. While much of the impact remains hidden, it is clear that millions of young girls continue to suffer the negative consequences of early marriage worldwide (UNICEF, 2021b).
Globally, about 39,000 girls under the age of 18 years marry daily, culminating in more than 14.2 million annually which is most common in South Asia and sub-Saharan Africa. About 700 million women alive were married before their 18th birthday with more than one in three (250 million) entering into a union before age 15 years (UNICEF, 2021b). It is projected that, given the prevailing trends, up to 280 million girls alive are at risk of becoming brides by the time the female children turn 18 years old. Nigeria is the country with the highest overall prevalence followed by Bangladesh, which has the highest rate of child marriage involving girls less than age 15 (UNICEF, 2021b). In Nigeria, about 44% of girls are married before the age of 18 years and 18% are married before the age of 15 (World Bank, 2017). This makes Nigeria the third country with the highest absolute number of child brides in the world but at 3.5 million (Obaje et al., Reference Obaje, Okengwu, Uwimana, Sebineza and Okorie2020).
Several studies have revealed the negative impacts of child marriage on the economy of a country, psycho-social effects and the health of the child (Fang et al., Reference Fang, Fry, Ren, Jin, Zhu, Sesay, Abba, Bollinger and Wekerle2024; Kyari and Ayodele, Reference Kyari and Ayodele2014). The effects on the economy include high under-five mortality rates due to lack of or inability to provide appropriate nutrition by the young mother; high divorce rate and poverty rates; high population growth rate; and the most common is low educational attainment for the child brides (Lemmon and ElHarake, Reference Lemmon and ElHarake2014; Obaje et al., Reference Obaje, Okengwu, Uwimana, Sebineza and Okorie2020). Obaje et al. (Reference Obaje, Okengwu, Uwimana, Sebineza and Okorie2020) noted that about 70% of maternal deaths can be averted through 10% reduction in child marriage. Parsons et al. (Reference Parsons, Edmeades, Kes, Petroni, Sexton and Wodon2015) suggested five domains in which child marriage has an impact including fertility, educational attainment, health, labour force participation, and decision making. Because of early and frequent exposure to sexual activities, the women tend to have more children than their counterparts who marry late; their educational pursuits are often truncated leading to a low capacity to actively participate in high-paid jobs (Gayawan and Adebayo, Reference Gayawan and Adebayo2013).
A study by Adeyemi and Gayawan (Reference Adeyemi and Gayawan2022) reported that younger women who are in a marital union have a lower ability to participate in household decision making including the ability to negotiate for the use of contraceptives or healthcare utilization, whether for themselves or their children. Pregnancies, when a woman’s body mechanism is not fully mature, can constitute a major risk to the survival and future health of both the mother and the child; early sexual activities and childbearing can lead to a condition called Vesico-Vaginal Fistulae/Recto-Vaginal Fistulae; high maternal and child mortally, obstructed labour, postpartum haemorrhage, obstetric fistula, and also lower birth weight of infants due to lack of appropriate nutrition and high exposure to sexually transmitted infections and diseases (WHO, 2013). The psycho-social effects include early widowhood, mental disorder, sexual abuse, child labour, and no or low participation in the family decision-making process (World Bank, 2017). Although higher levels of education, socioeconomic status, and urban residence are precursors for reducing child marriage practice, variations subsist due to ethnic and religious differences (Mobolaji et al., Reference Mobolaji, Fatusi and Adedini2020). For example, in Malaysia, despite the country’s economic progress and high education level, the prevalence of child marriage remains high and is underpinned by religious and cultural beliefs (Kohno et al., Reference Kohno, Dahlui, Nik Farid, Safii and Nakayama2020). The same exists in parts of Nigeria (Mobolaji et al., Reference Mobolaji, Fatusi and Adedini2020).
Globalization, urbanization, and rising educational attainment are now changing marital patterns in different parts of the world (Kamal et al., Reference Kamal, Hassan, Alam and Ying2015; Stark, Reference Stark2018). A high level of education has drastically reduced the prevalence of child marriage; that is, keeping girls in schools is one of the best ways of delaying marriage. On average, the likelihood of girls marrying as a child is six per cent points less for every additional year spent in school (Kamal et al., Reference Kamal, Hassan, Alam and Ying2015). Consequently, successive Nigerian governments have made concerted and practical efforts to improve girl-child education throughout the country but particularly in the northern fringe where Almajiri schools were specifically sited, to reduce the age-long divide in educational attainment, social status, and economic empowerment between the north and the south (Aghedo and Eke, Reference Aghedo and Eke2013; Fahm et al., Reference Fahm, Azeez, Imam-Fulani, Mejabi, Faruk, Abdulrahaman, Olawoyin, Oloyede and Surajudeen-Bakinde2022). Existing companies and other corporate bodies have increased their corporate social responsibility targets on creating opportunities for women and girls, particularly by expanding the chances of getting them to school. For example, many multinational oil companies operating in the country have been involved in a wide range of scholarships and educational programs, especially for women and girls in the Niger Delta areas (Uduji et al., Reference Uduji, Okolo-Obasi and Asongu2020). These efforts are expected to have an impact on the pattern of child marriage in different geographical settings in Nigeria.
There has been programmes and actions by international organizations to put an end to child marriage for which Nigeria has been a beneficiary. For instance, to ensure the attainment of the Sustainable Development Goal (SDG) 5.3 which seeks to eliminate all harmful practices including child, early and forced marriage, the United Nation Population Fund (UNFPA) and UNICEF came up with a 15-year programme (2016–2030) to end child marriage but the early phase of the programme was affected by the challenges posed by COVID-19 such as school closure, poverty and economic insecurity, and interruptions in prevention and protection services (UNICEF, 2021a). This initiative emphasized community-driven solutions, cultural change, and support systems for girls, alongside increased donor commitments, data-driven strategies, and resource allocation to address disparities and measure progress (UNICEF, 2024; ECOWAS, 2019). Following the 33rd summit of ECOWAS countries in 2019, the African Union (AU) launched a campaign to raise awareness about the harmful impacts of child marriage. It urged Member States to adopt appropriate social and legal measures that could curtail the practice (Save the Children, 2019). In Nigeria, this campaign reinvigorated the earlier launched National Strategy to End Child Marriage, implemented between 2016 and 2021 (UNFPA, 2021). These interventions were based on earlier efforts, such as the 2006 Prohibition of Child Marriage Act endorsed by the Federal Government of Nigeria, which criminalized child marriage, outlined procedures for annulling such unions, and provided protections for victims. Nigeria is also a signatory to key international and regional agreements, including the Convention on the Elimination of All Forms of Discrimination against Women (CEDAW) in 1979, the Convention on the Rights of the Child (CRC) in 1989, the African Charter on the Rights and Welfare of the Child (ACRWC) in 1990, and the Child Rights Act of 2003, which domesticated both the CRC and ACRWC.
In Kaduna state, the Pathways Foundation introduced the Centre for Girls Education (CGE) program, targeting unmarried girls and school dropouts by providing financial and social support through mentored girls’ clubs and offsetting education costs (Pathways, 2016). This 9 months initiative focused on building social ties and life skills while covering practical costs, such as school fees, uniforms, and textbooks. CGE also implemented various interventions, including preschool spaces using the Montessori approach, vocational training for out-of-school girls, safe spaces for married adolescents, and advocacy programs to empower girls. These programmes have significantly reduced child marriage by improving the well-being and opportunities available to girls (Pathways, 2016). Similarly, UNICEF’s Girls Education Project targeted five (5) Northern Nigerian states including Bauchi, Niger, Katsina, Sokoto, and Zamfara through an education-based interventions (Chege et al., Reference Chege, Zakariya, Okojie and Aregbeyen2008). Although these efforts are contributing to improving the lots of women and girls in different parts of the country, gaps persist regarding child marriage interventions in the country.
As emphasized by Greene et al. (Reference Greene, Siddiqi and Abularrage2023), there is a need to incorporate individual, community, institutional, and societal norms into programmes to scale and sustain change. Mass media interventions have also shown promise; for instance, Jacobs et al. (Reference Jacobs, Marino, Edelman, Jensen and Darney2017) demonstrated the role of media in promoting family planning and preventing child marriage, while Omobowale et al. (Reference Omobowale, Omigbodun, Egbokhare and Koski2023) advocated for campaigns through radio stations in Southwest Nigeria. Other recent studies have systematically identified interventions and risks associated with child marriage using cross-sectional data from the Nigeria Demographic and Health Surveys (DHS) (Bolarinwa et al., Reference Bolarinwa, Ahinkorah, Okyere, Seidu and Olagunju2022; Isiugo-Abanihe et al., Reference Isiugo-Abanihe, Oyediran and Fayehun2022; Arowolo, Reference Arowolo2022). The impact of these initiatives and interventions can, however, vary from place to place, but limited studies have examined the spatio-temporal patterns of child marriage in Nigeria. Such study could reveal the impact of variations in the implemented strategies, interventions, and policies to combat child marriage.
Therefore, this study was designed to analyze the changes in the pattern of child marriage in space and time in Nigeria based on data from the DHS and provide a comprehensive understanding of how the existing policy and programmes have contributed or failed to reducing child marriage prevalence. The purpose was to determine the level of changes that have occurred in girl-child marriage in different locations in Nigeria over a 15-year period. The study deployed a Bayesian spatio-temporal random model that simultaneously estimates the factors influencing child marriage while quantifying the geographical locations and space-time variations at the state and the regional level in Nigeria, with inference based on the R interface to integrated nested laplace approximation (INLA). The study is expected to provide findings that would be useful in tracking progress and explain how specific programmatic and policy interventions at the national and state levels have shaped observed trends and potentially aid in targeted intervention.
Material and method
Data
Data on child marriage were collated from the national household-level data sourced from the NDHS (www.dhsprogram.com). The survey is often conducted at 5-year intervals for most developing countries. The data are realized through a two-stage sampling scheme where, in the first stage, enumeration areas are selected from the list of sampling frames for the population and housing census earlier conducted in the country. The second stage involves the selection of households from the list of enumeration areas. Eligible women respondents are those aged 15-49 years who live in the household or slept in the household the night before the survey. The data for this study were extracted from four waves of surveys conducted in Nigeria in the years 2003, 2008, 2013, and 2018. The study primarily focus on women between ages 15 and 24 years and constructed the dependent variable as a binary indicator that takes a value of 1 if the woman got married before attaining age 18 years and 0 if otherwise. The covariates used in the study were chosen based on past related studies and include the woman’s educational attainment (at the time of the survey), place of residence (urban or rural), religious affiliation, working status, wealth index, and ethnicity. The state of residence of the respondents was used as the unit for the spatio-temporal analysis. A total sample size of 21,125 was used for the analysis as indicated in Table 1. The frequency and percentage distributions of the data based on the covariates are presented in Table 1.
The total sample size of the Socio-demographic characteristics used for the analysis of the Binomial model

Statistical method
The modelling approach is based on a Bayesian spatial-temporal random effect model that considers a binary outcome given some predictor variables and the space-time component. Let suppose that Y
it
is the number of women who married before age 18 years in state i during the survey period t (time) and n
it
is the total number of households that were sampled in each state and during each survey year. Consequently, assuming that Y
it
follows a binomial distribution denoted as Y
it ∼ B(n
it,
λ
it) such that i $ \in $
(1…, 37) and t
$ \in $
(1…, 37) and t $ \in $
(2003, 2008, 2013, 2018). In this model, λᵢₜ indicates the probability that a woman would get married before attaining age 18 years within state i during the survey year t. This probability can be linked to the available covariates through a link function, and the study considered a logit link commonly used in the literature. However, some other options such as probit complementary log-log link functions are possible. This yields the following equations.
$ \in $
(2003, 2008, 2013, 2018). In this model, λᵢₜ indicates the probability that a woman would get married before attaining age 18 years within state i during the survey year t. This probability can be linked to the available covariates through a link function, and the study considered a logit link commonly used in the literature. However, some other options such as probit complementary log-log link functions are possible. This yields the following equations.
 $${\rm{log}}\;{{\lambda \left( {{\rm{i}},{\rm{t}}} \right)} \over {1\; - \;\lambda \left( {{\rm{i}},{\rm{t}}} \right)}}\; = \;{{\rm{\eta }}_{it}} = \alpha + {\beta _k}{X_k}\left( {i,{\rm{ }}t} \right) + {f_{spat}}\left( {{S_i}} \right) + {U_{temp}}\left( t \right) + {\gamma _{interaction}}\left( {i,t} \right)$$
where α is the model constant for all the parameters, βkXk(i, t) represents the covariate matrix for space i and time t where k = 1, …, n, β is the coefficient of the vector of the regression parameters X
k
, f
spat
(S
i
) is the spatial component accounting for the existent spatial autocorrelation, U
temp
(t) is the temporal component accounting time effects, and ${\rm{\gamma}}$
interaction
(i, t) is the space–time interaction. f
spat
(S
i
) was modelled assuming a Gaussian conditional autoregressive (CAR) prior defined as:
${\rm{\gamma}}$
interaction
(i, t) is the space–time interaction. f
spat
(S
i
) was modelled assuming a Gaussian conditional autoregressive (CAR) prior defined as:
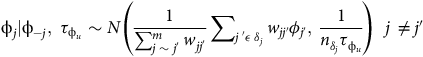 $${{\rm{\phi}} _j}|{{\rm{\phi}} _{ - j}},\;{\tau _{{{\rm{\phi}} _u}}}\sim N\left({1 \over {\mathop \sum \nolimits_{j\;\sim \;j'}^m {w_{jj'}}}}\mathop \sum \nolimits_{j\;'\epsilon \;{\delta _j}} {w_{jj'}}{\phi _{j'}},\;{1 \over {{n_{{\delta _j}}}{\tau _{{{\rm{\phi}} _u}}}}}\right)\;\;j\; \ne j'$$
where ${n_{{\delta _j}}}$
is the number of neighbours of regions j,
${n_{{\delta _j}}}$
is the number of neighbours of regions j, ${\delta _j}$
are the neighbourhood regions of j’th,
${\delta _j}$
are the neighbourhood regions of j’th, ${w_{jj'}}$
is the weighted neighbourhood matrix defined through an adjacency matrix of common boundaries given a region while
${w_{jj'}}$
is the weighted neighbourhood matrix defined through an adjacency matrix of common boundaries given a region while ${\rm{\gamma}}$
interaction
(i, t) was considered to be independently and identically distributed and modelled with a random walk 2, and
${\rm{\gamma}}$
interaction
(i, t) was considered to be independently and identically distributed and modelled with a random walk 2, and ${\tau _{{\phi _u}}}$
is the precision of the spatial random effect. Considering the model complexity and accuracy requirement of the Bayesian spatial-temporal random effect modelling, INLA is used for analyzing the model because it provides an approximation solution when dealing with latent Gaussian models and spatial statistics.
${\tau _{{\phi _u}}}$
is the precision of the spatial random effect. Considering the model complexity and accuracy requirement of the Bayesian spatial-temporal random effect modelling, INLA is used for analyzing the model because it provides an approximation solution when dealing with latent Gaussian models and spatial statistics.
Result
Table 2 presents the hyperparameter estimates of spatial, temporal, and spatio-temporal interactions showing the posterior mean, standard deviation, and the 95% credible interval because it deals with the survey year, spatial, and space–time components. The study also presents the estimate for the linear effect model while accounting for different covariates, characterized as socio-demographic variables. This allows us to determine the impact of the covariates in shaping the space-time variation in child marriage in Nigeria over the fifteen (15) years. The result of the spatial and space-time interaction is presented below.
Hyperparameters model displaying the posterior mean, posterior standard deviation with the 95% credible interval where ${{\bf{\tau}}_{\bf{u}}}$
is the precision matrix,
${{\bf{\tau}}_{\bf{u}}}$
is the precision matrix, ${{\rm{\tau }}_{{\phi _t}}}$
is the spatial effect,
${{\rm{\tau }}_{{\phi _t}}}$
is the spatial effect, ${{\rm{\tau }}_{{{\rm{u}}_t}}}$
is the temporal effect, and
${{\rm{\tau }}_{{{\rm{u}}_t}}}$
is the temporal effect, and ${{\rm{\tau }}_{{{\rm{\gamma }}_{it}}}}$
is the spatio-temporal interaction
${{\rm{\tau }}_{{{\rm{\gamma }}_{it}}}}$
is the spatio-temporal interaction
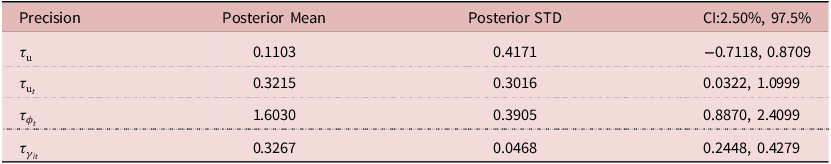
Table 3 presents the parameter estimates for the linear effects of the model. As stated, the model explains the socio-demographic and economic characteristics in conjunction with the spatial effect, temporal effect, and spatiotemporal interaction for the probability of a girl getting married before attaining the age of 18. The estimates in linear effect model (Table 3), spatial effect (Fig. 1), temporal effect (Table 3), and spatial–temporal interactions (Figs. 2–5) are presented in terms of the odd ratios while the estimated probabilities for each state are plotted in the maps. The findings for the survey year show that the estimates of 2003, 2008, 2013, and 2018 were not significant. The findings revealed that the controlling for the socioeconomic and demographic characteristics of the odd increased substantially over time. Specifically, the odds that a child will get married before the age of 18 years in 2003 is lower when compared with other survey years and all estimates are not statistically significant.
Parameter estimates for the linear effects showing the odd ratio (OR), standard deviation (STD), and 95% credible intervals (CI) where LCI is lower credible and UCI represents Upper credible interval

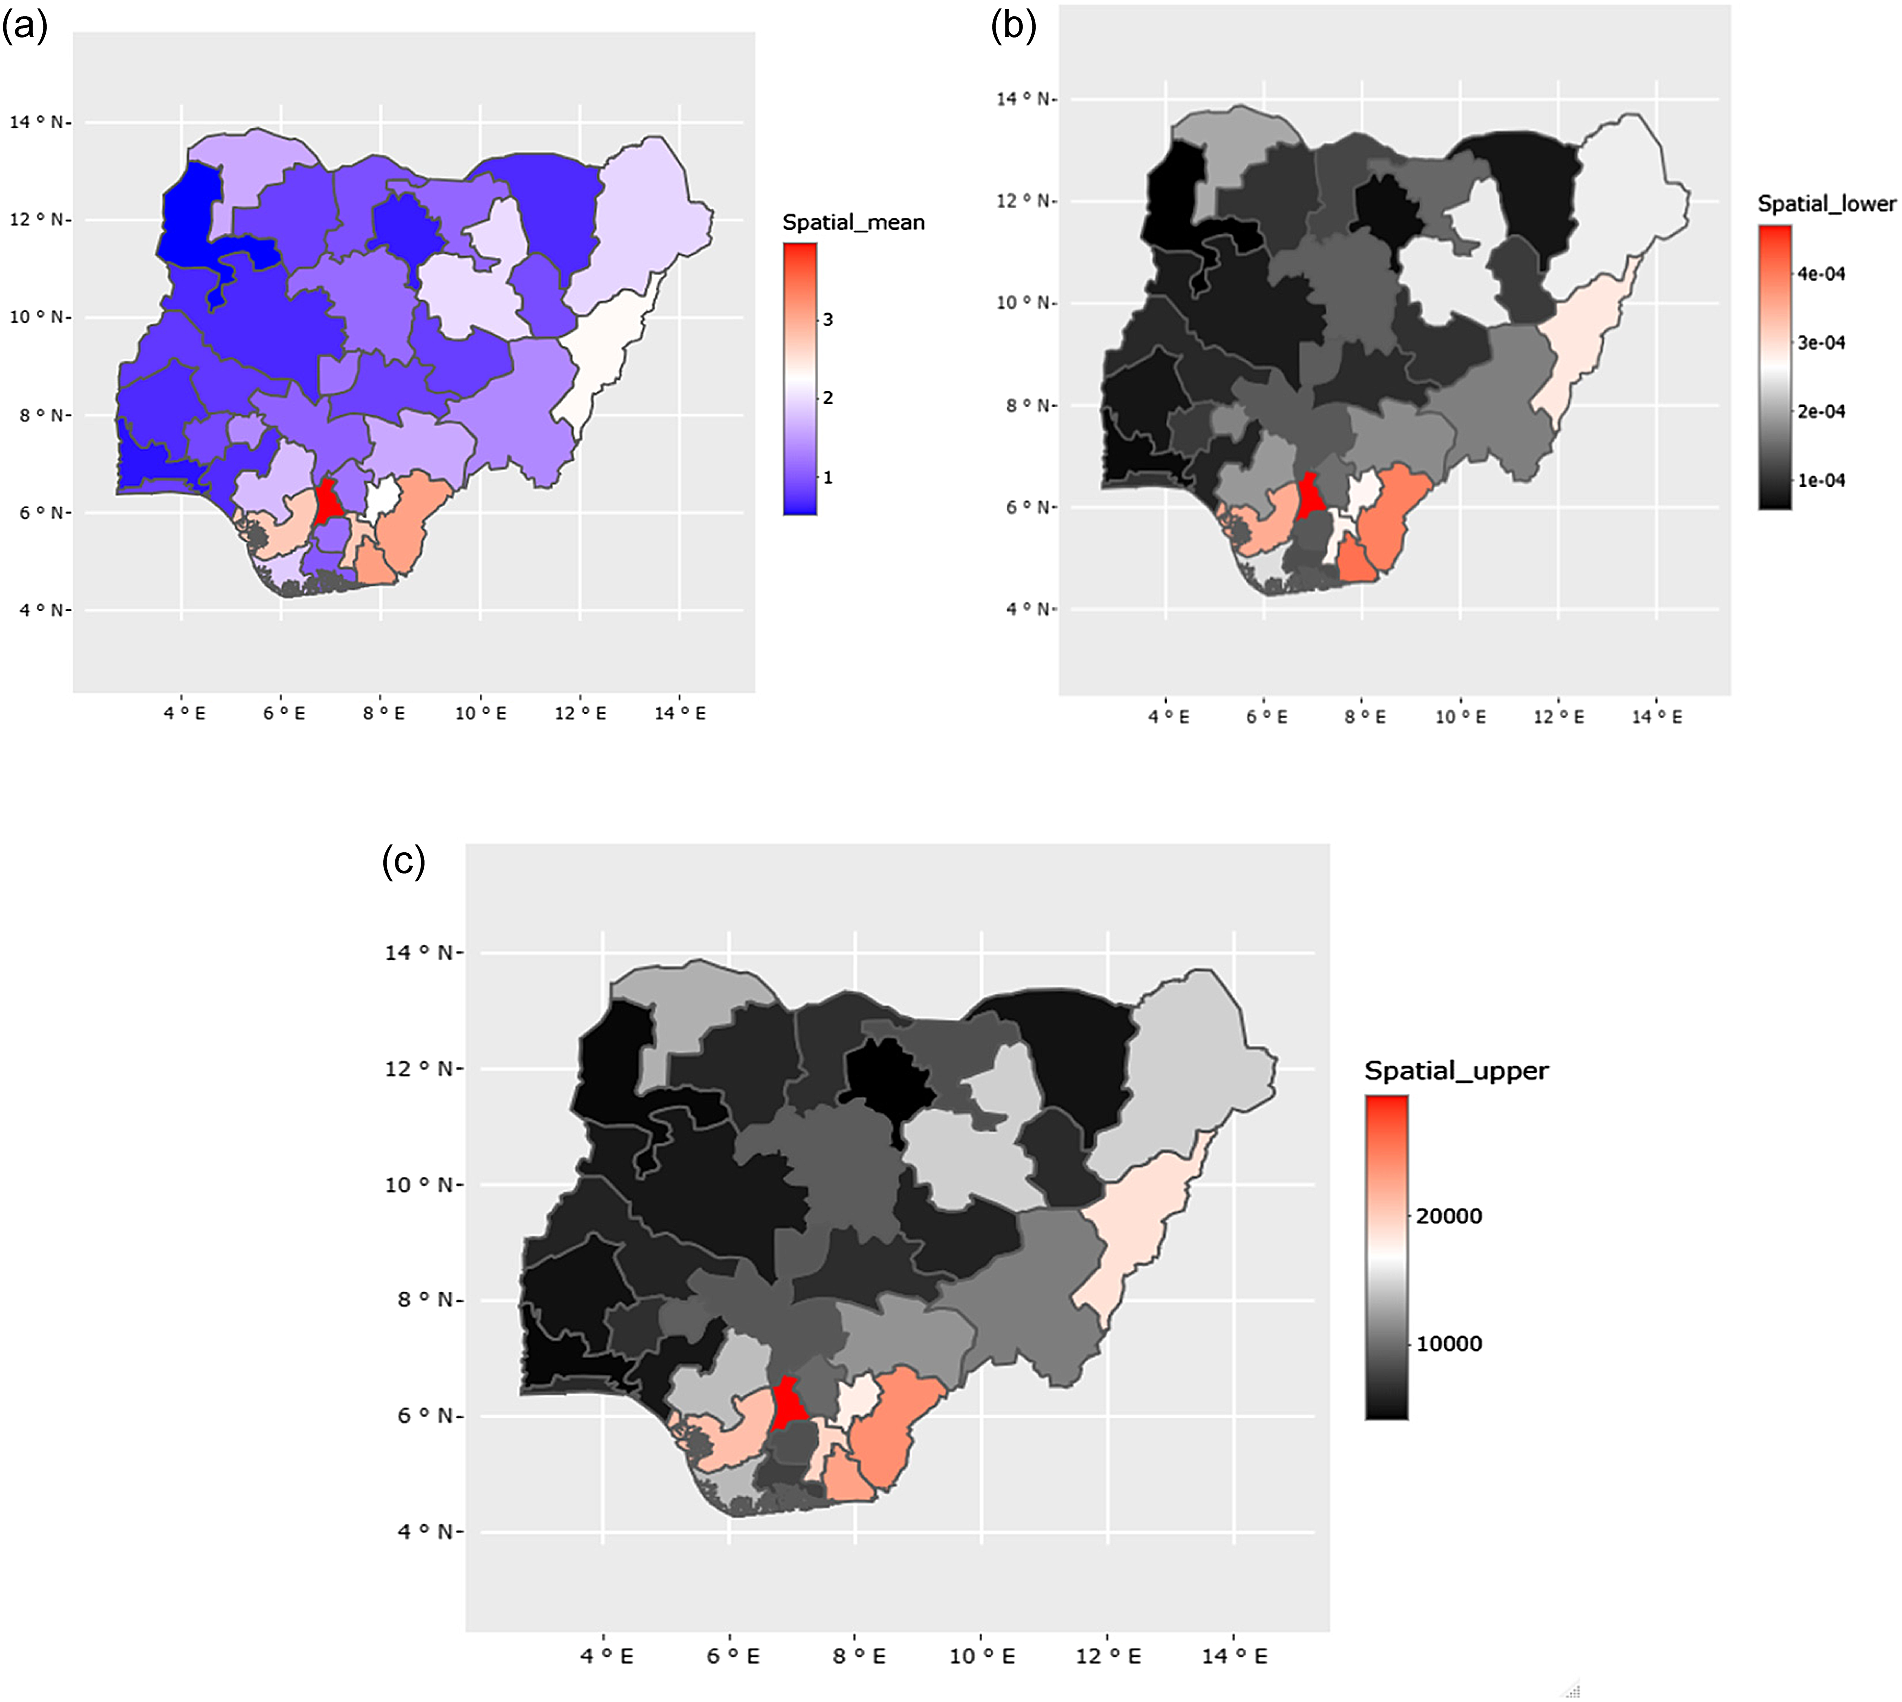
A spatial random effect accounting for correlated heterogeneity in the prevalence of child marriage across the 36 states plus Federal Territory Capital, Nigeria showing the (a) odd ratio, (b) lower credible interval (LCI), and (c) upper credible interval (UCI).
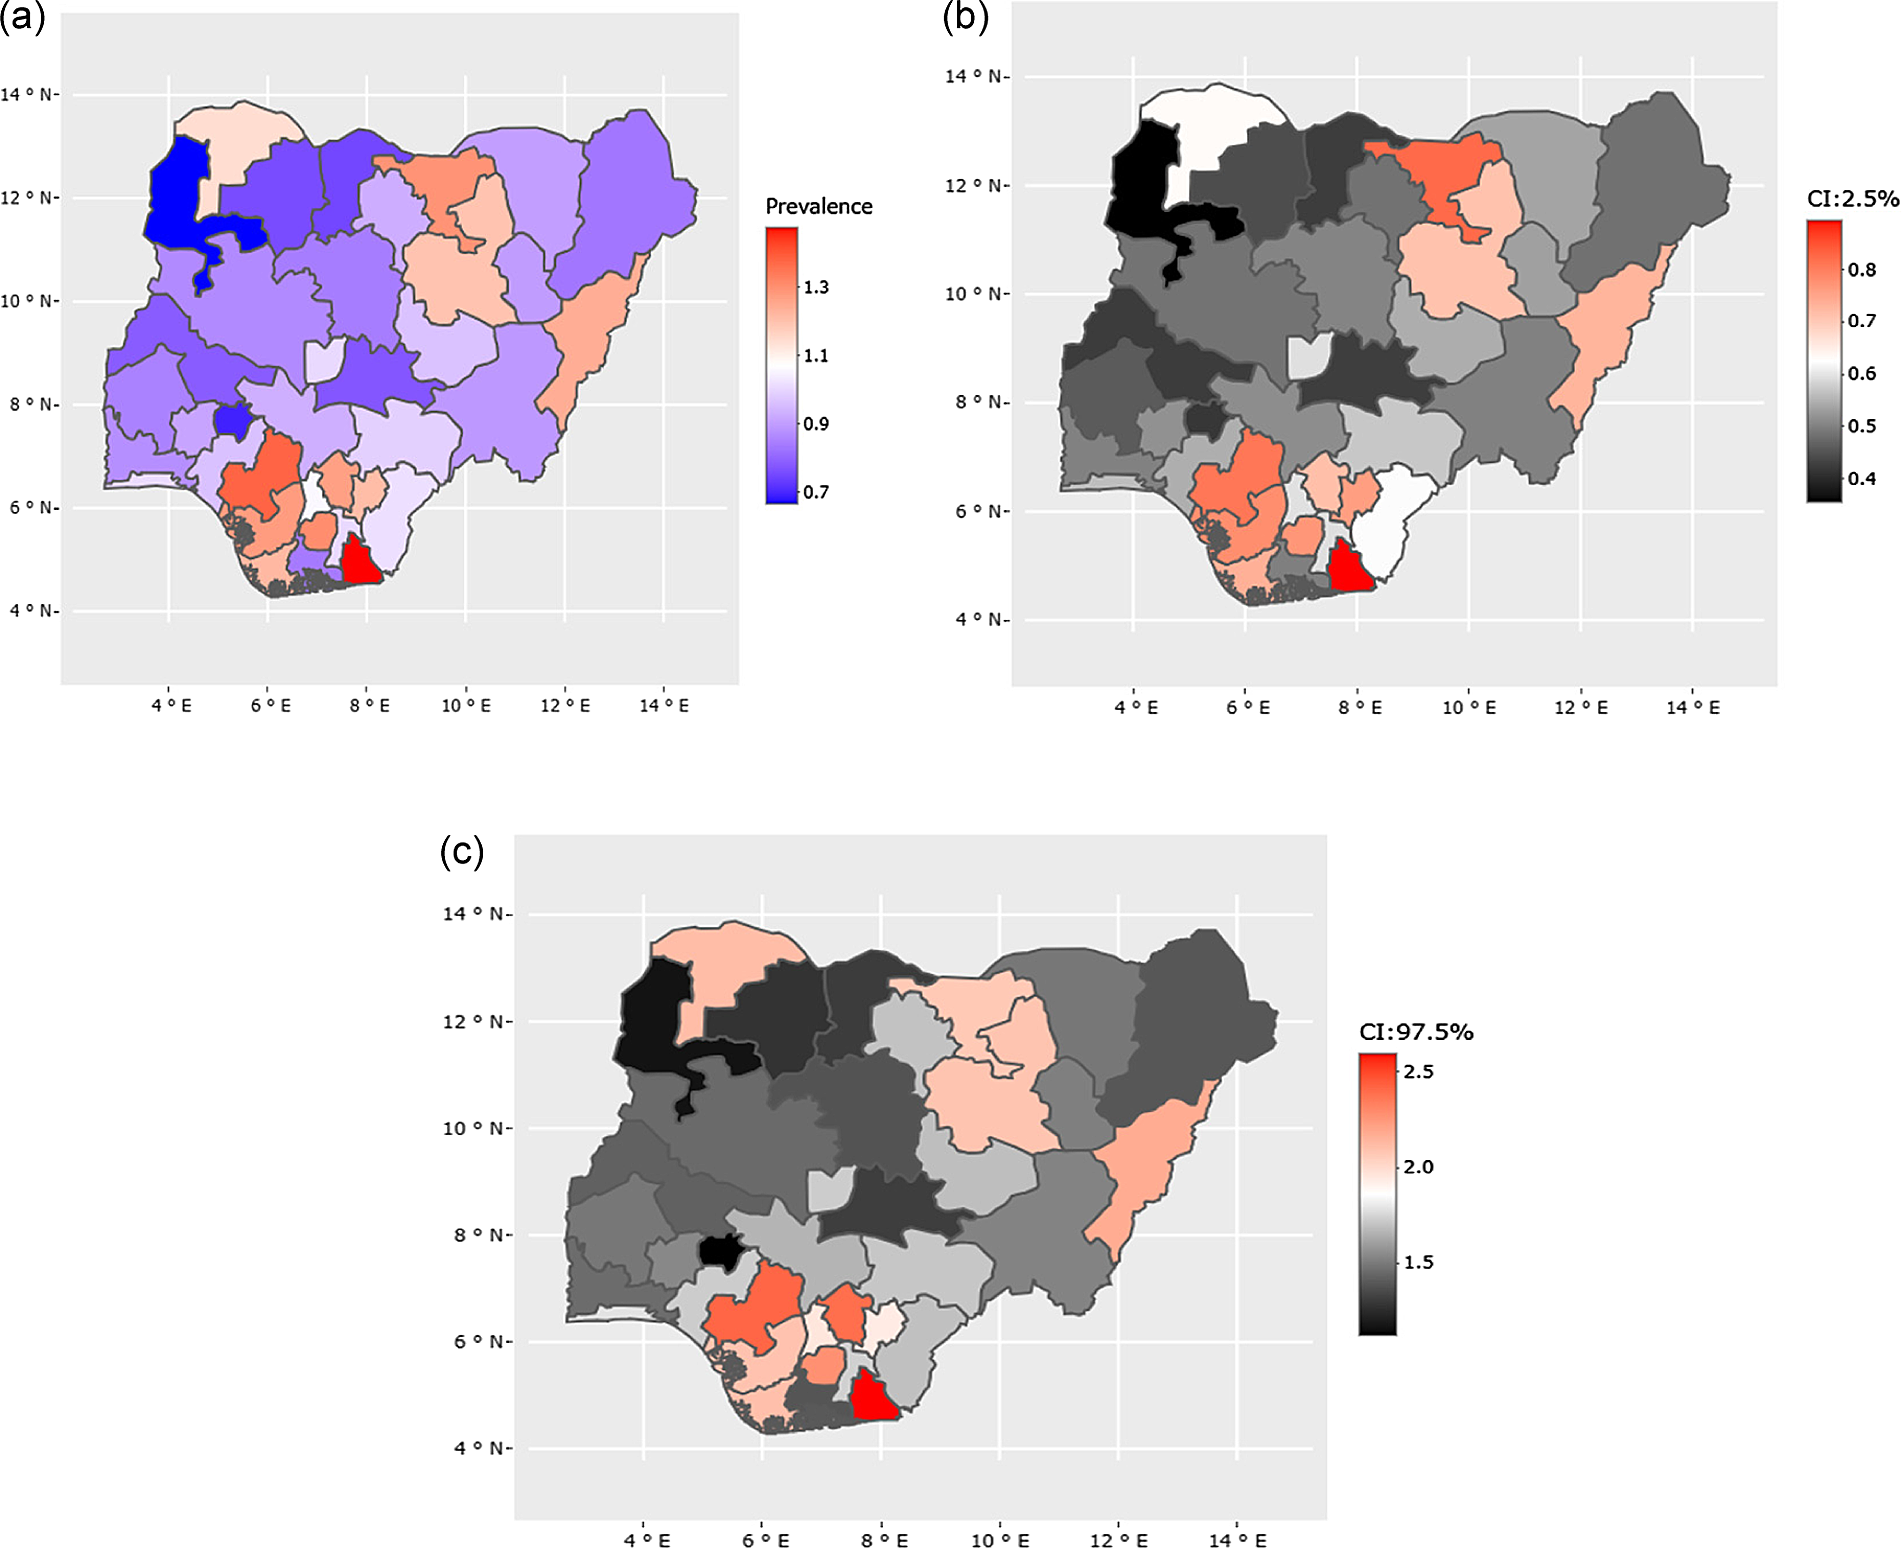
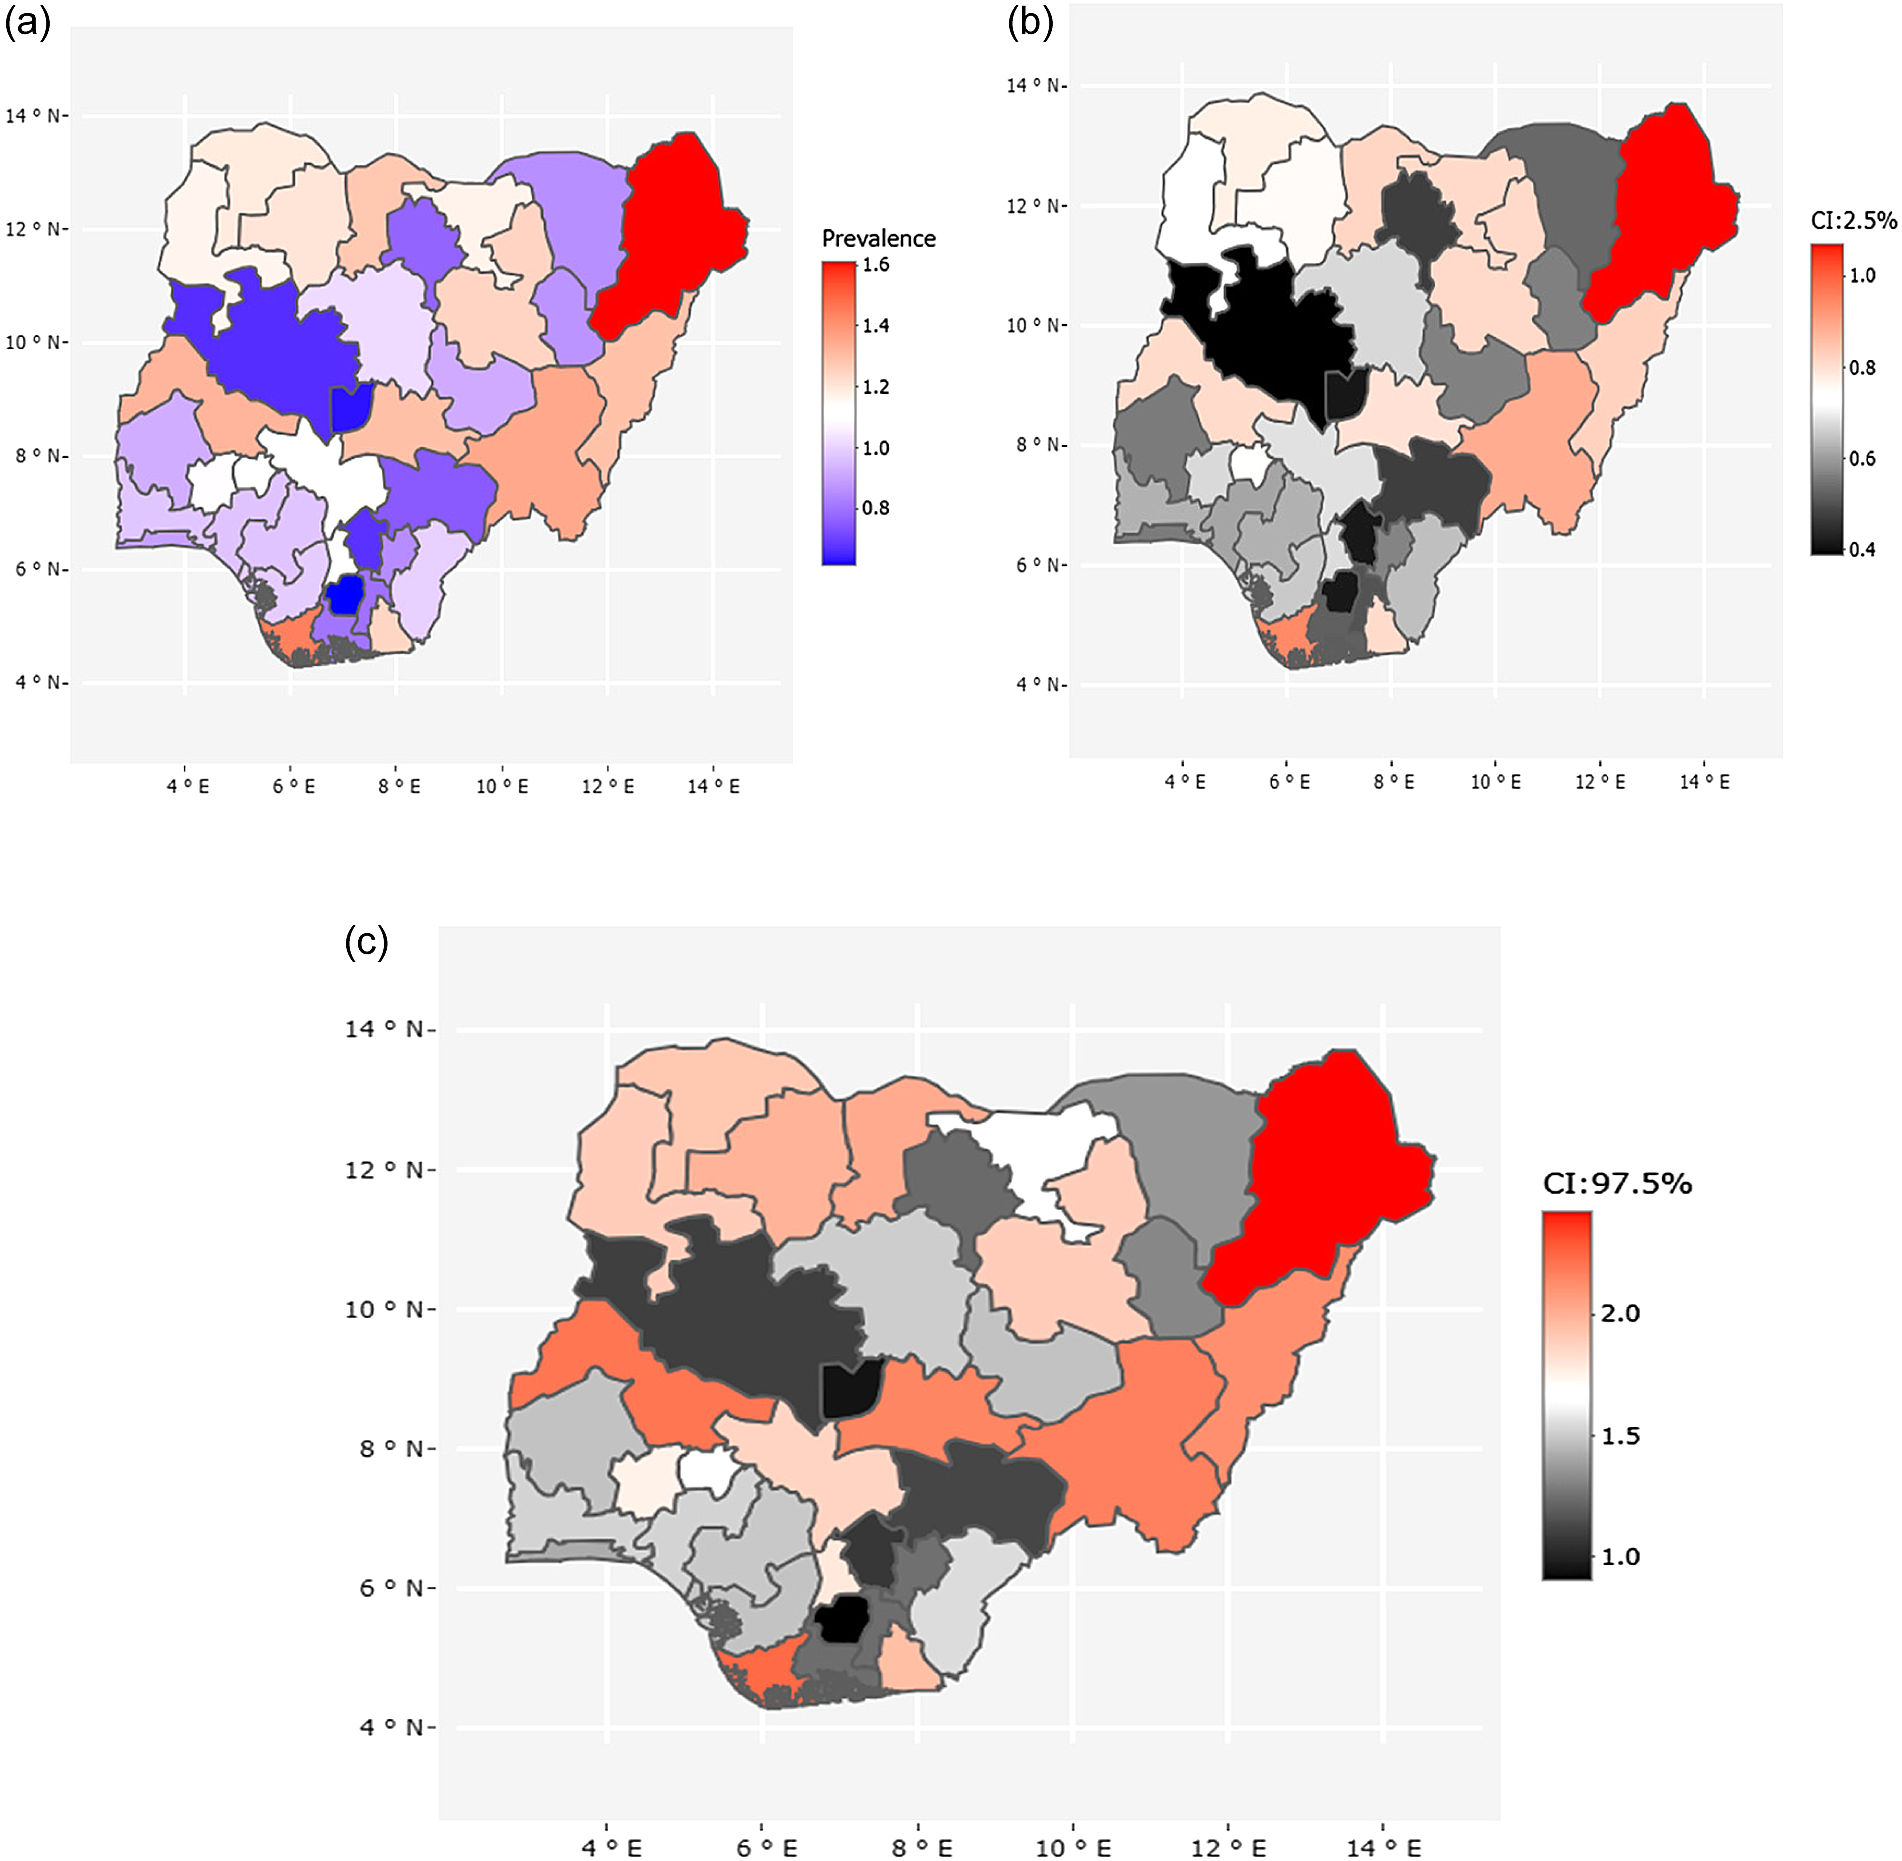
The space–time interaction of child marriage across the 37 states in 2003 showing the (a) odd ratios, (b) lower credible interval, and (c) upper credible interval.
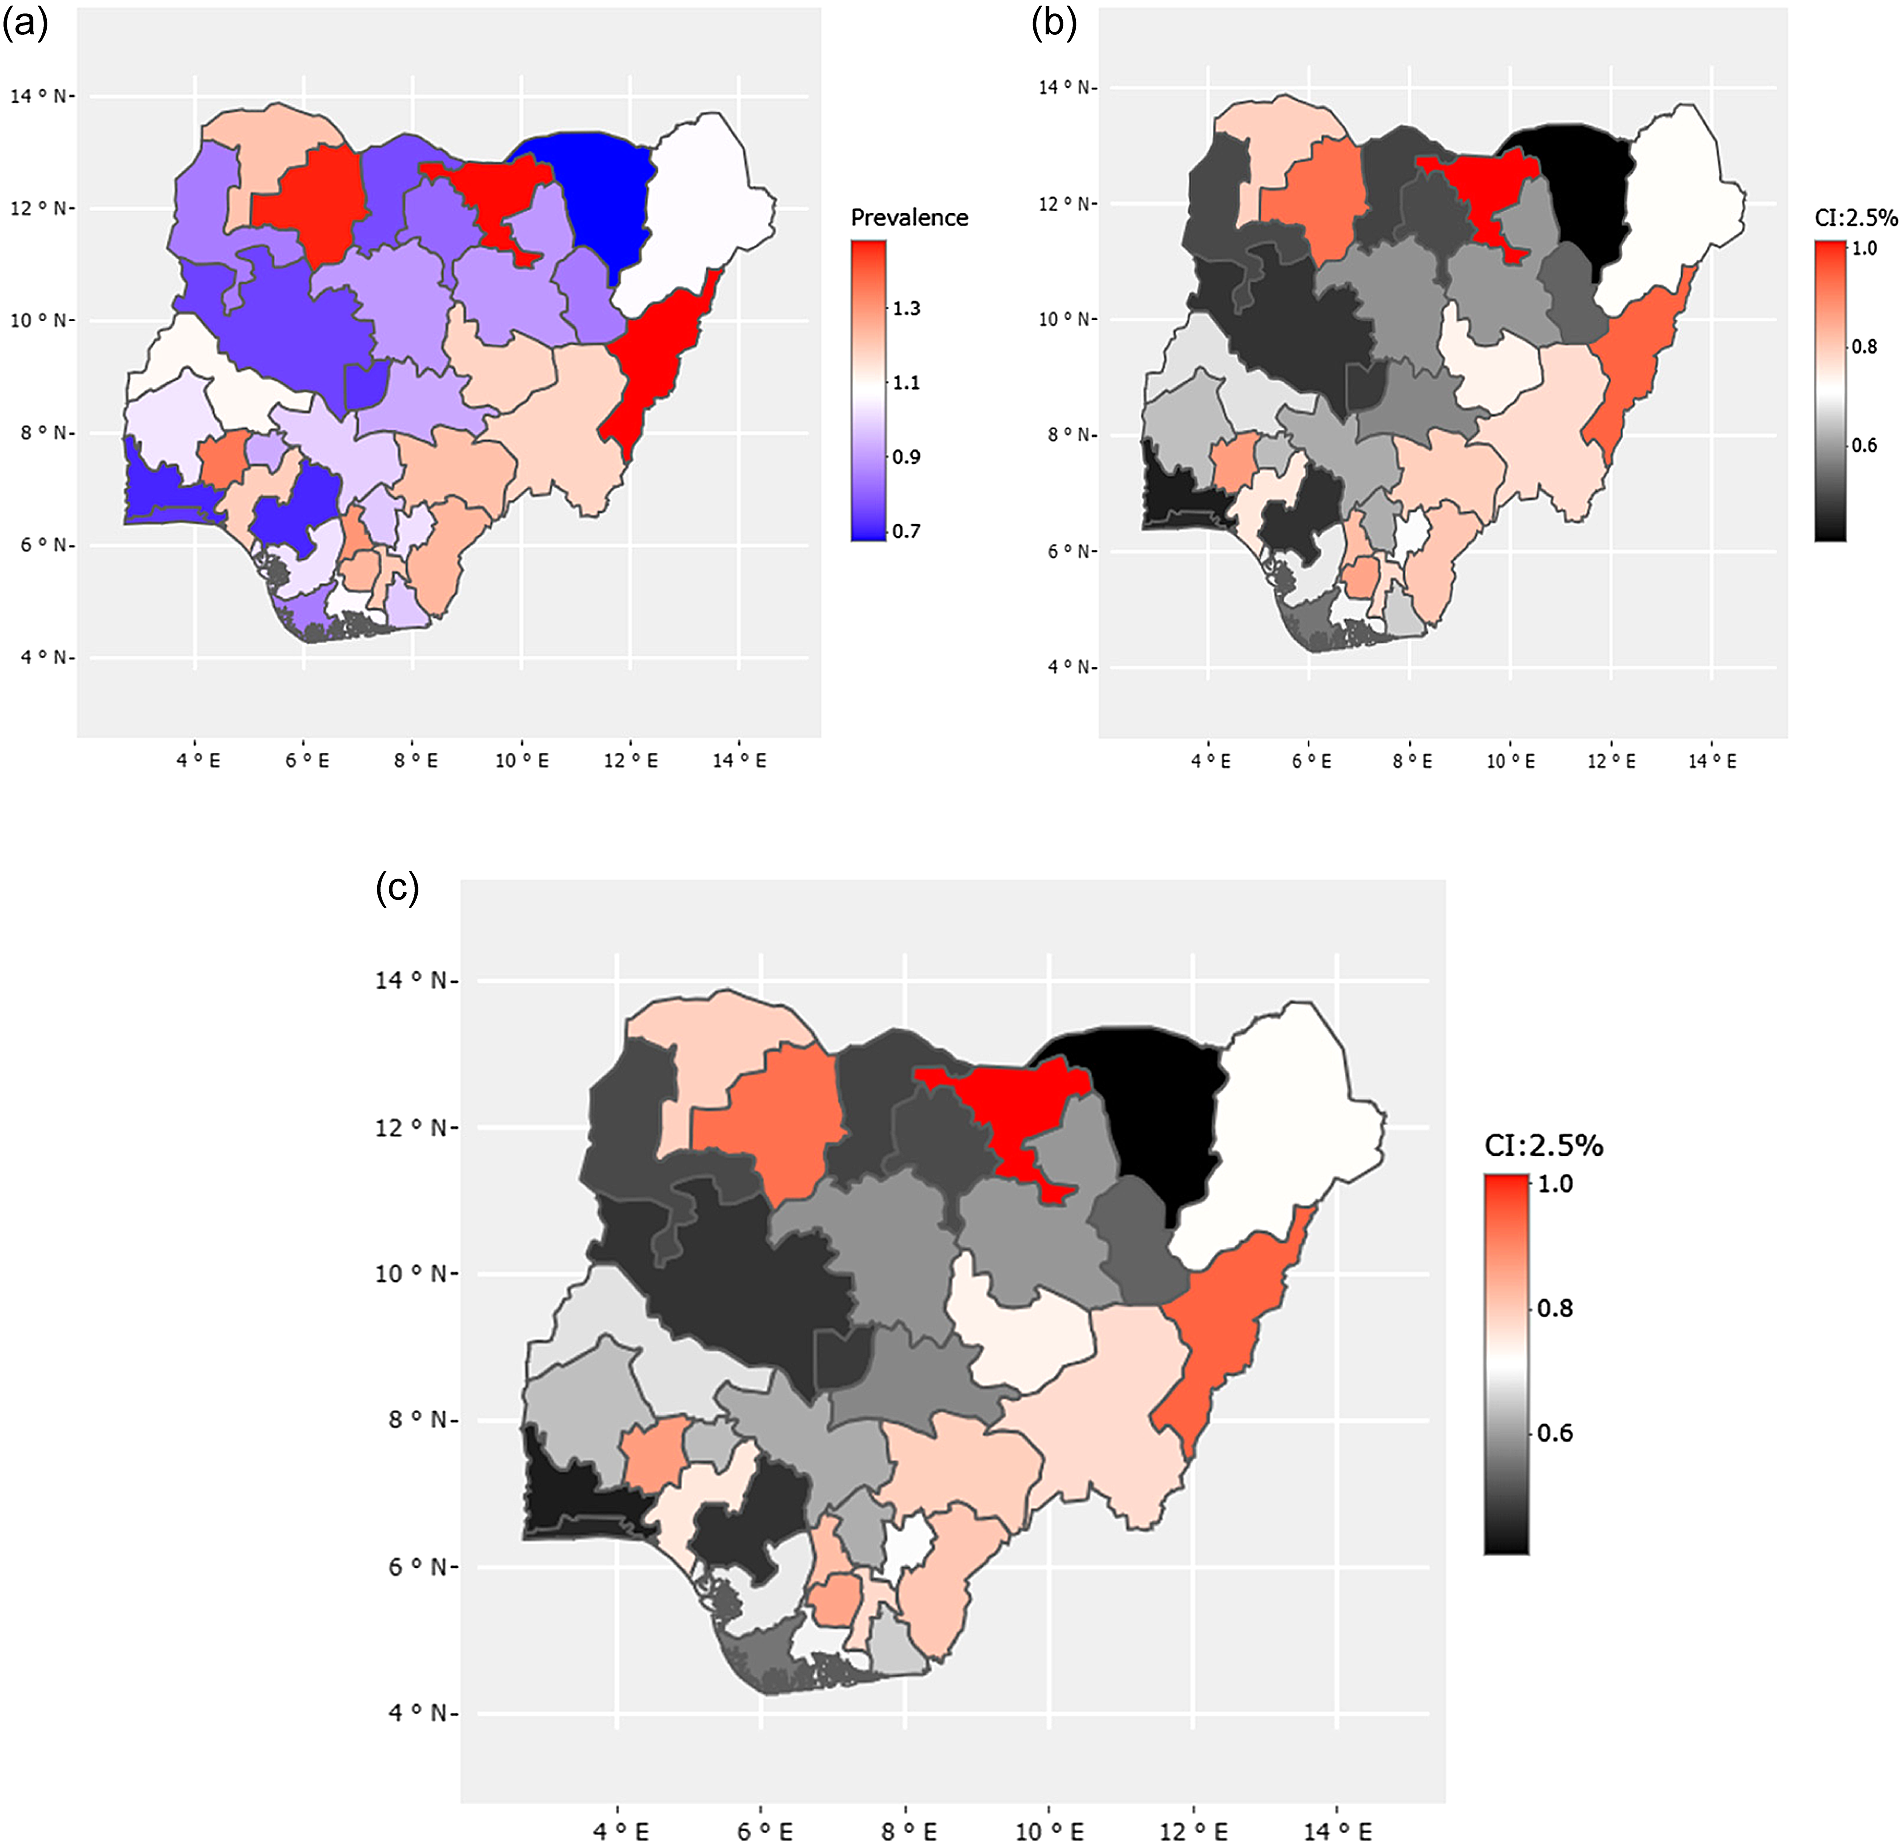
The space–time interaction of child marriage across the 37 states in 2008 showing the (a) odd ratio, (b) lower credible interval, and (c) upper credible interval.
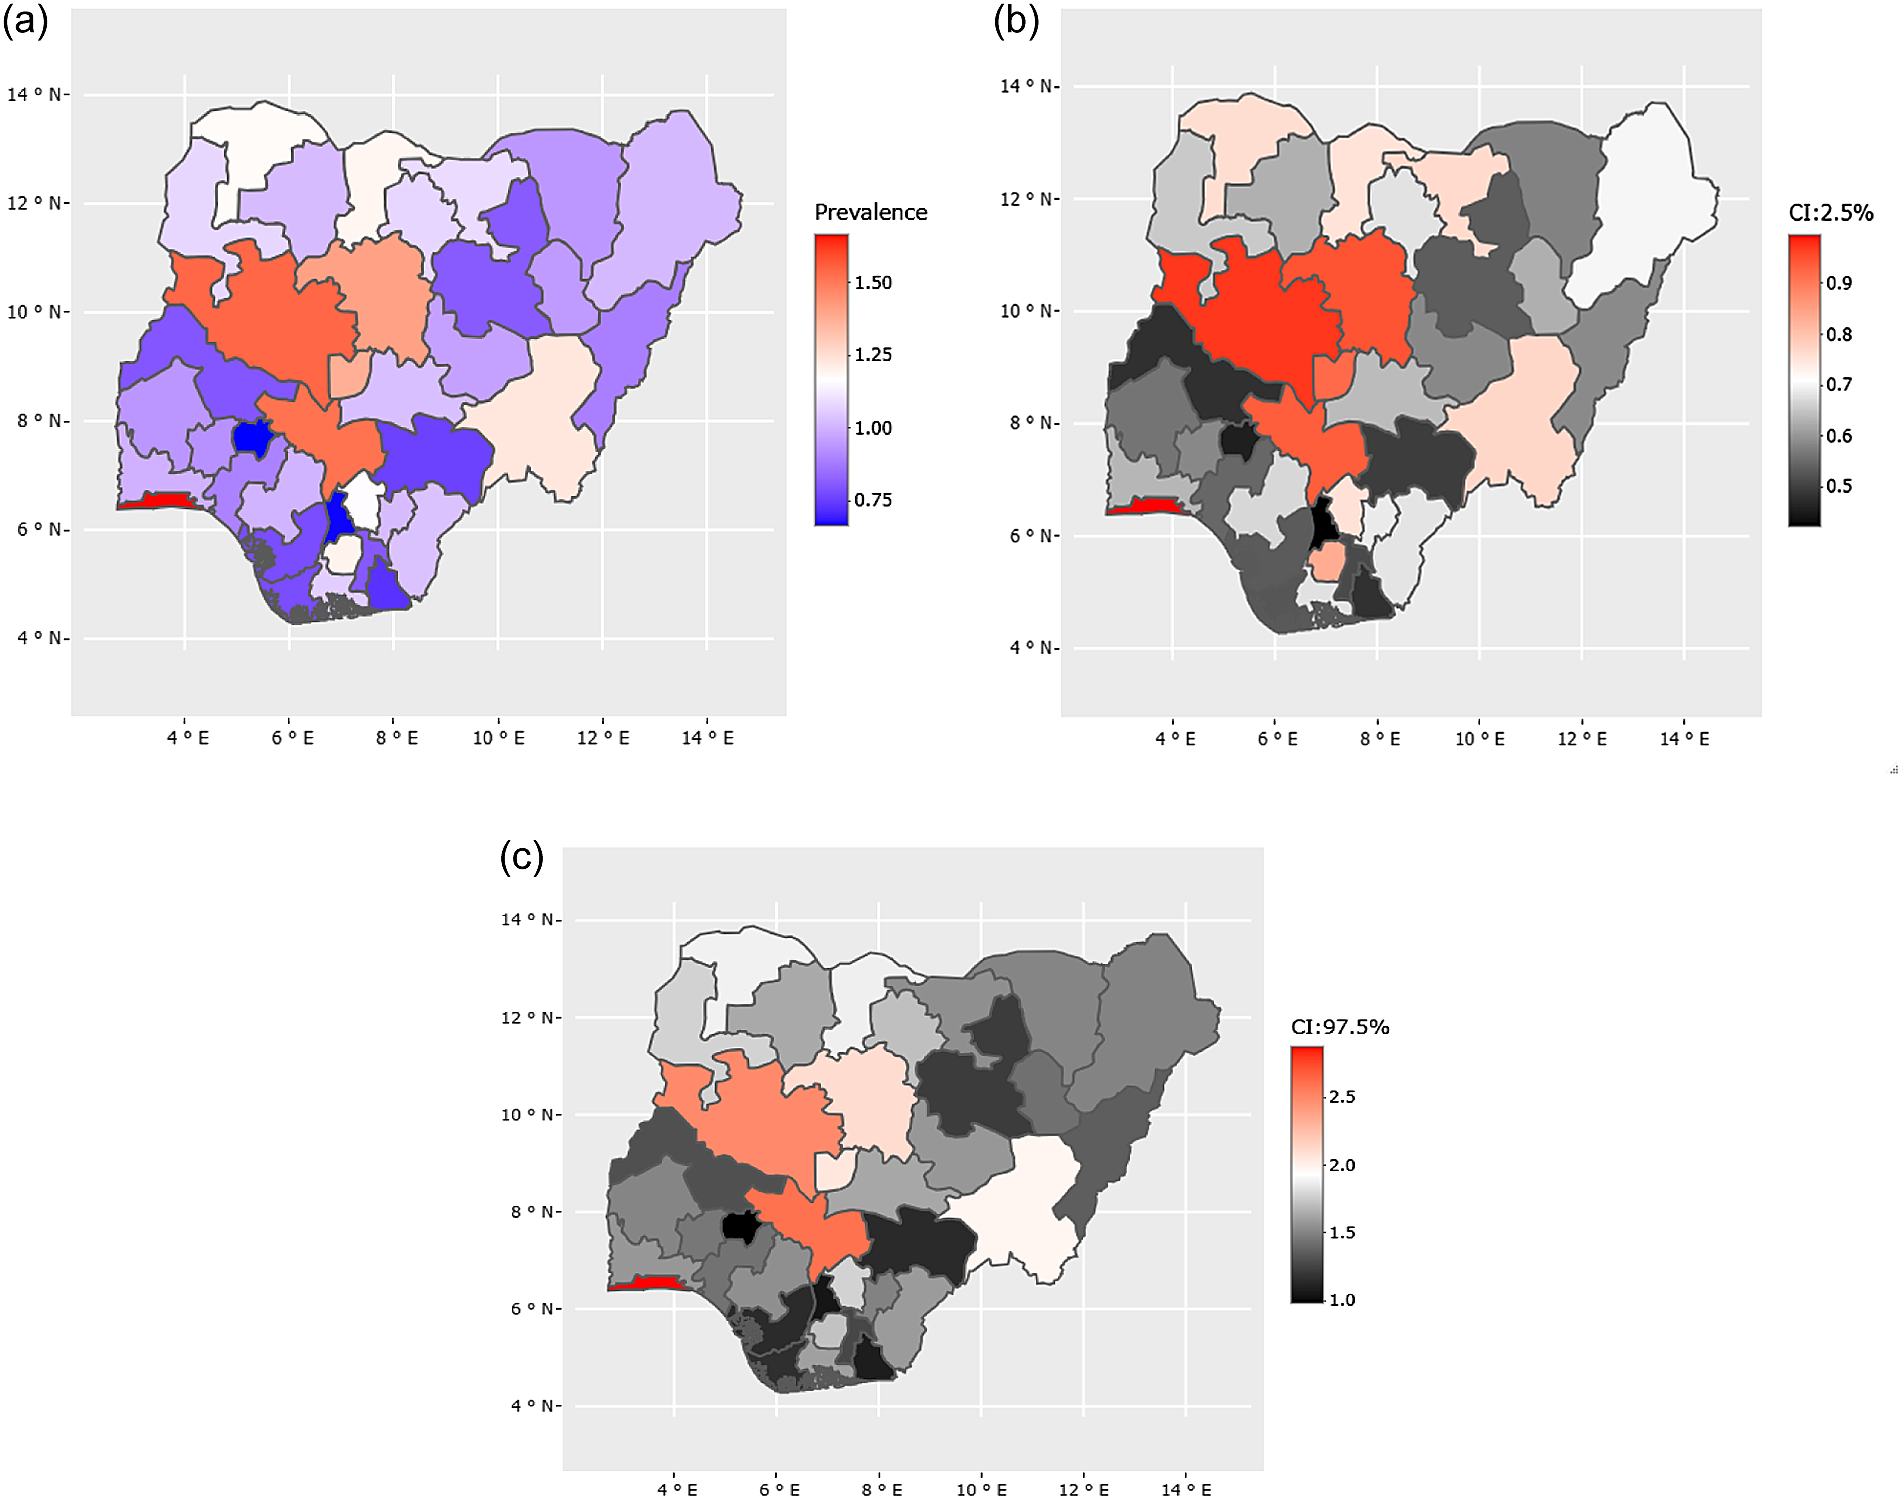
The space–time interaction of child marriage across the 37 states in 2013 showing the (a) odd ratio, (b) lower credible interval, and (c) upper credible interval.
The space–time interaction of child marriage across the 37 states in 2018 showing the (a) odd ratio, (b) lower credible interval, and (c) upper credible interval.
The other results on the linear effects in Table 3 show that, as expected, educational attainment is inversely proportional to the likelihood of early marriage. Women who attained primary education were about 36% [OR: 0.6387, CI: 0.5671, 0.7175] less likely to be married before age 18 years. Those who attained secondary were 81% less likely while it was about 96.65% for higher education. The respondents living in urban areas were about 21.6% [O.R = 0.7837, CI: 0.7089, 0.865] less likely to be married before the age of 18 than their counterparts living in rural areas. When compared with the respondents in the other ethnic groups, those from the Hausa ethnic group were more likely to get married before age 18[O.R = 1.35, CI: 1.150, 1.585] and the estimate is statistically significant. The Igbo and Yoruba respondents were, on the other hand, less likely to marry before age 18 and the likelihood of Igbo is statistically insignificant.
With respect to the wealth index, again, the estimates demonstrate inverse proportionality showing that women from the middle wealth index onwards were less likely to get married before attaining age 18 years when compared with those from the poorer and poorest households. The estimate for the poorer category is insignificant. Furthermore, women from the Christian religious groups were about 60.86% [OR=0.3914, CI: 0.3041, 0.5025] less likely to be married before the age 18 years when compared with those who practised traditional/no religion and the estimates remain statistically significant. The estimates reveal that women who were working at the time of the survey were more likely to marry before age 18 years when compared with those not working.
Figures 1–5 present the spatial and spatio-temporal patterns for early marriage across the 36 states plus FCT Abuja of Nigeria between 2003 and 2018. A close comparison of Figs. 2–5 indicates the differences in the space-time pattern of early marriage in Nigeria. Though some factors beyond those considered here appear to be playing some major role in shaping child marriage in the country, an instance is the policy impact assessment, not considered in the analysis. Specifically, the findings of the spatial random effect indicate a north-south divide in the pattern of early marriage in Nigeria across the 36 states plus FCT Abuja, with the prevalence being higher in the South-South (Edo, Cross-river, and Akwa-Ibom) and Southeast (Abia and Anambra) states of Nigeria (see Fig. 1). From Fig. 2, in 2003, the prevalence was higher in the northern part with neighbouring Adamawa, Bauchi, Jigawa, and Sokoto than in the southern part Edo, Delta, Bayelsa, Imo, Akwa-Ibom, Enugu, and Ebonyi states but lower in Kebbi, Ekiti, and other states except FCT and Anambra with the moderate prevalence of child marriage. This pattern changed in 2008 with a prevalence of about 70% and onwards in most of the northern states. However, only two states in the South–South region of Nigeria, Bayelsa and Akwa-Ibom, had a high prevalence while others were significantly low. The space–time pattern slightly changed in 2013 and a drastic reduction in 2018 with only five states namely Niger, Kogi, FCT Abuja, Kaduna, and Lagos having the highest prevalence of between 25% and 50% compared to other states. The findings revealed that most states in the southern fringe retain their low prevalence. It is worthy of note that the prevalence increased in 2008 compared with the previous and afterwards in Kwara, Kebbi, Taraba, Katsina, Zamfara Nassarawa, and Borno while places like Ogun and Oyo record a similar pattern of prevalence throughout the study period.
Discussion
Over the years, there have been renewed efforts and investments to halt child marriage in Nigeria due to the grave danger the practice poses to the victim and the larger society. Local solutions have, therefore, been envisaged and implemented in several parts of the country, particularly in the northern and south-south areas, where the practice is more dominant (Walker, Reference Walker2015). Here, the study used a spatio-temporal random effect model within a Bayesian framework to explore the changes in the prevalence of child marriage in Nigeria at the state level over fifteen years. An advantage of the modelling framework is that it considers the neighbourhood structure of the space–time units while also taking into account the impact of available covariates on child marriage patterns. The study offers an opportunity to quantify and discern the locations where progress has been made thus, allowing the assessment of intervention strategies, particularly by local authorities.
The observed spatio-temporal effects reveal marked variability in the prevalence of child marriage among Nigerian states with a persistently higher prevalence among those on the northern fringe, particularly Sokoto, Adamawa, and Jigawa over time. Some cultural practices in the northern part of Nigeria allow parents to betrothed a child for marriage without their girl child explicit consent (Nnadi, Reference Nnadi2014). Most Northern and South-South parents preferred their children to marry with purity reflecting an entrenched tradition. Oftentimes, the arrangement is done with an individual who has previously or frequently provided financial aid to the family. In contrast, the practice is uncommon among the predominant southeast regions, leading to a lower prevalence of child marriage. The study of Girls (2017) and Braimah (Reference Braimah2014) has indicated that child marriage is common in the majority of Northern Nigeria, where poverty is the underlying cause of the prevalence as discovered in this findings. Consequently, beyond a universal approach to addressing child marriage in Nigeria, it would be worthwhile to consider specific factors in each state particularly where prevalence is high to proffer local solutions.
The high prevalence of child marriage, particularly in the Northern and South-South regions of Nigeria in 2003, led to the introduction of CRA. As of 2003, not all Nigerian states had domesticated the law, because it was passed at the federal level. Lagos and other states in the Southeast were the first to implement the act, followed by other states in the southwest and southern-south regions, which generally have higher literacy rates and active local governance structures. Consequently, adopting the law differed among the 36 states plus FCT Abuja of Nigeria. The three southern regions of Nigeria adopted the CRA immediately after its passage in 2003 while northern Nigeria resisted stating their religious and cultural norms. Adopting this program in the Southern parts of Nigeria significantly contributed to the drastic reduction of child marriage. For instance, the intervention of the federal government in prohibiting child marriage (CRA) has drastically reduced the rate of girls being married off. Under Section 31(1) of the CRA (2003) and Section 1(2) of the violence against persons (prohibition) Act 2015, any man caught in the act is sentenced to either 16 years or life imprisonment, depending on the gravity of the offence. However, in the northern parts, the prevalence of child marriage rose to about 70% in 2008 (see Fig. 3).
Various programs, initiatives, policies, and interventions have been launched by organisations including UNFPA, UNICEF, and World Bank, among others in Northern Nigeria in response to this alarming increase affecting these regions. In Northeast Nigeria, UNICEF and World Bank introduced the Safe Schools initiative and conditional cash transfers which have successfully increased the number of girls attending school, particularly in underserved rural areas. Non-governmental organisations (NGOs) like Girls Not Brides Nigeria and Save the Children have actively engaged with communities, and traditional and religious leaders to support transformative cultural norms, promote gender equality, and advocate for delaying the marriage age. These NGOs also launched various campaigns on every social media handle, radio, television, newspaper, etc. to educate communities about the risks associated with child marriage on fertility as discussed in the study of Isiugo-Abanihe et al. (Reference Isiugo-Abanihe, Oyediran and Fayehun2022). In addition, international organisations such as the UNICEF-UNFPA global programme to end child marriage and, the African Union Campaign to End Child Marriage have focused on advocacy, education and provision of vital services. Despite various initiatives introduced and the adoption of CRA 2003, the prevalence in Anambra, Imo, Cross-river, and Abia also remains significantly high in 2013 after a drastic reduction, contributing to the ineffectiveness and inconsistency of the CRA law. The high prevalence can be attributed to economic disparities, poverty, and cultural practices including payment of bride price, commonly known as dowry. The states viewed dowry as an incentive, especially when the family faced financial issues.
Access to education remains a significant determinant of child marriage, swaying the quality of child care where most mothers are poorly educated and unskilled individuals (Okpala and Okpala, Reference Okpala and Okpala2006). Mothers with higher educations are inclined to devise a positive legacy, contributing to a better quality of life for children, and are highly adept in refraining from the common practice of child marriages. In contrast, findings reveal that girls with no education and primary education elevate the risk of child marriage, supported by previous studies of Wodon et al. (Reference Wodon, Male, Montenegro, Nguyen and Onagoruwa2018) and Paul (Reference Paul2019). The interventions of the Pathways Foundation in Northern Nigeria, led by the CGE, have significantly increased the likelihood of every girl attending at least secondary school before marriage (Pathways, 2016, Cohen et al., Reference Cohen, Abubakar and Perlman2023). The findings bolster the socio-economic detriments that child marriage inflicts on the development and well-being of girls, particularly their educational advancement, involvement in the working status, and their opportunities to escape chronic poverty (Parsons et al., Reference Parsons, Edmeades, Kes, Petroni, Sexton and Wodon2015). In addition, the higher prevalence of child marriage among individuals with a working status may be attributed to different factors. Most of the girls are more likely to be engaged in small-scale business like trading, handwork, and others. This is because non-governmental organizations like the Pathways Foundation took a multifaceted approach to address the prevalence of child marriage by arranging different vocational training programs to empower them with practical skills and give them economic independence. However, it is also important to clarify this pattern of findings on working status as it shows a higher prevalence of child marriage. The findings suggested that investing in employment creation and improvement in income are part of what the government should focus on and other unrecognized factors such as economic empowerment programs launched by UNICEF-UNFPA to erase differences in child marriage across all the states in Nigeria. In addition, adequate employment opportunities should be created to ensure a smooth transition to labour market participation for girls. The higher participation of girls in the labour market will contribute to improving their economic condition and consequently help prevent child marriage (Islam et al., Reference Islam, Haque and Hossain2016).
Household wealth index has proved to be a significant thrust and a main priority in to fight against child marriage (Jain and Kurz, Reference Jain and Kurz2007, Psaki et al., Reference Psaki, Melnikas, Haque, Saul, Misunas, Patel, Ngo and Amin2021). As a result, poverty curtails opportunities for the girl child, making marriage appealing to the families and the girls. A practical instance is shown in this finding between 2008 and 2013 where the South-South regions were found significantly low in 2008 but high which might be due to financial problems in 2013. Most parents in these categories often marry off their female children believing that marriage would provide financial autonomy (Lee-Rife et al., Reference Lee-Rife, Malhotra, Warner and Glinski2012; Psaki et al., Reference Psaki, Melnikas, Haque, Saul, Misunas, Patel, Ngo and Amin2021). Previous studies have also proven that household poverty significantly increases child marriage (Paul, Reference Paul2019; ICRW, 2007, Uduji et al., Reference Uduji, Okolo-Obasi and Asongu2020). Historically, more than 30% of Nigerian parents lived below the international standard of living for consumption at the rate of 1.90 – 3.20 while 94% lived below 6, subjecting Nigerians to abject poverty, in particular people domiciling in rural areas and Northern part of the country (World-Bank, 2021). This indicates that most Nigerians are faced with the challenges of revitalizing the inclusive economic growth required to combat poverty.
In a society like Nigeria, where inequality is inveterate in socio and cultural practices among regions of the same country, different practices such as cultural beliefs, legal factors, norms, and religious and traditional motives continue to play significant roles in child marriage. These practices have subjected many girls to marriage before attaining 18 years (Ali et al., Reference Ali, Ibrahim, Abdelgbar and Elgessim2014), which contributed significantly to the high prevalence of child marriage across various geopolitical zones in Nigeria. An in-depth insight into how religious belief significantly increased child marriage is explained in Amzat (Reference Amzat2020). As discovered, the result showed that child marriage is more prevalent among Muslims as also supported by Amzat (Reference Amzat2020). A nuanced perception of the diversity of socio-cultural standards and religious beliefs affected many children in Nigeria. Some religious leaders, predominantly the Islamic clergies, believe that any girl physically, emotionally, and mentally ready for marriage can be married. A review supporting this is carried out by Walker (Reference Walker2015), which ascertained that some Islamic leaders are hesitant to share information about the minimum appropriate age for marriage.
Evidence suggests that people living in rural communities are more associated with child marriage, which could be due to their limited awareness about the negative consequence (Rumble et al., Reference Rumble, Peterman, Irdiana, Triyana and Minnick2018). Factors such as poor education, lack of information on sexual well-being, poor economic, and limited exposure to mass media, among others signify an impoverished rural community where a considerable number of child marriage poses a significant challenge (Saleheen et al., Reference Saleheen, Afrin, Kabir, Habib, Zinnia, Hossain, Haq and Talukder2021; Subramanee et al., Reference Subramanee, Agho, Lakshmi, Huda, Joshi and Akombi-Inyang2022). Moreover, efforts to mitigate child marriage in rural areas are limited due to the lack of an effective evaluation mechanism in Nigeria (Fatusi et al., Reference Fatusi, Adedini and Mobolaji2021). People domiciled in rural communities significantly contribute to child marriage as a result of lack of exposure, poverty, parent’s lack of social networks, and limited access to quality education.
Comparing the diversity of ethnicity in Nigeria, this study has shown that children from Hausa/Fulani extraction, who predominantly live in Northern Nigeria, have higher odds of child marriage. The prevalence is a result of nonconformity in traditional beliefs, cultural values, religious beliefs,and the social norms in Nigeria affecting gender dynamic complexity and pervasiveness of female values (Union, Reference Union2015). The religious-cultural structure is rooted in gender inequality and inequitable social norms, particularly in the Northern traditional patriarchal societies, where virginity status is valued and stigmatizing premarital pregnancy, resulting in the practice of child marriage (Hamed and Yousef, Reference Hamed and Yousef2017; Tekile et al., Reference Tekile, Woya and Basha2020). Findings from Mobolaji et al. (Reference Mobolaji, Fatusi and Adedini2020) showed that the prevalence of child marriage varies according to the ethnic group in Nigeria. Moreover, due to the practice of Sharia law in most Northern States, the CRA of 2003 is not well accepted making the prevalence of child marriage remaining ubiquitous among the Hausa and Fulani’s ethnic origin. Thus, child marriage in the Northern part continues to be a social problem in the jurisdiction where the Act has not been incorporated as part of their domestic legislation (Braimah, Reference Braimah2014) compared the Southern Nigeria.
Conclusion
Early marriage impedes women’s education, employment opportunities, and social engagement, subjecting the girl child to psychological trauma and increasing the chances of intimate partner violence. The study adopted a Bayesian spatio-temporal random effect model to estimate changes in child marriage at the state level in Nigeria. The modelling approach provides a viable means of quantifying and aiding understanding of space–time progress in demographic processes considering the massive investment put in place over time to discourage child marriage at different locations. The findings demonstrate state-specific progress with a noticeable decline in child marriage across some states in the northern and the South–South fringe. The estimated variations in child marriage point to the influence of local factors that exact influence across the states which would need to be identified and addressed. Furthermore, the findings from the socioeconomic variables demonstrate that advocating for girls’ education and creating awareness can help reduce child marriage but a holistic strategy taking into account cultural norms, poverty and empowerment must be developed throughout the country. Findings from the spatio-temporal variability suggested an effective and consistent implementation of policies, programs, and initiatives of CRA, international organisations, and NGOs like Girls Not Brides Nigeria, and Save the Children, among others, particularly among the Northern, South-South, and South-East regions of Nigeria should be monitored. Meanwhile, in this work, the policies, programs and interventions were not directly evaluated or analysed, limiting the study and thus suggesting that further studies should consider how specific programs from UNICEF, CRA, UNFPA, and others have directly influenced the observed trends of child marriage.
Data availability statement
The data used was secondary data culled from the Nigeria Demographic and Health Survey (DHS). The data are freely accessible upon registration at the DHS website (www.dhsprogram.com).
Acknowledgements
Oluwafunmilayo Adenike Dawodu acknowledges the support from the Coordination for the Improvement of Higher Education Personnel-Brazil (CAPES).
Author contribution statement
The authors contributed equally to the research work.
Funding
Not Available.
Competing interests
No conflict of interest among the authors.
Ethical standard
The dateset used was a secondary one collected from the Nigeria Demographic and Health Survey after permission was sought.


 Open access