

The hippocampus continues to be a research focus in areas including memory and information processing (Eichenbaum, Reference Eichenbaum2018; Yagi & Galea, Reference Yagi and Galea2019), psychopathology and disease (Chételat et al., Reference Chételat, Perry, Avila, Moreira, Sorensen and Tabaton2018; Das et al., Reference Das, Hwang and Poston2019; Gyorfi et al., Reference Gyorfi, Nagy, Bokor and Keri2018; Haukvik et al., Reference Haukvik, Tamnes, Soderman and Agartz2018; Nakahara et al., Reference Nakahara, Adachi, Ito, Matsumoto, Tajinda and van Erp2018; Pang et al., Reference Pang, Kiecker, O’Brien, Noble and Chang2018; Tannous et al., Reference Tannous, Amaral-Silva, Cao, Wu, Zunta-Soares, Kazimi, Zeni, Mwangi and Soares2018) and aging (Carr et al., Reference Carr, Bernstein, Favila, Rutt, Kerchner and Wagner2017; Dillon et al., Reference Dillon, Tsivos, Knight, McCann, Pennington, Shiel, Conway, Newson, Kauppinen and Coulthard2017; Malykhin et al., Reference Malykhin, Huang, Hrybouski and Olsen2017). Consequently, there is a growing literature pertaining to the unique characteristics of the individual hippocampal subfields. This includes indications that associations between hippocampal volume and a range of conditions and disorders, as well as specific abilities, may be subfield-specific rather than generalized, for example, memory (Dillon et al., Reference Dillon, Tsivos, Knight, McCann, Pennington, Shiel, Conway, Newson, Kauppinen and Coulthard2017; Zammit et al., Reference Zammit, Ezzati, Zimmerman, Lipton, Lipton and Katz2017), psychopathology/disease (Averill et al., Reference Averill, Satodiya, Scott, Wrocklage, Schweinsburg, Averill, Akiki, Amoroso, Southwick, Krystal and Abdallah2017; Cao et al., Reference Cao, Passos, Mwangi, Amaral-Silva, Tannous, Wu, Zunta-Soares and Soares2017; Das et al., Reference Das, Hwang and Poston2019; Haukvik et al., Reference Haukvik, Tamnes, Soderman and Agartz2018; Hayes et al., Reference Hayes, Hayes, Miller, Lafleche, Logue and Verfaellie2017; Maruszak & Thuret, Reference Maruszak and Thuret2014; Mueller et al., Reference Mueller, Yushkevich, Das, Wang, van Leemput, Iglesias, Alpert, Mezher, Ng, Paz and Weiner2018; Samann et al., Reference Samann, Iglesias, Gutman, Grotegerd, Leenings, Flint, Dannlowski, Clarke-Rubright, Morey, van Erp, Whelan, Han, van Velzen, Cao, Augustinack, Thompson, Jahanshad and Schmaal2022; Tannous et al., Reference Tannous, Amaral-Silva, Cao, Wu, Zunta-Soares, Kazimi, Zeni, Mwangi and Soares2018) and aging (Adler et al., Reference Adler, Wisse, Ittyerah, Pluta, Ding, Xie, Wang, Kadivar, Robinson, Schuck, Trojanowski, Grossman, Detre, Elliott, Toledo, Liu, Pickup, Miller, Das and Yushkevich2018; Dillon et al., Reference Dillon, Tsivos, Knight, McCann, Pennington, Shiel, Conway, Newson, Kauppinen and Coulthard2017; Malykhin et al., Reference Malykhin, Huang, Hrybouski and Olsen2017). Thus, the hippocampal subfields are considered to be both structurally and functionally distinct. Their genetic distinctiveness is less well explored. Nonetheless, this is an important consideration in determining whether genetic studies should examine the subregions of the hippocampus, as opposed to examining the structure as a whole. Here we extend earlier studies by combining data from two large young adult cohorts to explore the genetic distinctiveness of hippocampal subfield volumes in relation to the hippocampus as a whole.
Moderate to high heritabilities have previously been reported for the whole hippocampus as well as for the subfield volumes, including for the young adult cohorts in the current study — the Queensland Twin Imaging (QTIM) Study (Whelan et al., Reference Whelan, Hibar, van Velzen, Zannas, Carrillo-Roa, McMahon, Prasad, Kelly, Faskowitz, deZubiracay, Iglesias, van Erp, Frodl, Martin, Wright, Jahanshad, Schmaal, Sämann and Thompson2016)) and the Human Connectome Project (HCP; Elman et al., Reference Elman, Panizzon, Gillespie, Hagler, Fennema-Notestine, Eyler, McEvoy, Neale, Lyons, Franz, Dale and Kremen2019; Greenspan et al., Reference Greenspan, Arakelian and van Erp2016; Patel et al., Reference Patel, Park, Devenyi, Patel, Masellis, Knight and Chakravarty2017). In addition, similar heritabilities have been reported for male veterans participating in the Vietnam Era Twin Study of Aging (VETSA; Elman et al., Reference Elman, Panizzon, Gillespie, Hagler, Fennema-Notestine, Eyler, McEvoy, Neale, Lyons, Franz, Dale and Kremen2019). Moreover, genetic covariation between subfield and whole hippocampus volume has been reported for the HCP cohort (Greenspan et al., Reference Greenspan, Arakelian and van Erp2016: N = 499; Elman et al., Reference Elman, Panizzon, Gillespie, Hagler, Fennema-Notestine, Eyler, McEvoy, Neale, Lyons, Franz, Dale and Kremen2019: N = 556; and similarly Patel et al., Reference Patel, Park, Devenyi, Patel, Masellis, Knight and Chakravarty2017: N = 465), and for the VETSA cohort (Elman et al., Reference Elman, Panizzon, Gillespie, Hagler, Fennema-Notestine, Eyler, McEvoy, Neale, Lyons, Franz, Dale and Kremen2019: N = 406). Results indicate substantial genetic overlap with whole hippocampus volume for the larger subfield volumes, but moderate overlap for the smaller subfields. Confidence intervals, when reported, have been particularly large for the latter. Further, Elman et al. (Reference Elman, Panizzon, Gillespie, Hagler, Fennema-Notestine, Eyler, McEvoy, Neale, Lyons, Franz, Dale and Kremen2019) examined genetic covariation between the subfields themselves and determined that there was a large amount of shared genetic variance, but with many cross-loadings.
Given the strong heritability found for the whole hippocampus volume, it is not surprising that an increasing number of influential genetic variants are being identified as genomewide association studies grow larger (Bis et al., Reference Bis, DeCarli, Smith, van der Lijn, Crivello, Fornage, Debette, Shulman, Schmidt, Srikanth, Schuur, Yu, Choi, Sigurdsson, Verhaaren, DeStefano, Lambert, Jack, Struchalin and Seshadri2012; Hibar et al., Reference Hibar, Adams, Jahanshad, Chauhan, Stein, Hofer, Rentería, Bis, Arias-Vasquez, Ikram, Desrivieres, Vernooij, Abramovic, Alhusaini, Amin, Andersson, Arfanakis, Aribisala, Armstrong and Ikram2017; Hibar et al., Reference Hibar, Stein, Renteria, Arias-Vasquez, Desrivieres, Jahanshad, Toro, Wittfeld, Abramovic, Andersson, Aribisala, Armstrong, Bernard, Bohlken, Boks, Bralten, Brown, Chakravarty, Chen and Medland2015; S. M. Smith et al., Reference Smith, Douaud, Chen, Hanayik, Alfaro-Almagro, Sharp and Elliott2021; Stein et al., Reference Stein, Medland, Vasquez, Hibar, Senstad, Winkler, Toro, Appel, Bartecek, Bergmann, Bernard, Brown, Cannon, Chakravarty, Christoforou, Domin, Grimm, Hollinshead, Holmes and Thompson2012). For example, genomewide association performed in 26,814 individuals of European ancestry identified six independent loci, as well as many genetic variants of small effect size that may also influence hippocampal volume (Hibar et al., Reference Hibar, Adams, Jahanshad, Chauhan, Stein, Hofer, Rentería, Bis, Arias-Vasquez, Ikram, Desrivieres, Vernooij, Abramovic, Alhusaini, Amin, Andersson, Arfanakis, Aribisala, Armstrong and Ikram2017), while follow-up gene-set enrichment analysis in 13,163 individuals identified the influence of neurogenesis-related pathways (Horgusluoglu-Moloch et al., Reference Horgusluoglu-Moloch, Risacher, Crane, Hibar, Thompson, Saykin and Nho2019).
However, there are indications that some genetic variants differentially influence the subfield volumes. One of the genetic variants identified for whole hippocampus through genomewide association (Bis et al., Reference Bis, DeCarli, Smith, van der Lijn, Crivello, Fornage, Debette, Shulman, Schmidt, Srikanth, Schuur, Yu, Choi, Sigurdsson, Verhaaren, DeStefano, Lambert, Jack, Struchalin and Seshadri2012; Hibar et al., Reference Hibar, Adams, Jahanshad, Chauhan, Stein, Hofer, Rentería, Bis, Arias-Vasquez, Ikram, Desrivieres, Vernooij, Abramovic, Alhusaini, Amin, Andersson, Arfanakis, Aribisala, Armstrong and Ikram2017; Stein et al., Reference Stein, Medland, Vasquez, Hibar, Senstad, Winkler, Toro, Appel, Bartecek, Bergmann, Bernard, Brown, Cannon, Chakravarty, Christoforou, Domin, Grimm, Hollinshead, Holmes and Thompson2012) was subsequently observed to interact with major depression status in hippocampal subfield volumes, with most prominent effects in dentate gyrus and CA4 volumes (Han et al., Reference Han, Won, Kang, Choi, Kim, Lee, Tae and Ham2017). Further, candidate gene studies have reported (1) differential patterns of hippocampal subfield volume atrophy associated with MAPT, C9orf72 and GRN mutations in patients with frontotemporal dementia (Bocchetta et al., Reference Bocchetta, Iglesias, Scelsi, Cash, Cardoso, Modat, Altmann, Ourselin, Warren and Rohrer2018) and (2) interplay between childhood trauma and BDNF variants on hippocampus subfield volumes in schizophrenia spectrum and bipolar disorders (Aas et al., Reference Aas, Haukvik, Djurovic, Tesli, Athanasiu, Bjella, Hansson, Cattaneo, Agartz, Andreassen and Melle2014). More recently, a genomewide association study of hippocampal subfield volumes in 21,297 individuals identified 15 significant loci across six subfields, eight of which had not previously been linked to the hippocampus (van der Meer et al., Reference van der Meer, Rokicki, Kaufmann, Cordova-Palomera, Moberget, Alnaes, Bettella, Frei, Doan, Sønderby, Smeland, Agartz, Bertolino, Bralten, Brandt, Buitelaar, Djurovic, van Donkelaar, Dørum and Westlye2020).
Twin studies provide a powerful means to identify and characterize genetic variance and serve as a reference for gene-mapping studies (e.g. Iacono et al., Reference Iacono, Heath, Hewitt, Neale, Banich, Luciana, Madden, Barch and Bjork2018; Polderman et al., Reference Polderman, Benyamin, de Leeuw, Sullivan, van Bochoven, Visscher and Posthuma2015). Here we use a twin/sibling design to identify the genetic specificity of hippocampal subfield volumes, relative to the whole hippocampus. We combine data from two large young adult cohorts (QTIM and HCP). Hippocampal subfields are derived using FreeSurfer version 6.0. This subfield segmentation method is based on a statistical atlas of the hippocampal substructure acquired using a combination of both in vivo and ultra-high resolution ex vivo MRI data, thereby yielding volumes that are better matched to those from histological studies compared to previous atlases (Iglesias et al., Reference Iglesias, Augustinack, Nguyen, Player, Player, Wright, Roy, Frosch, McKee, Wald, Fischl and van Leemput2015). We use Cholesky decomposition to partition variance (Neale & Maes, Reference Neale and Maes1998). This baseline approach for decomposing variance is often used as an alternative to more restricted, hypothesis-driven models, particularly when associations are complex, as has been indicated previously (Elman et al., Reference Elman, Panizzon, Gillespie, Hagler, Fennema-Notestine, Eyler, McEvoy, Neale, Lyons, Franz, Dale and Kremen2019). With the large sample available, we aim to identify genetic estimates with greater accuracy than has previously been possible.
Materials and Methods
Participants
Participants come from two independent cohorts — the QTIM study of brain structure and function (data collected at the Centre for Advanced Imaging in Brisbane, Australia, 2007–2012; Blokland et al., Reference Blokland, Wallace, Hansell, Thompson, Hickie, Montgomery, Martin, McMahon, de Zubicaray and Wright2017; de Zubicaray et al., Reference de Zubicaray, Chiang, McMahon, Shattuck, Toga, Martin, Wright and Thompson2008) and the HCP (data collected at three sites in the USA — Washington University, University of Minnesota and St. Louis University, 2012–2015; van Essen et al., Reference van Essen, Ugurbil, Auerbach, Barch, Behrens, Bucholz, Chang, Chen, Corbetta, Curtiss, Della Penna, Feinberg, Glasser, Harel, Heath, Larson-Prior, Marcus, Michalareas and Moeller2012).
Combined QTIM/HCP
The combined sample comprises 2148 individuals (59.0% female) from 1081 families with 1 to 4 siblings per family (including 2 complete triplet sets and 602 complete twin pairs). Participants ranged in age from 16 to 37 years (M ± SD = 25.6 ± 4.8).
QTIM
Brain scans were collected from healthy Caucasian adolescents and young adults (Blokland et al., Reference Blokland, McMahon, Thompson, Martin, de Zubicaray and Wright2011; Blokland et al., Reference Blokland, Wallace, Hansell, Thompson, Hickie, Montgomery, Martin, McMahon, de Zubicaray and Wright2017). After quality control checks, both left and right hemisphere hippocampal subfields were available for 1073 individuals (62.7% female) from 627 families. They ranged in age from 16.0 to 30.1 years (M = 22.3 ± 3.3) and comprised 2 complete sets of triplets, 371 complete twin pairs (108 monozygotic [MZ] female, 55 MZ male, 85 dizygotic [DZ] female, 36 DZ male and 87 opposite-sex pairs) as well as 224 nonpaired co-twins and 101 nontwin siblings. Using the same acquisition protocol, test–retest reliability was assessed in 54 individuals (61.1% female; M ± SD age = 23.3 ± 2.2 years at baseline) for whom both left and right hippocampal subfields passed quality control checks. Participants were rescanned after an interval ranging from 1.0 to 9.4 months (M = 3.4 ± 1.5 months). Zygosity was determined from DNA using a commercial kit (AmpF1STR Profiler Plus Amplification Kit, ABI) and was later confirmed with high-density single nucleotide polymorphisms (SNP) genotyping (Illumina Human 610-Quad and Core+Exome SNP chips). Twins were excluded from the study if they were left-handed, had a history of neurological or psychiatric conditions (including loss of consciousness for more than 5 min) or had general MRI contraindications. Written, informed consent was obtained from all participants, including a parent or guardian for those aged under 18 years, and the study was approved by the Human Research Ethics Committee at the QIMR Berghofer Medical Research Institute (Ref#P701). Raw and derived QTIM MRI data are available from https://doi.org/10.18112/openneuro.ds004169.v1.0.3.
HCP
Brain scans were collected from young adult family sibships (including twin pairs) (Van Essen et al., Reference van Essen, Ugurbil, Auerbach, Barch, Behrens, Bucholz, Chang, Chen, Corbetta, Curtiss, Della Penna, Feinberg, Glasser, Harel, Heath, Larson-Prior, Marcus, Michalareas and Moeller2012). Participants reflect the ethnic diversity of America and include white non-Hispanic, Hispanic, Asian and African-American individuals. Data from release S1200, which contains imaging data for 1113 individuals, were analyzed. Our analyses allowed for up to four siblings per family. Individuals with half-sibling relationships were excluded. The final sample comprised 1075 individuals from 454 families (55.3% female). Individuals ranged in age from 22 to 37 years (M = 28.8 ± 3.7) and included 231 complete twin pairs (93 MZ female, 56 MZ male, 52 DZ female, 30 DZ male). Test–retest reliability was assessed in 45 individuals (31.1% female; M ± SD age = 30.3 ± 3.3 years; M ± SD scan interval = 4.6 ± 2.3 months). Zygosity was determined by genotyping for 209 same-sex pairs and by self-report for 22 pairs. Sibships were excluded if individuals had severe neurodevelopmental disorders or documented neuropsychiatric or neurologic disorders. All HCP participants gave written consent, and experimental procedures were approved by the institutional review board (IRB#201204036). Processed HCP FreeSurfer data were downloaded from the Connectome Coordination Facility (https://www.humanconnectome.org/).
Image Acquisition and Processing
QTIM acquisition
T1-weighted (T1w) 3D whole-brain images (T1/TR/TE = 700/1500/3.35 ms; flip angle = 8°, FOV = 256 × 256, voxel size = 0.9375 × 0.9375 × 0.9 mm) were acquired for each participant on a 4T Bruker Medspec whole-body MRI system (Erlangen, Germany) paired with a transverse electromagnetic (TEM) head coil. Scans were corrected for intensity inhomogeneity with SPM12 (Wellcome Trust Centre for Neuroimaging, London, UK; http://www.fil.ion.ucl.ac.UK/spm) prior to FreeSurfer processing.
HCP acquisition
T1w (T1/TR/TE = 1000/2400/2.14 ms; flip angle = 8°, FOV = 224 × 224, voxel size = 0.7 mm isotropic) and T2-weighted (T2w; TR/TE = 3200/565 ms; flip angle = variable, FOV = 224 × 224, voxel size = 0.7 mm isotropic) 3D whole-brain images were acquired for each participant on a customized 3T Siemens Connectome Skyra using a standard 32-channel Siemens receive head coil and a body transmission coil. The preprocessing pipelines used for structural MRI in HCP are discussed in Glasser and van Essen (Reference Glasser and van Essen2011).
Processing
The automated reconstruction protocol of the FreeSurfer software package (https://surfer.nmr.mgh.harvard.edu; see Fischl, Reference Fischl2012, for a summary of the FreeSurfer methodology) was used to produce a 3D whole-brain reconstruction and segmentation for each participant (QTIM FreeSurfer v5.3; HCP FreeSurfer v5.3-HCP). From this reconstruction, we extracted a measure of brain size that includes gray and white matter as well as cerebrospinal fluid (FreeSurfer volume ‘BrainSegVol’). A detailed postprocessing quality check was performed in line with procedures used in the ENIGMA consortium (http://enigma.ini.usc.edu/protocols/imaging-protocols/). Then, using FreeSurfer 6.0 (Iglesias et al., Reference Iglesias, Augustinack, Nguyen, Player, Player, Wright, Roy, Frosch, McKee, Wald, Fischl and van Leemput2015), 12 hippocampal subfields were extracted from each hemisphere (in size order: CA1, hippocampal tail, molecular layer, subiculum, granule cell layer of dentate gyrus (GCDG), presubiculum, CA4, CA3 (which includes both CA2 and CA3 as these regions have indistinguishable MRI contrast — named CA2/3 in further analyses), hippocampal fissure, fimbria, hippocampus-amygdala transition area (HATA) and parasubiculum). The hippocampal formation volume was computed by summing the volumes of all subregions except for the hippocampal fissure, as done in Iglesias et al. (Reference Iglesias, Augustinack, Nguyen, Player, Player, Wright, Roy, Frosch, McKee, Wald, Fischl and van Leemput2015). Subfield volumes for the HCP dataset were extracted using T1w and T2w scans (i.e. multispectral segmentation).
Selection of MRI measures
Volumes for CA4 and GCDG were combined into a single volume (CA4/dentate gyrus) based on (1) their high correlation (phenotypic r = .99 QTIM, 0.99 HCP; additive genetic r = .99 QTIM, 0.99 HCP; unique environment r = .97 QTIM, 0.94 HCP; common environment r = .98 QTIM, 0.95 HCP) and (2) difficulties distinguishing the two volumes using FreeSurfer 6.0 segmentation (Iglesias et al., Reference Iglesias, Augustinack, Nguyen, Player, Player, Wright, Roy, Frosch, McKee, Wald, Fischl and van Leemput2015). In addition, the hippocampal tail is not well captured using FreeSurfer 6.0 (Iglesias et al., Reference Iglesias, Augustinack, Nguyen, Player, Player, Wright, Roy, Frosch, McKee, Wald, Fischl and van Leemput2015) and was excluded. Further, bivariate genetic analysis of left and right hemisphere volumes showed moderate to high cross-hemispheric correlations at both phenotypic and genetic levels (Supplementary Table S1). Genetic cross-hemisphere correlations ranged from .86 to 1.00 for QTIM and .96 to 1.00 for HCP, with none differing significantly from 1.00. Consequently, all further analyses were conducted on data meaned across hemisphere.
Statistical Analyses
Analyses were run using R version 3.6.2 (R Core Team, 2019) or SPSS (IBM SPSS Statistics Version 26). All genetic modeling was run using the R package OpenMx version 2.9.6 (Neale et al., Reference Neale, Hunter, Pritikin, Zahery, Brick, Kirkpatrick, Estabrook, Bates, Maes and Boker2016). A total of 29 individuals (12 in QTIM, 17 in HCP) were found to have one or more raw data volumes exceeding 4 standard deviations (SD) from the mean. Values were set to missing for those volumes. Prior to further analyses, the effects of sex and age (and MRI acquisition for QTIM) were regressed from each hippocampal measure and residuals were winsorized to ± 3.29 SD. These volumes showed near-normal distributions. For analyses combining QTIM and HCP, cohort was included as a covariate.
Cholesky decomposition
Classical twin models were employed to estimate genetic and environmental covariation and specificity. Modeling allowed for up to 4 siblings per family. Using a Cholesky decomposition approach (Neale & Maes, Reference Neale and Maes1998), variance and covariance were decomposed into additive genetic (A), common environmental (C) and unique environmental (E) sources. Cholesky decomposition is a standard general approach to partitioning variance. In multivariate analyses, the first A, C and E factors are determined by influences on the first variable and are free to influence all variables. The second A, C and E factors are determined by remaining genetic or environmental influences on the second variable and are free to influence all subsequent variables, and so on. Each factor represents an independent genetic or environmental source. Consequently, A, C and E influences on the last variable are necessarily specific to that variable.
To determine sources of genetic and environmental influence on subfield volumes that are independent of the whole hippocampal formation, we included hippocampal formation in Cholesky decomposition analyses rather than regressing out phenotypic variance and examining residuals. This is consistent with the approach taken by Elman et al. (Reference Elman, Panizzon, Gillespie, Hagler, Fennema-Notestine, Eyler, McEvoy, Neale, Lyons, Franz, Dale and Kremen2019), as regressing out phenotypic variance assumes proportional genetic and environmental contributions, but these contributions are not necessarily proportional.
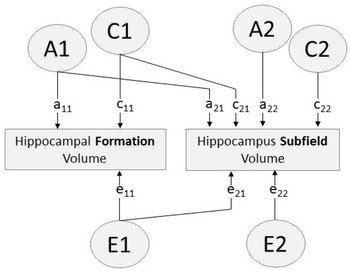
Consequently, a series of bivariate analyses allowing for A, C and E influences were run to assess genetic specificity of subfield volumes compared to hippocampal formation volume (Figure 1). Second, to assess genetic and environmental covariation and specificity among the subfields, this was extended to multivariate analysis that included hippocampal formation and all subfields. Subfields were ordered in broad groups, beginning with the molecular layer and hippocampus proper (CA4/dentate gyrus, CA2/3, CA1), and followed by the subicular complex volumes (subiculum, presubiculum, parasubiculum) and then the remaining volumes (HATA, fissure, fimbria).
Path diagram of bivariate Cholesky decomposition showing additive genetic (A), common environmental (C) and unique environmental (E) sources of influence. Paths a11, c11, e11 account for all variance influencing hippocampal formation volume. Paths a12, c12, e12 indicate variance in each hippocampus subfield volume influenced by factors A1, C1, E1 (i.e. factors influencing the hippocampal formation). Paths a22, c22, e22 indicate variance specific to the hippocampus subfield (i.e. variance independent of the hippocampal formation)

Test–Retest reliability
The intraclass correlation coefficient was modeled using a two-way mixed-effects model (random subject effects and fixed session effects) with absolute agreement (ICC3,1, as defined by Shrout & Fleiss, Reference Shrout and Fleiss1979).
Results
Brain volumes with mean, standard deviation, range and test–retest reliability are shown for QTIM and HCP in Table 1. While many of the subfield volumes are very similar in size across cohort (e.g. CA2/3, HATA), some differences are also observed (e.g. molecular layer, CA1, fimbria). These differences may reflect methodological differences in subfield segmentation (with the inclusion of a whole-brain T2w scan in volume determination for HCP, but not QTIM) and/or cohort differences such as age and sex effects (e.g. van Eijk et al., Reference van Eijk, Hansell, Strike, Couvy-Duchesne, de Zubicaray, Thompson, McMahon, Zietsch and Wright2020). Test–retest reliability ranges from moderate to high for both QTIM (0.78–0.96) and HCP (0.82–0.97). The greatest disparity between QTIM and HCP was found for reliability of the molecular layer, a subfield that likely requires additional T2-weighted data for accurate segmentation (Iglesias et al., Reference Iglesias, Augustinack, Nguyen, Player, Player, Wright, Roy, Frosch, McKee, Wald, Fischl and van Leemput2015; Wisse et al., Reference Wisse, Biessels and Geerlings2014). Therefore, while the molecular layer is more reliable in the QTIM cohort, this is likely an indication of a stronger reliance on shape priors for segmentation rather than a sign of greater validity (Wisse et al., Reference Wisse, Chetelat, Daugherty, de Flores, la Joie, Mueller, Stark, Wang, Yushkevich, Berron, Raz, Bakker, Olsen and Carr2021). Twin correlations are shown for the QTIM and HCP cohorts in Supplementary Table S2.
Regional brain volume mean, standard deviation, range and test–retest reliability for the QTIM and HCP cohorts
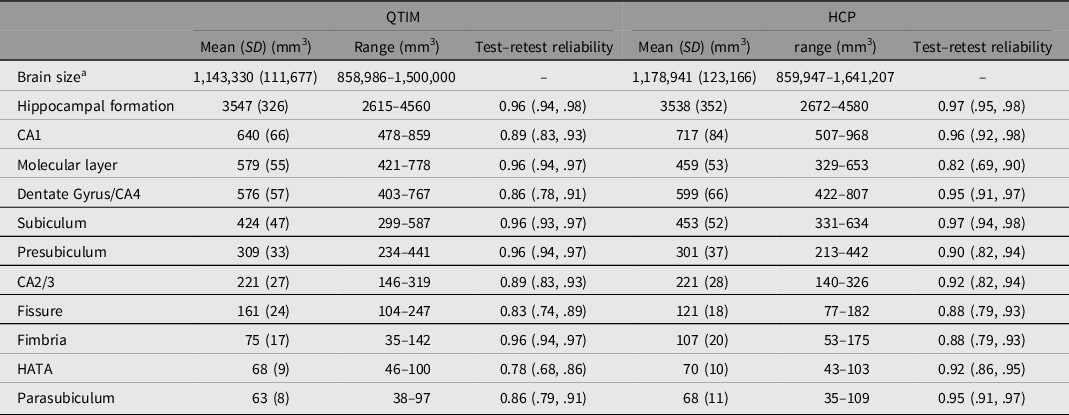
Note: Mean, SD and range are shown for raw data (after dropping outliers >4 SD from mean, but before winsorization to 3.29 SD). Test–retest reliability is an intraclass correlation of residuals with the effects of sex and age regressed out.
Bivariate Analyses of Hippocampal Formation and Subfield Volumes
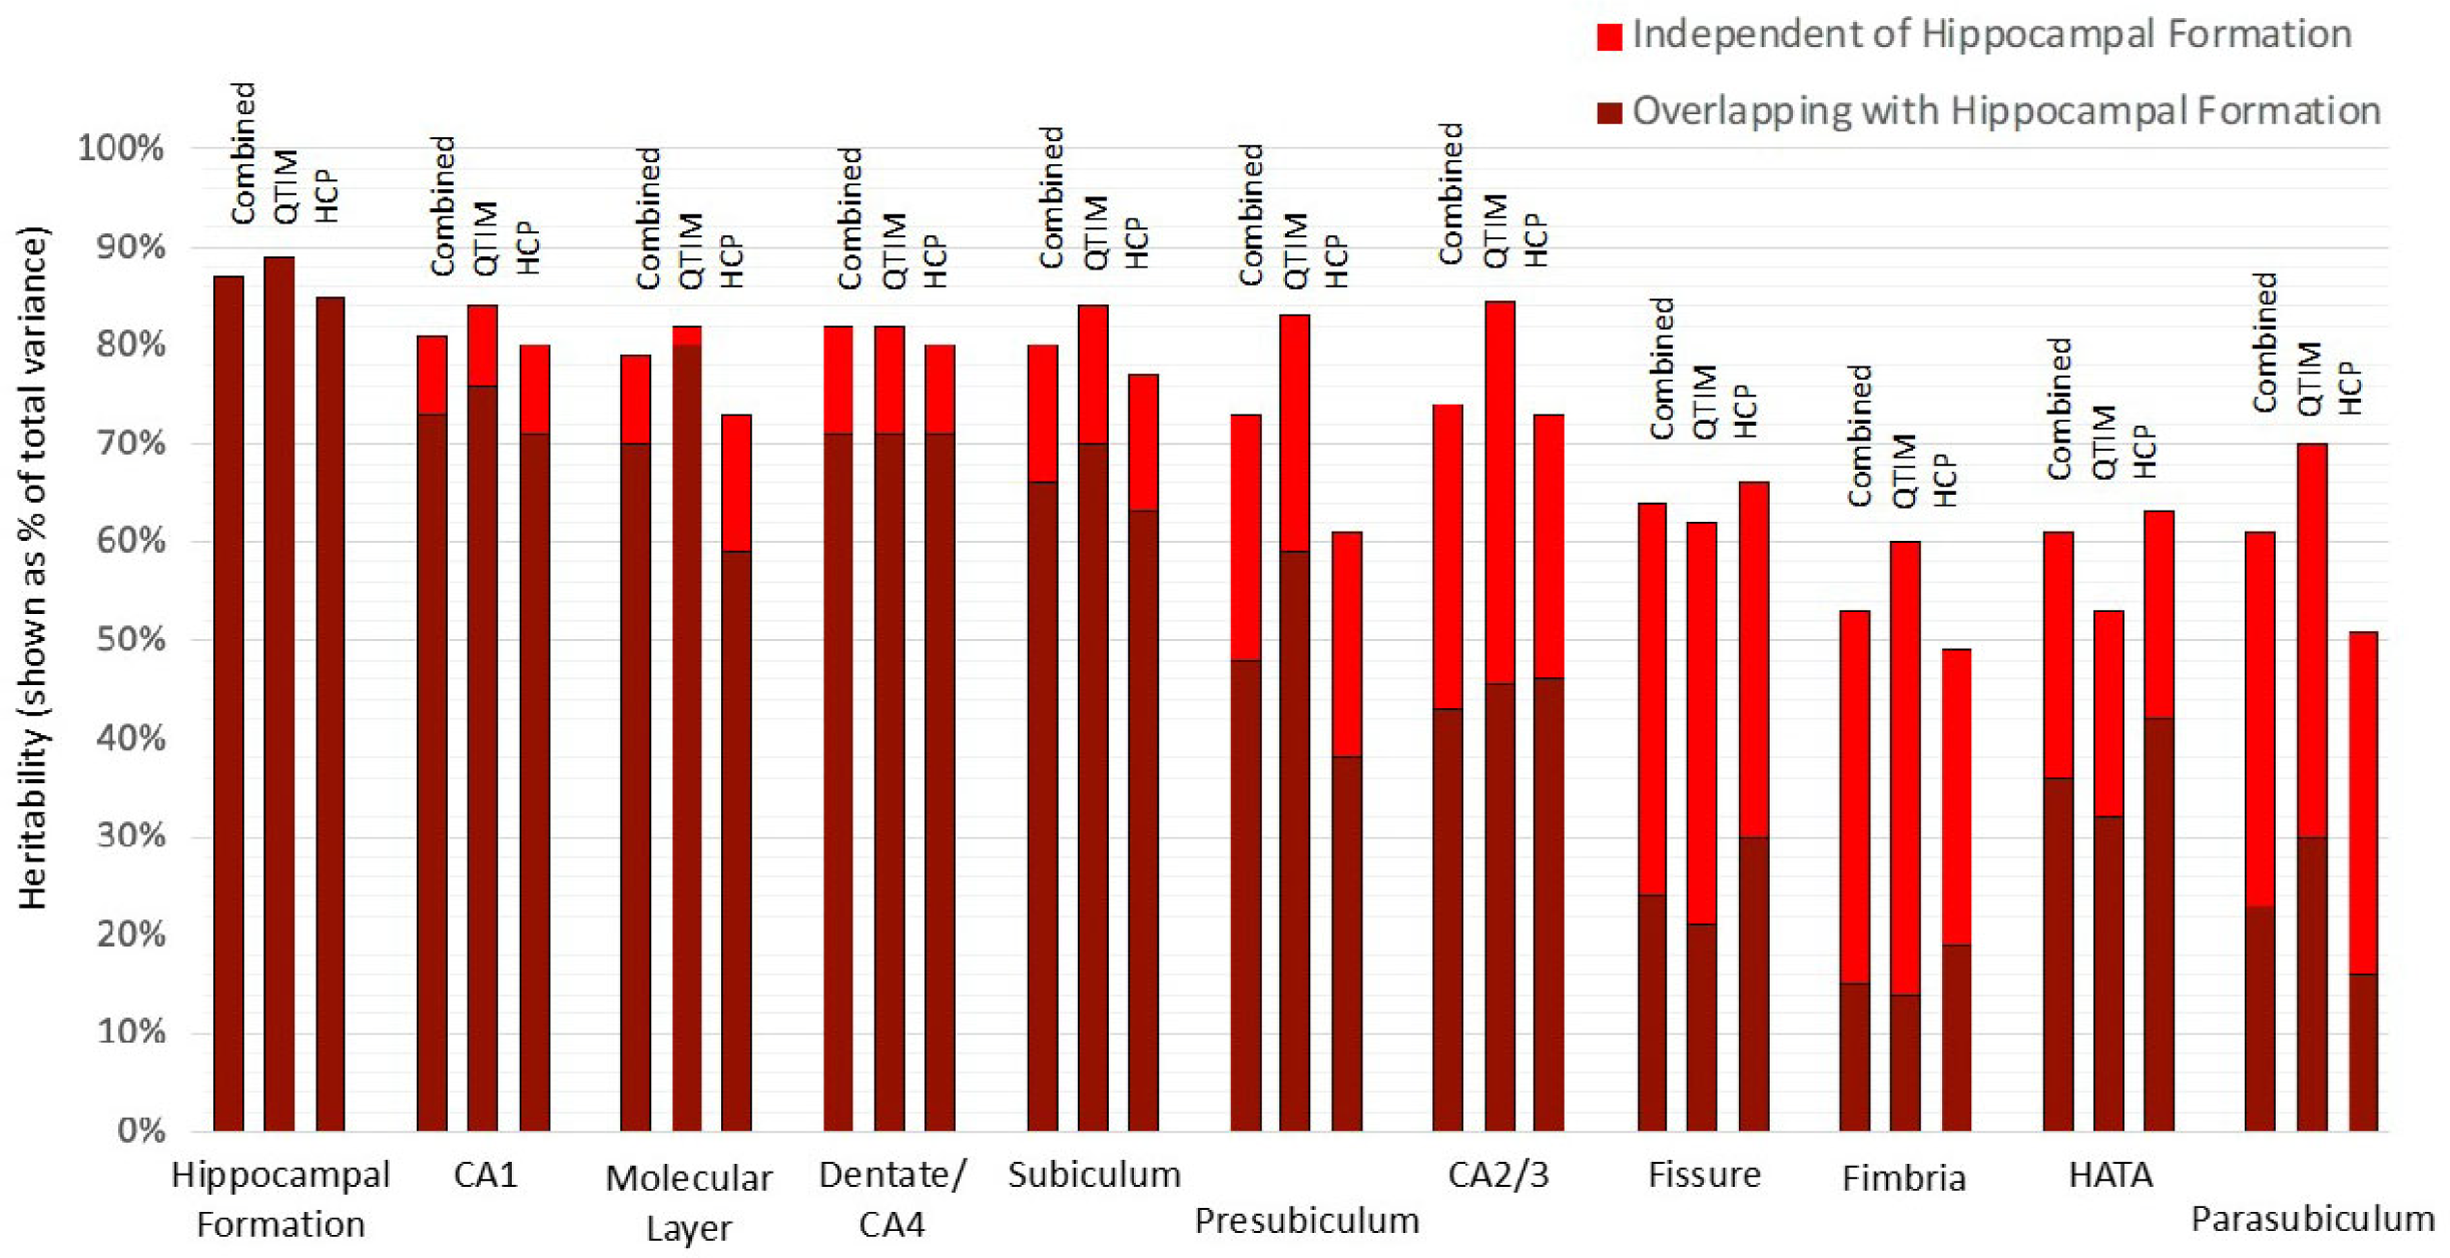
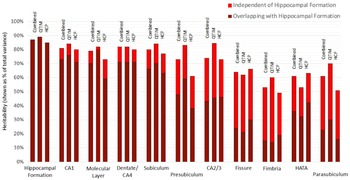
Using a bivariate Cholesky approach, genetic and environmental influences specific to each subfield volume (relative to the hippocampal formation) were estimated in addition to total genetic influence. For each subfield volume, genetic influence independent of that influencing hippocampal formation volume was identified, accounting for 10 to 72% of total genetic variance in the combined sample (Figure 2, Supplementary Table S3). The largest subfields (CA1, molecular layer, dentate gyrus/CA4 and subiculum) show the least genetic specificity, although subfield-specific influences still account for 10−18% of total genetic variance in the combined sample. Genetics sources independent of the hippocampal formation have a moderate influence on variance for presubiculum (accounting for 35% of total genetic variance), HATA (41%) and CA2/3 (42%) and a large influence on fimbria (accounting for 72% of total genetic variance), fissure (63%) and parasubiculum (62%).
Genetic specificity of hippocampal subfield volumes in relation to the hippocampus as a single volume. Results are shown for the combined QTIM/HCP sample, as well as for each cohort. Additive genetic influence is derived from bivariate Cholesky decomposition (hippocampal formation with each hippocampal subfield volume) and is shown as a percentage of total variance. Subfield influences are split into sources independent of the hippocampal formation (light red) and sources overlapping with the hippocampal formation (dark red). 95% confidence intervals for QTIM and HCP overlap for all estimates of total genetic variance and estimates of specific genetic variance with the exception of molecular layer, which shows greater genetic specificity in HCP than QTIM (Supplementary Table S3). Subfields are ordered from largest (CA1) to smallest (parasubiculum). A, C, and E estimates obtained from multivariate analyses of all volumes can be found in Supplementary Table S7 and Figure S1)
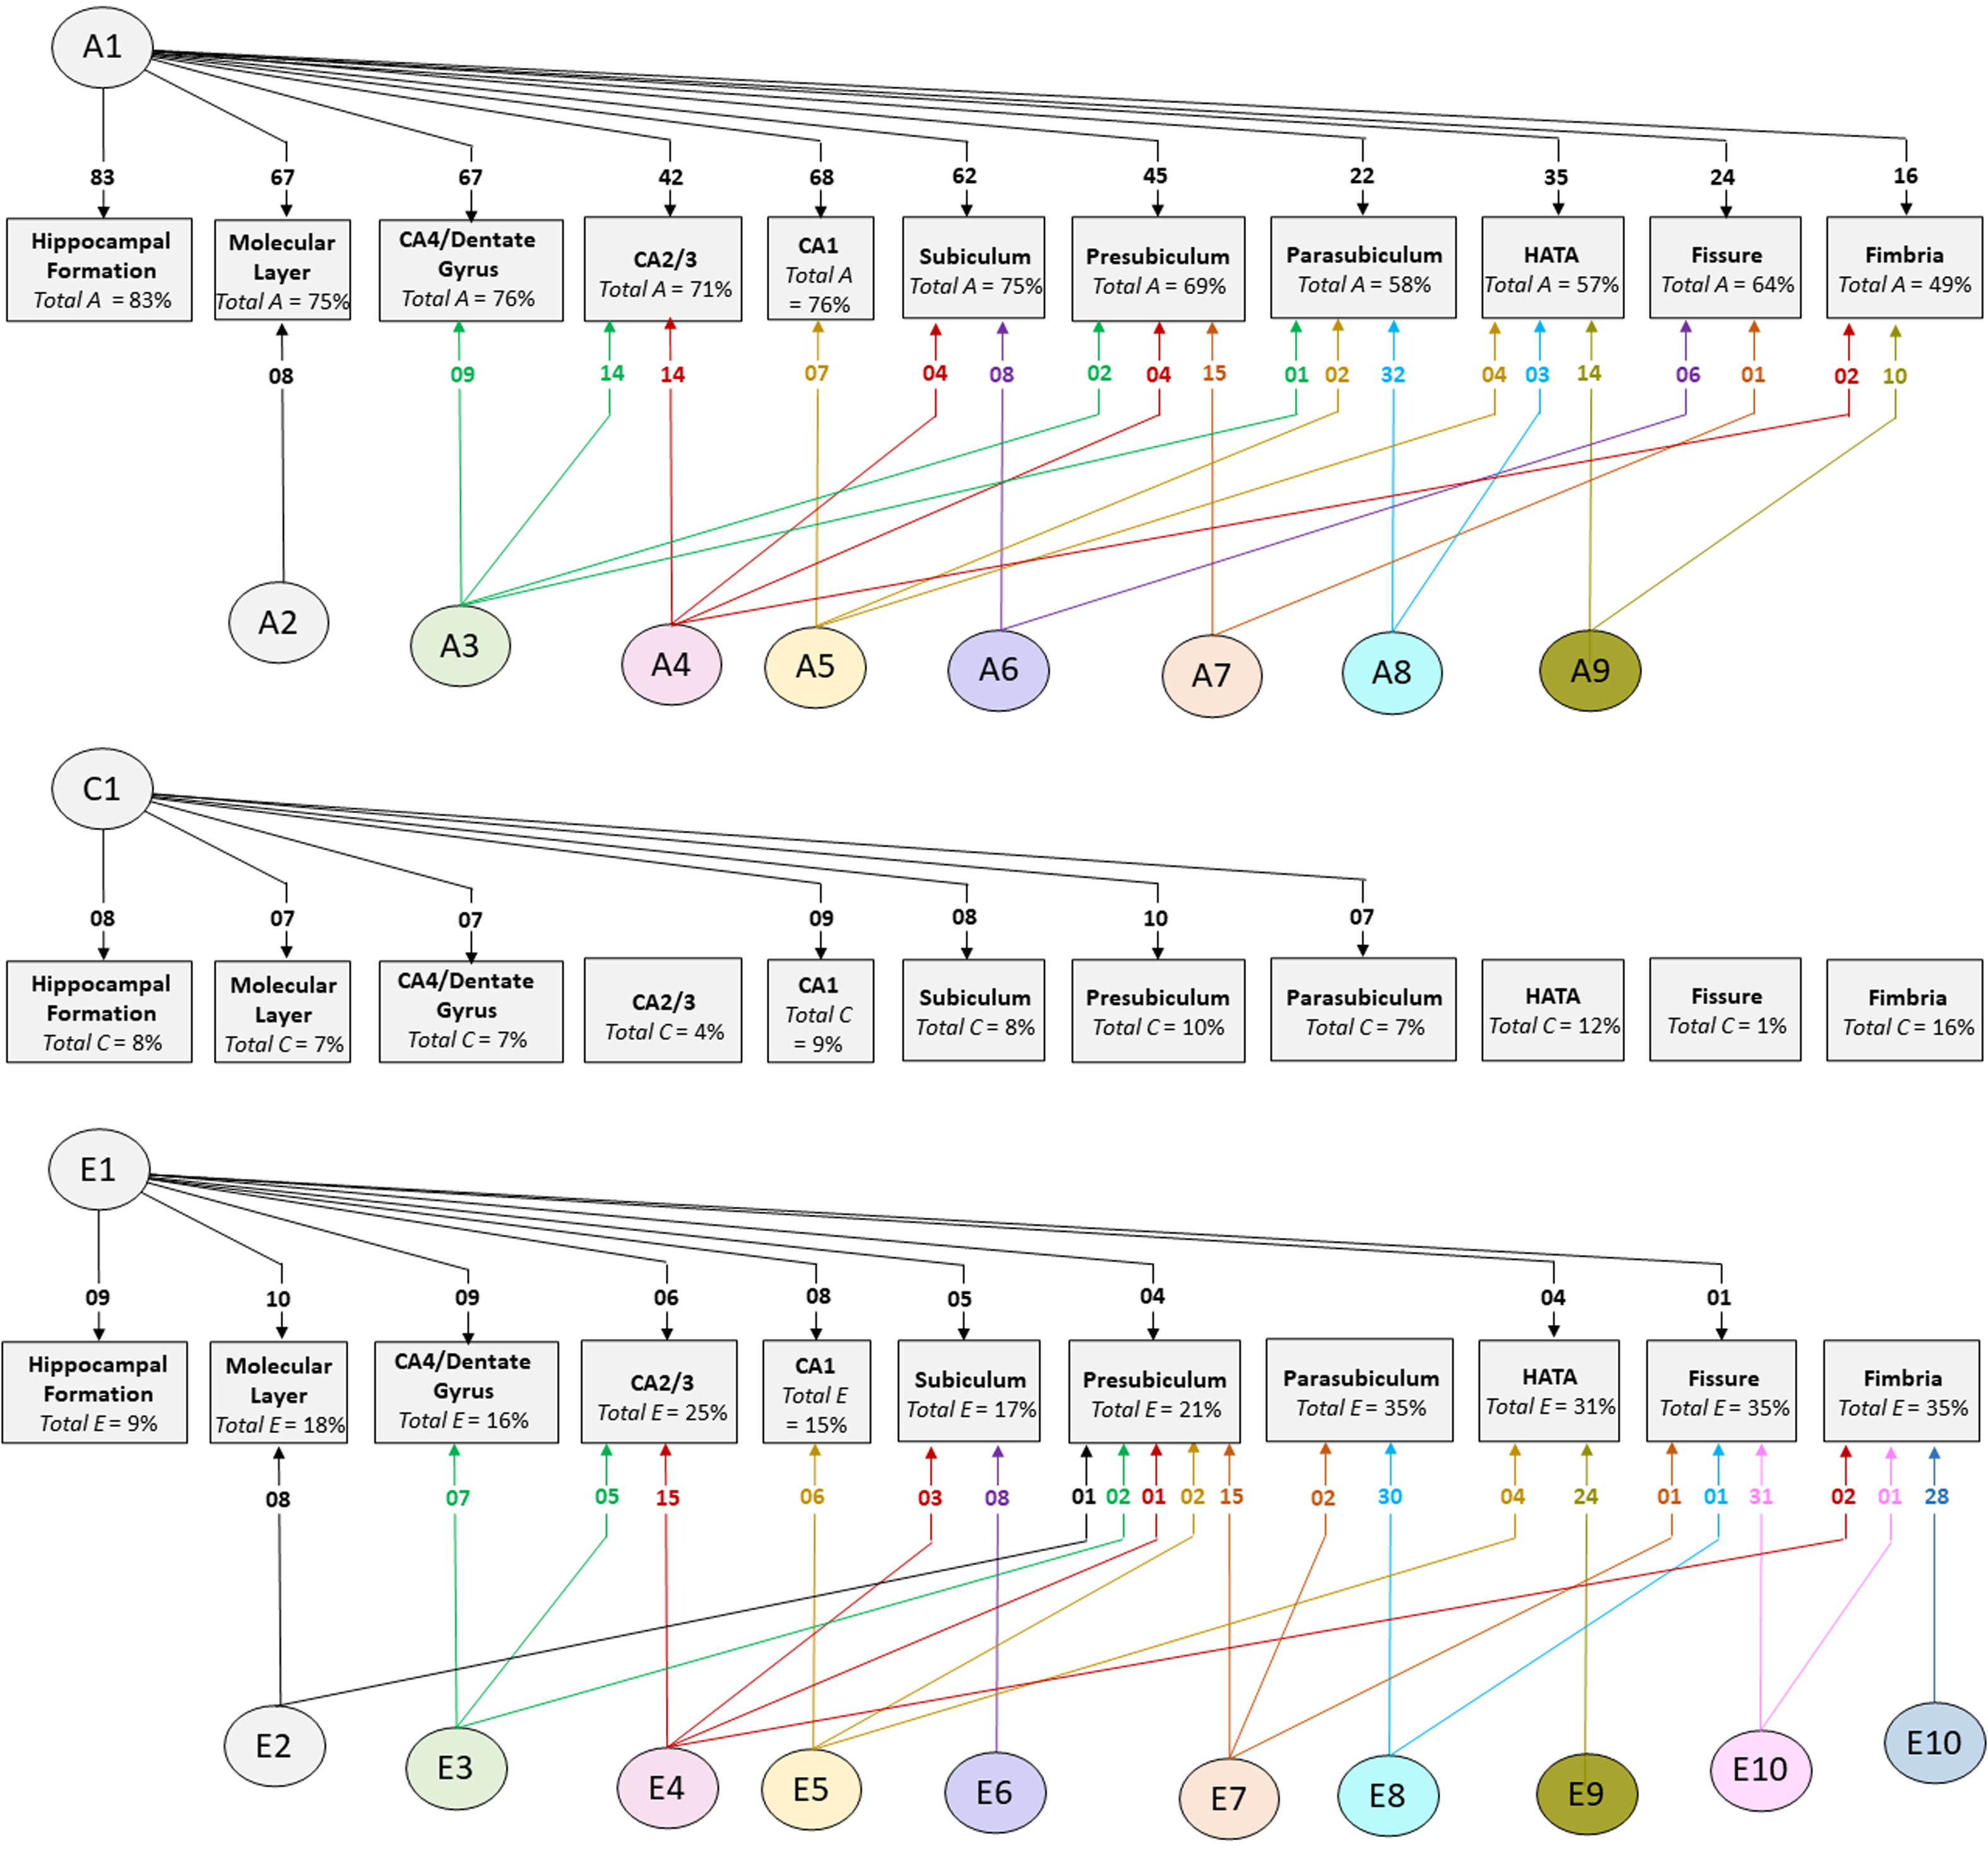
Multivariate Analyses of Hippocampal Formation and 10 Subfield Volumes
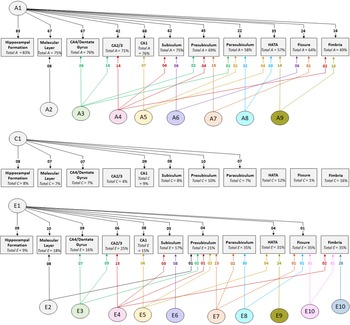
Cholesky decomposition (Figure 3) indicates multiple sources of additive genetic (A) and unique environment (E) influence on hippocampal subfield volumes that are independent of the hippocampal formation and is suggestive of specific influences (e.g. molecular layer (A2), presubiculum (A7)) as well as overlapping influences (e.g. CA4/dentate gyrus and CA2/3 (A3); HATA and fimbria (A9); see also Supplementary Table S4). In Cholesky decomposition, each factor accounts for variance that is independent of previous factors (e.g. A2 is independent of A1 and A3 is independent of A2). Thus, factors A2 to A9 and factors E2 to E10 account for additive genetic and unique environmental variance respectively that is independent of the hippocampal formation. Similarly, factors A6 to A8 (and E6 to E8) represent influences on subicular complex volumes that are independent of those on the hippocampal formation, molecular layer, dentate gyrus and cornu ammonis volumes, and so on. Note that, while not significant, factors A10 and A11 (see Supplementary Table S4) account for a substantial proportion of total genetic variance for fissure and fimbria (32/64 = 50% and 17/49 = 35%, respectively) and the significance of total genetic variance is established. The nonsignificance of these estimates likely reflects a lack of power to detect the significance of tail-end estimates, given the large number of variables included in the multivariate analyses.
Path diagrams of additive genetic (A), common environment (C) and unique environment (E) influences derived from multivariate Cholesky decomposition. Parameter estimates indicate percent of total variance accounted for. Significant estimates accounting for ≥1% of total variance are shown for the combined QTIM/HCP sample (see Supplementary Tables S4, S5, S6 for all estimates with 95% confidence intervals). Factors A1, C1, and E1 are sources that influence both the hippocampal formation and subfield volumes. All remaining factors (A2−A9, E2−E10) are independent of those influencing the hippocampal formation
The large multivariate analysis has greater power to detect common environmental influences compared to bivariate analysis, although the confidence intervals remain broad (see estimates in Supplementary Table S7). In the combined sample, significant estimates of total common environmental influence were found for fimbria (accounting for 16% of total variance), HATA (12%), presubiculum (10%), CA1 (9%), hippocampal formation (8%), subiculum (8%), molecular layer (7%), CA4/dentate gyrus (7%) and parasubiculum (7%). In the independent cohorts, significant common environmental estimates were identified in both QTIM and HCP for molecular layer and CA4/dentate gyrus, as well as for the hippocampal formation. No significant common environmental influences independent of hippocampal formation were identified (Supplementary Table S5).
All results are shown separately for the QTIM and HCP cohorts in supplementary material. There is considerable consistency between the cohorts. Phenotypic, genetic and environmental correlations, derived from multivariate Cholesky decomposition, are shown for the combined sample, as well as QTIM and HCP cohorts, in Supplementary Tables S8 and S9. In general, associations are stronger between subfields in the QTIM sample compared to the HCP sample. These differences may reflect the higher quality of HCP scans and the possible ability to capture more morphological differences between subfield structures (i.e. greater distinctiveness).
To enable comparison to SNP heritability as reported in van der Meer et al. (Reference van der Meer, Rokicki, Kaufmann, Cordova-Palomera, Moberget, Alnaes, Bettella, Frei, Doan, Sønderby, Smeland, Agartz, Bertolino, Bralten, Brandt, Buitelaar, Djurovic, van Donkelaar, Dørum and Westlye2020), analyses were also run using residuals after regressing out the effects of hippocampal formation volume on subfield volume. On average, SNP heritability accounted for 38% of the heritability identified using twin modeling (Supplementary Table S10).
Discussion
The hippocampus is composed of subfields that are strongly interconnected and work as an integrated whole in the performance of cognitive and other tasks (Bartsch & Wulff, Reference Bartsch and Wulff2015; Gyorfi et al., Reference Gyorfi, Nagy, Bokor and Keri2018; Knierim, Reference Knierim2015). However, the hippocampus is not a homogeneous structure. Rather, the subfields are histologically and functionally specialized and are differentially implicated in cognitive and other processes, including aging and disease (Adler et al., Reference Adler, Pluta, Kadivar, Craige, Gee, Avants and Yushkevich2014; Maruszak & Thuret, Reference Maruszak and Thuret2014). From a genetic perspective, it is known that genes have a moderate to strong influence on individual volume variation, both for the hippocampus as a whole and for the subfields (Greenspan et al., Reference Greenspan, Arakelian and van Erp2016; Patel et al., Reference Patel, Park, Devenyi, Patel, Masellis, Knight and Chakravarty2017; Whelan et al., Reference Whelan, Hibar, van Velzen, Zannas, Carrillo-Roa, McMahon, Prasad, Kelly, Faskowitz, deZubiracay, Iglesias, van Erp, Frodl, Martin, Wright, Jahanshad, Schmaal, Sämann and Thompson2016), and that there is considerable genetic covariation (Elman et al., Reference Elman, Panizzon, Gillespie, Hagler, Fennema-Notestine, Eyler, McEvoy, Neale, Lyons, Franz, Dale and Kremen2019). However, the level of genetic distinctiveness for each subfield, in relation to the whole hippocampal formation, is less clear — particularly for the smaller subfield volumes. Here, in the largest twin study of hippocampal subfield volume to date, we show that each subfield has some level of genetic distinctiveness in relation to the hippocampal formation, while the smaller volumes have substantial genetic independence.
The most genetically distinct subfield volumes are the fimbria (with 72% of genetic variance being independent of the hippocampal formation), hippocampal fissure (63%) and parasubiculum (62%). This is consistent with findings of specificity in relation to SNP-derived genetic correlations, as reported by van der Meer et al. (Reference van der Meer, Rokicki, Kaufmann, Cordova-Palomera, Moberget, Alnaes, Bettella, Frei, Doan, Sønderby, Smeland, Agartz, Bertolino, Bralten, Brandt, Buitelaar, Djurovic, van Donkelaar, Dørum and Westlye2020), which showed that these three regions clustered in isolation from the other subfields. Reasons for this may include cytoarchitectural differences, as well as functional specificities. The fimbria, which lies primarily on the dorsal surface of the hippocampus, was the only white matter volume examined, while the hippocampal fissure is also somewhat unique, being a vestigial space, or furrow, between the molecular layer and the dentate gyrus (Iglesias et al., Reference Iglesias, Augustinack, Nguyen, Player, Player, Wright, Roy, Frosch, McKee, Wald, Fischl and van Leemput2015). The parasubiculum, a small gray matter volume lying on the lower bank of the fissure, is a continuation of the presubiculum. However, while there are similarities, the parasubiculum has a more complex laminar organization than the presubiculum (Insausti et al., Reference Insausti, Munoz-Lopez, Insausti and Artacho-Perula2017). The presubiculum, HATA and CA2/3 are moderately distinct, with 35%–42% of genetic variance being independent of hippocampal formation. In contrast, the largest volumes (CA1, CA4/dentate gyrus and molecular layer) are less genetically distinct, with 82%–90% of genetic variance overlapping with hippocampal formation — consistent with findings reported for male twin veterans aged 56 to 66 years (the VETSA cohort; Elman et al., Reference Elman, Panizzon, Gillespie, Hagler, Fennema-Notestine, Eyler, McEvoy, Neale, Lyons, Franz, Dale and Kremen2019). The molecular layer, in part, forms between the cornu ammonis regions and the dentate gyrus (Iglesias et al., Reference Iglesias, Augustinack, Nguyen, Player, Player, Wright, Roy, Frosch, McKee, Wald, Fischl and van Leemput2015). The reduced distinctiveness of these subfields is also apparent in SNP-based analyses, which show strong genetic clustering among these regions (van der Meer et al., Reference van der Meer, Rokicki, Kaufmann, Cordova-Palomera, Moberget, Alnaes, Bettella, Frei, Doan, Sønderby, Smeland, Agartz, Bertolino, Bralten, Brandt, Buitelaar, Djurovic, van Donkelaar, Dørum and Westlye2020). Note that CA4 and the GCDG are segmented as separate volumes in FreeSurfer (Iglesias et al., Reference Iglesias, Augustinack, Nguyen, Player, Player, Wright, Roy, Frosch, McKee, Wald, Fischl and van Leemput2015). However, we were unable to distinguish between them either phenotypically or genetically, so we examined them as a single combined volume.
With their specialized cytoarchitecture and functions, each of the hippocampal subfields is of specific interest. Of the most genetically distinct subfield volumes, the fimbria is a major white matter tract of the limbic system, which mediates memory, behavior and emotion (Mori & Aggarwal, Reference Mori and Aggarwal2014). A recent study of progression to dementia in idiopathic Parkinson’s disease found that executive dysfunction observed in this condition may be the result of fimbria atrophy (Low et al., Reference Low, Foo, Yong, Tan and Kandiah2019). In addition, Low et al. (Reference Low, Foo, Yong, Tan and Kandiah2019) found presubiculum and parasubiculum volumes to be associated with cognitive decline and predictive of conversion to dementia in Parkinson’s disease. They posited that atrophy of the parasubiculum may disrupt early processing of incoming information to the hippocampus (see van Groen and Wyss, Reference van Groen and Wyss1990, for presubiculum and parasubiculum connections in the rat).
The hippocampal fissure may be of interest as an indicator of abnormal development (Kier et al., Reference Kier, Kim, Fulbright and Bronen1997). During fetal development, there is an infolding of the components of the hippocampus around the hippocampal fissure, ending with contact and fusion between the external surfaces of the dentate gyrus and subiculum and with the fissure (or sulcus) being reduced to a shallow indentation (Humphrey, Reference Humphrey1967; Kier et al., Reference Kier, Kim, Fulbright and Bronen1997). However, incomplete folding can occur, resulting in a prominent hippocampal fissure (i.e. larger fissure volume; Allebone et al., Reference Allebone, Kanaan, Maller, O’Brien, Mullen, Cook, Adams, Vogrin, Vaughan, Connelly, Kwan, Berkovic, D’Souza, Jackson, Velakoulis and Wilson2020; Kier et al., Reference Kier, Kim, Fulbright and Bronen1997). A recent study using data from the Alzheimer’s Disease Neuroimaging Initiative (ADNI; N = 1350) found that after correcting for total hippocampal volume, hippocampal fissure was the only hippocampal subfield volume significantly associated with conversion from mild cognitive impairment to Alzheimer’s disease (Izzo et al., Reference Izzo, Andreassen, Westlye and van der Meer2020). In addition, an enlarged hippocampal fissure has been linked, albeit in small studies, to psychosis of epilepsy (Allebone et al., Reference Allebone, Kanaan, Maller, O’Brien, Mullen, Cook, Adams, Vogrin, Vaughan, Connelly, Kwan, Berkovic, D’Souza, Jackson, Velakoulis and Wilson2020), and first-episode schizophrenia, where it was associated with poor educational achievement and anxiety depression symptoms during onset of illness (G. N. Smith et al., Reference Smith, Lang, Kopala, Lapointe, Falkai and Honer2003).
Of the moderately genetically distinct hippocampal subfields, CA2/3 volume may be particularly sensitive to alcoholism (Kuhn et al., Reference Kuhn, Charlet, Schubert, Kiefer, Zimmermann, Heinz and Gallinat2014; Zahr et al., Reference Zahr, Pohl, Saranathan, Sullivan and Pfefferbaum2019) and has been implicated in Parkinson’s disease, where it has been shown to be selectively decreased in nonmedicated Parkinson’s patients and subsequently normalized by a period of L-DOPA treatment (Gyorfi et al., Reference Gyorfi, Nagy, Bokor, Moustafa, Rosenzweig, Kelemen and Keri2017). Contextual fear memory mechanisms are now believed to be consolidated and maintained by both the amygdala and hippocampus (see review by Chaaya et al., Reference Chaaya, Battle and Johnson2018), and consistent with this, although study size remains small, the hippocampal-amygdala transition area (HATA) volume has been linked to severity of posttraumatic stress disorder (PTSD; Ahmed-Leitao et al., Reference Ahmed-Leitao, Rosenstein, Marx, Young, Korte and Seedat2019; Averill et al., Reference Averill, Satodiya, Scott, Wrocklage, Schweinsburg, Averill, Akiki, Amoroso, Southwick, Krystal and Abdallah2017). Further, a recent genomewide association study of two small samples of trauma-exposed individuals enriched for PTSD found a genetic variant associated with HATA volume (although it did not interact with PTSD or trauma), that was replicated across the samples (Morey et al., Reference Morey, Garrett, Stevens, Clarke, Haswell, van Rooij, Fani, Lori, Mirecc Workgroup, Kimbrel, Dennis, Marx, Beckham, McCarthy, Hauser and Ashley-Koch2020). Regarding the presubiculum, a recent study of memory performance in clinically normal older individuals concluded that ‘the presubiculum captures unique AD-related biological variation that is not reflected in total hippocampal volume’ (Jacobs et al., Reference Jacobs, Augustinack, Schultz, Hanseeuw, Locascio, Amariglio, Papp, Rentz, Sperling and Johnson2020, p. 1916).
Our multivariate analysis identified a genetic factor that influenced the hippocampal formation as well as all subfields to varying degrees, thus reflecting hippocampus general influences on volume. In addition to the hippocampal formation, these general influences are most strongly evident for the CA1, molecular layer, CA4/dentate gyrus and subiculum. Influences are moderate for presubiculum, CA2/3 and HATA, with smallest influences being on fissure, parasubiculum and fimbria. Importantly, multiple independent factors of genetic influence were identified, with notable influences on subsets of subfields (e.g. CA4/dentate gyrus and CA2/3; HATA and fimbria). The pattern of unique environmental influence is similar to that of the additive genetic factors, but generally less influential. A single common environmental factor was found to account for 7%–10% of total variance in six of the ten subfield volumes, as well as the hippocampal formation.
A search of the literature provides some clues regarding processes (for which genes and environment contribute to variation) that may differentially influence volume in subsets of hippocampal subfields. For example, studies show that brain developmental is influenced by both genes and environment (Gao et al., Reference Gao, Grewen, Knickmeyer, Qiu, Salzwedel, Lin and Gilmore2018), and differential development is indicated for the hippocampal subfields. Primate studies show that the dentate gyrus and CA3 are linked in their pattern of early postnatal development (i.e. a protracted period of maturation), with developmental increases in CA3 volume generally paralleling that of the dentate gyrus (Lavenex & Banta Lavenex, Reference Lavenex and Banta Lavenex2013).
Both genes and environment play a role in regulating stress responses and influence hippocampal volume (e.g. Everaerd et al., Reference Everaerd, Gerritsen, Rijpkema, Frodl, van Oostrom, Franke, Fernández and Tendolkar2012; Gerritsen et al., Reference Gerritsen, Milaneschi, Vinkers, van Hemert, van Velzen, Schmaal and Penninx2017; Grabe et al., Reference Grabe, Wittfeld, van der Auwera, Janowitz, Hegenscheid, Habes, Homuth, Barnow, John, Nauck, Völzke, Meyer zu Schwabedissen, Freyberger and Hosten2016; Lee et al., Reference Lee, Yoo, Kim, Kim, Park, Choi, Teicher and Jeong2018; Nees et al., Reference Nees, Witt and Flor2018), and there are indications that the hippocampal subfields may have different sensitivities to stress (e.g. Averill et al., Reference Averill, Satodiya, Scott, Wrocklage, Schweinsburg, Averill, Akiki, Amoroso, Southwick, Krystal and Abdallah2017; Slaminen et al., Reference Slaminen, Samann, Zheng, Dennis, Clarke-Rubright, Jahanshad, Iglesias, Whelan, Bruce, Hayes, Seedat, Averill, Baugh, Bomyea, Bright, Buckle, Choi, Davenport, Davidson and Logue2019). This may potentially underlie, or contribute to, associations between HATA (gray matter) and fimbria (the only white matter volume examined). For example, posttraumatic stress disorder (PTSD) symptom severity in combat-exposed and control veterans has been found to negatively correlate with HATA, but not other subfield volumes (Averill et al., Reference Averill, Satodiya, Scott, Wrocklage, Schweinsburg, Averill, Akiki, Amoroso, Southwick, Krystal and Abdallah2017). Further, studies indicate that PTSD may influence white matter structure, with indications of generalized atrophy of white matter volumes (Villarreal et al., Reference Villarreal, Hamilton, Petropoulos, Driscoll, Rowland, Griego, Kodituwakku, Hart, Escalona and Brooks2002), and more recently of reduced fractional anisotropy measured with diffusion tensor imaging (Siehl et al., Reference Siehl, King, Burgess, Flor and Nees2018). Thus, stress-related genetic vulnerability and exposure to stressful environments could potentially have subfield-specific flow-on effects that may preferentially influence the volume of HATA and fimbria.
Subfield heritabilities (i.e. the proportion of subfield variation explained by genetic sources (Visscher et al., Reference Visscher, Hill and Wray2008)) identified in the present study are largely consistent with previous reports despite differences in sample size and statistical approaches (Elman et al., Reference Elman, Panizzon, Gillespie, Hagler, Fennema-Notestine, Eyler, McEvoy, Neale, Lyons, Franz, Dale and Kremen2019; Greenspan et al., Reference Greenspan, Arakelian and van Erp2016; Patel et al., Reference Patel, Park, Devenyi, Patel, Masellis, Knight and Chakravarty2017; Whelan et al., Reference Whelan, Hibar, van Velzen, Zannas, Carrillo-Roa, McMahon, Prasad, Kelly, Faskowitz, deZubiracay, Iglesias, van Erp, Frodl, Martin, Wright, Jahanshad, Schmaal, Sämann and Thompson2016). Larger sample sizes are examined in the current analyses of hippocampal subfields than have previously been examined for either QTIM (Whelan et al., Reference Whelan, Hibar, van Velzen, Zannas, Carrillo-Roa, McMahon, Prasad, Kelly, Faskowitz, deZubiracay, Iglesias, van Erp, Frodl, Martin, Wright, Jahanshad, Schmaal, Sämann and Thompson2016) or HCP (Elman et al., Reference Elman, Panizzon, Gillespie, Hagler, Fennema-Notestine, Eyler, McEvoy, Neale, Lyons, Franz, Dale and Kremen2019; Greenspan et al., Reference Greenspan, Arakelian and van Erp2016; Patel et al., Reference Patel, Park, Devenyi, Patel, Masellis, Knight and Chakravarty2017). Further, by combining data from these two young adult cohorts, sample size has been substantially increased. SNP heritability, as reported in van der Meer et al. (Reference van der Meer, Rokicki, Kaufmann, Cordova-Palomera, Moberget, Alnaes, Bettella, Frei, Doan, Sønderby, Smeland, Agartz, Bertolino, Bralten, Brandt, Buitelaar, Djurovic, van Donkelaar, Dørum and Westlye2020), was found to account for 38%, on average, of the twin/sibling-based heritability identified in the combined QTIM/HCP sample, similar to findings reported for a number of other traits including schizophrenia and bipolar disorder (Pettersson et al., Reference Pettersson, Lichtenstein, Larsson, Song, Agrawal, Børglum, Bulik, Daly, Davis, Demontis, Edenberg, Grove and Polderman2018).
While our bivariate analyses show little indication of common environmental influence on the subfields (only significant for fimbria in the combined analyses), multivariate analysis has the benefit of increased statistical power to detect effects that are correlated across measures (Schmitz et al., Reference Schmitz, Cherny and Fulker1998). The identification of common (i.e. familial) environmental influence allows a more accurate estimation of heritability (i.e. common environmental influences inflate heritability if not accounted for; Vinkhuyzen et al., Reference Vinkhuyzen, Wray, Yang, Goddard and Visscher2013); although conversely, should common environmental influences be false positives, heritability will be underestimated. Here, in the combined sample, we identify significant common environmental influence for fimbria (accounting for 16% of total variance), HATA (12%), presubiculum (10%), CA1 (9%), hippocampal formation (8%), subiculum (8%), molecular layer (7%), CA4/dentate gyrus (7%) and parasubiculum (7%). Significant estimates were found independently in the QTIM and HCP cohorts for molecular layer and CA4/dentate gyrus, as well as for the hippocampal formation. One possible source of common environmental influence could be parental caregiving. There is a growing literature linking parental behavior and brain development, including associations with hippocampal volume (Tan et al., Reference Tan, Oppenheimer, Ladouceur, Butterfield and Silk2020; Wang et al., Reference Wang, Song, Li, Zhang and Liu2017). Nonetheless, studies are few and the impact of normative range parenting on brain development remains unclear (see review by Farber et al., Reference Farber, Gee and Hariri2020). Other sources of environmental influence that have been linked to hippocampal volume and that may be common to young adult co-twins include socioeconomic status, physical fitness and alcohol consumption (McLachlan et al., Reference McLachlan, Zhou, Little, Rasmussen, Pei, Andrew, Reynolds and Beaulieu2020; Phillips et al., Reference Phillips, De Bellis, Brumback, Clausen, Clarke-Rubright, Haswell and Morey2021; Stillman et al., Reference Stillman, Uyar, Huang, Grove, Watt, Wollam and Erickson2018).
This study has a number of limitations. For QTIM, hippocampal volumes are generated from T1w images, which may be insufficient for visualizing the internal structure of some hippocampal subfields (Wisse et al., Reference Wisse, Chetelat, Daugherty, de Flores, la Joie, Mueller, Stark, Wang, Yushkevich, Berron, Raz, Bakker, Olsen and Carr2021). Similarly, the manner and extent to which extra modality whole-brain scans (e.g. T2w) contribute to FreeSurfer subfield segmentations are unclear (Bussy et al., Reference Bussy, Plitman, Patel, Tullo, Salaciak, Bedford, Farzin, Béland, Valiquette, Kazazian, Tardif, Devenyi and Chakravarty2021). Further, all segmentation methods have their strengths and weaknesses. For both cohorts, hippocampal subfields were segmented using FreeSurfer 6.0 software, for which the atlas was built from manual delineations in elderly subjects (Iglesias et al., Reference Iglesias, Augustinack, Nguyen, Player, Player, Wright, Roy, Frosch, McKee, Wald, Fischl and van Leemput2015). This may decrease its applicability regarding young adult populations. In addition, as patterns of influence may vary across the lifespan, those identified in our young adult sample may not reflect patterns of influence at other ages (e.g. Kanherkar et al., Reference Kanherkar, Bhatia-Dey and Csoka2014; Skene et al., Reference Skene, Roy and Grant2018). Further, sex is known to modify normal brain development (e.g. Li et al., Reference Li, van Tol, Li, Miao, Jiao, Heinze, Bogerts, He and Walter2014; Marrocco & McEwen, Reference Marrocco and McEwen2016; McEwen & Milner, Reference McEwen and Milner2017; Mu et al., Reference Mu, Yuan and Tan2020; Singh et al., Reference Singh, Singh and Schneider2018) and may impact relationships between the hippocampal subfields. Here we correct for sex effects to maximize power. Also, we chose to retain the full ACE Cholesky decomposition rather than drop nonsignificant estimates, as attempts to find a more parsimonious model may lead to oversimplification rather than a simpler and more accurate representation of sources of influence (Sullivan & Eaves, Reference Sullivan and Eaves2002). Thus, nonsignificant estimates of common environmental influence were retained. This reduces the possibility of inflating heritability estimates (Vinkhuyzen et al., Reference Vinkhuyzen, Wray, Yang, Goddard and Visscher2013), although conversely, it may lead to underestimation of heritability. Further, the confidence intervals for significant estimates of common environmental influence were broad, with lower bounds generally close to zero, and these results should be interpreted with caution.
In summary, results show considerable overlap in the genetic and environmental sources influencing hippocampal subfield volumes. However, each subfield volume is also influenced by a genetic source that is independent of sources influencing the hippocampal formation; further, there are genetic sources that are specific to subsets of subfields. These findings are limited to a young adult population, but they show considerable consistency for independent populations in Australia (Blokland et al., Reference Blokland, Wallace, Hansell, Thompson, Hickie, Montgomery, Martin, McMahon, de Zubicaray and Wright2017; de Zubicaray et al., Reference de Zubicaray, Chiang, McMahon, Shattuck, Toga, Martin, Wright and Thompson2008) and in the USA (van Essen et al., Reference van Essen, Ugurbil, Auerbach, Barch, Behrens, Bucholz, Chang, Chen, Corbetta, Curtiss, Della Penna, Feinberg, Glasser, Harel, Heath, Larson-Prior, Marcus, Michalareas and Moeller2012). They are consistent with our understanding of hippocampal subfield structure and function, whereby the subfields have differing roles that interact to collectively enable specific processes, such as episodic memory (Das et al., Reference Das, Hwang and Poston2019). Results provide further support for the study of genetic and environmental influences on subregion volumes of the hippocampus, in addition to studying the hippocampus as a single volume. Further, they show consistency with SNP-based analyses (van der Meer et al., Reference van der Meer, Rokicki, Kaufmann, Cordova-Palomera, Moberget, Alnaes, Bettella, Frei, Doan, Sønderby, Smeland, Agartz, Bertolino, Bralten, Brandt, Buitelaar, Djurovic, van Donkelaar, Dørum and Westlye2020) and with work showing hippocampal subfield heterogeneity in information processing and in associations with disease and aging (Das et al., Reference Das, Hwang and Poston2019; de Flores et al., Reference de Flores, La Joie and Chetelat2015; Malykhin et al., Reference Malykhin, Huang, Hrybouski and Olsen2017).
Supplementary Material
To view supplementary material for this article, please visit https://doi.org/10.1017/thg.2022.20.
Acknowledgments
We thank our twin and sibling participants for taking part in the QTIM study. In addition, we thank Marlene Grace and Ann Eldridge for participant recruitment; Kerrie McAloney for study co-ordination; Kori Rmajoo, Aaron Quiggle, Natalie Garden, Matthew Meredith, Peter Hobden, Kate Borg, Aiman Al-Najjar and Anita Burns for data acquisition; David Butler and Daniel Park for IT support.
Author contributions
Conception & Design: NKH, MJW; Analyses: NKH; Acquisition and Data Processing: LTS, NKH; Manuscript: NKH; Critical Intellectual Interpretation and Revision: NKH, MJW, LTS, KLM, GIZ, PMT.
Financial support
QTIM was supported by the National Institute of Child Health and Human Development (RO1 HD050735) and the National Health and Medical Research Council (NHMRC 486682, 1009064), Australia. Lachlan Strike was supported by an Australian Government Research Training Program (RTP) scholarship. Data were provided in part by the Human Connectome Project, WU-Minn Consortium (Principal Investigators: David van Essen and Kamil Ugurbil; U54MH091657) funded by the 16 NIH Institutes and Centers that support the NIH Blueprint for Neuroscience Research; and by the McDonnell Center for Systems Neuroscience at Washington University.
Conflict of Interest
None.
Ethical standards
The Queensland Twin Imaging study was approved by the Human Research Committee at the QIMR Berghofer Medical Research Institute (Ref#P701), while the Human Connectome Project was approved by their respective institutional review board (IRB#201204036).


 Open access